
Abstract
Introduction
Continuous improvements in healthcare and better living conditions have resulted in more people living longer with multiple chronic diseases. When an individual has two or more chronic diseases, it is referred to as multimorbidity. 1 People with multimorbidity experience a disproportionally low quality of life, 2 a high treatment burden, 3 and increased mortality. 4
From a societal perspective, the large number of patients with multimorbidity represents a substantial challenge. The health care system is often organized around a single-disease framework, leading to increased admissions and hospital contacts as the number of diseases rises. 5 This increases the risk of disruptive and duplicate care. 6 To address these challenges for both patients and the health care sector, it is of general interest for clinicians, health planners, and decision makers to monitor multimorbidity within the population.
The prevalence of multimorbidity has been estimated in several studies, but the findings show considerable variability. 7 The large variability may partly be explained by the fact that studies have been conducted in different settings (for instance hospitals or general practices, urban or rural areas, and various countries). Another likely explanation for the variability is that studies often define multimorbidity differently, in terms of the number and types of diagnoses included in the definition. These differences in settings and definitions hamper comparison of prevalence across samples,8,9 making such comparisons usually not meaningful. 7
However, rather than prevalence, by which we here mean the absolute number of patients with multimorbidity in Denmark, and possibly contrast this to other, external populations, it is more meaningful to study the prevalence over time, internally to the population. Longitudinal studies indicate that the proportion of patients with multimorbidity has increased over time,10–12 as has the number of person-years lived with multimorbidity. 10 The increasing average age of the population is a key driver for the rise in prevalence, 13 but developments in healthcare and society may also contribute. 14 The growing number of people living with multimorbidity substantially impacts the capacity of the healthcare system. To understand and potentially predict future healthcare needs, it is of interest to monitor the prevalence of multimorbidity over time in the general population.
The present study set out to determine how the prevalence of multimorbidity developed over two decades in the entire Danish population, and which age groups and disease groups drove this development. This type of study is possible in Denmark because nationwide registers containing the entire population have been established for more than 50 years. As in our earlier works,4,15,16 we defined multimorbidity based on ten groups of diagnoses, rather than counting single diagnoses. Thus, a diagnosis from at least two of these ten groups was required to classify as multimorbidity. By grouping diagnoses that share similarities in management, treatment, and/or organization, and by counting affected groups, this definition identifies patients with a relatively severe and complex multimorbidity. 8 To our knowledge, no previous studies have explored the prevalence of multimorbidity over time in a full nationwide sample. The aim of the present study was to explore prevalence of multimorbidity among individuals aged 18 years or older in Denmark, using samples that include the entire population from 2000-2018.
Material and methods
Study design and population
The present cohort study included the entire Danish population aged 18 years and older. Data from Danish national registers17–20 were used to form eighteen cohorts: one for each calendar year from 2000 to 2018. For each cohort, chronic diagnoses were recorded for each person over the preceding ten years using diagnostic codes from hospital contacts. Each year, new individuals aged 18 entered the cohort, while others left due to emigration or death. Concurrently, socio-demographic data from Statistics Denmark were collected for each year and individual. Persons who lived outside Denmark for more than nine years during the ten-year period prior to the year of interest were excluded from the analyses of that particular year.
Multimorbidity definition
Multimorbidity was defined based on the following ten diagnosis groups: lung, musculoskeletal, endocrine, mental, cancer, neurological, gastrointestinal, cardiovascular, genitourinary, and sensory organs. 4 To meet the definition of multimorbidity, at least two chronic diagnoses from two different diagnosis groups had to be present. For example, two diagnoses from the same group, such as asthma and Chronic Obstructive Pulmonary Disease (COPD) from the lung group, would not count as multimorbidity according to this definition. Any registration of a contact, either as an inpatient or outpatient at hospitals (secondary care), with a relevant (primary or secondary) chronic diagnosis within a ten-year period before the corresponding cohort baseline, resulted in a positive count for the relevant diagnosis group. The various diagnoses within each diagnosis group broadly reflect a medical specialty and a hospital department (Supplemental File 1). Hence, this definition of multimorbidity somewhat reflects the organizational burden of multimorbidity in the secondary care. Still, it is also relevant for primary care (all care outside public hospitals, including private practicing specialists, physiotherapists, and psychologists), particularly general practice. It mirrors the growing complexity of the patients and highlights the challenges for general practitioners who must both treat and manage the patients’ various diseases while also navigating as gatekeepers for the hospitals. We have developed and applied this definition in several earlier studies.4,15,16
Nationwide registers
Baseline characteristics of the Danish population 2000, 2009, and 2018.

1st January 2000, 2009, and 2018.
Presented as dichotomous variables in numbers (N) and percentages (%).
1Secondary school: secondary school, high school, and higher-level vocational studies.
2Longer educations: college, university degree (bachelor or master), and doctoral degree.
3Household disposable income: divided in quartiles.
4Out of workforce: unemployed, student, apprentice or intern, or incapacity benefits.
5Assets: divided in tertiles.
6Rural: at least 50 % of the population in the municipality lives in a thinly populated area. Small town: intermediate density area. Less than 50 % of the population lives in a densely populated area and less than 50 % of the population lives in a thinly populated area. Capital: at least 50 % of the population lives in a densely populated area.
7Living together (does not include solely married persons).
Statistical analyses
We present absolute and relative numbers for each year, and each cohort was stratified by age (categorized into four groups 18-39, 40-64, 65-79, and ≥ 80 years) and sex. The results are displayed as (multi)morbidity time series as ≥2 and ≥4 diagnosis groups of multimorbidity. If a person migrated during the ten years before each baseline, they were included in the analyses for the time spent in Denmark, unless the migration exceeded 9 years. The yearly contributions to the increase in numbers of persons with multimorbidity each year of each of the three factors: age, degree of urbanization, and level of education, were visualized in growth contribution plots. We performed the analyses using SAS, version 9.4 (SAS Institute Inc., Cary, NC, USA) and the r software package, V.4.1.1. (The R Foundation for Statistical Computing, https://www.r-project.org).
Results
From 2000 to 2018, the Danish population increased from 5,330,020 to 5,781,190 persons (an increase of 7.8%). During the same period the study population grew from 4,154,728 to 4,551,502 (8.7%) (Table 1, Supplemental File 2). The number of people living with chronic disease also rose (Figure 1(a)-(b)). In absolute terms, the number of patients with musculoskeletal diagnoses increased the most: from 303,513 persons (7.3% of the total population) in 2000 to 726,397 persons (16.0%) in 2018, a 119% increase. Similarly, the prevalence of mental health diagnoses increased from 4.7% to 9.1% (a relative increase of 95%), and cardiovascular diagnoses increased from 5.4% to 9.0% (a relative increase of 67%). The prevalence of patients with other diagnoses also increased between 2000 and 2018, for instance, the genitourinary diagnosis-group (167%), the endocrine diagnosis-group (120%), the musculoskeletal group (119%), the mental health group (95%), and the gastrointestinal group (84%) (Figure 1(a)-(b)). For some diagnosis groups such as the sensory group, an increase in prevalence occurred until 2006, after which it leveled off. (a) The number of people in different diagnosis groups in the Danish population from 2000 to 2018. Absolute terms. (b) Prevalence of people in different diagnosis groups in the Danish population from 2000 to 2018. Percentage. (c) The number of people with multimorbidity from 2000 to 2018 in Denmark. (d) Prevalence of multimorbidity from 2000 to 2018 in Denmark.
The number of people with at least one morbidity (i.e. one or more diagnoses within one diagnosis group) was 26.2% in 2000 and 41.9% in 2018 (Figure 1(c)-(d), Supplemental File 2). In the same period, the prevalence of multimorbidity increased from 7.1% to 16.1% with an increase of 126% and 314% for ≥2 and ≥4 diagnosis groups, respectively (Figure 1(c)-(d)). In 2018, approximately 2.0% of the population had ≥4 diagnosis groups (Figure 1(c)-(d)). Among participants aged ≥80 years, half of the population met the criterion for multimorbidity (≥2 diagnosis groups) and 10.5% for ≥ 4 multimorbidity. The numbers were similar for men and women (Figure 2(a)-(d)). The largest increase in the prevalence of ≥4 diagnosis groups was seen among women aged 18-39 years with an almost eight-fold increase over the years (Figure 2(d)). (a) Prevalence of multimorbidity (≥2 diagnosis groups) among men from 2000 to 2018, stratified on age groups. (b) Prevalence of multimorbidity (≥2 diagnosis groups) among women from 2000 to 2018, stratified on age groups. (c) Prevalence of multimorbidity (≥4 diagnosis groups) among men from 2000 to 2018, stratified on age groups. (d) Prevalence of multimorbidity (≥4 diagnosis groups) among women from 2000 to 2018, stratified on age groups.
Each year, the number of individuals living with multimorbidity increased by approximately 20,000-30,000. From 2008 to 2018, the yearly contribution of persons aged 60-69 years diminished, whereas the contribution of persons 70-79 years old increased. For individuals aged ≥80 years, the increase in prevalence of multimorbidity remained relatively stable over the years, with a slight decrease in the middle of the study period (Figure 3(a)). The prevalence of multimorbidity increased the most among people living in rural areas and small towns, whereas those living in the capital city contributed less to the growing prevalence of multimorbidity (Figure 3(b)). Throughout the study period, individuals with a short education contributed incrementally less to the growth in multimorbidity (Figure 3(c)). (a) Yearly difference of multimorbidity in different age groups. (b) Yearly difference of multimorbidity dependent on degree of urbanization. (c) Yearly difference of multimorbidity dependent on level of education. Purple line: total number of new patients with multimorbidity each year.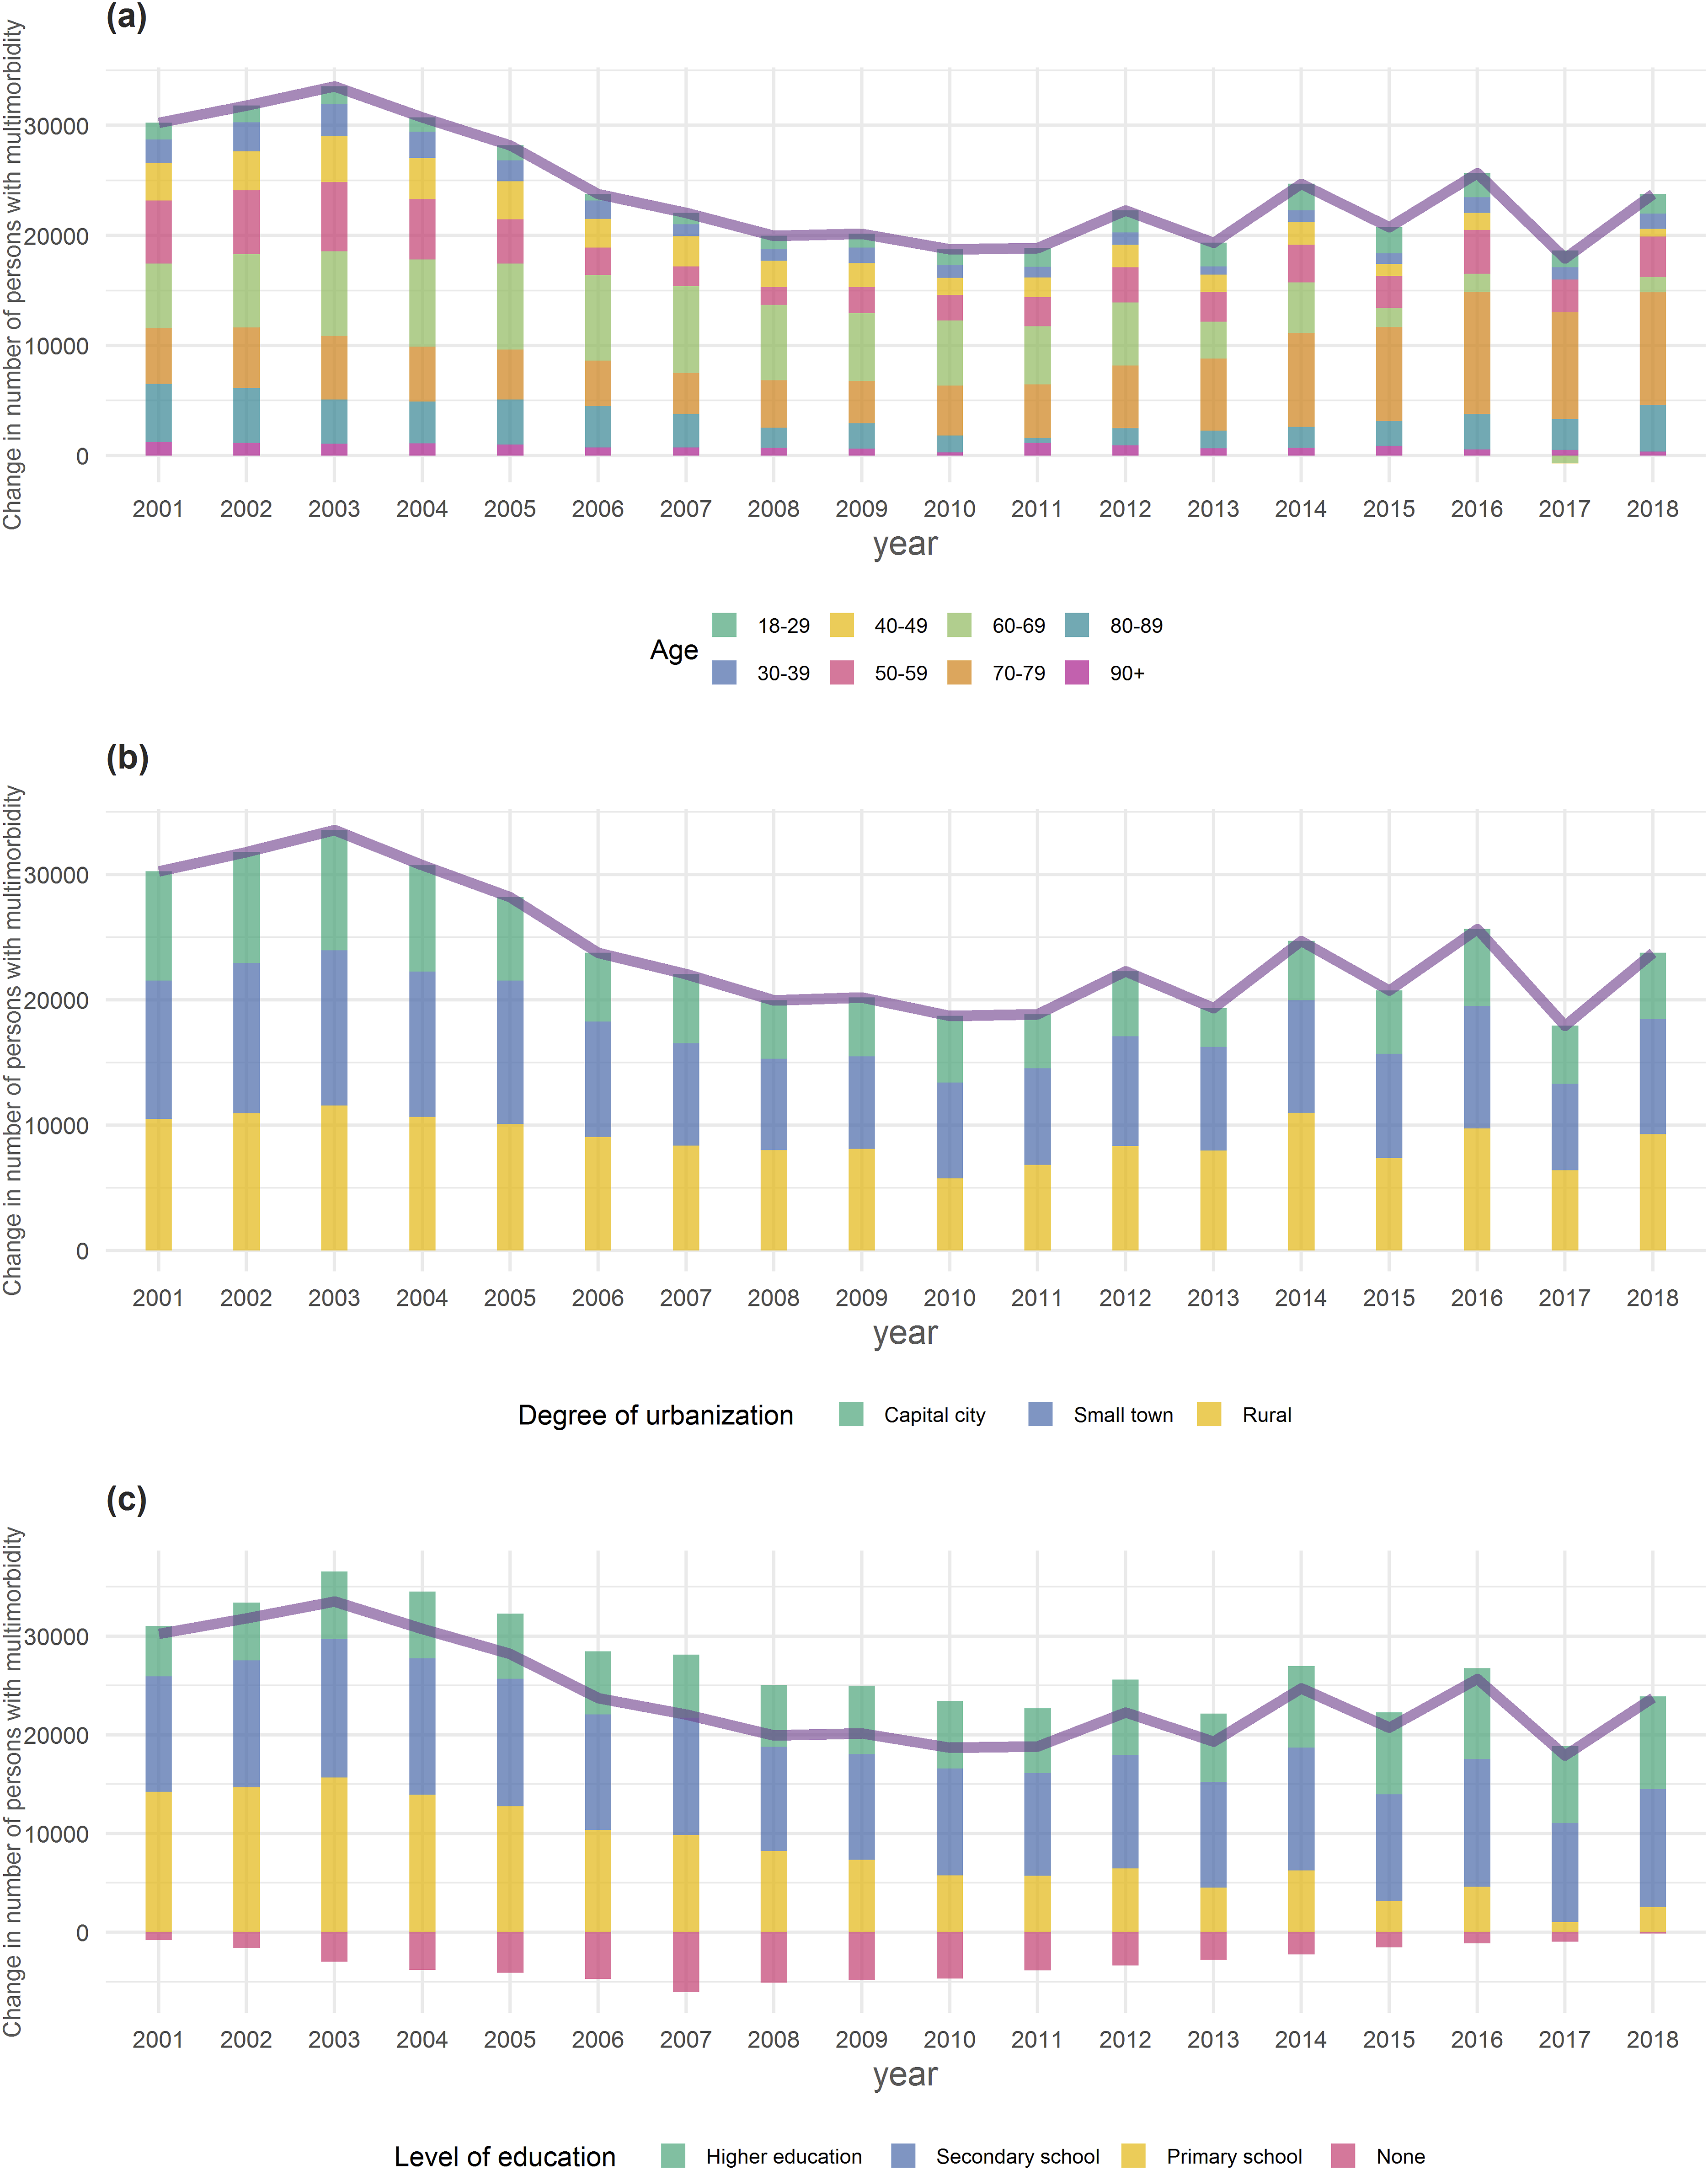
Discussion
Summary of main findings
Our study examined the prevalence of multimorbidity in the entire Danish population over nearly two decades. We found that the prevalence of multimorbidity more than doubled during the study period, with a relatively higher increase in the older age groups. By 2018, half of the population aged ≥80 years had multimorbidity. The prevalence of patients with a musculoskeletal, a mental health, or a cardiovascular diagnosis increased the most in absolute numbers. However, the highest relative prevalence increase was seen in the genitourinary, endocrine, musculoskeletal, mental health, and gastrointestinal diagnosis groups. For some diagnoses, such as sensory diagnoses, the prevalence remained relatively stable. Over the years, individuals aged 70-79 years, those living in rural areas and small towns, and those with secondary school education contributed the most to the increase in multimorbidity prevalence. Contrary to our expectations, the steepest relative increase in multimorbidity prevalence was seen in young adult women (aged 18-39 years) although the absolute number was small.
Comparison with existing literature
During the study period, we observed an increase in the prevalence of people with multimorbidity. Although the heterogeneous nature of multimorbidity may hamper comparisons8,9 our findings align with earlier11,14,25 and recent12,26 prevalence studies on time-trends of multimorbidity. As life expectancy increased during this period, the number of years spent with multimorbidity rose correspondingly. 10 In 2018, 41.9% of the Danish population had at least one chronic condition, which is consistent with a Flemish-Belgian study that found a prevalence of 38.5% in the general population. 25 In our study, we found the prevalence of multimorbidity to be 16.1% in 2018, which aligns with other studies, 14 but is somehow lower than the 23.2% that was found in a primary care study in Scotland and the 22.7% in the Flemish-Belgian study.25,27 We suggest that the main reasons for differences between our findings and earlier studies are our use of data from secondary care, our use of diagnosis groups rather than single diagnoses, and our inclusion of the entire population aged ≥18 years, rather than focusing on older age groups.7,8
The present study showed a 126% and 314% relative increase in the multimorbidity prevalence of ≥2 and ≥ 4 diagnosis groups, respectively, between 2000 and 2018. This finding aligns with Uijen et al.‘s observation, that the highest relative increase in multimorbidity prevalence occurred among patients with ≥4 morbidities in the Dutch population between 1995-2005. 11 In our study, the increase was mainly driven by aging, with the highest prevalence of multimorbidity among the oldest individuals. It is well-established that multimorbidity prevalence increases with age.27,28 We found that over the last ten years, those aged 70-79 years contributed more to the increasing prevalence of multimorbidity compared with other age groups. Interestingly, the prevalence of patients with multimorbidity diminished among individuals aged 60-69 years and remained stable among those older than 80 years. In contrast to our findings, a Swedish study found an increase in diseases and symptoms among persons aged 77 years or older when comparing two cohorts from 1992 and 2002, 29 suggesting that factors other than the aging may also drive the increase in multimorbidity.
Like our study, a study from the Netherlands found musculoskeletal diagnoses to be the most prevalent, both as single-morbidity and in combination with other diseases. 28 We found mental health diagnoses to have the second highest absolute prevalence increase which is in line with other studies pointing at increasing prevalence of mental health diagnoses both internationally and in Denmark.30,31 In addition, it seems like mental health diagnoses are strongly intervened in multimorbidity since depression, in young adulthood, disposes increase in somatic multimorbidity later in life. 32 In our study, genitourinary and endocrinological diagnoses had the highest relative increase, and type 2 diabetes is estimated to increase considerably over the coming years. 33
A rather unexpected finding was the almost eight-fold increase in the prevalence of multimorbidity (≥4 diagnosis groups) among young adult women (18-39 years). A similar trend was observed in the Flemish- Belgian multimorbidity study, which also demonstrated a large increase among female participants from younger age groups. 25 The reasons for this finding are unclear, however, women are known to be more prone to contact their general practitioner, not only for conception and pregnancy matters but also for other health issues.34,35
The time trend of increasing prevalence of multimorbidity is likely also explained by improved technology, medical advancements, and better living conditions. Diseases that were once fatal, such as heart diseases, can now be managed for years or even cured. However, other potential explanations of our findings should be mentioned: 1) The health registers became the basis for the Danish state’s reimbursement to the hospitals in 2000. This may have incentivized doctors to register all diagnostic information from that year onwards, to get a higher income for their departments, potentially leading to an over-definition bias. 36 Even though this bias may have affected the estimated increase in prevalence in the first few years, the prevalence of most diagnosis groups continued to rise throughout the monitoring period. 2) The implementation of screening programs during the period may have contributed to the increase in multimorbidity prevalence. 36 3) A person who develops a disease and goes to the hospital is at risk of getting additional diagnoses. Thus, a detection bias may also explain some of the prevalence increase we observed. 37
Strengths and limitations
Our study has several strengths.
The entire Danish population aged ≥18 years was included, leading to low risk of selection bias. The registers used are validated.17,20 Information about diagnoses was collected in a ten-year period prior to each baseline. Thus, in our design multimorbidity can be “rewound”, which we believe accurately reflects multimorbidity. For instance, a depression that remitted 10 years earlier should not count as an active diagnosis.
Our study also has some limitations. We used data from secondary care, which means the true prevalence of multimorbidity managed both in secondary and primary care is underestimated. Another limitation is that, even though we stratified our analyses on some important demographic and socioeconomic aspects, we have no information on crucial health factors such as lifestyle. Furthermore, the registers do not contain information on the severity of the diagnoses included. Finally, there is no consensus on how to define multimorbidity. In this study, multimorbidity was defined by counting groups of chronic diagnoses, mimicking management and treatments in health care, rather than summing up single diagnoses. 8 Other definitions could theoretically be employed, but there is no definitive answer of which one to use.7–9,38,39 However, we believe the definition used in this study reflects well some of the resource challenges health care is facing (Supplemental File 1).
Implications
To the best of our knowledge, time trends of multimorbidity have been studied before, but never in an entire nationwide adult population. In Denmark, the prevalence of multimorbidity more than doubled from 2000 to 2018, and is likely to continue rising. Our study provides insights for healthcare planners and indicates future demands for care, which may be useful for governments and public authorities when preparing healthcare systems for future challenges. Our estimate of the prevalence of multimorbidity in the population is an underestimate as only diagnoses from the public secondary care were included.
Although potential biases from modes of registration may inflate the estimated rise in multimorbidity prevalence in our study, other studies also support that the prevalence of multimorbidity is on the rise.11,12,25,26,29 Thus, our findings constitute a well-documented minimum of multimorbidity in Denmark, potentially transferable to other countries with similar health care systems.
There is a need for more research on how healthcare professionals can provide proper care for the many patients with multimorbidity. Additionally, research on interventions outside the medical realm that promote all aspects of health is essential.
Conclusions
In Denmark, the prevalence of multimorbidity increased for all adult age groups over the past two decades. This implies that complexity of care has increased for healthcare personnel in both the primary and the secondary care. Our results may be useful for decision makers and healthcare planners.
Supplemental Material
Supplemental Material - Prevalence of multimorbidity during 18 years in Denmark. A nationwide register study
Supplemental Material for Prevalence of multimorbidity during 18 years in Denmark. A nationwide register study by Rasmus Køster-Rasmussen, Volkert Siersma, Dagny R. Nicolaisdóttir, Frederikke A. Modin, Asger Waagepetersen, Maarten Rozing, Anne Holm, Susanne Reventlow, and Tora G. Willadsen in Journal of Multimorbidity and Comorbidity
Footnotes
Acknowledgments
A sincere thanks to Anders Hye Dalsgaard who has contributed to the graphs.
Statements and declarations
Funding
None for this manuscript.
Conflicting interests
The authors report there are no competing interests to declare.
Data Availability Statement
Data may be obtained from a third party and are not publicly available. Data are stored at Statistics Denmark. To share data, approvals are required from the Danish Data Protection Agency and The Danish Health Data Authority.
Supplemental Material
Supplemental material for this article is available online.
References
Supplementary Material
Please find the following supplemental material available below.
For Open Access articles published under a Creative Commons License, all supplemental material carries the same license as the article it is associated with.
For non-Open Access articles published, all supplemental material carries a non-exclusive license, and permission requests for re-use of supplemental material or any part of supplemental material shall be sent directly to the copyright owner as specified in the copyright notice associated with the article.