
Abstract
Background
The Evidence-Based Practice Attitudes Scale (EBPAS) is widely used in implementation research, but it has not been adapted and validated for use among general education teachers, who are most likely to deliver evidence-based prevention programs in schools, the most common setting where youth access social, emotional, and behavioral health services.
Method
School-based stakeholders and a research team comprised of experts in the implementation of evidence-based practices in schools adapted the EBPAS for teachers (the S-EBPAS). The adapted instrument was administered to a representative sample (n = 441) of general education teachers (grades K—5) to assess the reliability and internal consistency via factor analyses. The S-EBPAS included two forms (i.e., EBP-agnostic and EBP-specific item referents), therefore, a multiple-group confirmatory factor analysis (CFA) was also performed to establish measurement invariance between the two forms.
Results
After adaptation and refinement, a 9-item, 3-factor structure was confirmed, with the final model supporting three first-order factors that load onto a second-order factor capturing attitudes toward adopting evidence-based practices. Multiple-group CFA analyses of measurement invariance indicated there were no significant differences between the two forms.
Conclusions
Overall, this study provides a brief, flexible instrument capturing attitudes toward adopting EBPs that has high reliability and internal consistency, which support its use among general education teachers in school settings implementing evidence-based practices.
Plain Language Summary
The Evidence-Based Practice Attitudes Scale (EBPAS) is a popular instrument for measuring attitudes toward evidence-based practices (EBPs). This instrument provides valuable information during implementation initiatives, such as whether providers or front-line implementers have favorable attitudes toward a given practice. The EBPAS has been used in many different settings, such as in community-based mental health clinics, medical hospitals, and in child welfare. However, it's use in schools has been limited, and it has not yet been tested with general education teachers, who are key implementers of evidence-based practices in schools. In order to trust that the scores from an instrument are accurate, it needs to be evaluated when scaling it out to new populations and settings. One popular method to determine this is to use factor analysis, which was employed in this study. This study fills the identified gap by assessing the reliability (i.e., accuracy) and internal consistency of the EBPAS among a representative sample of general education teachers. Findings from this study indicate that the school-adapted EBPAS (S-EBPAS) is a brief, nine-item instrument that provides a reliable estimate of teachers’ attitudes toward evidence-based practices. Our results also provide evidence that the S-EBPAS can be used to capture attitudes toward specific EBPs as well as attitudes toward EBP-agnostic. This study provides a flexible instrument that can be used by school-based implementation researchers, practitioners, and intermediaries at multiple phases of implementation projects, such as when exploring a new EBP to adopt.
Keywords
Introduction
A core aspect of successful implementation is the adoption decision and implementation behaviors of those who are expected to implement an evidence-based practice (EBP). Mounting evidence suggests that implementers’ individual-level characteristics influence the adoption and sustained delivery of EBPs (Aarons, 2005; Fishman et al., 2018). One individual-level factor, attitudes toward adopting EBPs (ATE), has garnered attention across service sectors and has been linked to implementation (Aarons, 2005; Aarons & Sawitzky, 2006; Nelson & Steele, 2008; Rogers, 2003). Teacher attitudes have been identified as a prerequisite for the success of professional development programs (Guskey, 2002) and for the adoption and implementation of new practices (Bowden et al., 2003). Though ATE is an important construct to measure regarding teacher EBP implementation, there are no school-adapted measures of ATE available for specific use with teachers in educational research and practice. Therefore, our purpose was to conduct a measurement study of the Evidence-Based Practice Attitude Scale (EBPAS; Aarons, 2004), an instrument that captures ATE, by adapting the instrument for the school context via stakeholder input and confirming the underlying factor structure.
Teachers are the Primary Implementers of Mental Health Prevention and Promotion Programs in Schools
In schools, general education teachers are the primary, front-line implementers of universal, prevention-focused EBPs (Brackett et al., 2012; Schonert-Reichl, 2017). Universal EBPs have the broadest reach to promote mental health and social-emotional and behavioral wellbeing among youth, which are linked with academic gains and other success-enabling factors (Durlak et al., 2011; Reinke, Herman, & Sprick, 2011; Reinke, Stormont, et al., 2011). Moreover, schools provide an important access point, as they are the most common setting where mental and behavioral health services are utilized among youth (Duong et al., 2021; Fazel et al., 2014; Lyon et al., 2013).
Successful implementation of EBPs depends on both individual- and system-level determinants (Damschroder et al., 2009, 2022); however, individual-level variation in implementation occurs regardless of organizational functioning and intervention supports (Kincaid et al., 2007). Evidence also suggests that individual factors may be more predictive of EBP use than organizational factors (e.g., organizational culture; implementation climate; Locke, Lawson, et al., 2019a). Prior research on the determinants of EBP implementation has shown that a range of teacher-level variables (e.g., self-efficacy, attitudes and beliefs, knowledge about and anticipated efficacy of the EBP, workload, burnout, and perceptions about student behavior) are associated with implementation outcomes (Buabeng-Andoh, 2012; Cook et al., 2015; Han & Weiss, 2005). One individual-level constructs that is consistently present across implementation frameworks are individual attitudes and beliefs regarding the practices used (Aarons et al., 2011; Damschroder et al., 2009, 2022; Nilsen, 2020). In schools, a lack of favorable perceptions and attitudes toward adopting EBPs foreshadow implementation challenges, resulting in students failing to receive and benefit from EBPs (Bartholomew et al., 2007).
Attitudes Toward Adopting Evidence-Based Practices
A person's attitudes are based on cognitive, affective, and behavioral information, and one's beliefs provide the cognitive basis of an attitude (Albarracín & Vargas, 2010). Attitudes reflect a person's favorable or unfavorable views about performing a given behavior and reflect an element of motivation (Glasman & Albarracín, 2006). Moreover, attitudes have been shown to predict a moderate-to-large portion of the variance in a person's intention to implement EBPs (d = .48) and a small-to-moderate amount of variance in behavioral change (d = .38; Godin et al., 2008; Sheeran et al., 2016). For example, teacher attitudes have been shown to correlate with (a) the integrity with which EBPs are implemented (Kincaid et al., 2007), (b) willingness to adopt and implement social-emotional learning curricula (Brackett et al., 2012), and (c) staff turnover during organizational initiatives to implement new practices (Gill et al., 2002). Moreover, teachers’ attitudes impact their commitment to implement an innovative program or practice once they receive appropriate training and follow-up support (Filter et al., 2016), and evidence suggest that teachers’ attitudes influence the uptake and use of EBPs in schools (Bowden et al., 2003; Brackett et al., 2012). Of particular importance is the degree to which a teacher perceives the EBP to add undue burden may be associated with less favorable attitudes and, thus, may predict that a teacher would be less likely to implement new practices (Buabeng-Andoh, 2012; Collier-Meek et al., 2018). Further, whether teachers perceive an EBP to fit with their youth, philosophy, and values has been theorized as a teacher-level determinant (Long et al., 2016). In sum, attitudes represent an important individual-level determinant related to the implementation of school- and classroom-based practices.
Existing Instruments for Capturing Teacher Attitudes
A variety of instruments have been developed for the purpose of measuring attitudes and beliefs among teachers in schools (Briesch et al., 2013; Cook et al., 1951; McArdle, 2011; Rimm-Kaufman & Sawyer, 2004). One widely used instrument, the Public-School Teacher Questionnaire (PSTQ; Rimm-Kaufman & Sawyer, 2004) measures attitudes toward the teaching profession generally. Another established instrument, the Usage Rating Profile-Intervention (URP-I, Briesch et al., 2013) is a 29-item survey that consists of six subscales: Acceptability, Understanding, Feasibility, Family–School Collaboration, System Climate, and System Support. The URP-I intends to capture perceptions of both particular intervention's usability as well as interventions generally. These instruments have been important to capture individual-level perceptions of the teaching profession generally and of the usability and appropriateness of interventions implemented in schools.
The Evidence-Based Practice Attitude Scale (EBPAS)
The original 15-item Evidence-Based Practice Attitude Scale (EBPAS-15) was developed based on consultation with mental health service providers and researchers working in child and adolescent services and through reviews of the literature regarding the implementation of EBPs related to mental health service provider attitudes (Aarons, 2004, 2005). The goal of the EBPAS was to measure specific attitudes related to the implementation of EBPs in community-based mental health settings (Aarons, 2005). In the original study, four factors were identified as influential in mental health service providers’ attitudes toward the adoption of EBPs: (1) openness to implementing new interventions (Openness); (2) the intuitive appeal of the new intervention (Appeal); (3) willingness to using required interventions (Requirements); and (4) conflict between clinical experience and research results (Divergence). The four subscales combine into a higher-order scale representing global attitudes toward adopting the evidence-based practice. The EBPAS-15 has been validated in over 26 states in the United States of America as well as in the Netherlands and Norway and among 100 different community-based organizations involving over 1,000 mental health providers, medical professionals, and child welfare workers (Aarons et al., 2010; Egeland et al., 2016; Keyser et al., 2016; Melas et al., 2012; Rye et al., 2017).
An expanded version of the EBPAS (i.e., EPBAS-50) was developed that included 35 additional items and eight additional subscales (Aarons et al., 2012). Overall, the EBPAS-50 includes 12 subscales—Appeal, Requirements, Openness, Divergence, Limitations, Fit, Monitoring, Balance, Burden, Job Security, Organizational Support, and Feedback. Other versions testing different arrangements of subscales have been completed by Rye et al. (2017), who adapted a shorter version of the EBPAS-50 (EBPAS-36) among a mixed sample of US and Norwegian psychologists, psychiatric nurses, and psychology students that maintained the 12 subscale factors but reduced the number of items per factor while maintaining adequate psychometric properties.
Gaps in the Literature
This study sought to address multiple gaps in the literature. First, school-based instruments gathering data about the teaching profession in general (e.g., PSTQ, Rimm-Kaufman & Sawyer, 2004) and about intervention usability exist (e.g., URP-I; Briesch et al., 2013); however, these instruments tend to be lengthy and capture distinct constructs from attitudes toward EBPs. A brief, flexible instrument for measuring teacher attitudes toward the adoption of EBPs both in general and that can also be adaptable for a given EBP would benefit educational researchers and practitioners implementing EBPs. Rather than developing a novel instrument to assess teacher ATE, there is utility in adapting the EBPAS for use with teachers prospectively, which is widely incorporated in implementation frameworks (e.g., Nilsen, 2020).
Second, although Cook et al. (2018) scaled out the original EBPAS-15 to the education sector among school-based behavioral health consultants; no study to date has adapted and tested the EBPAS with general education teachers, who are the primary implementers of prevention-focused EBPs in schools and have unique roles and expertise in schools. The Cook et al. (2018) study also found that not all subscales had strong internal consistency. The Divergence subscale had low internal consistency (α = .63) and a moderate factor loading of .338 onto the higher-order EBPAS factor. The authors indicated that measure adaptations that exclude the Divergence subscale may be warranted.
Third, there is a need to further refine instruments such as the EBPAS to be feasible among teachers by including constructs that educational stakeholders view as important, such as the degree to which certain practices fit with their students and teaching philosophy and the degree to which practices cause undue burden. In this study, we conducted an expert summit with educational stakeholders and included their input in the refinement of the instrument, which involved an expansion of the factor structure used in the Cook et al. (2018) study from the original four subscales of the EBPAS-15 to six (inclusion of the Burden and Fit subscales from the EBPAS-50). Finally, the length of items within instruments has been shown to increase the response burden among participants (Fricker et al., 2014) and calls have been made for more pragmatic measurement in implementation science (Stanick et al., 2021); therefore, we made an effort to develop as brief an instrument as possible while also maintaining strong psychometric properties (i.e., internal consistency and scale reliability).
Purpose of This Study
The primary purpose of this study was to develop the School Evidence-Based Practice Attitudes Scale (S-EBPAS) with input from education stakeholders as a brief, a psychometrically sound instrument for use in school-based implementation research and practice to assess teacher ATE. This instrument combined the original four subscales from the EBPAS-15 and two additional subscales from the EBPAS-50 (Burden & Fit). This study had four aims: (1) adapt the EBPAS for use with teachers; (2) confirm its underlying factor structure when administered to a sample of elementary school general education teachers involved in real-world implementation efforts of EBPs; (3) reduce the instrument to be as brief as possible while maintaining strong psychometrics; (4) run a multiple-group confirmatory factor analysis to test the measurement equivalency between EBP-agnostic and EBP-specific terminology. This study was part of a larger grant-funded study (The Organizational Assessment for Strategic Implementation in Schools; OASIS) seeking to establish reliable, valid, and practical measurement tools for use with school teachers capturing the organizational implementation context.
Method
Procedures
Human subject approval was obtained from the University of Washington and the University of Minnesota Human Subjects Internal Review Board (IRB) and partnering school districts’ research and evaluation departments.
Sub-Scale Adaptations and Measure Refinement
Prior to conducting the factor analysis procedures, the EBPAS sub-scales underwent a series of revisions to adapt them for use with teachers. The measures and constructs were adapted first via an expert summit including 19 researchers, intermediaries, and district representatives, and then through mixed-method focus group sessions and nominal group processes with 37 key educator stakeholders (16 central administrators, 10 elementary school principals, 11 elementary school teachers (Locke, Lee et al., 2019). Adaptations consisted of two main practices (a) making surface-level changes to the item wording to ensure construct equivalence for the target respondents (i.e., educators/students) and (b) expanding the EBPAS-15 to include additional content to ensure contextual appropriateness to the school context (Hambleton, 1994) while preserving the integrity of the original items and constructs (Hambleton et al., 2004). Moreover, the expansion of the subscales was made based on feedback from experts and stakeholders regarding sub-constructs missing from the EBPAS-15 that are relevant and have utility in the school context. Specifically, it was decided via nominal group technique (Harvey & Holmes, 2012) that two additional sub-scales from the EBPAS-50 were merged with the original four subscales from the EBPAS-15 based on information gleaned from the expert summit: (a) Fit (i.e., the degree to which teachers perceive an EBP to fit with the needs of their students and their teaching philosophy) and (b) Burden (i.e., the degree to which a teacher perceives the EBP to add undue burden; Aarons et al., 2012). Both constructs were drawn from the EBPAS-50 (Aarons et al., 2012) and combined with the original EBPAS-15 for this study. The resulting measure included 26 items with six subscales prior to conducting the measurement testing procedures. Table 1 depicts the adapted items with descriptions for each of the sub-scales in the S-EBPAS measure.
School-Adapted EBPAS Item Number and Description.

Note. Sub-scales 1–4 represent the original EBPAS, while the adapted S-EBPAS includes all six subscales. This version represents the EBP-Agnostic language version of the scale. Response categories are based on a 5-point Likert scale: 0 = not at all, 1 = slight extent, 2 = moderate extent, 3 = great extent, and 4 = very great extent. The score for each subscale is calculated by computing a mean score for the set of items that load on the given subscale. Items #3, #6, #24, and #26, were reverse-scored. EBPAS = Evidence-Based Practice Attitudes Scale; S-EBPAS = school-adapted EBPAS; EBP = evidence-based practice.
In the sample, there were two different forms of the S-EBPAS given to participants. One group received the S-EBPAS that used the term “EBP” as the item referent (i.e., EBP-agnostic, and the other group had the term “EBP” replaced with specific EBP referent (i.e., EBP-specific). The versions of S-EBPAS were distributed nearly evenly among the sample (agnostic, n = 219, specific, n = 222). The specific group was split in half, with n = 111 each having their item referent matching the EBP they were implementing.
Participants and Recruitment
This study included a total of 441 teachers from 52 elementary schools in Washington, Ohio, and Illinois. Complete demographic information for participants is depicted in Table 2. An average of nine teachers were recruited randomly per school (range: 4–12) to participate in the study. School building administrators identified a pool of 500 teachers who were then sent a web-based survey, and 88% of teachers who were recruited completed the survey. Each school included in this study was actively implementing one of two universal evidence-based programs: (1) a universal level of School-Wide Positive Behavioral Interventions and Supports (SW-PBIS) or (2) the Promoting Alternative THinking Strategies (PATHS). SW-PBIS is an implementation framework that facilitates the selection and use of evidence-based prevention and intervention practices. It involves all staff, particularly teachers, developing school-wide behavioral expectations and consistently teaching, modeling, cueing, and reinforcing those expectations in the classroom as well as non-classroom settings (Sugai & Horner, 2006). PATHS is a social-emotional learning curriculum that involves teacher delivery of lessons targeting student social-emotional competency and follow-up support after each lesson to promote skill generalization (e.g., reminders, feedback; Elias et al. 2003; Greenberg et al., 1995; Horner & Sugai, 2015).
Participant Demographics.
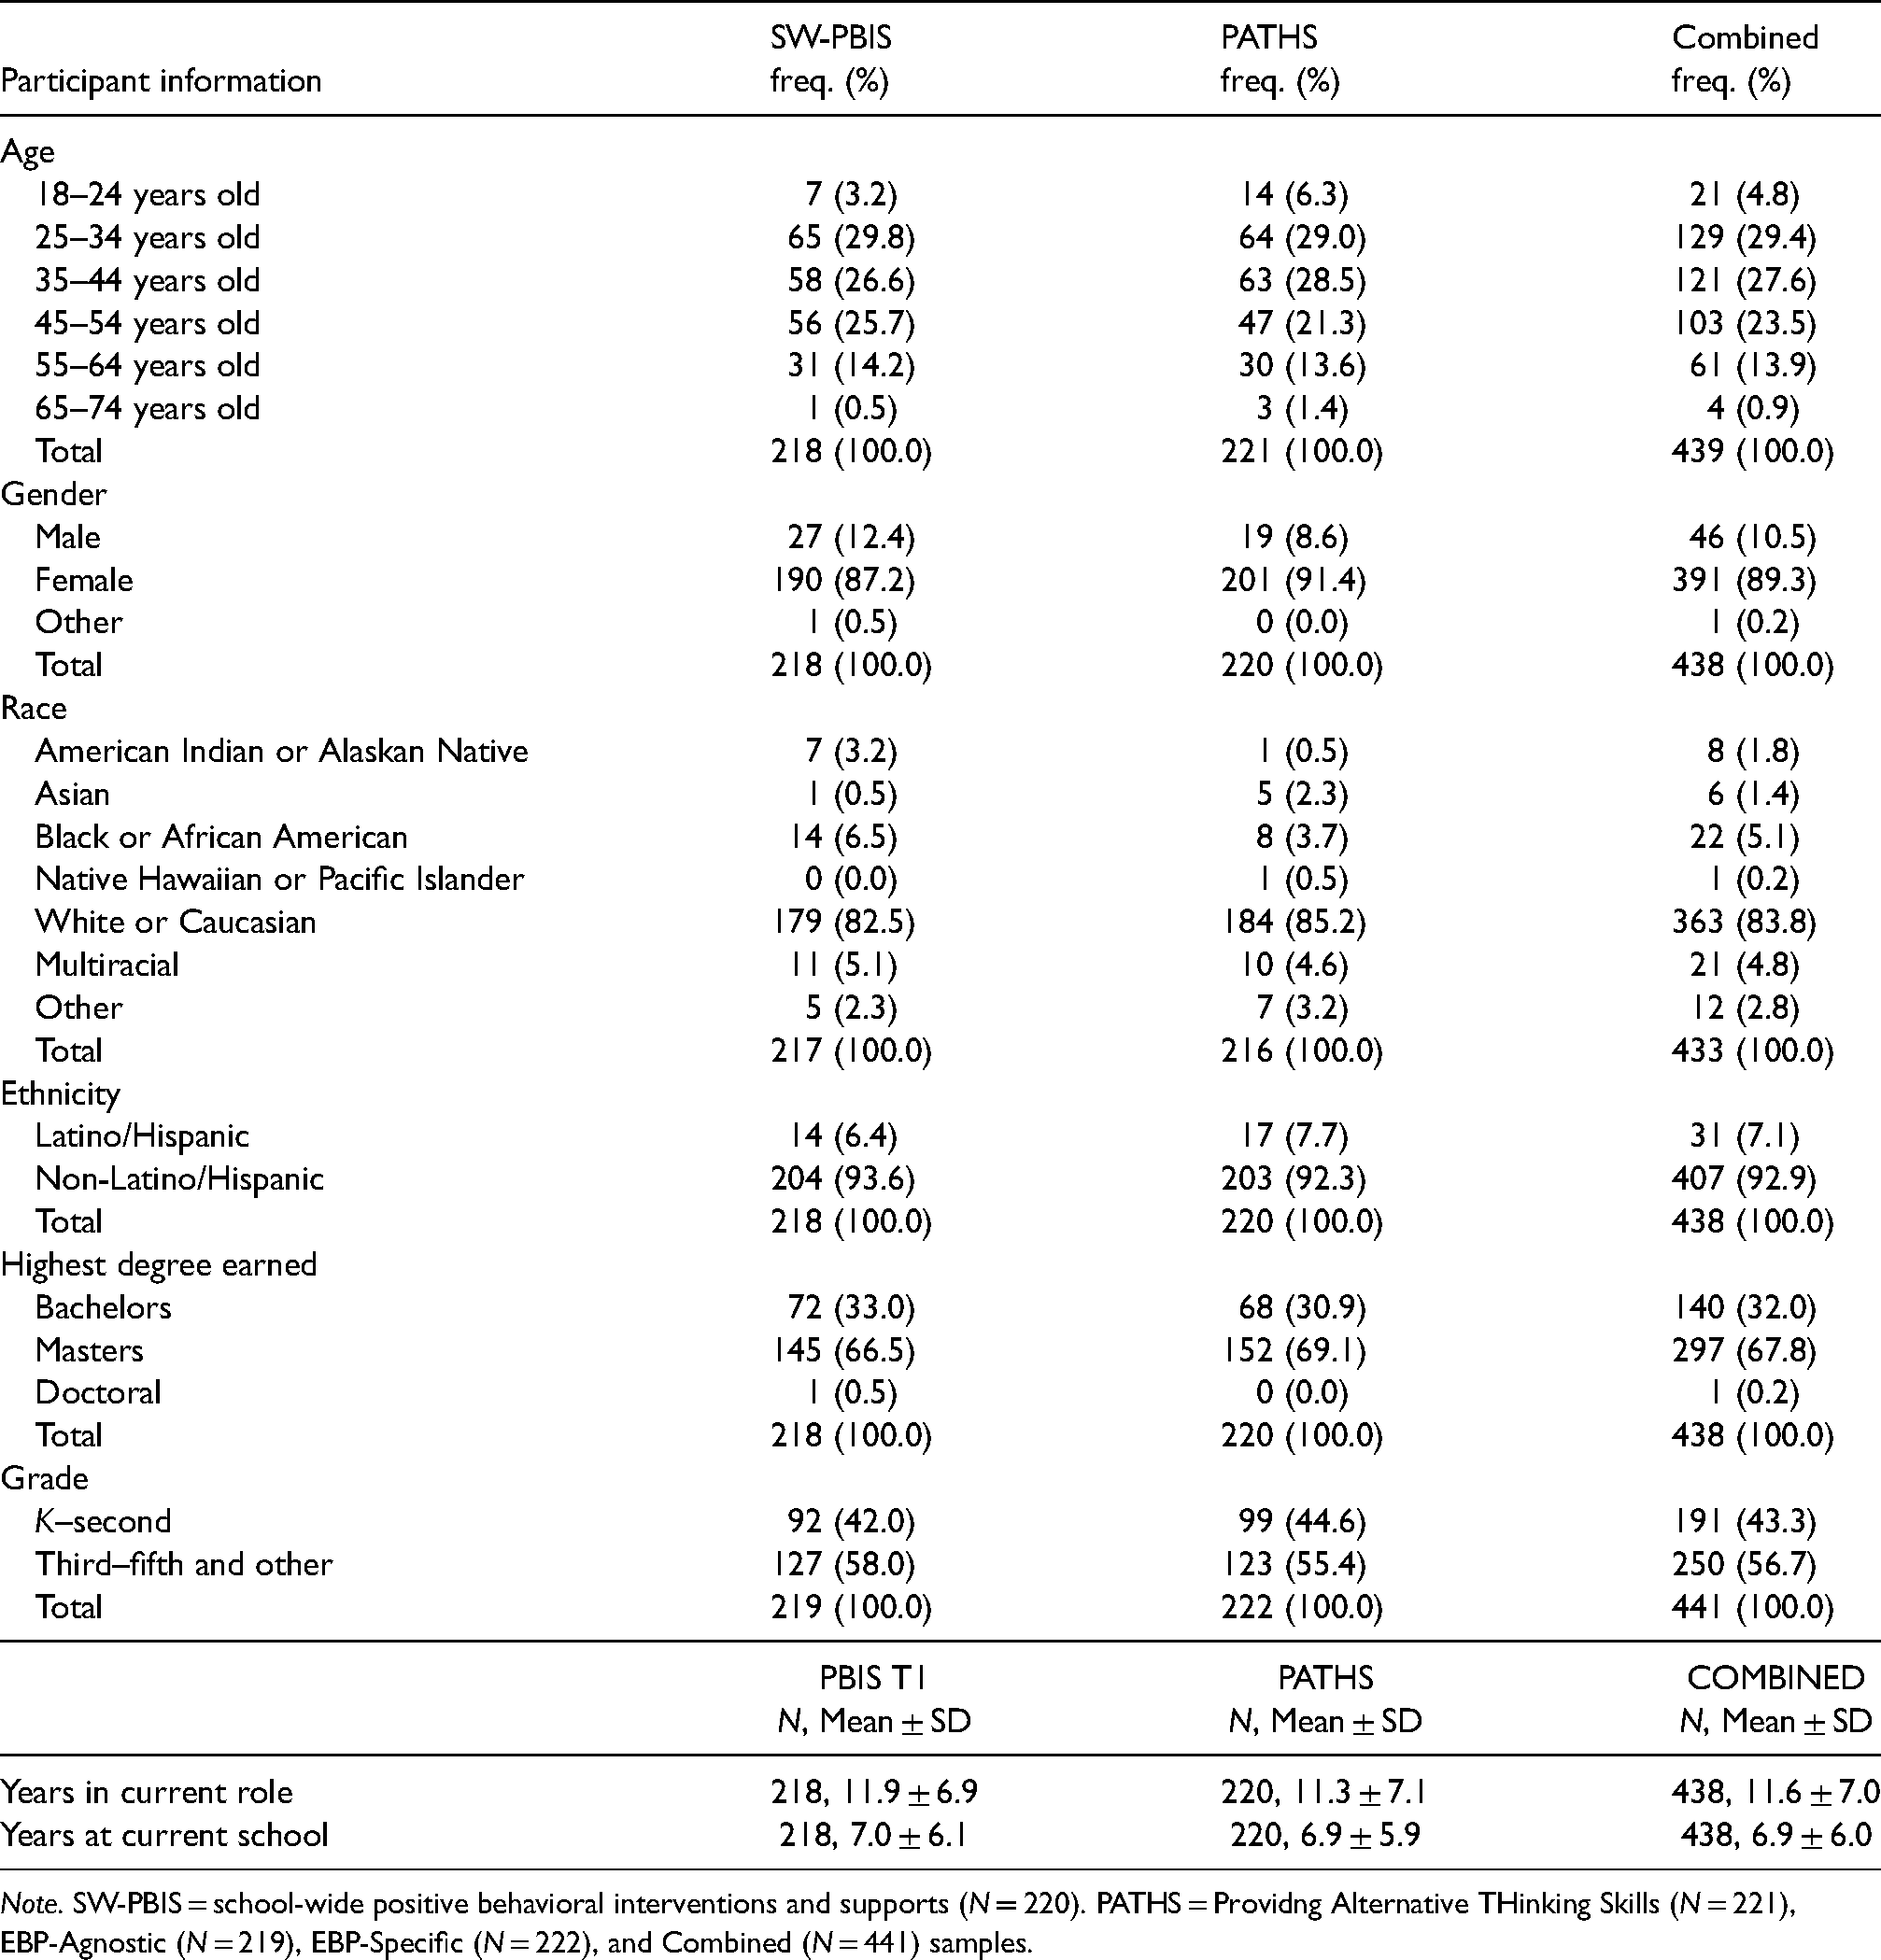
Note. SW-PBIS = school-wide positive behavioral interventions and supports (N = 220). PATHS = Providng Alternative THinking Skills (N = 221), EBP-Agnostic (N = 219), EBP-Specific (N = 222), and Combined (N = 441) samples.
Data Collection
Data were collected in the fall of the 2017–2018 academic year via a web-based survey constructed using Qualtrics. An initial email was sent to teachers in November to provide them with an overview of the project, obtain informed consent, and provide link to the online survey. Each teacher was provided with a one-month window to complete the survey from the time they were sent the initial email. A total of three reminder emails were sent on a weekly basis to increase the number of respondents from each school. Participants received a US$25 gift card upon completion.
Data Analysis Plan
Since the factor structure of the EBPAS has been established widely, the 26-item S-EBPAS was evaluated first via a series of confirmatory factor analyses (CFAs) using weighted least squares means and variances (WLSMVs) estimation with delta parameterization for the ordered-categorical scale items, as employed in Mplus version 8.4. Model evaluation methods followed guidelines from Brown (2015) and Worthington and Whittaker (2006). The fit of each model was determined by examining several indices including the Chi-square statistic, comparative fit index (CFI; Hu & Bentler, 1999), the Tucker-Lewis index (TLI; Tucker & Lewis, 1973), the root mean square error of approximation (RMSEA; Rigdon, 1996), and the weighted root mean square residual (WRMR; DiStefano et al., 2018).
Multiple models were assessed. The first model assumed only first-order factors and modeled exogenous subscales within the S-EBPAS that correlated with one another. Standardized factor loadings (ß) less than .55 were deemed as poorly performing items that required further examination (Tabachnick & Fidell, 2019). The second model imposed a hierarchical structure with a second-order global ATE factor. Our theory, measurement development process, and intended function of the S-EBPAS as a brief, unitary measure of teacher ATE led us to prioritize a model with the second-order global ATE factor.
To assess the construct validity of the measures, the sample was split randomly into two groups and an exploratory factor analysis (EFA) was conducted to determine the optimal factor structure. This involved applying appropriate rotations to the data and examining the aforementioned fit statistics, factor correlations, and eigenvalues to select the proper number of factors.
Additionally, a multiple-group CFA was performed to test for measurement invariance; That is, to determine whether the underlying factor structure of the S-EBPAS was equivalent between EBP-agnostic and EPB-specific forms. The same fit indices were employed as the initial CFAs, including a χ2 difference test between models, to determine whether the performance of items and the structure of S-EBPAS remained invariant across the different versions of the scale. A stepwise procedure was used, whereby the analysis begins with the least restricted solution (equal form), and subsequent models are evaluated (using nested χ2 methods) that entail increasingly restrictive constraints; that is, do both forms measure the same constructs and are both groups’ relationships with them the same (equal factor structure and loadings; Brown, 2015).
Scale Reliability
Scale reliability was calculated using the Raykov reliability estimate (ρ; Raykov, 2004). This reliability estimate is more appropriate for use in CFA than Cronbach's alpha, which has been shown to provide undependable estimates of scale reliability (Green & Hershberger, 2000; Komaroff, 1997; Raykov, 1997). Raykov's rho (ρ) can be interpreted similarly to classic interpretations of reliability, as an indicator of precision representing the amount of true score variance divided by total variance.
Results
Descriptive Statistics
Measures of central tendency, variability, percentage of missingness, and ranges were calculated for all predictors, outcome variables, and covariates to be used for each research question. These results are displayed in Table 3.
Descriptive Statistics of Variables.

Note. M = Mean; SD = Standard Deviation. EBPAS = Evidence-Based Practice Attitudes Scale; EBPs = evidence-based practices.
CFA Preliminary Analysis
Of the 441 participants, 434 had complete data for all items on the S-EBPAS. An initial first-order model included all four original EBPAS subscales (i.e., Openness, Divergence, Appeal, and Required) as well as the two new subscales (Burden and Fit). A total of 26 items were included with marker indicators specified as the first item of each subscale; however, this model failed to converge. This same process was conducted using only the original EBPAS-15 items and structure, though convergence was still not achieved. Therefore, it was decided to conduct an exploratory factor analysis (EFA).
Exploratory and Confirmatory Factor Analyses
EFA procedures described in Brown (2015), Thompson (2004), and Worthington & Whittaker (2006) were used to explore the factor structure, identify the number of factors to extract, and apply an appropriate factor rotation. The EFAs were conducted on half of the sample, which was randomly split, blocking for EBP-agnostic and EBP-specific item-referent groups (n = 220). Based on the results of the EFA, items were removed for one of three reasons: (a) an item cross-loaded onto more than one factor, (b) did not meet the .55 standardized factor loading cutoff, or (c) less than three items loaded onto a factor. Resultingly, items 3, 6, 11–13, 16–18, and 23–26 were removed from the analysis, reducing the total number of items to 14. The EFA was re-run, and a 3-factor structure fit the data best (examination of scree plots and all three-factor eigenvalues fit the Kaiser-Guttman rule [eigenvalues > 1]). Final EFA results are included in Appendix A. Although minimum sample size rules of thumb for factor analysis indicate a minimum of N = 100–200 (Comrey & Lee, 1992; Gorsuch, 1983), MacCallum et al. (1999) indicated that it is more important to maintain communalities (i.e., the portion of the variance that is accounted for by the common factors) of at least .60 among items. Because this was the case for our items (communality range: .673–.935), we determined our sample size was adequate.
The measurement model from the EFA indicated a 14-item, three-factor structure, with Factor 1 including six items and Factors 2 and 3 each including four items. A confirmatory factor analysis of this factor structure (i.e., no cross-loadings or correlated residual errors) was conducted on the second half of the sample (n = 221), and indicated acceptable overall model fit, χ2(74) = 212.2, p < .001; CFI = .980, TLI = .976, SRMR = .04, RMSEA = .092 (90% CI: .078–.110). However, the RMSEA value suggested that the model could be re-specified to improve fit and be made more parsimonious. Therefore, localized areas of ill-fit were explored, beginning with modification indices, which indicated that the largest values were between items 2 and 4; 9 and 10; and 21 and 22. We examined the language used in these items to determine if removing redundant items made substantive or theoretical sense. Items 2 and 4 both captured the idea of willingness to try new practices. This concept is substantively captured by other items within the subscale by items 1 and 5, so both items were removed. Items 9 and 10 are similarly worded as well (i.e., I would use EBP if it was “intuitively appealing” or “made sense”), so item 10 was removed. Finally, items 21 and 22 were very similar conceptually (i.e., I would adopt EBP if it “fit with my professional approach” and “fit with my philosophy as an educator”). Therefore, item 22 was also removed, resulting in nine items remaining.
The DIFFTEST function in Mplus was used to give a more accurate model fit comparison between the 14-item model and the 9-item model. Results produced a significant chi-square difference, χ2 (24) = 52.378, p < .001, which indicates that the 9-item model fit best. Other fit statistics confirmed a well-fit model (CFI = .991, TLI = .986, SRMR = .03, RMSEA = .073, 90% CI: .04–.10), while also maintaining high reliability (range: .880–936). The specified measurement model contained no double-loading indicators, and all freely estimated unstandardized parameter estimates were statistically significant (p-values < .001), and factor loading estimates revealed that the indicators were related strongly to their alleged latent factors (range of λ = .730–.987). Prior research efforts have shown that the factor structure of the EBPAS is hierarchical in nature by a single second-order factor, ATE (e.g., Aarons, 2004; Aarons et al., 2012). The three first-order latent factors loaded onto the second-order factor of ATE at large values (λ>/ = .70), with a range of R2s = .57–.79 (Table 4). The hierarchical second-order CFA model is displayed in Figure 1. The first-order model including inter-factor correlations are included in Appendix B. Polychoric correlations between S-EPBAS items used in the final model as well as item proportions are displayed in Table 5.

School Evidence-Based Practice Attitude Scale (S-EBPAS) Second-Order Hierarchical Confirmatory Factor Analysis (CFA).
CFA Factor Structure of the S-EBPAS With Reliability and R2.

Note. Fit statistics: CFI = .991, TLI = .986, χ2 (24) = 52.378, p < .001, SRMR = .032, RMSEA = .073 (90% CI = .046–.10). SW-PBIS = school-wide positive behavioral interventions and supports; EBPAS = Evidence-Based Practice Attitudes Scale; S-EBPAS = school-adapted EBPAS; EBP = evidence-based practice; CFA = confirmatory factor analysis; CFI = comparative fit index; TLI = Tucker-Lewis index; RMSEA = root mean square error of approximation; SRMR = standardized root mean square residual.
Correlations Between S-EPBAS Items and Sub-Scales in the Final Model.

Note. Pearson's polychoric correlation (r) was calculated between items; Spearman's ρ was calculated between the full three-factor S-EBPAS alondg with each subscale. S-EBPAS = School Evidence-Based Practice Attitudes Scale.
Scale Reliability
Unitary scale reliability results indicated that ρ = .918, or approximately 92% of the total variance within the S-EBPAS scale is true score variance. Reliability estimates for the three subscales are as follows: Openness, ρ = .901; Appeal, ρ = .936; and Fit ρ = .880. Generally, reliability coefficients of .90 and above are considered “excellent” and above .80 are “very good” (Kline, 2016). These results are displayed graphically in Table 5.
Multiple-Group CFA
Results of the stepwise multiple-group CFA process are displayed in Table 6. First, CFAs for the EBP-agnostic and EBP-specific groups were each run separately. In both groups, all factor loadings were statistically significant (all p-values < .001) and salient (standardized factor loadings between .71 and .99). Second, the simultaneous analysis of equal form (i.e., that the number of factors and pattern of factor indicators are identical between groups) indicated acceptable model fit, χ2(72) = 120.71, p < .001, RMSEA = .055, SRMR = .037, CFI = .993, TLI = .993. Third, the constraint of equal factor loadings and thresholds also showed acceptable model fit, χ2(75) = 119.78, p < .001, RMSEA = .052, SRMR = .032, CFI = .994, TLI = .994. This indicates that the factor loadings and thresholds of the indicators evidence comparable relationships to the latent constructs in both EBP-agnostic and EBP-specific forms of the instrument.
Tests of Measurement Invariance Between EBP-Agnostic and EBP-Specific Versions of the S-EBPAS.

Note. Multiple-group CFA was conducted on the 3-factor, 9-item scale. N = 441 Δχ2 = nested χ2 difference; Δdf = change in degrees of freedom, RMSEA = root mean square error of approximation; 90% CI, 90% confidence interval for RMSEA; SRMR = standardized root mean square residual; CFI = Comparative Fit Index; TLI = Tucker–Lewis Index; CFA = confirmatory factor analysis.
* = p < .05, ** = p < .01, *** = p < .001.
Discussion
The S-EBPAS captures important components of various sub-constructs that have been tied to successful implementation, and its construction was informed by educational stakeholders. We were able to reduce the EBPAS to a 9-item, three-factor scale while also maintaining very good-to-excellent subscale reliability (Kline, 2016). Some of the construct-irrelevant variances was eliminated from items in the original Divergence subscale, making the S-EBPAS a briefer instrument with high internal consistency for both the unitary construct of ATE and for each subscale. A multiple-group CFA also indicated that the S-EBPAS can be used to gather ATE in general and when inserting a specific EBP (i.e., PATHS) or an evidence-based implementation framework (i.e., SW-PBIS). This allows researchers the flexibility to tailor the S-EBPAS to fit their needs accordingly. The S-EBPAS was developed as part of an iterative adaptation process in which subscales across two instruments capturing implementer attitudes toward adopting EBPs were integrated (i.e., EBPAS-15; Aarons, 2004; and EBPAS-50, Aarons et al., 2012). Initial results from the preliminary CFA of the 26-item, 6-factor model of the S-EBPAS did not fit the sample data well (nor did the original EBPAS-15 structure), indicating that the original factor structure did not generalize to our teacher sample well. Through the use of factor analysis, a 9-item, 3-factor structure emerged that deviated from the original EBPAS-15, developed by Aarons (2004). As found in similar measurement studies of the EBPAS-15, the Openness and Appeal subscales demonstrated the strongest relationships with the overall unitary construct of attitudes toward adopting EBPs (Aarons et al., 2011; Cook et al., 2018; Melas et al., 2012; Suhrheinrich et al., 2020), and the Divergence subscale had a weaker relationship (Cook et al., 2018; Suhrheinrich et al., 2020). In fact, our final measure only includes one item from the Divergence scale and is loaded onto the revised Openness subscale. Our final version also includes three items from the Fit subscale.
Although the current 9-item measure deviates from the original factor structure of the EBPAS, the items maintained in our instrument capture constructs that are consistent with conceptualizations of attitudes and attitude formation theory (Albarracín & Vargas, 2010; Thurstone, 1931) as well as with behavior change theories, such as the Theory of Planned Behavior (TPB; Ajzen, 1991) and with the Health Action Process Approach (HAPA, Schwarzer et al., 2011). Thurstone (1931) conceptualized attitudes as “potential action,” which is captured by item 7 (“I would use EBPs”), and borders on a theoretically important bridge between being motivated to initiate a new behavior and having the intention to carry out the behavior (Ajzen, 1991; Schwarzer et al., 2011). However, a general willingness to use an EBP can still be differentiated from a typical commitment statement that exemplifies a behavioral intention or commitment (e.g., “I will use EBPs” or “I am committed to using EBPs”), even if that EBP is specified, as was the case for half of the sample in this study. Since the EBPAS intends to capture attitudes toward adopting EBPs, this grounding in behavior change fits well.
Two other important pre-intention constructs outlined by the HAPA are self-efficacy, a belief about one's ability to successfully perform a behavior, and outcome expectancies, a belief about the likelihood of the behavior leading to a specific outcome. These beliefs provide the cognitive basis of an attitude, and they have been determined to be the two strongest predictors of behavioral intentions. These are captured by both item 15 (“I would use an EBP if I felt I had enough training”) and item 1 (“I like to use EBP to help my students”). Finally, positive social expectations and norms have been identified as a predictor of professional satisfaction and attitude formation (Cooper et al., 2001; Gatewood et al., 1992). This also aligns with the theory of planned behavior, which indicates that attitudes, subjective norms, and perceived behavioral control predict intentions to carry out a behavior.
Interestingly, none of the Burden or Required subscale items fit with any of the three factors, nor was there defensible evidence to support their standalone inclusion in the instrument among a sample of teachers. This finding suggests that even if a practice places an undue burden on teachers, who are already pressed for time by a variety of initiatives and tangential requirements (e.g., testing, lesson-planning and delivering core curriculum, meetings), they may still hold favorable beliefs toward it if other elements align. The fact that none of the items within the Required subscale remained could potentially be a limiting factor given the theory that belief and attitude change follow, rather than precede, behavior change (Guskey, 1986). Overall, the S-EBPAS captures important components of various sub-constructs within attitudes that have been tied to prior research in behavior change theory (e.g., Ajzen, 1991) and teacher attitude and values formulation (Cooper et al., 2001; Gatewood et al., 1992).
Limitations and Future Directions
Although various versions of the EBPAS factor structure have held for a variety of populations, including school-based practitioners (Cook et al., 2018), it did not fit well when used among our sample of teachers and required restructuring. This could be explained by differences in role identity and perceptions around supporting mental health and social-emotional functioning between teachers and other providers where the EBPAS has been used. Research has documented that teachers often experience conflict in their role identities in ways that exceed other types of service providers (Gable et al., 2012; Stadnick et al., 2018). One way to test this difference would be to determine whether teachers’ attitudes toward adopting academic-focused EBPs differ from social-emotional, behavioral, and mental health-focused EBPs.
This study represents the first measurement analysis of the EBPAS with a sample of teachers, and because our scale deviates from the original EBPAS factor structure, additional studies are needed to test whether the 9-item S-EBPAS holds with a different sample of teachers. Given that our effort was to create a brief and feasible instrument, we acknowledge that the S-EBPAS is not the universe of all potential items to capture the construct of ATE among teachers. Future studies using the EBPAS with teachers may also want to expand the S-EBPAS subscale that emerged from the EFA and beyond, as efforts to improve fit and make the current version more parsimonious may have capitalized on idiosyncrasies within our sample (Brown, 2015). Future additions should draw upon teacher-informed, contextually appropriate items specific to EBP implementation not yet captured by the S-EBPAS.
Given sample size limitations, we were unable to test measurement invariance between S-EBPAS surveys referring specifically to either SW-PBIS vs. PATHS. Because each of these EBPs differs (SW-PBIS is an implementation framework, whereas PATHS is an evidence-based intervention/curriculum), there may have been variation that was not captured. Future research on the S-EBPAS should continue using a variety of EBPs to further validate its use for EBPs specifically and as an EBP-agnostic tool.
Our team had collected implementation outcome data associated with PATHS and SW-PBIS; however, this study had a relatively small and uneven sample size to analyze the relationship between predictors of interest and implementation outcomes (N = 52; SW-PBIS n = 39 and PATHS n = 13). The difference in the level that fidelity was collected (i.e., school-wide universal level and individual classroom level) provided challenges. Therefore, we were unable to analyze changes in ATE with variables such as intervention fidelity. Future studies that examine the relationship between the S-EBPAS and other predictors of interest should do so with larger, more balanced, and representative samples of schools and educators that are actively implementing different types of EBPs.
Finally, measuring characteristics such as attitudes through the Likert scale leave participants susceptible to response biases, such as social desirability, which can lead to inflated reliability estimates (Kreitchmann et al., 2019). To overcome this, researchers and practitioners might utilize multi/mixed methods to further understand the context of individual experiences within implementation contexts (Uher, 2018).
Conclusion
High-fidelity implementation of evidence-based practices is an important component of our nation's agenda to promote better outcomes for students (Lyon & Bruns, 2019). However, a research-practice gap exists, which is characterized by the discrepancy between practices that have empirical evidence supporting their effectiveness and those that are actually implemented in everyday school settings (Owens et al., 2014). In schools, reliable and pragmatic measures of ATE have the potential to support successful implementation efforts in schools to enhance student outcomes and further public health initiatives. This study supports these efforts by adapting and refining a scale that measures ATE for use in schools among general education teachers, who represent front-line implementers of universal, prevention-focused EBPs.
Footnotes
Declaration of Conflicting Interests
The authors declared the following potential conflicts of interest with respect to the research, authorship, and/or publication of this article: Dr. Lyon is an associate editor at Implementation Research and Practice, but he had no role in the review or editorial decision making of this paper.
Funding
The authors disclosed receipt of the following financial support for the research, authorship, and/or publication of this article: This work was supported by The Institute of Education Sciences. Organizational Assessment for Strategic Implementation in Schools [OASIS]; R305A160114; The National Institute of Health, NLM T15-LM007124 training postdoctoral slot to JLM.
Appendix A
Exploratory Factor Analysis Loadings.

| 1 | 2 | 3 | |
|---|---|---|---|
| S-EBPAS01 | 0.708 | 0.158 | 0.005 |
| S-EBPAS02 | 0.857 | 0.063 | −0.100 |
| S-EBPAS04 | 0.915 | −0.023 | −0.145 |
| S-EBPAS05 | 0.792 | 0.098 | 0.123 |
| S-EBPAS07 | 0.920 | 0.053 | 0.030 |
| S-EBPAS08 | 0.924 | −0.030 | 0.002 |
| S-EBPAS09 | −0.024 | 0.924 | 0.000 |
| S-EBPAS10 | 0.034 | 0.934 | 0.004 |
| S-EBPAS14 | 0.118 | 0.741 | 0.032 |
| S-EBPAS15 | 0.090 | 0.793 | −0.033 |
| S-EBPAS19 | 0.195 | −0.083 | 0.817 |
| S-EBPAS20 | 0.096 | 0.028 | 0.856 |
| S-EBPAS21 | 0.007 | 0.159 | 0.840 |
| S-EBPAS22 | −0.022 | 0.294 | 0.763 |
Note. RMSEA = .124, CFI = .979, TFI = .964, SRMR = .031, N = 220. RMSEA = root mean square error of approximation; SRMR = standardized root mean square residual; CFI = Comparative Fit Index; TLI = Tucker–Lewis Index; S-EBPAS = School Evidence-Based Practice Attitude Scale.