
Abstract
Plain language summary
The field of implementation science needs better approaches for understanding how context (i.e., constraints and opportunities in the implementation setting) and process (i.e., the actions and steps taken during implementation) interact over the course of implementation. Such information would be very useful for understanding the success or failure of specific implementation strategies, which are specific techniques used to increase the adoption, implementation, and sustainability of a specific intervention. This article explains a method to assess the intersection of implementation context and implementation process that we developed to better understand issues that could help explain the effectiveness of an implementation strategy for an intervention for housing people who are experiencing chronic homelessness and who have both a diagnosed substance use disorder and serious mental illness. The method combines two popular implementation tools, the Stages of Implementation Completion and the Consolidated Framework for Implementation Research. Using this method resulted in a better understanding of differences in implementation performance at each of the organizations and how we might improve the implementation strategy. This understanding was better than what we had learned from other approaches we had used before this. We provide some suggestions for how the method can be strengthened for use in other studies.
Keywords
Establishing effectiveness of strategies for integrating evidence-based interventions (EBIs) is a primary goal of implementation science (Bernet et al., 2013; Powell et al., 2012, 2015; (Proctor, Powell et al., 2013)). However, this focus on effectiveness has overshadowed the need to understand factors that can help explain the success or failure of a specified strategy (Estabrooks et al., 2018; Powell et al., 2019). Understanding the “how” and “why” underlying differential performance of an implementation strategy under various conditions is essential for improving decision-making to optimize its fit with a particular implementation setting (Powell et al., 2019). As such, methods allowing for assessment between implementation context and process at multiple levels, across organizations, and over time would be a particular benefit to the field (Alexander & Hearld, 2012; Powell et al., 2019). We provide a description of a mixed method procedure for assessing factors related to the intersection between implementation context and process that was employed in the pilot study of the Housing First Technical Assistance and Training (HFTAT) program (Ahonen et al., 2017; Watson et al., 2014). This approach combines two tools often used in implementation research—the Stages of Implementation Completion (SIC; Chamberlain et al., 2011) and the Consolidated Framework for Implementation Research (CFIR; Damschroder et al., 2009)—in a novel way. We conclude with thoughts as to how the approach can be utilized to maximize its benefits within an individual study.
The need to investigate the intersection between implementation context and process
Implementation strategies should be selected with attention to both determinants of implementation (i.e., barriers and facilitators) existing within a local context and the process(es) most likely to be successful in addressing them (Oxman et al., 1995; Powell et al., 2019; Wensing et al., 2010). The intersection between these two facets of implementation is particularly important, as the implementation context is essentially the set of circumstances that shape constraints (i.e., barriers) and opportunities (i.e., facilitators) affecting the implementation process (Alexander & Hearld, 2012; Griffin, 2007; Johns, 2006; Mowday & Sutton, 1993). As such, a better understanding of the intersection between context and process can illuminate factors affecting an implementation strategy’s ability to facilitate integration of an EBI in a specified setting. This is a challenging task, considering both context and process are complex and difficult to measure (Alexander & Hearld, 2012; Kitson et al., 2008; Powell et al., 2019). To heighten this complexity, context and process both should be understood as multifaceted (i.e., existing across many levels or domains) and dynamic (i.e., changing over time) constructs (Alexander & Hearld, 2012; Powell et al., 2019; Rousseau & Fried, 2001). However, there is often a lack of consideration of the multiple dimensions of context that exist for an implementing organization (Aarons et al., 2011; Damschroder et al., 2009; Johns, 2006). For instance, prior studies have focused largely on the internal organizational setting over external factors (e.g., social climate, community infrastructure, the legal environment) that can play just as important of a role in the implementation process (Watson et al., 2018). Moreover, context is often treated as static (Johns, 2006), with data only being collected at a single time point, as in cases where organizational readiness, a questionable predictor of implementation success (Weiner et al., 2020), is collected only at a study’s baseline. While multiple data collection points can be added to assess change in context over time, quantitative measures can be inadequate for understanding important nuances, and potentially richer qualitative data are often collected at fewer time points relying on retrospective information that is subject to recall bias (Grossoehme & Lipstein, 2016; Johns, 2006).
A similar but different problem exists in relation to implementation process in that it is regularly conceptualized as dynamic; however, process data often are limited in their ability to reflect changes over time (Plano Clark et al., 2014). For instance, qualitative interviews often only reflect prospective planning or retrospective execution of an intervention (Plano Clark et al., 2014), and longitudinal designs with more frequent data collection points can make up for this issue. However, existing longitudinal studies have been criticized by organizational researchers for failing to pay appropriate attention to temporal qualities during data analysis (Curry et al., 2015; Plano Clark et al., 2014). Another more quantitative approach is to record activities recognized to be key to the implementation process as they are completed over time (Chamberlain et al., 2011; Saldana, 2014); however, this approach is limited in its ability to understand the deeper nuances underlying process-related results.
Longitudinal mixed methods are particularly well suited for addressing the above-noted limitations, as they can assess complex interactions among phenomena of interest as they occur over time (Miller et al., 2013; Palinkas et al., 2010). In addition, longitudinal mixed method designs allowing for cross-context comparisons are more attuned to identifying theoretically generalizable patterns needed within the field (Alexander & Hearld, 2012; National Cancer Institute, 2018). While mixed methods are generally considered a cornerstone of implementation science training (Albright et al., 2013; Miller et al., 2013; Padek et al., 2018; Proctor, Landsverk et al., 2013), there is limited guidance on how best to apply them longitudinally within implementation studies and within health services research generally (Palinkas & Rhoades Cooper, 2017; Plano Clark et al., 2014).
We provide a detailed description of a mixed methods approach for assessing the intersection between implementation context and process as an alternative to the approaches described above. As previously stated, the approach combines the SIC and CFIR to provide a robust understanding of how the implementation context and process interact and unfolded over time. We conducted a cursory review of the literature in Google Scholar to assess the novelty of the approach. We searched for articles containing the phrases “Stages of Implementation Completion” combined with either “Consolidated Framework for Implementation Research” or “Exploration, Preparation, Implementation, and Sustainment” (EPIS), which we added to the search because it is a framework that can be used in a similar manner to the CFIR that also has high compatibility with the SIC. The search identified 46 articles with mention of SIC and one or both of the two frameworks. Only 12 of these articles combined use of the SIC with either CFIR (Albers et al., 2020; Ford et al., 2018; Kairy et al., 2019; Spoelstra et al., 2019) or EPIS (Aalsma et al., 2019; Aarons et al., 2017; Bowser et al., 2019; Dickson et al., 2020; Hartzler et al., 2017; Nadeem et al., 2018; Stadnick et al., 2019; Willging et al., 2016) in some fashion. None of these studies had enough detail to understand either how the SIC and qualitative data would be integrated/mixed, with the majority of descriptions suggesting the SIC was only used to measure the process component of implementation within a study guided by the chosen framework. In addition, only one study collected qualitative data (in the form of case management logs) that were frequent enough to be used in the manner we describe below (Bowser et al., 2019). Finally, Wang et al. (2015) have presented a methodology for mapping qualitative communication log data onto the SIC that is the closest application to the approach we present below; however, it was not clear if the analysis was guided by any particular framework.
Overview of the HFTAT study
The HFTAT is a multifaceted, distance-based implementation strategy that combines (1) eLearning and (2) 6 months of remote technical assistance to support implementation of the Housing First (HF) model (see Watson et al., 2018 for a full description of the HFTAT). HF is an EBI that serves chronically homeless individuals with co-occurring serious mental illness and substance use disorder, and it is demonstrated to lead improved health and social outcomes for tenants (i.e., service recipients; Padgett et al., 2006; Tsemberis, 1999; Woodhall-Melnik & Dunn, 2016). HF does not require sobriety or treatment/service compliance like more traditional housing programs but utilizes harm reduction-informed strategies to mitigate risks for tenants who chose to continue using substances. The adoption and proper application of this harm reduction component is a noted difficulty encountered in HF implementation, and one that the HFTAT was designed specifically to overcome (Watson et al., 2013; Watson et al, 2014; Watson et al., 2017). Furthermore, HF is an intervention requiring complex coordination between multiple contextual levels (e.g., individual, program, organization, community), making this pilot study an ideal case example for demonstrating a method that seeks to understand context-process interactions.
Three organizations (i.e., Org1, Org2, and Org3) participated in the HFTAT pilot study. Fidelity scores improved throughout the study for Org1 and Org2, but Org3’s score reduced slightly at the end (Watson et al., 2013; Watson et al, 2014; Watson et al., 2017). Consultants who delivered the HFTAT had collected detailed minutes over the implementation’s course that we were able to use along with implementation process data to investigate how context and process ultimately influenced organizational performance.
Method
The overall HFTAT pilot followed a longitudinal convergent parallel, mixed method design (i.e., concurrent but separate quantitative and qualitative data collection; Creswell & Plano Clark, 2011). The longitudinal aspect of the design falls under what Plano Clark et al. (2014) refer to as a multi-question/level variation study. The approach we describe below utilized available data in a complementary and elaborative manner (Palinkas & Rhoades Cooper, 2017): quantitative data measured each organization’s overall implementation process, while qualitative data assessed determinants of implementation as they unfolded over time. All procedures discussed below were approved by the Institutional Review Board of Indiana University (Protocol No. 1403631286).
Participating organizations
The three participating organizations were purposefully selected based on key differences to ensure findings were related to the HFTAT, rather than other similarities (e.g., geography, years in operation, housing type, size of population served, and familiarity with the HF model) that might exist across sites—a sampling approach that can improve theoretical generalizabilty, given a small number of cases (Eisenhardt, 1989; Glaser & Strauss, 2009). All three programs were located in different US Midwestern states. Org1 was located in a major city and had not yet started delivering any housing services when we began HFTAT delivery. Org1 provided project-based housing (i.e., all units were in a single building), housed less than 50 tenants, and had no experience running HF programming or any other housing model due to its newness. Org2 was located in a suburb, had been operating for 49 years, provided project-based housing, housed approximately 200 tenants, and required an abstinence-only approach that was philosophically incompatible with HF. Org 3 was located in a large city, was in operation for 25 years, provided scattered-site housing (i.e., all housing was located in multiple buildings), housed approximately 375 tenants, and was operating using an HF approach with an expressed desire on the part of administration to improve its delivery of the model.
Measures and procedure
The quantitative SIC measure was tailored for the pilot using standardized SIC adaptation procedures (Saldana et al., 2020). The HFTAT SIC comprises 56 date-driven items that measure and monitor key activities demonstrated to be important to the implementation process. Key activities populate eight stages (Stage 1 = Engagement with HFTAT through Stage 8 = Competency in HFTAT Delivery) that are organized into three phases: pre-implementation, implementation, and sustainability. Numerous analyses across interventions have replicated the SIC’s reliability and ability to predict implementation success (Saldana et al., 2012, 2020). The SIC produces three scores: duration (time to complete implementation activities), proportion (percentage of activities completed), and final stage (the furthest point in the implementation process achieved). SIC scores are at each stage (eight stages) and phase (three phases). The SIC is an online web-based data collection, scoring, and analytic tool. All data were entered directly into the website (as activities were completed during the course of implementation) by the lead author and the consultant who led delivery of the HFTAT, where data were scored and validated for analyses.
Qualitative data were derived from meeting minutes written by the two HFTAT consultants who were HF and harm reduction experts with prior experience providing face-to-face HF technical assistance and training prior to this project. Consultants conducted weekly, 1-hr-long phone meetings separately with each organization during the 6-month course of implementation. Meeting participants included members of the implementation team (e.g., administration and frontline staff identified as implementation champions) from each organization. These minutes were not collected by the consultants for research purposes; however, they are detailed, as consultants recorded primary concerns raised during the meetings, who from the agency raised them, and any response/solutions provided by the consultants—they also directly quoted participants when possible. As such, these data provide considerable information related to both the implementation context and process. CFIR-guided analysis of the minutes is described below.
Analysis
There were several stages related to the combined SIC-CFIR analysis. This started with separate analysis of data pertaining to each measure and then two levels of mixed method analysis. Throughout this process, we sought to describe overall trends as they evolved over time, rather than formal hypothesis testing.
SIC data included a standardized log of activities completed by each site and the date the activity was completed. As noted previously, proportion and duration scores were calculated for each stage and phase. The Duration Score accounts for the possibility that activities are not completed sequentially within a stage, and that a site might be in multiple stages at a time. It does this by calculating the duration score based on the first and last date of activity completion, regardless of sequencing. Further, a site might have completed a stage quickly but not completed all the activities within that stage. The focus on both scores, therefore, permits an evaluation of quality and quantity, which are both equally important to implementation success. The Final Stage Score indicates the last stage achieved in the implementation process (i.e., from Stages 1 to 8). The SIC records two key implementation milestone outcomes: achievement of (1) program start-up and (2) competency. SIC data were observed for patterns of missingness related to implementation activity completion with four types of missing data: (1) truly not completed, (2) completing previously for a previous implementation effort, (3) not applicable to this implementation, and (4) completed but the date of completion was unknown. Given the small number of organizations in the current project, SIC analyses were limited to descriptive comparisons and observed patterns.
The CFIR (Damschroder et al., 2009; Hsieh & Shannon, 2005), which guided qualitative analysis, comprises five domains: (1) intervention characteristics, (2) implementation process, (3) characteristics of individuals, (4) inner setting, and (5) outer setting. The first and second authors conducted a deductive content analysis of he consultation minutes guided by the CFIR as an a priori coding structure. Using MAXQDA data analysis software (MAXQDA: Qualitative Data Analysis Software for Windows & Mac, n.d.), the researchers separately coded the data using “domain codes” corresponding to the CFIR and “determinant codes” marking each CFIR-coded passage as a barrier or facilitator. To establish agreement, both researchers reviewed the entire dataset, noting coding discrepancies and discussing and revising the codes to achieve 100% agreement. The findings were subsequently discussed with one of the consultants to ensure they accurately represented the intent and understanding of the issues encountered while working with each organization (Miles et al., 2013).
Mixing was carried out through a data transformation process (i.e., converting qualitative data into quantitative data) to better understand how the determinants changed over the course of implementation (Creswell & Plano Clark, 2011; Palinkas & Rhoades Cooper, 2017). First, we assigned each set of meeting minutes to the specific SIC phases in which they occurred. It is important to note that minutes did not fully capture SIC Phase 1, which is primarily concerned with pre-implementation activities prior to HFTAT consultations. Furthermore, consistent with the non-linear nature of the SIC discussed above, a specific week’s minutes could be assigned to more than one phase. Second, we calculated the frequency of barriers and facilitators across the SIC phases and by the CFIR domain across the SIC Phases to understand what types of determinant-related issues were raised most frequently in each SIC phase. Third, we created a matrix displaying each coded selection of text by the CFIR domain and identified which phases were impacted by that selection. This provided a deeper understanding of the relative impact/importance of each barrier and facilitator (something frequency counts are not adequate for) as it related to the implementation process and how they evolved. Finally, we compared the complementary results of the previous analyses to form a more complete picture of the overall implementation.
Results
Results of the three analytic approaches are described separately below.
SIC
Table 1 displays results of the SIC analysis. All agencies completed over 80% of activities in each phase with the exception of Org3, which only completed 71% of Phase 3 activities. Regarding duration, Org1 took the longest to complete each phase and the overall implementation process, but Org1 also completed the highest proportion of activities, missing only three throughout the entire implementation process. By contract, Org2 took the least amount of time to complete the entire implementation process, finishing pre-implementation within the optimal timeframe (between 3 and 9 months) and missing only six recommended activities. Org2 was also the only site to reach competency. Finally, Org3 had the shortest Phase 3 duration and a lower proportion of recommended implementation activities completed than the other two sites. Importantly, three of Org3’s implementation activities (e.g., staffing, meetings, and updating of policies and procedures) were coded as not completed due to having been completed prior to the beginning of implementation activities.
SIC proportion and duration scores by phase for each organization.

SIC: Stages of Implementation Completion.
This was the only organization to reach competency.
Frequency of determinants by SIC phase
Table 2 presents the frequency of implementation determinants—i.e., barriers and facilitators—for each organization. The phase-based frequency totals on the left consider each mention of a determinant within a phase as unique, thus counting determinants spanning more than one phase. The totals account for the possibility that determinants might have had a larger influence on the overall implementation process if they impacted more than one implementation phase at a time. Based on these totals, Org1 barriers were less predominant than facilitators (83 vs. 106), while the opposite was true for the other two organizations (Org2 = 76 vs. 60, Org3 = 239 vs. 135). Of particular note, Org3’s consultation meetings were the most barrier-focused; barriers accounted for 64% of all determinant mentions in comparison with 44% and 56% for Org1 and Org2, respectively.
Frequency of barriers and facilitator mentions in consulting minutes by organization and SIC phase.
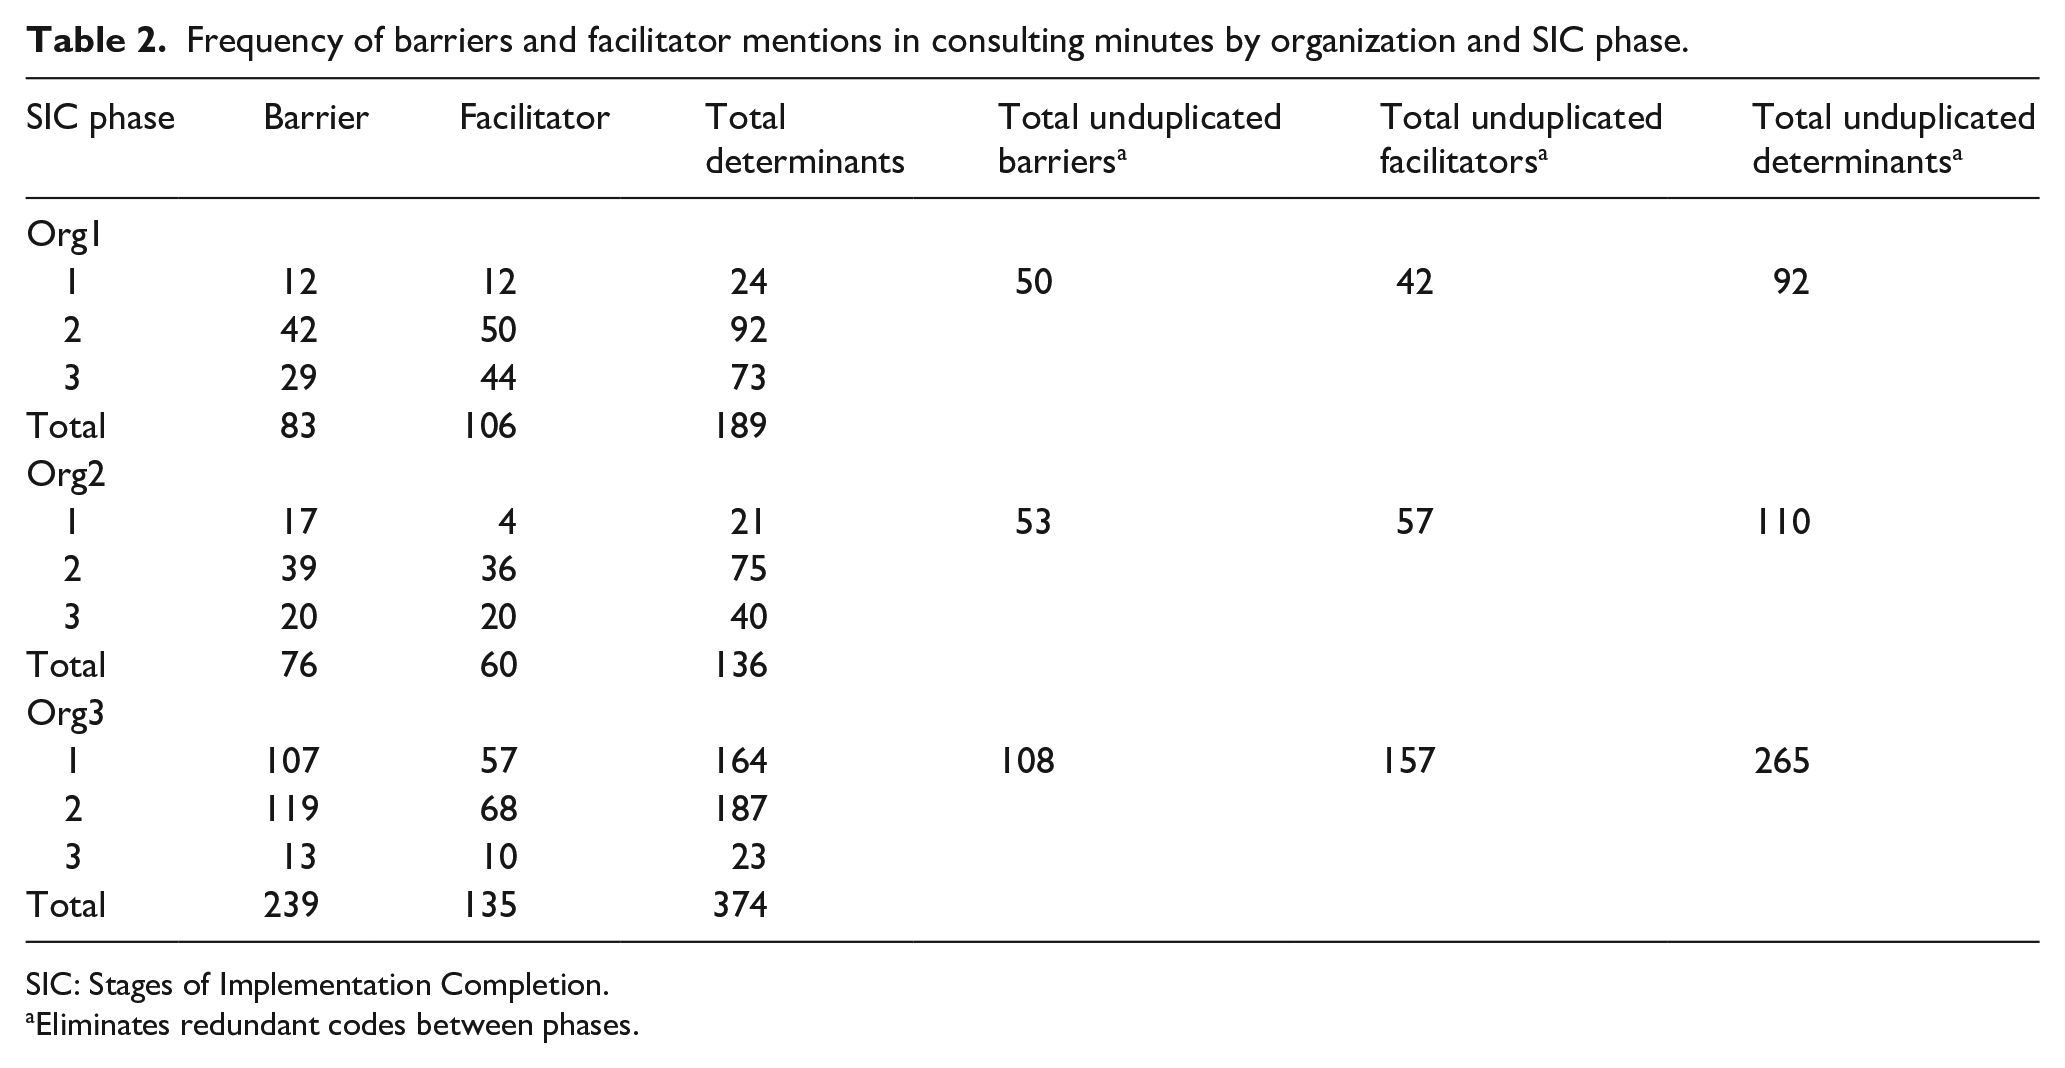
SIC: Stages of Implementation Completion.
Eliminates redundant codes between phases.
A different pattern emerged when looking at the unduplicated totals on the right. When we eliminated the double counting that occurred when one set of consultation minutes (and thus the determinants coded within it) applied to more than one phase, barriers were more predominant for Org1 (50 vs. 42), while the opposite is true for the other two organizations (Org2 = 53 vs. 57 and Org3 = 108 vs. 157). Furthermore, Org3’s consultation meetings were the least barrier-focused, accounting for 41% of all unduplicated determinant mentions in comparison with 54% and 48% for Org1 and Org2, respectively.
Determinants by CFIR domain and across SIC phases
Figure 1 displays the frequency of barriers and facilitators by the CFIR domain and SIC phase for each organization, as well as the frequency of unique barriers and facilitators pertaining to each CFIR domain. We only present results for the two CFIR domains that received the most unique codes within the consultation minutes: implementation process (Org1 = 45, Org 2 = 45, Org3 = 56) and the inner setting (Org1 = 39, Org 2 = 45, Org3 = 158). We focus on these two CFIR domains in the remainder of this article, as the other codes were of insufficient frequency to interpret impact or provide strong illustration for the methodology of focus. However, we have included an expanded figure illustrating results for all domains in Appendix 1.

Frequency of implementation process and inner setting determinants by the CFIR domain and SIC phase for each organization.
Figure 1 also illustrates how the determinants unfolded over the SIC phases and allows comparison of patterns between the organizations for the implementation process and inner setting domains of focus. First, it is important to note that generally there are more determinants identified in Phase 2, for all organizations. This could result from this phase having more overlap with the other two phases, but also because this phase is the longest phase of implementation with programs delivering services and working toward doing so with competency. As a result, a greater number of consultation minutes from which determinants could be identified were documented during this phase. Looking at the implementation process, Org1 had considerably more facilitators in all phases, suggesting the implementation benefited considerably from factors related to this domain. Org2 had more than double the number of barriers in comparison with facilitators in Phase 1 but almost equal number of both types of determinants in Phases 2 and 3. Finally, Org 3 had considerably more barriers in Phases 1 and 2, and then slightly more facilitators in Phase 3, suggesting the implementation process was generally successful with only minor issues remaining at the end of the HFTAT. Regarding the inner setting, Org1 had considerably more barriers in every phase, suggesting the issues encountered related to this domain were more problematic for implementation than they were for the other two organizations (which each had a similar number of barriers and facilitators in each phase).
How inner setting and process determinants unfolded
Qualitative analysis upheld the assertion that both the inner setting and implementation process had considerable influence on implementation success in the programs, while also demonstrating which individual determinants were most important in terms of their impact on implementation and helping to explain the different frequency patterns observed among the organizations that are displayed in Figure 1.
Regarding Org1, the high frequency of inner setting barriers was demonstrated to be largely rooted in the behaviors of the property manager whose prior experience conflicted heavily with the HF approach. This resulted in significant struggles as the program began to house tenants in Phase 2. As an example, the property manager created new rules and policies that service staff saw as arbitrary and highly punitive, such as a rule allowing the banning of visitors “for life” without any guidelines relating to the types of behaviors that could lead to this banning (5/3/16). However, this issue was largely addressed through facilitators identified as part of the implementation process domain such as developing strong procedures to address lack of communication between property management and service staff: “Regular meetings between partners [are happening] every Wednesday. [There is] Great rapport between parties . . .” (2/23/16). Process-related data also demonstrated Org1 benefited from being a new and developing program, as they were able to quickly develop new HF-oriented policies to address issues as they arose because the program understood the “benefits of having a policy for everything no matter how small . . . We are actively working on ensuring we have these” (6/28/16).
The barriers in Org2 were mostly rooted in pre-existing inner setting policies and practices that conflicted with harm reduction in different ways, such as the use of breathalyzers to test tenant sobriety (4/1/16). However, Org2 had a robust culture of learning that easily addressed barriers and helped facilitate change during Phases 2 and 3. One such example is regular case management meetings where they would take time to “talk about what we used to do [in an abstinence model] versus how we would do it now [as a HF program]” (7/22/16). Findings related to the implementation process domain showed Org2 proactively identified barriers to implementation planning and addressed them quickly through concrete actions. For instance, many opinion leaders in the organization were not completely bought in, but this was solved largely through targeted education provided to their board of directors who were then “very supportive despite some initial resistance” (10/14/16). While efforts to improve administration’s attitudes were mostly successful, there was minor difficulty getting the property manager to buy into the model that persisted through Phase 3 because of concerns “about damaging relationships with landlords” (7/22/16).
Org3’s history as an HF organization was a strong facilitator that seemed to positively affect the inner setting via a robust implementation climate, as Org3 already had the staffing and infrastructure to support the intervention. However, inner setting facilitators were offset by a number of barriers. Org3’s case managers were more comfortable dealing with behavioral health issues than they were housing: “We’re [case managers] getting into more of a service role related to housing, not behavioral health [which was the previous focus of case management]” (8/30/16). This is because, unlike the other two organizations, Org3 case managers were contracted out from external mental health service agencies and demonstrated difficulty understanding overlaps between housing and behavioral health issues. This was a particularly large barrier in Phase 1 that subsided over time. The abundance of Org3’s implementation process barriers appeared to be related to competing organizational demands that made engagement in the HFTAT a low priority, as demonstrated by difficulties getting staff to complete eLearning intervention training modules: “Our staff has been really busy [with other obligations]” (11/29/16); “Our older [more senior] staff are behind because they are trying to complete all of their annual training[s]” (2/6/16). However, possibly the biggest factor negatively impacting implementation was that the Chief Executive Officer who was the primary person backing HFTAT participation resigned from Org3 in Phase 1 (1/31/17), causing a significant disruption across the entire organization. Because of all these issues, the majority of implementation plan execution took place in Phase 3.
Discussion
The combined SIC-CFIR approach provided a more nuanced and complete understanding of the issues impacting implementation during the HFTAT pilot than either approach would have provided alone. Moreover, the contribution of each data type (i.e., quantitative and qualitative) and stage of the analysis process as they apply to each organization and across the entire sample is outlined in Table 3.
Contributions of each analysis to the overall conclusions.

SIC: Stages of Implementation Completion.
Individual determinants seemed to have a bigger relative impact on implementation success based on the number of SIC phases they affected. When looking at the entire implementation process, Org1 was the only site to have a higher frequency of unique barriers compared to facilitators but managed to complete a higher proportion of Phases 2 and 3 activities than the other two organizations. An explanation for this that developed from the analysis is that there were more barriers impacting multiple phases of the implementation than there were facilitators (see Table 2). This is an interesting phenomenon that would not have been recognized using a single analysis approach, and there is a need for better understanding of the impact of determinants on implementation outcomes (Birken & Nilsen, 2018). In particular, previous work has questioned whether determinants have uniform or differential effects across implementation phases, and a combined SIC-CFIR approach such as the one described here could be useful for addressing such a question (Palinkas, 2018).
Implementation context and process were shown to be connected through climate-related factors in the inner setting that made sites more or less responsive to addressing barriers, which is consistent with prior research demonstrating characteristics of an organization’s climate enhance its ability to adapt to change (Dooley, 1997; Fixsen et al., 2019). For instance, Org1’s newness meant it did not have any pre-existing policies or procedures to compete with the HF implementation, thus allowing Org1 to respond quickly and efficiently when barriers were identified over the course of the implementation process. Earlier research suggests climate-related factors can increase an organization’s adaptability to change (Dooley, 1997), and this might explain why Org2 was the only site to reach competency, despite its abstinence-only history. Finally, Org3 was overtaxed due to significant competing priorities that interfered with the ability to address barriers quickly and efficiently, despite being the only site with any pre-existing HF experience.
Study limitations prompt caution when interpreting the results and should be considered when replicating the approach. The absence of qualitative data related to Phase 1 prevented a more complete picture of the implementation process. We relied on minutes taken by consultants without formal qualitative research training. Hence, there may have been gaps in the record as a result. Nevertheless, these data provided rich context for the quantitative findings. As this was a pilot, the period of time over which consultation minutes were collected was only 6 months; however, SIC data reflected a longer period of time stretching back to initial engagement with each organization. Together, the findings offer important insight into the role of individual determinants and processes related to implementation. While the small sample size is another limitation, this does not negate the ability to demonstrate usefulness of the method, as implementation studies often have small sample sizes, and the use of mixed methods and purposeful sampling strategies can respectively add depth to the findings while also making them more theoretically generalizable (Alexander & Hearld, 2012; Eisenhardt, 1989; Glaser & Strauss, 2009; National Cancer Insitute, 2018). Furthermore, there is no limitation in sample size for any future studies that might apply this approach.
The approach can be strengthened in future research to address a noted need for assessing implementation performance within the confines of an identified implementation strategy (Powell et al., 2019). For example, by planning prospectively to collect SIC- and CFIR-related data, consultation meetings could be recorded and transcribed prior to analysis. Also, additional qualitative data collection activities (e.g., interviews and focus groups) could occur following analyses of consultation data to probe specific issues raised and how they might have been impacted by a particular implementation strategy. Collecting data to reflect Phase 1 of the implementation is difficult because these activities occur before an organization has consented to participate in research. However, researchers could take detailed minutes of preparatory activities and meetings that may be useful should the organization decide to fully engage with the study. Moreover, approaches to collecting longitudinal qualitative data should be integrated as best as possible with the implementation strategy to limit burden on practitioners: for instance, recording regular clinical supervision sessions and/or collecting official documents reflecting policies and protocols pertaining to the EBI of focus. It is likely that the method could be successfully executed using another determinant framework such as EPIS, and future application of the method would benefit from a broader examination of the chosen framework’s domains. We focused on the CFIR’s inner setting and process domains because these provided the strongest examples for demonstrating our methodological approach due to the variability in frequency of determinant codes among the study sites. Finally, the method is likely most useful in studies focused on complicated or complex EBIs (see Plsek, 2003), as the richness of information this method provides is likely not necessary for simpler interventions.
The full method presented is likely best applied as an approach for explaining what happened over the course of an already completed or failed implementation and is therefore likely to have greater scientific than practical utility. That said, analysis of qualitative data collected for the purposes of employing the method can be analyzed in an on-going, formative fashion to identify threats to implementation and make course corrections to the implementation strategy that are appropriate for the corresponding phase. Indeed, this is ultimately what HFTAT consultants did with Org3’s technical assistance. After struggling for a number of weeks due to competing priorities at the site, consultants shifted their approach to focus less on pre-established agenda items and more on issues of immediate concern to Org3. Once they adapted their focus, consultants reported a significant improvement in the implementation, and Org3 staff demonstrated high satisfaction with the HFTAT, despite initial struggles (Watson et al., 2018). Understanding an organization’s success or struggles with implementation of an EBI can also help practitioners identify possible threats to future sustainability, as noted determinants of sustainability have overlap with those of implementation (Luke et al., 2014; Palinkas et al., 2020). While the presented approach requires a certain level of mixed method expertise that is unlikely to be found in most community organizations, federally funded implementation initiatives often require an evaluation component, and practitioners could contract with an evaluator who possesses the necessary knowledge and skills. An evaluation utilizing this approach might also produce results of interest to funders, as it could help them assess grantee performance and identify issues that can guide future grantee requirements and funding decisions to enhance likelihood of future grantee success. A next step in development of the method as a practical tool would be to gauge its acceptability and feasibility among likely adopting practitioners.
Conclusion
This article described a longitudinal mixed method approach to combine the SIC and CFIR to produce a deeper understanding of implementation determinants and process in the context of the HFTAT implementation strategy. The SIC-CFIR analysis provided a more complete understanding of implementation than any one approach could have alone. Understanding the underlying factors impacting an organization’s implementation performance over time can guide decision-making to optimize the strategy’s fit within a particular setting. Future studies should proactively plan to utilize the method, whether using CFIR or another determinant framework, at the onset of an implementation project to maximize its usefulness.
Footnotes
Appendix 1
Acknowledgements
The authors would like to thank a number of individuals who supported this project. Valery Shuman and James Kowalsky who were the Housing First Technical Assistance and Training (HFTAT) consultants who collected the minutes used in our analysis. Holle Schaper and Mark Campbell assisted in the development of the HFTAT Stages of Implementation Completion (SIC) instrument, and Holle also assisted with the analysis of the SIC data. Ashley Kendall provided feedback on one of the later drafts of the article. Finally, we would like to thank the administrators and staff at the three sites who participated in the study; this work would not be possible without their involvement in the HFTAT pilot study.
Author’s note
Dr Watson was affiliated with Indiana University-Purdue University Indianapolis at the time data for this study were collected and the University of Illinois at Chicago when the final analysis reported in this article was completed. The article’s contents are solely the responsibility of the authors and do not necessarily represent the official views the funding organizations.
Declaration of conflicting interests
The author(s) declared no potential conflicts of interest with respect to the research, authorship, and/or publication of this article.
Funding
The author(s) disclosed receipt of the following financial support for the research, authorship, and/or publication of this article: This project was supported by grant funding from the National Institute on Drug Abuse (NIDA) R34DA036001 and the National Institutes of Health (NIH)/National Center for Advancing Translational Sciences (NCATS) KL2TR001106.