
Abstract
The physical meaning of phase difference controls the occurrence time of peak values of triangular series, which can be abbreviated as peak arrival time. This article describes a method for deducing the correspondence between the energy distribution characteristics in the time domain and the peak arrival time. The variation laws of acceleration time–history curve of natural seismic wave can be transformed into its energy distribution characteristics in time domain. Based on the needs of seismic engineering, this article proposes a conversion formula to describe the relationship between the peak arrival time and the energy distribution characteristics in the time domain. To ensure that the variation laws of acceleration time–history curve of artificial seismic waves are more consistent with those of natural seismic waves, a normal-fitting annealing algorithm is proposed based on the normal-fitting method. The proposed method not only considers the frequency distribution characteristics of the peak arrival time comprehensively but also optimizes the fitting parameters according to the actual situation. The results of all the experimental cases verify the rationality and reliability of the proposed method.
Keywords
Introduction
The ground motion characteristics of natural seismic waves are mainly described by three basic elements, which are amplitude, duration, and spectrum. 1 Natural seismic waves with the same three basic elements but different time–history envelope shapes are often used in simulation experiments as the ground motion input data. 2 It has been found that the elastoplastic displacement and internal force values calculated by the time–history analysis method are very different. 3 This phenomenon suggests that natural seismic waves with the same three basic elements can have completely different damage capabilities, and this is determined by the variation laws of acceleration time–history curves. In summary, the three basic elements of natural seismic waves produce a flawed evaluation of the seismic damage capability because they are unable to describe the variation laws of acceleration time–history curves, which can be seen as the energy distribution characteristics in the time domain.
In applying time–history analysis, the seismic design code requires two artificial seismic waves to be combined with five natural seismic waves as seismic input data for the calculation process. 4 To ensure that the structural dynamic response calculated by the artificial seismic waves conforms to the actual seismic damage law, not only the duration, magnitude, and spectrum of artificial seismic waves must be consistent with those of natural seismic waves, but also the variation laws of acceleration time–history curve must conform to that of natural seismic waves. 5
To satisfy the above requirements, a method based on an artificial phase difference spectrum is widely used. 6,7 The key to this method is to select a suitable probability density function to fit the frequency distribution characteristics of the phase difference spectrum of natural seismic waves and to use the fitting parameters to generate a random number representing the artificial phase difference spectrum, from which the artificial seismic waves are synthesized. 8
If the natural seismic waves are simplified to a uniformly modulated white noise process 9,10 or a narrowband time history, 11,12 it can be proved that there is a positive relationship between the frequency distribution characteristics of the phase difference spectrum and the variation law of the acceleration time–history envelope curve. That means the phase derivative has a controlling effect on the acceleration time–history envelope curve of seismic waves, and the acceleration time–history envelope curve of artificial seismic waves can be enhanced by optimizing the fitting effect of the frequency distribution characteristics of the phase difference spectrum of natural seismic waves.
At present, there are four main methods of fitting the frequency distribution characteristics of the phase difference spectrum of natural seismic waves: the lognormal distribution 13 –15 or gamma distribution 16 –18 is used for direct fitting, the normalized distribution 19,20 is used to fit the frequency distribution characteristics of the adjusted phase difference spectrum, and a combined uniform distribution and β distribution 21 is used to fit the grouped phase difference spectrum.
Although the above research has explained the intrinsic relationship between the frequency distribution characteristics of the phase difference spectrum and the variation law of the acceleration time–history envelope curve and proposed several fitting methods for the frequency distribution characteristics of the phase difference spectrum of natural seismic waves, the following problems remain: The assumption that the phase spectrum obeys the uniform distribution is used to derive the intrinsic relationship between the frequency distribution characteristics of the phase difference spectrum and the variation of the acceleration time–history envelope curve, but the phase spectrum is as regular as the phase difference spectrum.
22
In addition, there is a correlation between the samples of the phase spectrum, and this correlation is reflected by the phase difference spectrum. In fitting the frequency distribution characteristics of the phase difference spectrum of natural seismic waves, the fitting parameters are calculated based on the phase difference spectrum.
23
The nonrepeatability and unpredictability of natural seismic waves mean that the above fitting methods often fail to produce satisfactory frequency distribution characteristics in the artificial phase difference spectrum.
24
The research results show that the physical meaning of the phase difference spectrum of natural seismic wave can be expressed as peak arrival time. Moreover, the variation laws of acceleration time–history curve of natural seismic wave can be transformed into its energy distribution characteristics in the time domain. Based on the needs of seismic engineering, this article proposes a conversion formula to describe the relationship between the peak arrival time and the energy distribution characteristics in the time domain. To ensure that the variation laws of acceleration time–history curve of artificial seismic waves are more consistent with those of natural seismic waves, a normal-fitting annealing algorithm is proposed based on the normal-fitting method. The proposed method not only considers the frequency distribution characteristics of the peak arrival time comprehensively but also optimizes the fitting parameters according to the actual situation.
Relationship between peak arrival time and time-domain energy distribution characteristics
The relation between acceleration time–history curve and energy distribution characteristics in the time domain
It is found that the variation laws of acceleration time–history curves of natural seismic waves determine the energy distribution characteristics in the time domain, and the energy distribution characteristics in the time domain have a significant impact on their damage capabilities. Therefore, this article uses the energy distribution characteristics in the time domain to reflect the variation laws of acceleration time–history curves of natural seismic waves.
Assuming that the acceleration time history of the natural seismic wave is


As most natural seismic waves have only a single peak in their acceleration time–history curve, the mean energy value and energy variance in the time domain can be used to measure the concentrated area and the concentration of the energy distribution of natural seismic waves.
Peak arrival time and mean energy value in the time domain
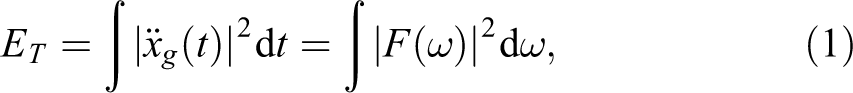
Applying a Fourier transform to the acceleration time history

To calculate the mean energy value
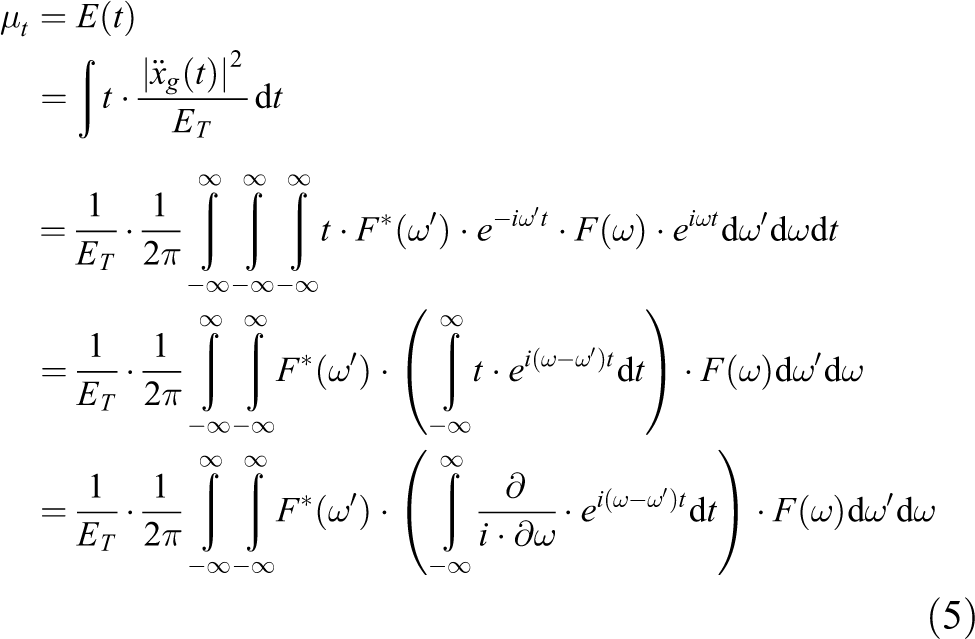
where

where

The complex Fourier vector in equation (7) can be rewritten as a combination of the amplitude spectrum and the phase spectrum, as shown in equation (8).

where

where
As shown in equation (9), if
Peak arrival time and energy distribution variance in the time domain
The energy distribution variance of natural seismic waves in the time domain is calculated as shown in equation (10).

As the relationship between the mean value of the energy distribution

The complex Fourier vector in equation (11) can be expressed as a combination of the amplitude spectrum and the phase spectrum, as shown in equation (12).

Substituting equations (11) and (12) into equation (10), the energy distribution variance of natural seismic waves in the time domain is shown in equation (13).

where
As shown in equation (13), the energy distribution variance of natural seismic waves in the time domain comprises the amplitude difference spectrum and the peak arrival time. If
The amplitude spectrum is assumed to be a smooth, slowly changing curve, and the mean value and variance of the energy distribution of natural seismic waves in the time domain are equal to those of the peak arrival times. To ensure that the artificial seismic waves have nonstationary intensity and frequency characteristics, a certain probability density function must be used to fit the frequency distribution characteristics of the peak arrival time of natural seismic waves. According to the fitting parameters, the artificial peak arrival time for synthetic seismic waves is generated. The fitting parameters not only directly determine the frequency distribution characteristics of the artificial peak arrival time but also indirectly control the energy distribution characteristics of the artificial seismic waves in the time domain.
Normal-fitting annealing algorithm
The above theoretical analysis results show that the frequency distribution characteristics of peak arrival time have an important influence on the energy distribution characteristics of natural seismic waves in the time domain. To ensure that the energy distribution of artificial seismic wave in the time domain is more consistent with that of natural seismic wave, a normal annealing fitting method with smaller fitting error is proposed in this article.
Normal-fitting method
A natural seismic wave from the 1999 Taiwan Chi-Chi earthquake (RSN3307_CHICHI.06_CHY086E.AT 2) is selected as the research object. This quake had a magnitude of 6.7, epicentral distance of 53.5 km, and focal depth of 16 km. The soil layers of the site primarily comprise rock and compact gravel. The natural seismic wave has a sampling frequency of 200 Hz and a peak acceleration of 103.469 gal. The acceleration time–history curve is shown in Figure 1.

Natural seismic wave acceleration time–history curve.
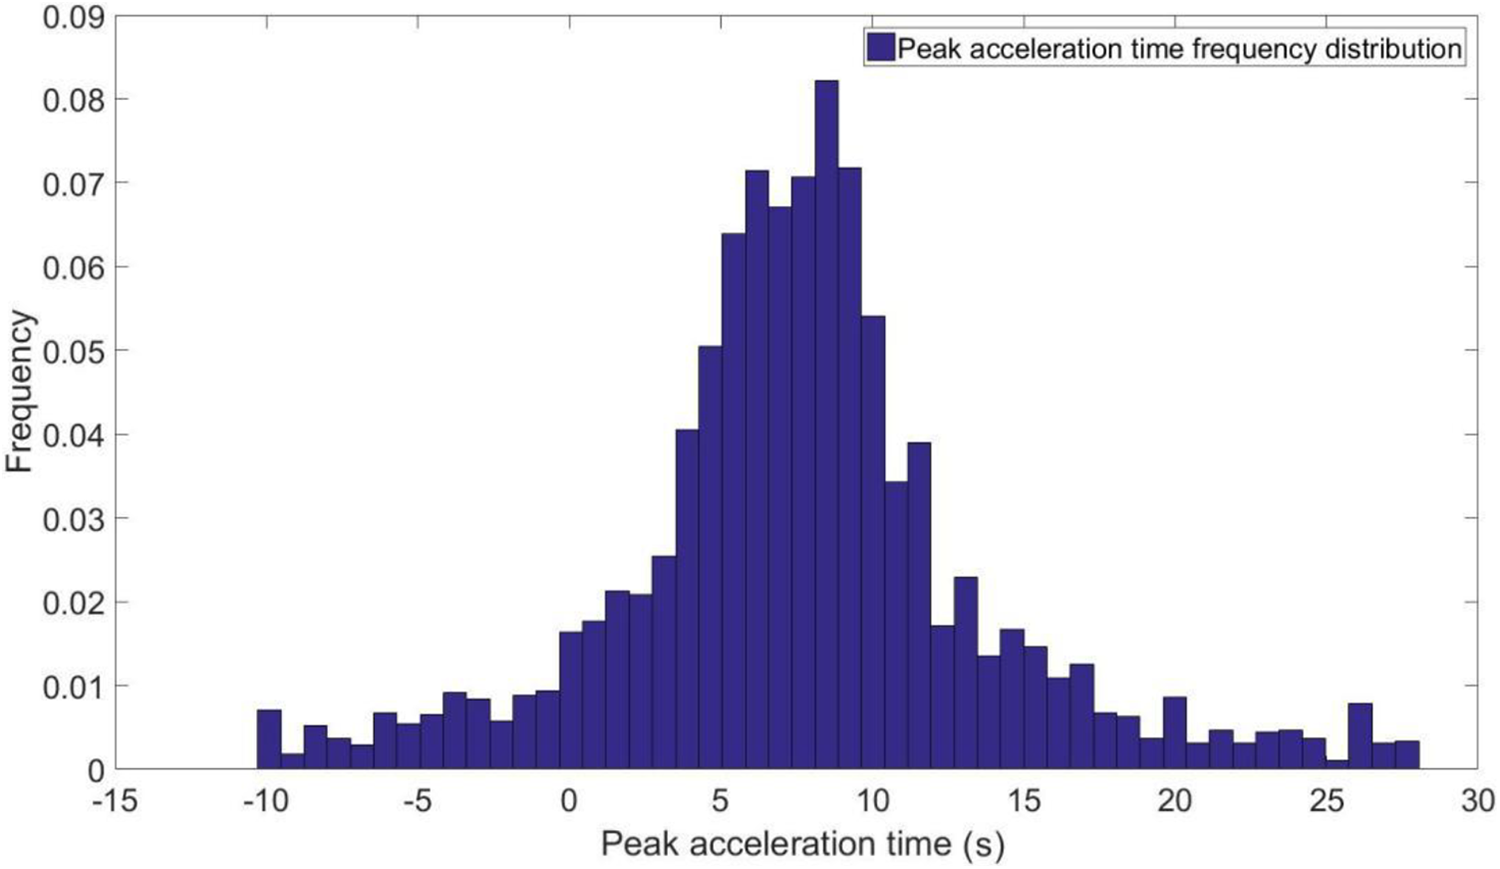
The peak arrival time can be converted to the phase difference spectrum, and the mean and variance of the frequency distribution directly reflect the energy distribution law of seismic waves in the time domain. Therefore, the peak arrival time is used instead of the phase difference spectrum to construct a frequency distribution histogram, as shown in Figure 2.

Peak acceleration time–frequency distribution of a natural seismic wave.
As shown in Figures 1 and 2, the frequency distribution of the peak arrival time of natural seismic waves is in the range [0, T]. There is a “positive change relationship” between the frequency distribution characteristics of the peak arrival time and the variation law of the acceleration time–history curve. Although the distribution frequency of the peak arrival time is gradually decreasing to the right of the maximum distribution frequency, the distribution frequency near the maximum peak arrival time appears to increase again.
Based on this, we adjust the frequency distribution range according to the periodic characteristics of peak arrival time of natural seismic waves and select the normal distribution model to fit the frequency distribution characteristics of peak arrival time. The key steps are now described.
The maximum distribution frequency of the peak arrival time of natural seismic waves corresponds to the abscissa x 0, and the frequency distribution range of the adjusted peak arrival time is calculated as shown in equation (14).

where
The peak arrival time in the range
Using a Fourier transform to perform spectral analysis, the peak arrival time was calculated according to the phase difference spectrum. The frequency distribution characteristics were adjusted to exhibit left–right symmetry. As shown in Figure 3, the frequency distribution characteristics of the adjusted peak arrival time of natural seismic waves are consistent, with x 0-centered and completely symmetrical sides. The mean μ and standard deviation σ of the normal distribution model are calculated as shown in equations (15) and (16).


Adjustment scheme of the peak acceleration time–frequency distribution.
Using the mean μ and standard deviation σ, a set of normally distributed random numbers is generated as the artificial peak arrival times. Artificial peak arrival times of less than 0 are moved to the other side of the coordinate axis by adding the duration T. Finally, the frequency distribution characteristics of the artificial peak arrival time and the acceleration time–history curve exhibit the “positive change relationship” once again.
Annealing algorithm for optimizing fitting results
Although the frequency distribution characteristics of the adjusted peak arrival time exhibit left and right symmetry, the nonrepeatability and unpredictability of natural seismic waves will still affect the other frequency distribution characteristics of the peak arrival time. For example, because of the random changes in high and low fluctuations, the distribution frequency of the peak arrival time of natural seismic waves does not rise or fall as steadily as the normal distribution probability density function curve. This will lead to fitting errors in the frequency distribution characteristics of the peak arrival time of artificial seismic waves. To solve the problem of the unstable distribution frequency of the peak arrival time of natural seismic waves, an annealing algorithm is proposed to reduce the fitting errors.
In the process of synthesizing artificial seismic waves, the fitting problem regarding the frequency distribution characteristics of the peak arrival time is essentially a global optimization problem with respect to the mean μ and variance σ. The annealing algorithm 25 is a global optimization technique for simulating the annealing process and is often used to find the optimal solution to a problem within a defined search space. The annealing algorithm is based on the physical process of solid annealing in nature, and its basic idea is to start from an initial solution and then apply a certain perturbation mechanism to produce a new solution. According to certain acceptance criteria, the algorithm then determines whether to replace the current solution with the new solution, and this iterative procedure continues until some termination condition is satisfied. Finally, the global optimal solution is output. The annealing algorithm is used in the proposed method to determine the optimal fitting parameters of the frequency distribution characteristics of the peak arrival time. The flow of the proposed process is shown in Figure 3.
The mathematical expression of the normal distribution fitting model is as shown in equation (17).
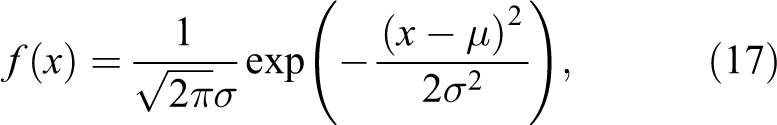
where μ is the position parameter and σ is the scale parameter.
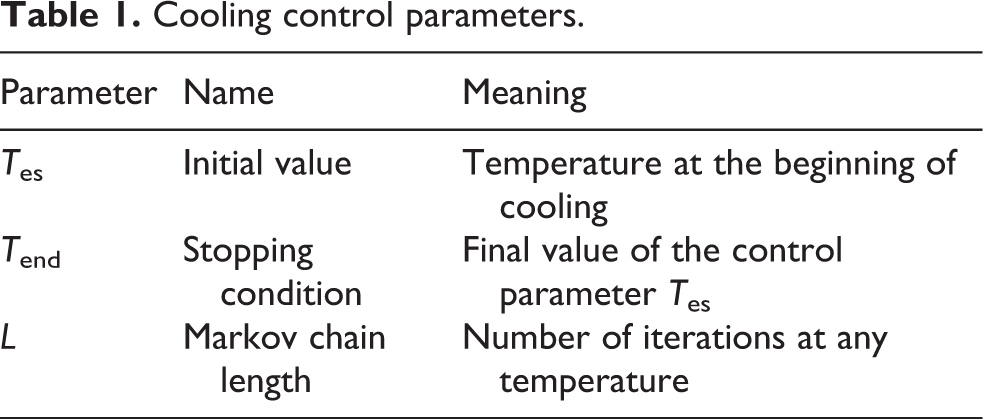
The process of the annealing algorithm is controlled by a cooling schedule, and the control parameters are listed in Table 1.
Cooling control parameters.
The target function is given by equation (18).

where
As shown in Figure 4, the flow of the simulated annealing algorithm is as follows: (1) Initial processing and set related parameters
Set the solution space matrix
The lower bound constraint
As the algorithm termination condition, TolFun is set to a small value to ensure that the algorithm stops when the solution is very close to the global optimum. The default value for TolFun in the simulated annealing toolbox is 1 × 10⁻⁶.
The temperature control strategy uses exponential cooling strategy to reduce the temperature parameters. (2) In the annealing simulation calculation, the temperature is changed to the cooling schedule of the next value (3) A new fitting parameter Xj
is generated by applying a perturbation to the current fitting parameter Xi
. (4) According to the Metropolis Criterion,
26
the new fitting parameters are accepted with a certain probability. If (5) Under temperature (6) Determine whether the temperature has reached

Normal distribution fitting annealing algorithm.
Comparison of fitting results
The adjusted peak arrival time was fitted using the normal distribution probability density function, and the calculated mean and standard deviation were taken as the initial solution and the new solution. The new mean and standard deviation were calculated using the normal distribution annealing algorithm proposed in this article. The initial solution and the new solution are summarized in Table 2.
Comparison of fitting parameters.
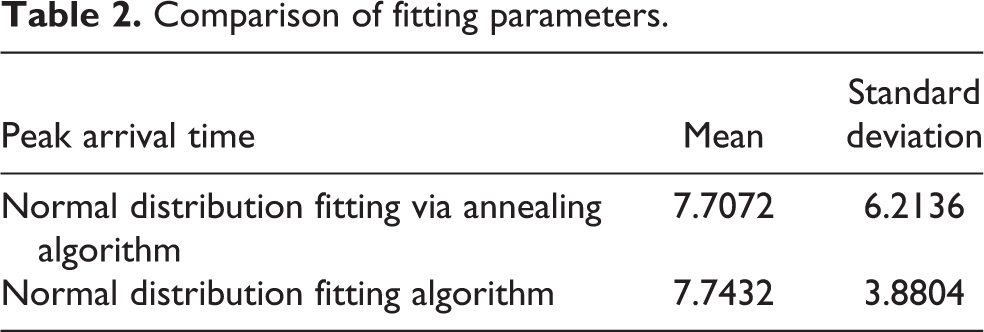
Figure 5(a) shows the frequency distribution characteristics of artificial peak arrival time 1 based on the optimal solution of the fitted parameters. Figure 5(b) shows the frequency distribution characteristics of artificial peak arrival time 2 generated from the initial solution of the fitted parameters.
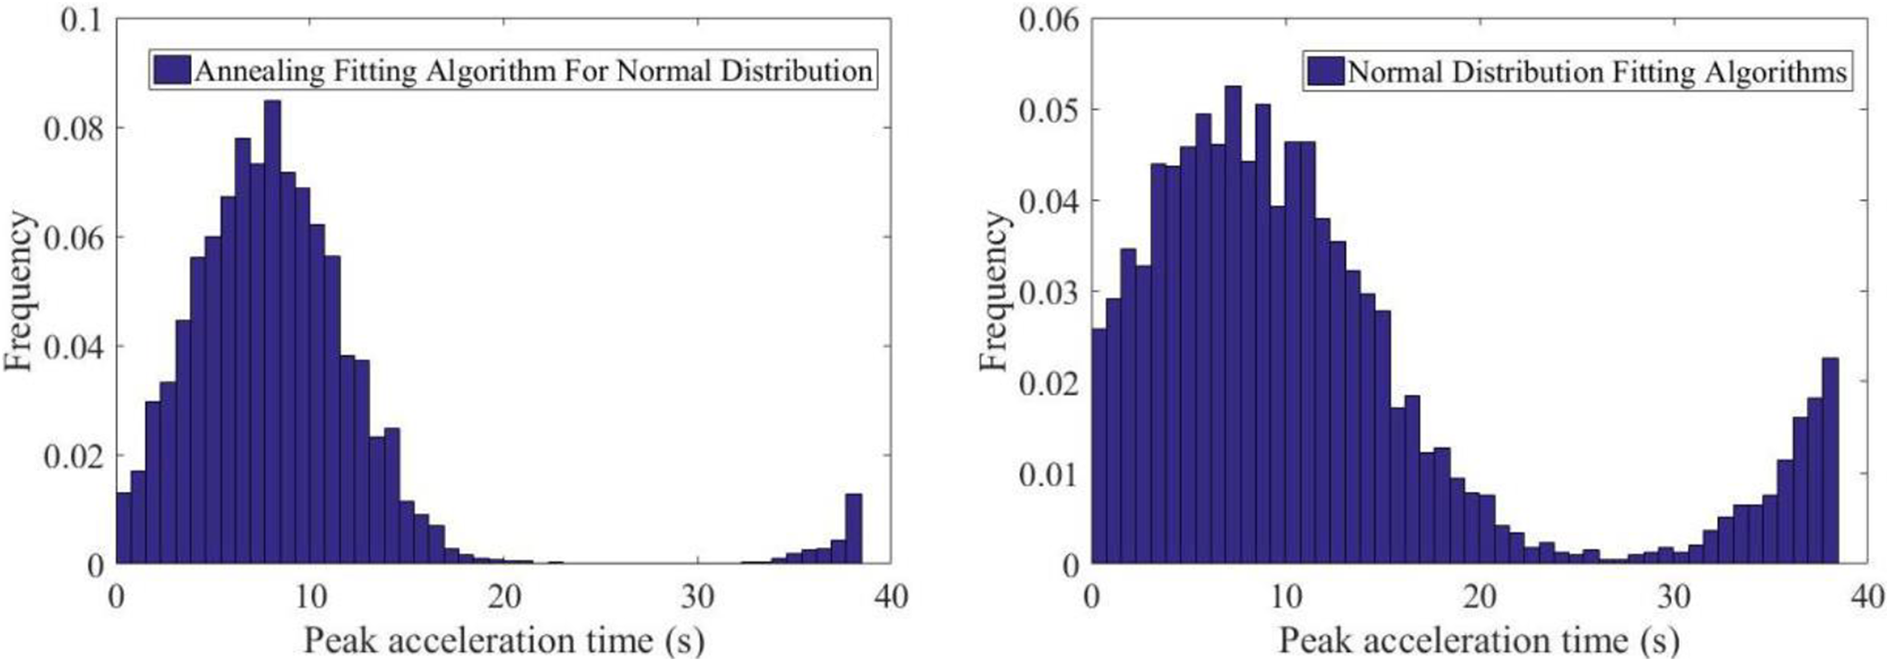
Normal distribution fitting of the peak acceleration time: (a) normal distribution annealing fitting algorithm; (b) normal distribution fitting algorithm.
The frequency distribution characteristics of artificial peak arrival time 1, generated from the optimal solution of the fitting parameters and shown in Figure 5(a), are compared with those of artificial peak arrival time 2, generated according to the initial solution of the fitting parameters. The frequency distribution characteristics of artificial peak arrival time 1 are much closer to those of the natural seismic wave than artificial peak arrival time 2. This indicates that it is feasible to apply normal fitting using the annealing algorithm proposed in this article to peak arrival time.
Figure 6 shows the evolution of the objective function, where the abscissa corresponds to the iteration number and the ordinate gives the objective function value. The final objective function value is 0.034973. As the annealing process progresses, the value of the objective function corresponding to the optimal solution found by the simulated annealing algorithm decreases until it finally converges after less than 600 iterations.

Evolution of the optimal solution objective function.
Method reliability verification
To accurately analyze the best fitting method for the frequency distribution characteristics of peak arrival time of natural seismic waves, 566 natural seismic waves corresponding to different site types, 27 fortification intensity and magnitude are selected as research objects, as summarized in Table 3.
Number of ground motions selected.

Four kinds of probability density functions, lognormal fitting algorithm, Thráinsson combination fitting algorithm, normal-fitting algorithm, and normal-fitting annealing algorithm are used to fit the frequency distribution characteristics of peak arrival time.
To accurately analyze the fitting effect of the above four probability density functions on the frequency distribution characteristics of peak arrival time, the control parameters of different fitting methods are calculated according to the peak arrival time of all natural seismic waves, and the random numbers representing the artificial peak arrival time are generated by using the control parameters. The square sum of fitting errors between the distribution frequency of artificial peak arrival time and those of natural seismic waves are calculated, as summarized in Table 4.
Average fitting errors of peak arrival time of 566 natural seismic waves.

Using different probability density functions to fit the frequency distribution characteristics of peak arrival time of all-natural seismic waves, and then comparing the sum of squares of errors corresponding to different fitting methods, the following conclusions are obtained: The probability density functions such as lognormal distribution fitting algorithm and Thráinsson combination fitting algorithm can only fit the characteristics of the peak arrival time near the maximum distribution frequency, while the normal-fitting algorithm and the normal-fitting annealing algorithm can fit the tail protrusion phenomenon of the frequency distribution of the peak arrival time of natural seismic waves. This can ensure that the arrival time of artificial peak is more consistent with that of natural seismic wave. Using lognormal fitting algorithm, Thrinsson combination fitting algorithm, normal-fitting algorithm, and normal-fitting annealing algorithm to fit the frequency distribution characteristics of peak arrival time of natural seismic wave, it is found that the square error of normal-fitting annealing algorithm is obviously smaller than that of other three fitting algorithms.
The above analysis shows that the normal-fitting annealing algorithm is the best fitting method for the frequency distribution characteristics of the peak arrival time of natural seismic waves. It not only has the least fitting error but also can simulate the tail protrusion phenomenon of the frequency distribution of the peak arrival time of natural seismic waves. This shows that the normal-fitting annealing algorithm can generate the artificial peak arrival time, which is consistent with the frequency distribution characteristics of the peak arrival time of the target natural seismic wave. In the case of the same amplitude spectrum, the normal-fitting annealing algorithm can ensure that the energy distribution characteristics and acceleration time–history curve of artificial seismic wave in the time domain are completely consistent with the target natural seismic wave.
Conclusion
To ensure that the variation laws of acceleration time–history curve of artificial seismic waves are consistent with those of natural seismic waves, a normal-fitting annealing algorithm has been developed for the frequency distribution characteristics of the peak arrival time of natural seismic waves. Based on the method derivation and the simulation results, the following conclusions can be stated:
Considering that the main phase value does not obey the uniform distribution, we found a positive relationship between the frequency distribution characteristics of the peak arrival time and the shape of the acceleration time curve. The fitting parameters of the frequency distribution of the peak arrival time of natural seismic wave can reflect the variation law of the acceleration time–history envelope curve.
The normal-fitting annealing algorithm has been proposed, which can determine the global optimal solution for the fitting parameters of the frequency distribution characteristics of peak arrival time. The proposed algorithm not only ensures that the frequency distribution characteristics of the artificial peak arrival time are roughly the same as those of natural seismic waves but also optimizes the variation laws of acceleration time–history curves of artificial seismic waves.
Footnotes
Declaration of conflicting interests
The author(s) declared no potential conflicts of interest with respect to the research, authorship, and/or publication of this article.
Funding
The author(s) declared the following potential conflicts of interest with respect to the research, authorship, and/or publication of this article: Beijing Natural Science Foundation (3204041, 1202008), BJAST-RD (PY2020AQ04), BJAST Budding Talent Program (BGS202005), and Beijing Postdoctoral Research Foundation.