
Abstract
Background:
The objective of this study is to examine magnocellular and parvocellular pathways differentiation based on checkerboard spatial frequency stimulation between normal and visually impaired individuals from athletes with mild traumatic brain injury.
Purpose:
Athletes who exhibited photophobia, and blurriness were subjected to 5 spatial frequency stimuli presented to the left and right eye, and both eyes simultaneously to determine the type of receptive field loss deprecation based on sports-related brain trauma.
Methods:
Checkerboard stimulation enables the measurement between 2 visual processing pathways and enables the determination of the integrity of visual processing through visual evoked potentials (VEPs).
Conclusion:
The principal results reflect P1 responses demonstrated distinct changes in amplitude from mTBI (>5 µV) from normal cohorts concluding higher P1 amplitude of the VEP in mTBI cohorts had increased after injury. Latency in P1 was not as distinct as amplitude changes. Our major conclusion is that most of the mTBI cohort exhibited receptive field loss across all the patients appears to be magnocellular process deprecation due to frequent instances of 8 × 8 and 16 × 16 spatial frequencies input as it relates to amplitude and latency output.
Keywords
Introduction
There are ~1.7 million new cases of mild traumatic brain injury annually in the USA. 1 Sports related mTBI are the most common type of concussion. 2 Athletes who used to consider occasional minor head trauma are now reporting similar common side effects, that is, photosensitivity, visual attentional deficits, and ocular motor problems.3,4 These effects are now being reported from athletes as young as 15 years old. 5
Deficits in visual-spatial systems have been detected using visual evoked potential waveforms to determine if there are differences in amplitude and latencies in time. 6 The initial negative amplitude resides at 70 to 80 ms, known as N75, whereas the larger positive amplitude occurs between 90 and 110 ms, known as P100. When the amplitudes drift from their designated time intervals, this is known as latency. VEP responses reflect the functional operation across visual pathways consisting of the retina, then the optic radiations and optic nerve, and finally the occipital cortex. 7 Visual evoked potentials are used to compare the averages between a control group and focus group consisting of a range of issues, that is, glaucoma, optic neuropathy, and amblyopia.
Additionally, VEPs measure processing between 2 major pathways of the visual system: parasol retinal ganglion cells followed by the magnocellular pathway, and midget retinal ganglion cells followed parvocellular pathway.4,8 The ventral stream receives its primary source from the parvocellular layer of the lateral geniculate nucleus of the thalamus pathways. From there, ventral pathways go through V2, V4 and the inferior temporal cortex (IT); and dorsal pathways starts at V1 then the middle temporal area (MT) and from there, parietal cortex.4,9 Parvocellular cells feed into the ventral stream and magnocellular cells feed into the dorsal stream. 16 Koniocellular (K-cells) pathways are located ventral to each parvocellular and magnocellular layer of the lateral geniculate nucleus. K-cells play a role in determining brightness and color contrast. 10
The checkerboard stimulus has been utilized to activate the magnocellular and parvocellular pathways. The parvocellular pathway responds to stimuli that have a small grid size and high contrast and have slow contrast reversals. On the other hand, the magnocellular pathway responds to stimuli that large grid size, low contrast, and have fast contrast reversals. This differential response allows researchers to assess the functioning of these 2 visual processing pathways. This strategy can be used to study the responses of the magnocellular and parvocellular pathways in individuals with mTBI and aid in the diagnosis of visual processing impairments in this population.11,12 Low and high spatial frequencies are distinctly selected between magnocellular and parvocellular systems through checkerboard stimulus.13,14,15 Checkerboard stimulation is applied at a minimum of 50 trials, repeated twice, Figure 1a. A typical VEP waveform is displayed on Figure 1b. The displays from the abnormal waveforms are compared to determine differences in amplitudes and latencies.

(a) Checkerboard pattern with red X to mark fixation point and (b) normal VEP waveform.
In a study conducted by Ciuffreda and Yadav, 17 it was found that in individuals with mTBI, the visual evoked potential amplitudes averaged 19.2 µV without the use of binasal occluders (BNO), with voltages ranging from 12.2 to 35.5 µV. Binasal occlusion is a vision therapy technique that involves partially covering the visual field of both eyes, specifically the area closest to the nose and has been utilized for mTBI patients to improve eye-hand coordination and localization. When BNO was used, the average VEP amplitude increased to 21.3 µV, with voltages ranging from 13.6 to 36.9 µV. This increase in VEP amplitude with the use of BNO was observed in all 10 subjects included in the study. Individuals with mTBI and the visual symptom - Visual Motion Sensitivity (VMS) would suppress/inhibit the peripheral visual motion system when visual motion stimuli was applied. 16 The decrease in the visual evoked potential (VEP) response amplitude occurs when there is an interaction between peripheral inhibitory effects and central field cortical excitation, which leads to the spread of suppression. However, when BNOs are added, the habitually suppressed field and correlated retinal regions are blocked. This reduction in suppression allows for a significant increase in the VEP amplitude to occur. Essentially, the use of BNO reduces the peripheral inhibitory effect and allows for a stronger and more robust VEP response in individuals with mTBI. 16
Research conducted by Yadav and Ciuffreda, found that individuals with mTBI exhibit heightened neural activity in response to visual stimuli compared to those without mTBI. The study also observed that the latency of the pattern visual evoked potential (VEP) decreased exponentially as the check size increased, indicating faster neural processing times in response to larger visual stimuli in individuals with mTBI. 17 These findings suggest that there may be alterations in visual processing and neural communication in individuals with mTBI, leading to changes in VEP latency. The study used a checkerboard pattern consisting of black-and-white checks with dimensions of 17 horizontal degrees by 15 vertical degrees. The pattern included 3 different check sizes: 128 × 128, 64 × 64, and 32 × 32, which corresponded to angular sizes of 10, 20, and 40 minutes of arc, respectively. This allowed for the assessment of visual responses at varying spatial frequencies and provided insights into the functioning of the visual system in individuals with mTBI. 17 The study found that the latency of the visual evoked potential (VEP) was longer for the 10-minute arc check size at low contrast compared to the 20-minute and 40-minute arc check sizes at both low and high contrast. This difference in latency was statistically significant (P < .05). VEP responses were influenced by 2 factors: contrast and check size. Specifically, the 20-minute arc check size produced the highest VEP amplitudes and latency values at both low and high contrast. This suggests that the visual system’s response to the 20-minute arc check size was more pronounced and had a longer processing time compared to the other check sizes and contrasts tested in the study. 17
This study looks at the variations between in the visual evoked potentials on individuals with sports related mild traumatic brain injuries and a baseline cohort. The hypothesis considers that VEP analysis can be utilized to differentiate between visual pathways using checkerboard stimulation due to its frequency selectivity in subjects with mTBI. Through analysis of both amplitude in the VEP P1 and VEP delays, magnocellular and parvocellular pathways can be differentiated within the mTBI cohort.
Methodology
Cohort description
The study included a total of 14 participants, 7 controls and 7 mTBI subject. The study subjects were six females and 1 male with a mean age of 25.56 years that experienced concussions or mTBI which were recruited from 3 colleges in Memphis: Christian Brothers University, Rhodes College, and The University of Memphis. The evaluation of these patients took place within 2 weeks of their most recent concussion. Seven healthy non-mTBI participants (6 females and 1 male; mean age = 23.71 years) from the Southern College of Optometry were enlisted as baseline control cohorts.
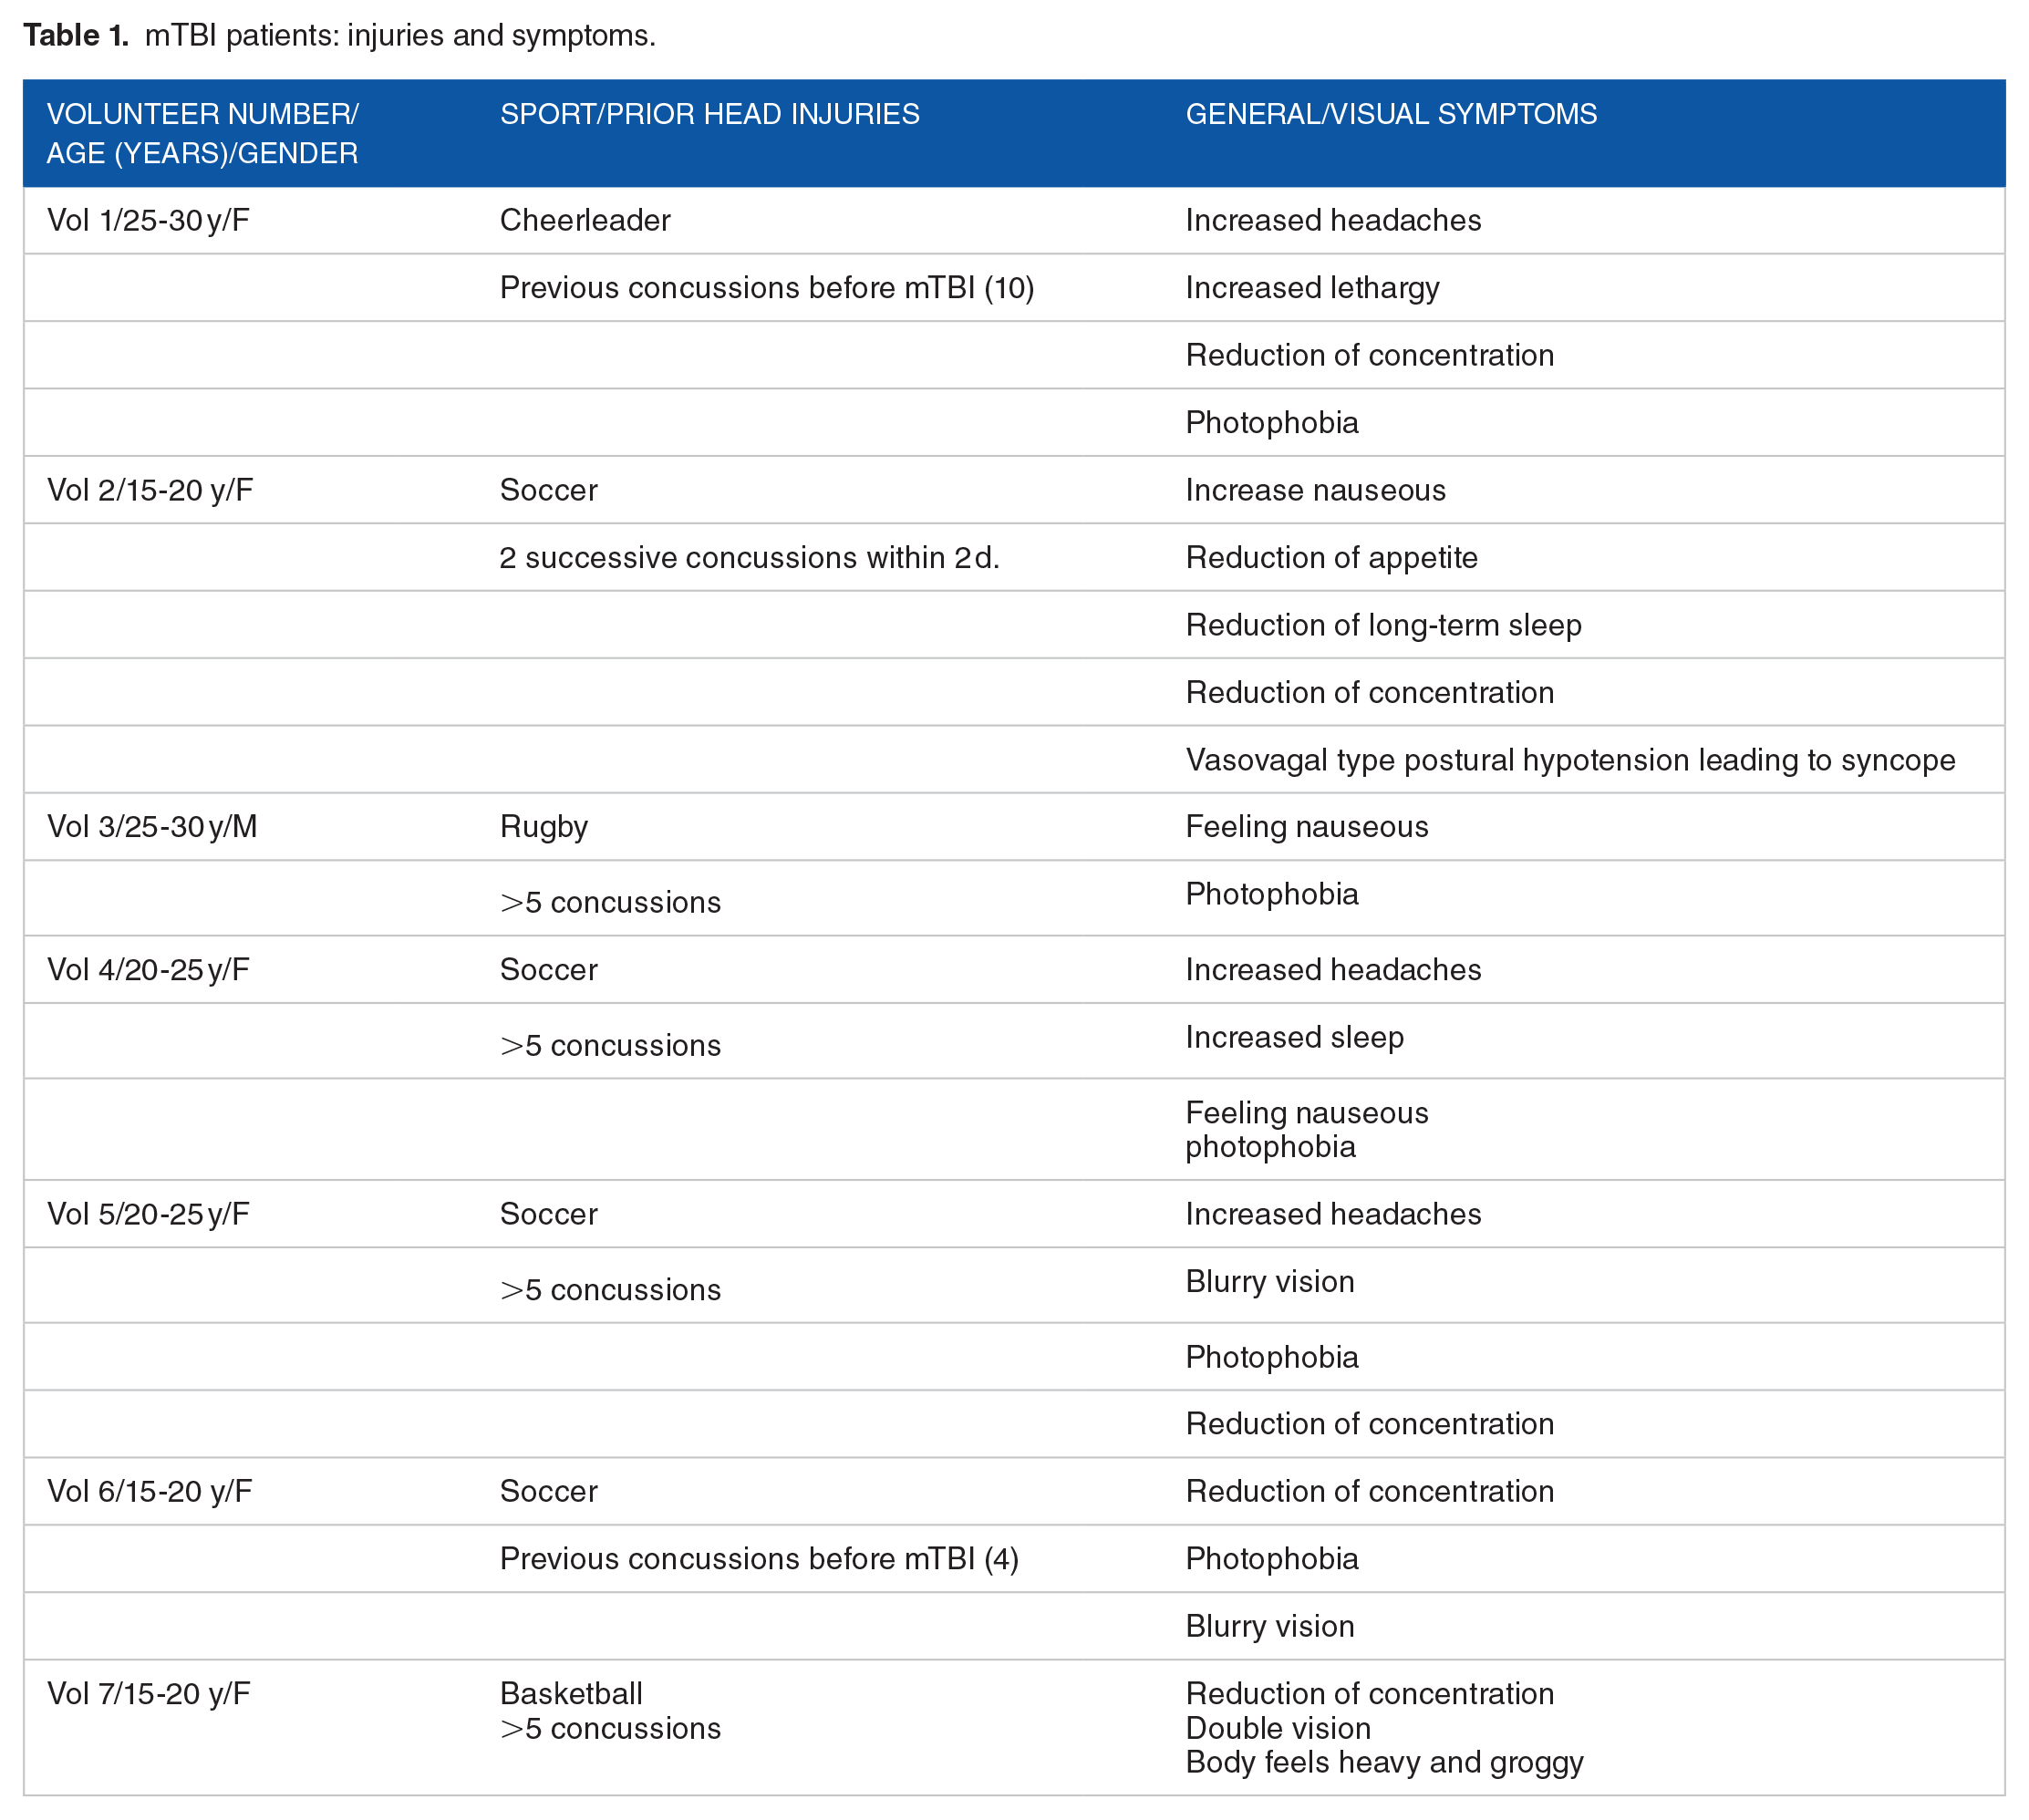
Participants with any neurological conditions such as a history of brain trauma, brain lesions detected by brain imaging (specifically visual lesions), seizures, attention deficit disorder, or learning disabilities were excluded from the study. Participants with diffuse types of injury, such as brain lesions or other brain diseases, were excluded from the study as additional exclusion criteria. Inclusion criteria include cases where patients exhibit milder instances of brain injury that do not shift into the more severe end of the brain injury spectrum. The symptoms of the 7 patients are summarized in Table 1.18,19
mTBI patients: injuries and symptoms.
The visual evaluations conducted in the study included assessments of distance and near visual acuity, cover test at distance and near, near point of convergence, reach grasp release testing, eye health testing (including anterior and posterior segment testing), pupil testing, color vision testing, global stereo testing, near and distance retinoscopy, and a comprehensive analytical that included refraction. All participants in the study had normal corrected vision of 20/20 in both eyes. VEP testing was conducted with visual correction in place. Individuals with strabismus were excluded from the study. This study was performed under the approval from the Institutional Review Board of the Southern College of Optometry (IRB #0000673). The research followed the tenets of the Declaration of Helsinki.
The LKC Technologies Pattern UTAS VEP system uses one monitor to present a checkerboard stimulus pattern with varying spatial frequencies (8, 16, 32, 64, 128) to the patient. The checkerboard pattern displayed on the monitor consists of alternating black and white squares arranged in a grid, with the size of the squares corresponding to the specified spatial frequencies. The other monitor is used to display the recorded visual evoked potential (VEP) responses from the patient, allowing for real-time monitoring and analysis of the patient’s neural responses to the visual stimuli. The VEP responses provide information about the patient’s visual processing and can be analyzed to assess any abnormalities or differences compared to a control group. Each volunteer underwent 15 trials during the testing session, with each trial lasting 40 seconds. The checkerboard pattern changed at a temporal frequency of 1 Hz (2 reversals per second).
Signals were collected from 3 gold cup scalp electrodes, which had a diameter of 1 cm. These electrodes were used for the active, ground, and reference electrodes. The signals were recorded at a sampling rate of 1024 Hz and an amplification of 10 000 was used to enhance the signals for better analysis and interpretation.
During the measurement, we assess the monocular function (Oz) of each eye (OD, OS), and the binocular field (OU). This assessment is based on the degree of difference between the OD (right eye) and OS (left eye) when patching is applied between the eyes, and if the difference exceeds 10%, it indicates a significant disparity in visual function between the eyes. Binocular summation should result in a 10% or more greater amplitude between the OU and the largest OD or OS response. This abnormal binocularity is characterized by a binocular amplitude that is 10% or more greater than the amplitude of the eye with the largest response on 3 or more spatial frequencies. 20
The total testing time for the VEP analysis was approximately 12 minutes. To control fixation and maintain visual attention throughout the testing session, a red circle with a radius of 0.25° was presented central of the test field. This served as a visual target for the patient to focus on, ensuring that their gaze remained fixed, and their attention remained engaged during the entire duration of the test. By providing a consistent visual stimulus at a central part of the field, the red circle helped minimize any potential distractions and variability in the patient’s fixation, allowing for more accurate and reliable VEP measurements.20 -22 During the testing, volunteers with mTBI were instructed to maintain fixation on a small central target. It was observed that individuals with mTBI may exhibit significantly reduced binocular amplitudes, with the dominant eye showing lower amplitudes compared to the non-dominant eye. The reduction in binocular amplitudes in individuals with mTBI may be attributed to interference from the dominant eye, which affects the integration of visual information from both eyes. This interference can lead to an overall reduction in the functioning of the primary visual systems.20 -22
The testing for visual evoked potentials was conducted in a dark room with the lights turned off. A lux meter positioned at the level of the volunteer’s face measuring 0 lux when the computer screens were turned off. The recordings of the 5 spatial frequencies (8, 16, 32, 64, and 128) were obtained in 3 conditions: with both eyes together, with the right eye only, and with the left eye only. This allowed for a comprehensive analysis of the visual evoked potentials and their variations based on eye-specific and binocular viewing conditions. 22 Monocular recordings were obtained by placing an opaque patch over the non-tested eye. The trials for all volunteers followed a standardized clinical protocol, starting with binocular recordings, followed by recordings from the right eye, and concluding with recordings from the left eye. The recordings were conducted in a sequential manner, starting with the 8 × 8 size and progressing up each octave until the 128 × 128 recording was obtained. Between each recording for a specific “eyed” condition, the volunteers were given a 30-second break. Additionally, a full minute break was provided between recordings for each eye, allowing time for the placement or movement of the opaque patch.
All patients were provided visual therapy, which includes interventions such as prism glasses, polaroid glasses, and computerized vision training, which has been found to lead to faster recovery outcomes. This therapy involves once-weekly in-office sessions lasting 45 to 50 minutes, during which patients engage in various visual exercises. Additionally, patients are instructed to practice these exercises at home on the days between sessions. Therapy may finish as short as 6 months after a mTBI. Most patients continued for longer periods of time, if visual improvement was seen through therapy.
Results
A 2-way, analysis of variance (ANOVA) statistical analysis was performed using MATLAB, R2020a (Math-works, Natick, MA). We analyzed the monocular and binocular responses (OD, OS, OU) and checkerboard frequency stimulus (8, 16, 32, 64, 128) between the 2 groups. The results of the study indicated significant differences between the control groups and the cohorts with mTBI in terms of the number of reported symptoms and the values of VEP P1. The statistical analysis, using a significance level of α = .05, showed these differences to be significant. The study also used a significance level of α = .05 for all tests conducted. In the statistical analysis, significance is calculated by examining 5 dependent variables (spatial frequencies) and 3 viewing conditions (OD, OS, & OU), resulting in a total of 15 comparisons. To account for multiple comparisons, a Bonferroni correction is applied, dividing the significance level (α) by the number of comparisons. In this case, α = .05 is divided by 15, resulting in a corrected significance level of P < .003. Therefore, a P-value less than .003 is used to reject the null hypothesis and conclude that there is a statistically significant difference between the mTBI and control cohorts in terms of the examined variables. This correction helps to reduce the likelihood of false positive results and ensures that the observed differences are statistically significant. Cohen d is calculated through the mean of the VEPs of both mTBI and control groups. The average value of the of the mTBI group is 13.24 μV and the control group is 10.57 μV, with mean difference between the 2 groups was 3 μV and a shared standard deviation of 3.5 μV. Therefore, the Cohen’s d = 0.3. The power of the 2-tailed test was determined to be 0.315.
Figure 2a shows significant differences between the mTBI group and the control group. The analysis focused on the visual evoked potential (VEP) P1 response, which occurs at around 100 ms. The analysis included 7 individuals in each group. The mTBI group had higher VEP P1 amplitudes compared to the control group, except for the 128 × 128 frequency. The control group had more consistent VEP P1 responses with a smaller micro-volt range. These findings suggest increased neural activity or excitability in the visual system of individuals with mTBI, potentially reflecting altered visual processing.

Mean visual evoked potentials (VEPs) values for the right eye (OD), left eye (OS), and both eyes (OU) for both the mTBI group and the control group (a). Mean VEP delay values are shown for both cohorts (b). Checkerboard spatial frequency input is shown in the x-axis. Significance is represented by mTBI versus control groups where thresholds are designated at: **P < .01, ***P < .003.
The mTBI group exhibited a higher delay range of 91.75 to 108.60 ms for the VEP P1 response, while the control group had a range of 92.00 to 115.17 ms. Figure 2b shows the p-values for the significant differences between the mTBI and control groups in terms of VEP delay values. The P-values for the 32 × 32 OD, 8 × 8, 16 × 16 OU frequencies are 0.003 and 0.002, respectively. A statistical significance in VEP delay values between the mTBI and control groups is found for these frequencies.
The most significant instances of VEP differences between the mTBI and control groups are found in the following spatial frequencies: 8 × 8 OS (P = .003), 128 × 128 OS (P = .001), 8 × 8 OD (P = .006), 16 × 16 OS and 16 × 16 OU (P = .006), and 32 × 32 OS (P = .004). These P-values indicate a statistically significant difference between the mTBI and control groups regarding VEP responses at these spatial frequencies. Additionally, there is ~5 μV separation between the mean VEP amplitudes of the mTBI and control groups, further highlighting the differences between the 2 populations. 6
VEP delays include the following spatial frequencies that exhibited abnormal behavior (P = .01): 8 × 8 OD, 16 × 16 OD, and 8 × 8 OS, spatial frequencies 8 × 8 OU, 16 × 16 OU and 8 × 8 OD are found to be outside the normal amplitudes and latency. 23 In Figure 2a and b, where the significance thresholds are set at P < .01, the spatial frequencies that exhibit similar patterns between the mTBI and control groups are 8 × 8 OD, 16 × 16 OU, 32 × 32 OS, and 128 × 128 OS. The VEP values for 8 × 8 and 16 × 16 OU, as well as the 32 × 32 OD delay values, align with the mean voltage values observed in Figure 2a and b respectively.
In Table 2, the mean P-values for the VEP P1 response in the mTBI group ranged from 7.8 ± 0.5 to 16.3 ± 4.0, indicating a wide range of mean responses within the mTBI group. In contrast, all of the mean values for the control group fell within the range of 8.92 ± 2.0 to 12.27 ± 1.2, suggesting that the control group had more consistent mean values for the VEP P1 response compared to the mTBI group.
VEP mean and standard error values: mTBI values and control.
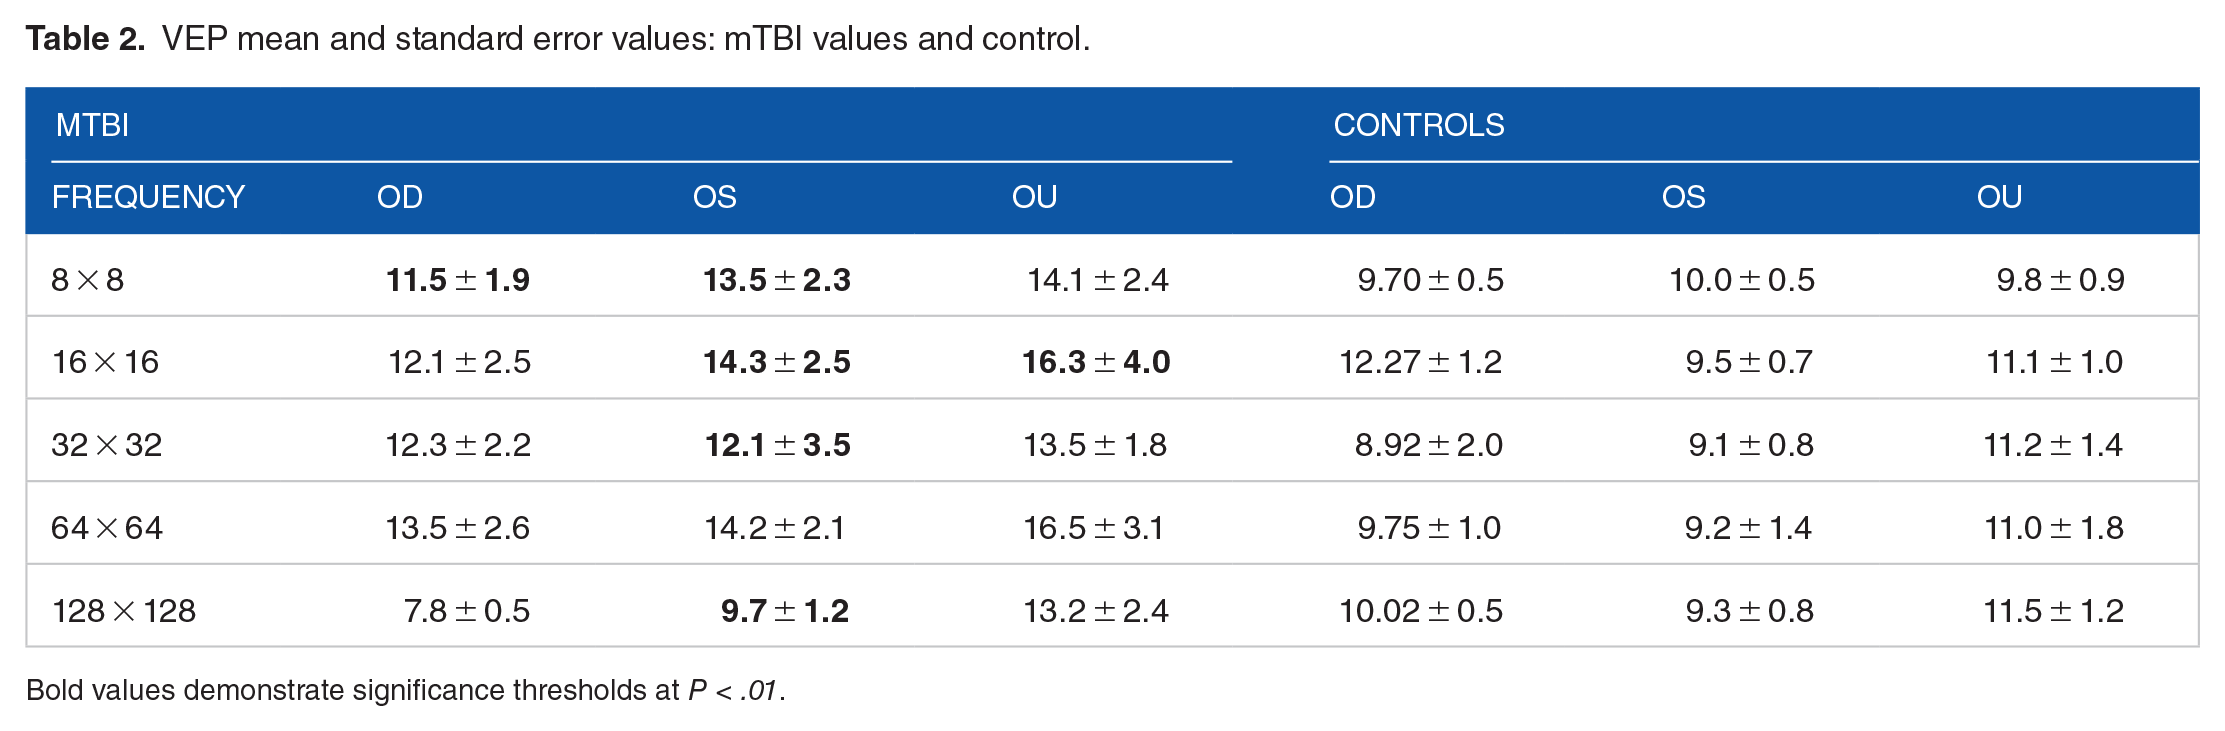
Bold values demonstrate significance thresholds at P < .01.
Table 3 provides the mean and standard error values for VEP delay in both the mTBI and control groups. VEP mTBI mean delay values (91.83 ± 10.69 – 108.8.3 ± 17.58) are within a range of values as seen in Table 3 and mean values for the controls are within the 94.50 ± 5.18 – 115.17 ± 13.49 similar range taking standard deviation into consideration.
Delay mean and standard error values, TBI values and controls.

Bold values demonstrate significance thresholds at P < .01.
Visual therapy techniques were applied across all patients in this study. Patients 1, 3, 4, 5, and 7 had shown no significant improvement. Patient 2 initially showed higher VEP values in the left eye (OS) and both eyes (OU), indicating a significant receptive field loss in the larger and medium-sized visual stimuli. The decrease in parvocellular processing corresponds to the patient’s medium-sized receptive field loss, which is slightly more severe than their large receptive field loss. The restoration of parvocellular processing is indicated by a significant reduction in higher spatial activity during the second measurement. The patient’s medium-sized receptive field loss corresponds to a deprecation in parvocellular processing, which is slightly greater than their loss in the larger receptive field. The restoration of parvocellular processing is demonstrated by a significant reduction in higher spatial activity in the second measurement. This indicates an improvement in the patient’s ability to process smaller objects and stimuli with higher contrast. The VEP values for the right eye (OD) of Patient 2 remained consistently higher than normal, particularly in the 64 × 64 spatial frequency. Over a period of 3 months, there was an overall reduction of 0.23 µV in the VEP values for the right eye. The most significant reductions were observed in the 128 × 128 spatial frequency for both the right eye (OD), left eye (OS), and both eyes (OU), with an average decrease of 8.40 µV ± 5.32. These findings are illustrated in Figure 3. Patient 6 demonstrated higher VEP values in 16 × 16 OU responses as well slightly higher values overall due to mTBI. A shorter time to recovery was seen in this patient where visual treatment reduced the VEP amplitudes. The overall reduction in 3 months is 5.28 µV. The most significant reductions were found in the 8 × 8, 16 × 16, and 32 × 32 OS, OU, with a mean drop of 7.42 µV ± 1.06, see Figure 3.

The mean visual evoked potential (VEP) values before and after visual therapy for Patient 2 (a) and Patient 6 (b) are displayed for the right eye (OD), left eye (OS), and both eyes (OU) in comparison to individuals with mTBI and controls. These figures provide a visual representation of the changes in VEP values following Visual therapy for these 2 patients.
Patients 1, 3, 4, 5, and 7 had shown no significant improvement in VEP delays after rehabilitation—see Figures A1 and A2 in Appendix 1. Patient 2 originally exhibited higher VEP delays in OS, OD, and OU corresponding to very dominant large- and medium-sized receptive field loss.
Parvocellular processing deprecation in patient 2 corresponds to a slightly greater loss in medium-sized receptive fields compared to large receptive fields. Over a period of 3 months, there was an overall reduction of 4.26 ms in the processing time. The most significant reductions were observed in the 64 × 64 spatial frequency for the left eye (OS) and right eye (OD), and the 128 × 128 spatial frequency for the right eye and left eye, with an average decrease of 7.25 ± 7.92 ms. These findings are depicted in Figure 4a.

The mean delay values before and after rehabilitation for Patient 2 (a) and Patient 6 (b) are displayed for the right eye (OD), left eye (OS), and both eyes (OU) in comparison to individuals with mTBI and controls. These figures provide a visual representation of the changes in delay values following rehabilitation for these 2 patients .
Patient 6 had relatively low visual evoked potential (VEP) delays and experienced significant improvement with the implementation of visual treatment. Over the course of 3 months, there was an overall reduction of 0.06 ms in the VEP delays for this patient. The most significant reductions were found in the 128 × 128, with a mean drop of 4.66 ms ± 2.966, see Figure 4b. In both cases, the patients exhibited a high degree of restoration due to intervention, and symptoms subsided.
Discussion
The most dominant instance of receptive field loss across all the patients appears to be magnocellular process deprecation due to frequent instances of 8 × 8 and 16 × 16 spatial frequencies input as it relates to amplitude and latency output. Patients 4 and 6 exhibited noticeable impairment in both eyes (OU) in the lower frequency ranges, particularly at 8 × 8 and 16 × 16 and 32 × 32. This loss likely contributed to their binocular issues. Additionally, there were instances of medium-sized receptive field loss, which corresponds to parvocellular processing. Patients 5 and 7 showed medium-sized receptive field loss, indicating parvocellular deprecation. They also exhibited a discernible loss in both eyes (OU), which likely causes binocular issues. The medium-sized receptive field loss in these patients is slightly more pronounced than the large receptive field loss, suggesting a potential deprecation in parvocellular processing. Similarly, in patients 3 and 1, we observe the same medium-sized receptive field loss, but this time from higher spatial frequency stimuli.
The amplitude of the Visual Evoked Potential (VEP) signal in the mTBI cohort increased as the spatial frequency increased. This could be attributed to higher luminance exposure, which leads to spike generation due to changes in neuronal membrane potential and conductance. Neurons function to transform incoming action potentials into specific spiking patterns of synaptic output. Action potentials are influenced by the rate of membrane potential change before a spike occurs. Action potential generation involves integrating and modulating the incoming signals to generate an appropriate response. The patterns of synaptic output generated by neurons play a crucial role in transmitting and processing information in the nervous system. The magnitude and duration of these patterns are determined by the number of action potentials received by the cell, with an increase in the number of action potentials resulting in higher magnitude and longer duration. Heightened VEP amplitudes are therefore the result of unregulated spiking generation and higher spiking frequency, causing the summation of spikes to produce higher than normal amplitudes related to luminance exposure.
The observed changes in P100 latency can be attributed to the decrease in luminance and spike generation due to neural discharge.24,25 According to Di Russo et al, 26 the striate and extrastriate cortical areas (V2, V3, and V4) are responsible for generating P100 latency. Additionally, Saint Amour et al suggest that the involvement of frontal and parietal lobes indicates a more complex system at play in generating P100 latency.
Similar studies where an increase in amplitude from mTBI patients from VEPs was significantly larger than normal neural activation. 17 A study featuring 35 patients with a history of 1 or more concussions using P1 VEP assessment for mTBI determination. 27 The ROC curve generated by this model demonstrated excellent discrimination between individuals with mTBI and those without mTBI. It had excellent discriminatory power in distinguishing between mTBI and non-mTBI.
In a study involving patients with convergence insufficiency, it was observed that they exhibited similar oculomotor measures of near point of convergence and fusional vergence as individuals with a history of concussion and previous mTBI when the near point of fixation disparity test was conducted. This suggests that both groups experienced comparable difficulties in maintaining binocular vision and coordinating their eye movements during near tasks. The near point of fixation disparity test is a useful tool for assessing these oculomotor measures and identifying potential visual deficits in individuals with convergence insufficiency and mTBI. 28 The stimuli used in the study included 2 types: checkerboard patterns and vertical sinusoidal patterns. The checkerboard stimuli were presented in 2 different sizes: 8 × 8 with a check size of 3.38 cm (corresponding to a 2-degree check size) and 16 × 16 with a check size of 1.69 cm (equivalent to a 1-degree check size). These stimuli were used to assess visual processing and evoked responses in individuals with mTBI and non-mTBI cohorts, as well as visual responses and oculomotor measures in individuals with convergence insufficiency and mTBI. 28 The study’s findings indicate that there were magnocellular deficits observed in the participants based on their P100 visually evoked potential (VEP) responses. These deficits were observed when the participants were presented with a high-contrast (85%) checkerboard stimulus with a check size of 1.49 cycles per degree at a low luminance level (0.3% transmittance). The deficits were characterized by a greater P100 latency (delayed response) and a smaller amplitude (reduced response strength). Additionally, deficits were also observed when the participants were presented with low-contrast (20%) checkerboard stimuli of varying sizes, which resulted in smaller P100 amplitudes). 29
The study faced challenges in finding suitable cohorts of individuals with visual deficits resulting from mTBI injuries. Despite expanding the study to include participants from multiple local universities and colleges and encompassing a wide range of sports activities and age groups, the dataset remained small, consisting of less than 10 individuals. The cohort had diverse sports-related injuries and limited gender representation. In spite of this grouping, the mTBI injury effects were followed a similar pattern, that is, sleeping issues, photophobia, nausea, memory issues, and headaches derived from head trauma.
Instances of multisensory reorganization during rehabilitation has been found where the brain may undergo sensory reorganization after progressive degenerative visual conditions.30,31 The use of BNOs as a rehabilitation technique have shown to reduce to effects of heightened amplitudes from instances of mTBI. 16 The application of BNOs leads to a peripheral inhibitory effect that interacts with the central field cortical excitation. This interaction occurs through the spread of suppression, ultimately resulting in a reduction in the amplitude of the visual evoked potential (VEP) response. Additionally, through rehabilitation intervention, spike generation may return to a regulated spiking frequency where the rate of change of action potentials becomes more regulated.32,33,34 The striate and extrastriate visual areas are involved in visual imagery and may be utilized for internal visual stimuli, leading to visual cortical reorganization. This process involves the processing of these stimuli by the frontal and parietal lobes. 35
Conclusion
Athletes who exhibit mTBI have several unique characteristics based on VEP analysis. Binocular magnocellular process deprecation was found to be the most dominant marker across most mTBI participants within frequent instances of 8 × 8 and 16 × 16 spatial frequencies input as it relates to amplitude and latency output. Additionally, there is ~5 μV separation between the mean VEP amplitudes of the mTBI and control groups, further highlighting the differences between the 2 populations. The checkerboard stimulus enables modulation of luminance in order to differentiate m-cell and p-cell processing and determine any deprecation in visual processing in the mTBI cohort. This approach to mTBI injury provides the solution for diagnosis where MRI and CT scans have had difficulty in the past.
Footnotes
Appendix 1
Acknowledgements
Not applicable.
Abbreviation
Magnocellular and Parvocellular Pathways after mTBI
Author Contributions
PH examined and selected patients for this study. MHM performed programing and NK performed data analysis. MHM, PH interpreted results and wrote and approved the final manuscript.
Ethics Approval and Consent to Participate
Each participant gave informed written consent in compliance with the Institutional Review Board of the Southern College of Optometry (IRB #0000673).
Funding:
The author(s) disclosed receipt of the following financial support for the research, authorship, and/or publication of this article: This investigation was supported by an unrestricted grant from the College of Optometrists in Vision Development (COVD) Aurora, OH, to the Southern College of Optometry, Memphis, TN.
Declaration of conflicting interests:
The author(s) declared no potential conflicts of interest with respect to the research, authorship, and/or publication of this article.