
Abstract
Repetitive transcranial magnetic stimulation (rTMS) is used clinically to treat major depression and has more recently been applied as a potential treatment for Alzheimer’s disease (AD). Given that the rTMS treatment protocols for AD are similar to those used for depression, we investigated whether the AD participants’ cognition change after rTMS was, in part, due to a change in depressive level. Twenty-eight participants of an rTMS treatment study for AD participated in this study. We collected cognitive measures to partition them into 2 groups of subjects with marked or moderate responses (n = 13) and those with responses of small or none (n = 15). Besides, we recorded pre and post Electrovestibulography (EVestG) signals, and 2 EVestG features targeting depression were calculated from the averaged field potential curve (FPave) and low-frequency modulation of the recorded firing pattern (33-interval histogram [IH33]), respectively. We then compared these features in the above-mentioned cognitive-wise response groups. The FPave and IH33 depression-related features showed no substantial difference between pre- and post-treatment in either group in response to rTMS treatment. The change in these EVestG depression features of the AD participants was also poorly correlated with Alzheimer’s Disease Assessment Scale-Cognitive Subscale (ADAS-Cog) change with treatment. This study’s results demonstrate that cognitive improvement post rTMS is not predominantly a result of an improvement in depression.
Keywords
Introduction
Alzheimer’s disease (AD) is the most prevalent form of dementia (60%-70%). 1 Comorbid depression is frequently observed in AD individuals,2,3 and mild depression has been linked to significant functional decline. 4 Depression and the early stages of AD have overlapping symptoms, such as lack of interest and sleeping problems. 5 The approximate prevalence of depression in AD is 50%,2,3 and the actual relationship between these two pathologies is still unclear. 5 AD individuals show abnormalities in the ventricles, hippocampus, and frontal lobe, which are also seen in major depressive disorder (MDD) individuals. 6 For treating MDD, repetitive transcranial magnetic stimulation (rTMS) has been clinically applied.7,8 rTMS is non-invasive and applied as a train of pulses to modulate neuronal activity in targeted brain regions. 9 Previous studies have also explored the efficacy of rTMS treatment on AD.10,11 Interestingly, many rTMS AD treatment specifications, including target area, frequency, and treatment schedules, are akin to those for MDD treatment12,13; the focus of this study was thus to investigate the effect of rTMS on any comorbid depression of AD individuals, while participants were treated to improve cognition.
While there are subjective measures to assess depression in demented individuals,14 –16 for quantitative detection of a lower level of depression in AD, herein, we utilized Electrovestibulography (EVestG), as it has been shown to be able to diagnose and monitor depression. 17 EVestG is a non-invasive tool for recording the spontaneous field potential (FP) signals from the predominantly vestibular vestibulo-acoustic system. 18 It can indirectly measure the neural activity of vestibular pathways in both background (static) and in response to whole-body tilt stimuli (dynamic). 17 The vestibular nucleus has a connection to the efferent vestibular system, and it receives inputs from locus coeruleus, parabrachial nuclei, dorsal raphe, hypothalamus, and amygdala, which have been associated with the depression pathophysiology.17,19 Vestibular activity is impacted by depression pathologies, including the deficiencies of gamma-aminobutyric acid in the locus coeruleus 20 and disrupted serotonin signaling in the dorsal raphe. 21 The parabrachial nuclei have reciprocal associations with the hypothalamus, amygdala, and prefrontal lobe. 22 A previous depression study 17 also detailed several physiological mechanisms on how depression changes vestibular responses and found a significant correlation between EVestG depression-sensitive features and participants’ Montgomery-Asberg Depression Rating Scale (MADRS, a questionnaire to evaluate depression symptoms) scores.
Herein, we collected EVestG signals from participants of our team’s clinical trial of rTMS treatment for AD23,24 before and after the rTMS treatment block and calculated their 2 depression features 17 based on the averaged FP signals (FPave) and firing patterns. More specifically, we calculated 2 depression-sensitive features, one from the combination of post-potential peak (PPP) and trough (PPT) of FPave signals and the other from the 33-interval histogram (IH33), following a prior depression study. 17 The participants were then grouped as cognitive-wise response groups to determine whether they showed a different post-treatment change in EVestG depression-focussed features. We also examined whether these features were associated with the participants’ Alzheimer’s Disease Assessment Scale-Cognitive Subscale (ADAS-Cog) scores change after treatment.
Methods
Participants
Participants for this study were recruited from our team’s rTMS treatment efficacy clinical trial for AD.23,24 The rTMS pulses (30 pulses/train) with 20 Hz frequency were delivered participant’s dorsolateral prefrontal cortex (DLPFC) bilateral and serially at 100% of each participant’s resting motor threshold for 2 or 4 weeks (5 days/week); the detailed protocol can be found at Moussavi et al. 24 All participants signed the required consent forms, approved by the Biomedical Research Ethics Board of the University of Manitoba. Out of the 72 participants enrolled in the rTMS study in Winnipeg, for the reasons outlined in Lithgow et al., 25 35 participated in this EVestG side study and had both baseline and post-treatment EVestG recording. After completing the clinical trial,23,26 we collected their responses and determined active/sham group assignments. Out of the 35 participants, by chance, 28 were in the active group and 7 in the sham. Due to the small number of sham group participants, we report the analysis only on the active treatment group. Within the active group, 12, 1, 9, and 6 participants’ responses were in marked, moderate, small, and none types, respectively. The criteria of response type (marked, moderate, small, and none) are detailed in Moussavi et al., 23 derived from comparing baseline and post-treatment (at week 5 or after week 8) assessment scores of primary (Alzheimer’s disease assessment scale-cognitive subscale (ADAS-Cog)) and secondary (Alzheimer’s Disease Cooperative Study-Activities of Daily Living Inventory [ADCS-ADL] and Neuropsychiatric Inventory-Questionnaire [NPI-Q]) outcome measures. In short, if the ADAS-Cog is improved by a 3+ score, the response is considered marked. The response is defined as moderate if there is a non-significant (<3 points) improvement in ADAS-Cog scores AND no change OR improvement in ADCS-ADL OR NPI-Q scores. If the AND part in the moderate response criterion does not hold, the response is referred to as small. In addition, the response is small if there is a non-significant decline in ADAS-Cog (<3 points decline) AND improvement (1 point) in both ADCS-ADL and NPI-Q ; otherwise, the response is none if the AND part in this criterion does not hold. Note that AND/OR is a Boolean logical notion. 23
Due to the small sample size in each response group, we combined participants with marked or moderate responses (n = 13) and those with responses of small or none (n = 15) to run a binary group-wise comparison with an approximately balanced sample size. These two groups did not differ significantly in baseline demographic data and assessment scores (Table 1).
Baseline characteristics of 2 groups: marked/moderate (n = 13) and small/none (n = 16) in the active repetitive transcranial stimulation (rTMS) group. Values are in mean ± standard deviation (SD).
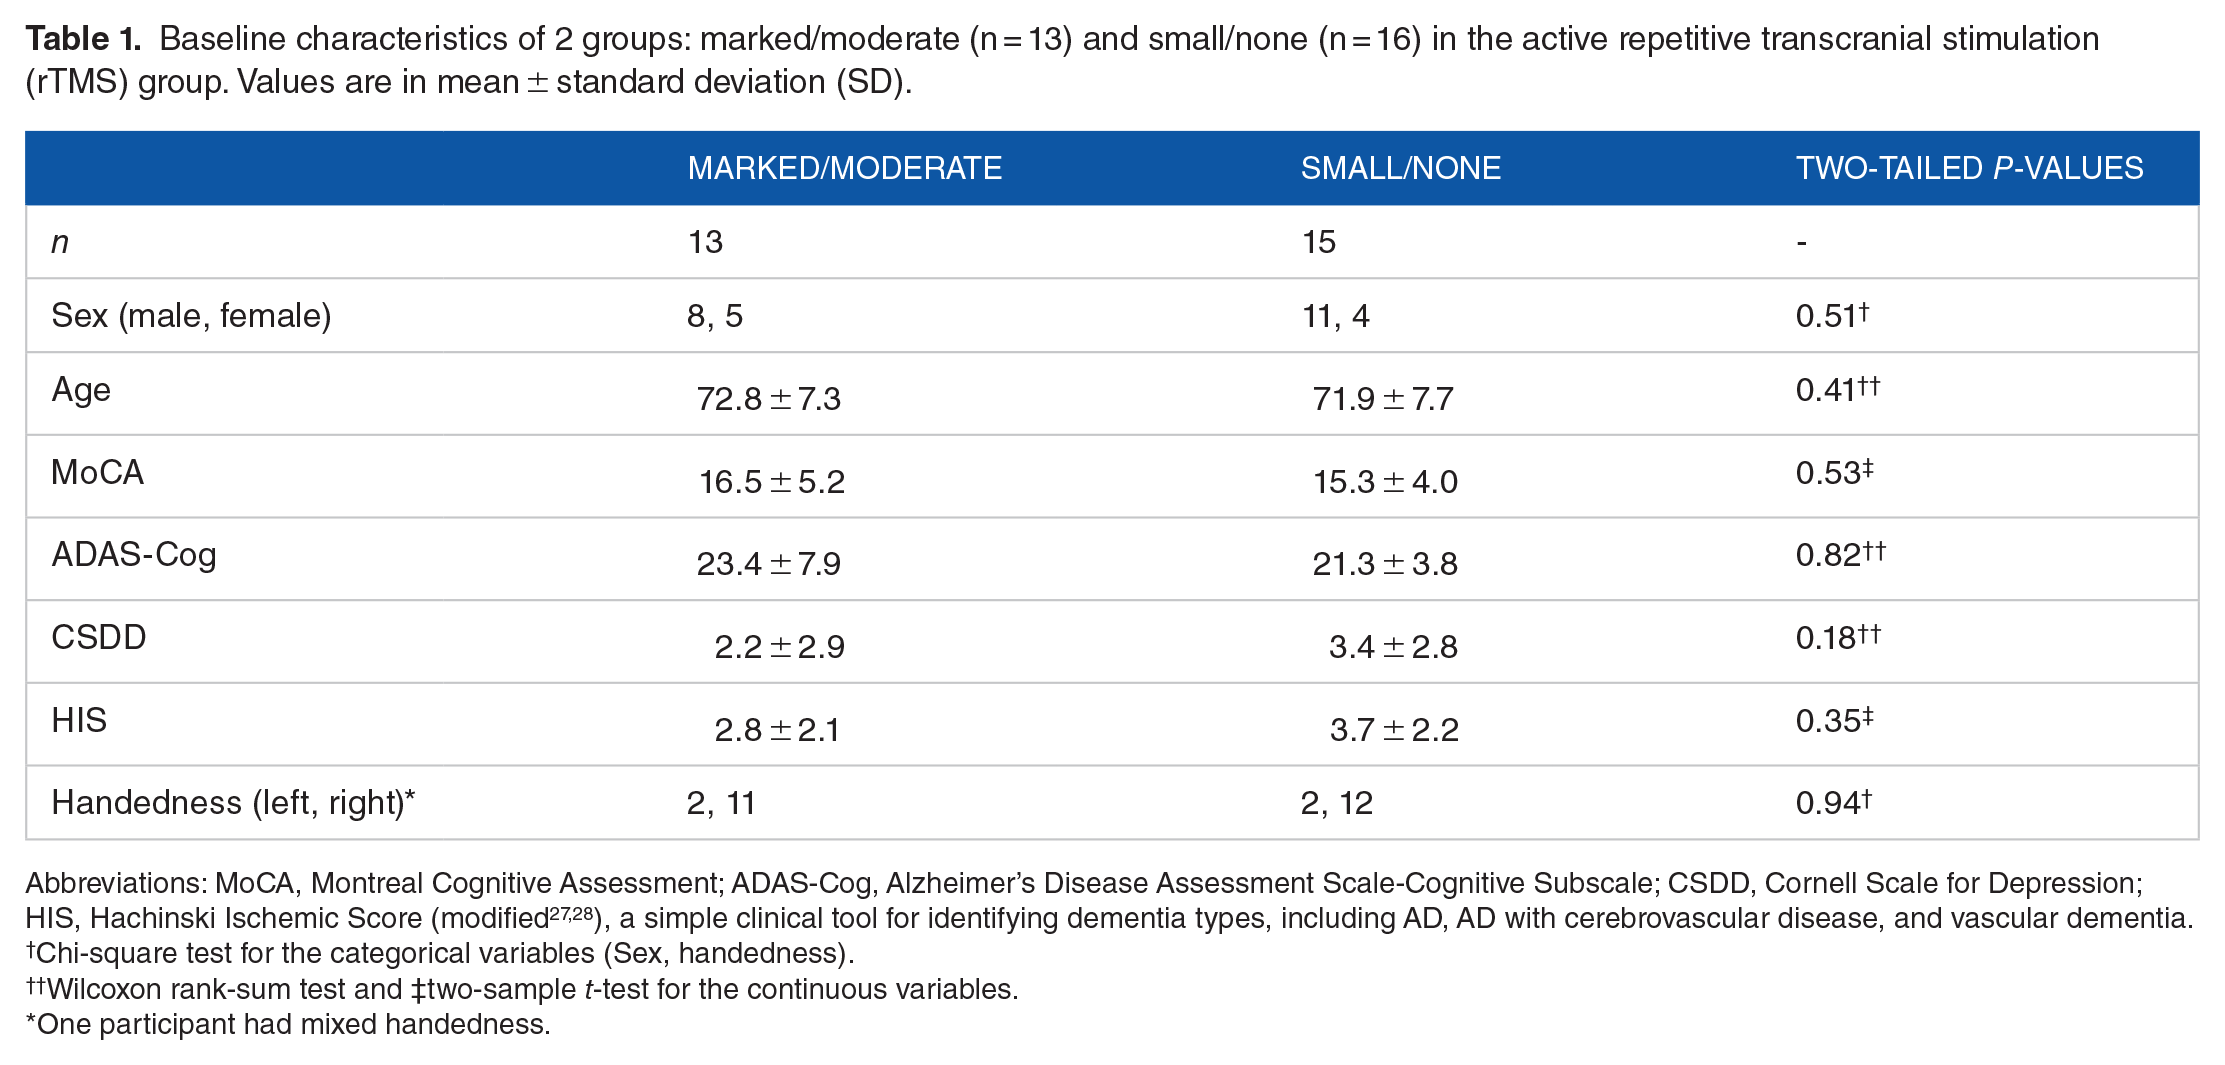
Abbreviations: MoCA, Montreal Cognitive Assessment; ADAS-Cog, Alzheimer’s Disease Assessment Scale-Cognitive Subscale; CSDD, Cornell Scale for Depression; HIS, Hachinski Ischemic Score (modified27,28), a simple clinical tool for identifying dementia types, including AD, AD with cerebrovascular disease, and vascular dementia.
Chi-square test for the categorical variables (Sex, handedness).
Wilcoxon rank-sum test and ‡two-sample t-test for the continuous variables.
One participant had mixed handedness.
Electrovestibulography (EVestG)
EVestG signals were collected from participants before and after rTMS treatment (mostly at week 5). Prior studies25,27 detail the EVestG signals acquisition process involving a hydraulic chair (Figure 1A); during recording, participants were placed on the chair with eyes closed and head supported laterally by a headrest. 29 Figure 1B shows the electrode placement. For a chair’s tilt, responses were collected from 6 chair movement segments (Figure 1C): background (BGi), acceleration (onAA), deceleration (onBB) and return to the center (RTC) segments (RTC BGi, RTC onAA, and RTC onBB), each takes 1.5 s. An algorithm named the neural event extraction routine has been utilized to detect spontaneous FPs, 18 and Figure 1D demonstrates a typical normalized average of FPs (FPave). As depicted in Figure 1E and F, a 33-interval histogram (IH33) is generated from each 33rd FP. Since the mean gap between each FP was experimentally determined to be approximately 3.3 ms, the 33rd gap resembles ~100 ms (ie, 10 Hz). We focused on the 33rd gap due to potential connections with afferents’ modulations within the alpha frequency band (8-13 Hz) and the lower range of efferent vestibular activities.17,25

EVestG methodology. (A) EVestG recording chair inside an electromagnetically shielded and acoustically reduced (>30 dB) chamber. (B) Active gelled electrodes were used proximal to the eardrum of each ear, reference electrodes on the external opening to the ear canal and a ground electrode placed on the forehead (not shown). (C) The chair movement segments: BGi (1.5 s immediately before chair movement-called background phase), onAA (first 1.5 s of the chair motion-called acceleration phase), onBB (last 1.5 s of the chair motion-called deceleration phase), and return to the center (RTC) segments, each 1.5 s (RTC BGi, RTC onAA, and RTC onBB). BGi and RTC BGi segments are static, while the other 4 segments, for example, onAA, onBB, RTC onAA, and RTC on BB, are dynamic. (D) A normalized averaged field potential (FPave), that is, FPave divided by its absolute value of the maximum point. The waveforms of FPave, shown in ash color, include the action potential (AP) waveform, pre-and post-potential waveforms, and pre-and post-potential troughs. (E) Interval histogram generation technique from each of the detected 33rd FP. (F) A 33-interval histogram of a participant.
Features calculation
We chose 2 of 6 depression features from the previous MDD study 17 : one from the FPave and the other from the IH33. The FPave shape feature, extracted from the post-potential peak (PPP) and trough (PPT) area in the MDD study, 17 provided the highest area under the region of convergence (ROC) curve (0.75) for classifying control versus MDD subjects. Further, the IH33 depression feature provided the highest classification accuracy (76.7%) and area under the ROC curve (0.72) for classifying symptomatic (ie, Montgomery-Asberg Depression Rating Scale [MADRS] ⩾ 20) and reduced symptomatic (ie, MADRS ⩽ 19) MDD groups. 17
Our depression study 17 identified 2 regions of interest within the PPP and PPT area of the FPave (Figure 1D) using samples of 486-491 and 537-563, respectively (each sample is equivalent to 1/41.67 ms). Herein, we used these specific ranges for feature calculations and hypothesized that they likely correspond to depression in the population. That study 17 used only the BGi response (left ear) for the supine upward translation. Since our sample size was small and the artifacts (eg, muscle, interference) corrupted FPave signals for the BGi segments of some participants, we herein averaged 4 background (BGi, RTC-BGi) responses (left ear) for the supine upward and supine rotation positions. For each participant’s FPave signal at either baseline or post-treatment, 2 correlation coefficients, that is, one with the averaged marked/moderate and the other with the averaged small/none, were found over the regions mentioned above. We then subtracted these 2 coefficients to form the FPave feature.
Our depression study 17 utilized the dynamic responses (acceleration, onAA and deceleration, onBB) from a supine upward tilt to obtain a significant feature from bins 66 and 84 ms minus 111 and 120 ms; we herein used these same tilt responses and bins for calculating features so that they were also likely to represent our participants’ depression. We first generated IH33 for a participant’s acceleration and deceleration responses (right ear). The histogram difference for acceleration and deceleration (onAA minus onBB) was formed, and the bins mentioned above were then used to calculate the second feature.
Statistical analysis
Since the features deviated from the normal distribution in some cases, we generally applied either the Wilcoxon signed-rank test or the Wilcoxon rank-sum test, depending on the comparison type and Spearman’s rho statistics for the correlation test. We used MATLAB (2023a) to process the signals, and the associated statistical analysis was done in the RStudio of R 4.1.0.
Results
Averaged field potential (FPave) and interval histogram (IH33) features
As shown in Figure 2A and B, our 2 response groups’ PPP and PPT regions at baseline and post-treatment were mostly not significantly different and generally overlapped. Figure 2C and D demonstrates the averaged IH33 plots of 2 response groups for onAA and onBB responses at baseline and post-treatment; these plots overlapped at bins 66, 84, 111, and 120 ms (corresponding frequency = 1/time), and Figure 2E demonstrates IH33 depression features calculated from these bins.

Averaged field potential (FPave) shape and 33-interval histogram (IH33) features. (A-B) FPave signals of a group with marked or moderate (n = 13) responses and those with small or none (n = 15) at (A) baseline and (B) post-treatment of rTMS. The 95% confidence intervals (CI) of marked/moderate and small/none are depicted in cyan and red shading, respectively. FPave signals of 2 groups at baseline or post-intervention mostly overlapped in the post-potential peak (PPP) and trough (PPT) samples: 486-491 and 537-563. (C-D) Averaged IH33 plot of 2 cognitive response groups at (C) baseline and (D) post-intervention, in which solid and dotted lines represented onAA and onBB responses, respectively; the plots for corresponding responses at bins 66, 84, 111, and 120 mostly overlapped. (E) The IH33 features, derived from times 66 and 84 ms minus 111 and 120 ms, of histogram difference for onAA and onBB did not differ significantly between baseline and post-intervention of marked/moderate or small/none response groups. SE = standard error.
The FPave shape and IH33 features did not differ significantly between the 2 response groups at baseline (FPave: W = 126, P = .20; IH33: W = 117, P = .39) or post-treatment (FPave: W = 104, P = .78; IH33: W = 108, P = .65). Further, there was no significant difference in these 2 depression-specific features between baseline and post-intervention for the marked/moderate (FPave: V = 61, P = .31; IH33: V = 45, P = 1), small/none (FPave: V = 46, P = .45; IH33: V = 58, P = .93), and 2 groups together (FPave: V = 211, P = .87; IH33: V = 190, P = .78). Notably, our previous study 25 measured cognitive improvement in participants using EVestG features extracted from different phases and tilts (eg, deceleration phases in supine up/down and upright back tilt).
Correlation between EVestG-driven features and ADAS-Cog change after treatment
We found no significant association in ADAS-Cog scores change between pre- to post-intervention with the FPave and IH33 features change of the marked/moderate (FPave: rho = 0.11, P = .72; IH33: rho = −0.30, P = .32) and small/none (FPave: rho = −0.16, P = .57; IH33: rho = −0.07, P = .80) and all subjects together (FPave: rho = 0.24, P = .22; IH33: rho = −0.13, P = .51).
Analysis of depression severity status
Our main rTMS study 11 excluded significantly depressed AD individuals; as a result, none of our participants had definite MDD (ie, Cornell Scale for Depression [CSDD] > 18), as shown in Figure 3A, and we did not have post-treatment CSDD scores. Nevertheless, we did have the post-treatment depression severity scores collected from the Neuropsychiatric Inventory Questionnaire (NPI-Q) scale. NPI-Q has an item (question four) to assess our participants’ depression severity (none = 0, mild = 1, moderate = 2, and severe = 3); the overview of these scores is shown in Figure 3B and C. The depression status of 53.8% and 53.3% of marked/moderate (7/13) and small/none (8/15) groups, respectively, remained unchanged with rTMS. A small proportion had changes (mild to none, none to mild, etc.) in depression with treatment.
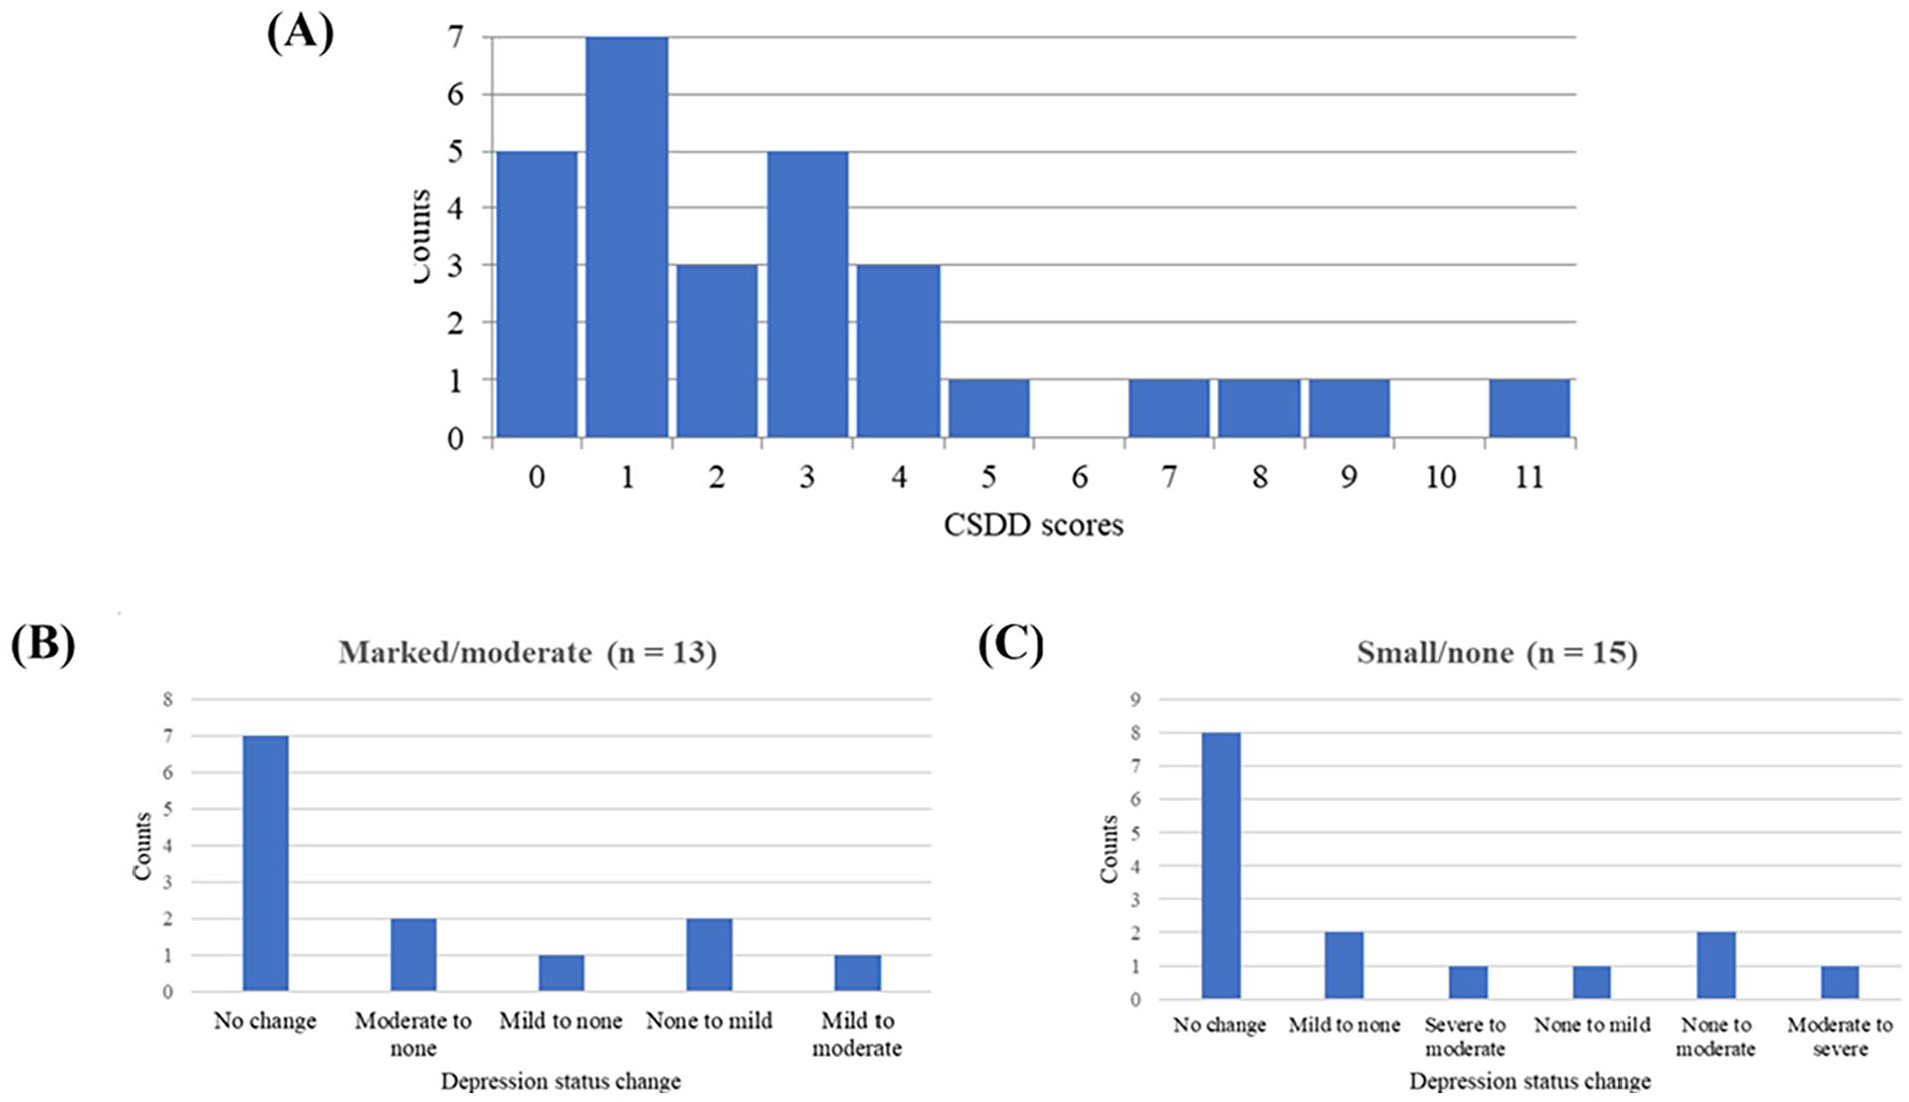
Plot of depression scores. (A) Histogram plot of Cornell Scale for Depression in Dementia (CSDD) scores of our participants (n = 28) who were not significantly depressed at baseline of rTMS treatment. Note that CSDD > 10 and CSDD > 18 indicate probable and definite major depressive disorder (MDD), respectively. No participant had definite MDD (CSDD > 18). (B-C) Bar plots of post-treatment depression status change (from the Neuropsychiatric Inventory Questionnaire (NPI-Q) scores of question no. 4) of (B) marked/moderate (n = 13) and (C) small/none (n = 15). More than half of these 2 groups remained unchanged in depression with rTMS treatment.
Discussion
In this study, we analyzed depression-specific features of EVestG (extracted from FPave and IH33) and investigated whether there were any significant changes (improvement) post-treatment compared to the baseline of the rTMS treatment amongst 28 participants who received active treatment. We observed a non-significant difference in EVestG depression features after rTMS active treatment. Further, the change in the EVestG depression features after rTMS intervention was found to be not significantly associated with cognitive status changes with rTMS treatment.
The first EVestG feature was calculated from the PPP and PPT regions of the FPave of EVestG based on a study on MDD. 17 The PPP region is anatomically peripherally derived, while the PPT region is likely to be considered a combination of responses from the peripheral and brainstem activities.17,30 These PPP and PPT regions are hypothesized to be equivalent to the P1 and N2 parts of the acoustic compound action potentials (CAP), respectively, and the production of P1 and N2 peaks is likely to represent repolarization mechanisms.29,30 The changes of these mechanisms were speculated to be related to FPave shape feature differences of PPP and PPT in prior depression study, 17 while we found no specific pattern of changes in these features between marked/moderate and small/none at baseline and post-intervention.
We calculated the second feature from the IH33 plot, following the prior depression study. 17 The IH33 plots of the 2 response groups’ acceleration and deceleration responses mainly overlapped in the selected bins at baseline or post-intervention (Figure 2C and D), resulting in an insignificant finding in IH33 features. This also precluded us from drawing a robust conclusion regarding the relation of these features with the relatively low depression severity of our participants before and after treatment.
ADAS-Cog, as a primary treatment outcome measure in Moussavi et al. 23 and the change of this measure appeared poorly correlated to FPave or IH33 feature change with treatment. Since our participants were not severely depressed (Figure 3A), it is less likely to observe any significant effect of rTMS on their EVestG depression features. The depression scores of the NPI-Q scale indicate that more than half of the sample had unchanged post-treatment depression (Figure 3B and C), also indirectly supporting our insignificant findings. Some of the participants had changes in depression status on the NPI-Q scale. Even 3 participants from the marked/moderate group and 4 participants from the small/none group showed worsening depression status after rTMS treatment. However, it may not be possible to make robust conclusions regarding these participants only based on the NPI-Q depression scores because we didn’t have their post-treatment CSDD assessments, and our overall EVestG findings were insignificant. Furthermore, we investigated EVestG signals in 3 groups with responses of marked/moderate (n = 13), small (n = 9), and none (n = 6); the results were similar to those of 2 groups and are presented in Figures S1 to S3 of the Supplemental File.
We acknowledge the small sample size of this study as the main limitation. Nevertheless, this study using quantitative EVestG depression measures shows no significant support for depressive severity improvement when rTMS is applied to AD participants with non-significant levels of depression.
Conclusion
In this study, we did not find a significant change in EVestG-driven depression features after rTMS treatment, and this change in depression was not correlated with cognition change either. Our AD participants were not significantly depressed, which might be the reason for the null results of this study.
Supplemental Material
sj-docx-1-exn-10.1177_26331055241268108 – Supplemental material for Does Repetitive Transcranial Magnetic Stimulation of Alzheimer’s Patients Improve Cognition or Depression or Both?
Supplemental material, sj-docx-1-exn-10.1177_26331055241268108 for Does Repetitive Transcranial Magnetic Stimulation of Alzheimer’s Patients Improve Cognition or Depression or Both? by Chandan Saha, Zeinab Dastgheib, Brian Lithgow and Zahra Moussavi in Neuroscience Insights
Footnotes
Acknowledgements
We acknowledge the assistance of our AD individuals and their caregivers in the rTMS efficacy study (funded by Weston Brain Institute) for volunteering in this additional EVestG study.
Abbreviations
rTMS, repetitive transcranial magnetic stimulation; AD, Alzheimer’s disease; MDD, major depressive disorder; EVestG, Electrovestibulography; FP, field potential; FPave, averaged field potential curve; IH33, 33-interval histogram; PPP, post-potential peak; PPT, post-potential peak trough; ROC, region of convergence; ADAS-Cog, Alzheimer’s Disease Assessment Scale-Cognitive Subscale; MoCA, Montreal Cognitive Assessment; CSDD, Cornell Scale for Depression; HIS, Hachinski Ischemic Score; MADRS, Montgomery-Asberg Depression Rating Scale; NPI-Q, Neuropsychiatric Inventory Questionnaire; ADCS-ADL, Alzheimer’s Disease Cooperative Study-Activities of Daily Living Inventory.
Author Contributions
CS analyzed data, interpreted results, and wrote the manuscript. ZD contributed to data acquisition and manuscript writing. BL and ZM supervised the whole project, reviewed, and edited the manuscript.
Funding:
The author(s) disclosed receipt of the following financial support for the research, authorship, and/or publication of this article: The authors are grateful for Puchniak’s family donation for this study. The EVestG facility has been donated by NeuralDx Pty. Ltd.
Declaration of Conflicting Interests:
The author(s) declared the following potential conflicts of interest with respect to the research, authorship, and/or publication of this article: The author, Brian Lithgow, is a part-time research consultant for NeuralDX Pty Ltd. and has <0.5% shares in NeuralDX Pty Ltd. Other authors have no conflict of interest.
Data Availability Statement
The data in this study can be available upon reasonable request, and NeuralDx Pty Ltd., Victoria, Australia, must be contacted for sharing data.
Supplemental Material
Supplemental material for this article is available online.
References
Supplementary Material
Please find the following supplemental material available below.
For Open Access articles published under a Creative Commons License, all supplemental material carries the same license as the article it is associated with.
For non-Open Access articles published, all supplemental material carries a non-exclusive license, and permission requests for re-use of supplemental material or any part of supplemental material shall be sent directly to the copyright owner as specified in the copyright notice associated with the article.