
Abstract
Background and aims
The findings on the relationship between sodium intake and health outcomes such as cardiovascular disease and all-cause mortality have been controversial. Some studies found the relationship between sodium intake and all-cause mortality was linear while others found a U-shaped or J-shaped relationship. This study aimed to identify the methodological issues contributing to the conflicting findings.
Methods and results
The present study investigated methodological gaps in assessing the relationship between sodium intake and health outcomes (hypertension, cardiovascular disease, and all-cause mortality). The contradictory findings appear to stem from flawed methods used in the published studies: (1) Both spot and 24-h urinary sodium collection methods underestimate the adverse effects of low sodium intake and overestimate the harmful effects of high sodium intake, (2) the linear relationship between sodium intake and all-cause mortality appears to be a result of random chance due to small sample sizes, and (3) the divergent temporal trends of sodium consumption and hypertension prevalence indicate sodium intake was not the primary cause of the worldwide hypertension epidemic.
Conclusion
Considering, (1) sodium is an essential nutrient, (2) the adverse effects of low and high sodium intake appear to be under- and over-estimated, respectively, (3) large studies have found a U-shaped or J-shaped relationship between sodium intake and all-cause mortality, and (4) sodium consumption is unlikely to be the major driver behind the worldwide hypertension epidemic and has little effect on the blood pressure of most normotensive individuals, the recommendation for population-wide low sodium intake merits further evaluation.
Keywords
Introduction
Studies, including observational analyses and randomized controlled trials, have shown reducing sodium intake can lower blood pressure, especially for hypertensive individuals.1,2 As a result, many health organizations around the world support the recommendation of low sodium intake -- “no more than 2300 mg a day and moving toward an ideal limit of no more than 1500 mg per day for most adults.” 3
However, the relationship between sodium intake and other health outcomes such as all-cause mortality has been controversial. Some studies found the relationship between sodium intake and all-cause mortality was linear – high sodium intake was associated with high mortality in a dose-response fashion,4–12 while others revealed a U-shaped or J-shaped relationship – both low and high sodium intake were associated with higher mortality.13–24 Consequently, the optimal level of sodium intake for overall health has become highly controversial.12,24
The purpose of this study is to examine the potential methodological gaps resulting in the contradictory findings on the relationship between sodium intake and health outcomes.
Methodological pitfalls
In assessing the relationship between sodium intake and health outcomes, the methods used to estimate sodium intake play a pivotal role. Sodium intake can be estimated from dietary assessment, spot urinary sodium collection, and 24-h urinary sodium collection. The problems with dietary assessment have been well recognized. 25 However, the advantages and disadvantages of the spot and 24-h urinary sodium collection methods are yet to be further examined because studies have shown the two methods result in different shapes of correlations (linear or U-shaped) between estimated sodium intake and health outcomes such as cardiovascular disease and all-cause mortality.4–24
In addition, improper statistical inference based on small sample sizes and uncontrolled confounding factors can result in misleading results too.
Spot urinary sodium collection (SUSC)
It is well known formula-estimated 24-h urinary sodium excretion based SUSC, including fasting morning collection, may not be reliable for small-sample studies due to the randomness of urinary sodium concentration. 26 For large population studies, however, SUSC can be a valuable tool because the randomness can be averaged out by large sample sizes. 25 Nevertheless, the critics of SUSC have demonstrated all formulas, including the Kawasaki equation, systematically overestimate 24-h sodium excretion at lower levels and underestimate it at higher levels, and therefore concluded “the J-shaped relationships are due to intrinsic problems in the formulas, not due to spot urine sampling.”4–7
However, a closer examination reveals the inference that the formula-induced overestimation/underestimation of sodium excretion changed the relationship from linear to U-shaped is flawed, which can be readily illustrated with a hypothetical example. In Figure 1, the 20 blue data points (representing 20 patients or participants) and the trend line are assumed to be the true linear relationship between sodium intake and blood pressure (CVD and all-cause mortality can be similarly graphed too). The four orange data points on the lower left corner represent the overestimation of the sodium excretion of the four patients with the lowest sodium intake. And similarly, the four orange data points on the upper right corner represent the underestimation of the high sodium secretion of the four patients with the highest sodium intake. The effect of biased sodium intake estimation on the relationship between sodium intake and health outcomes.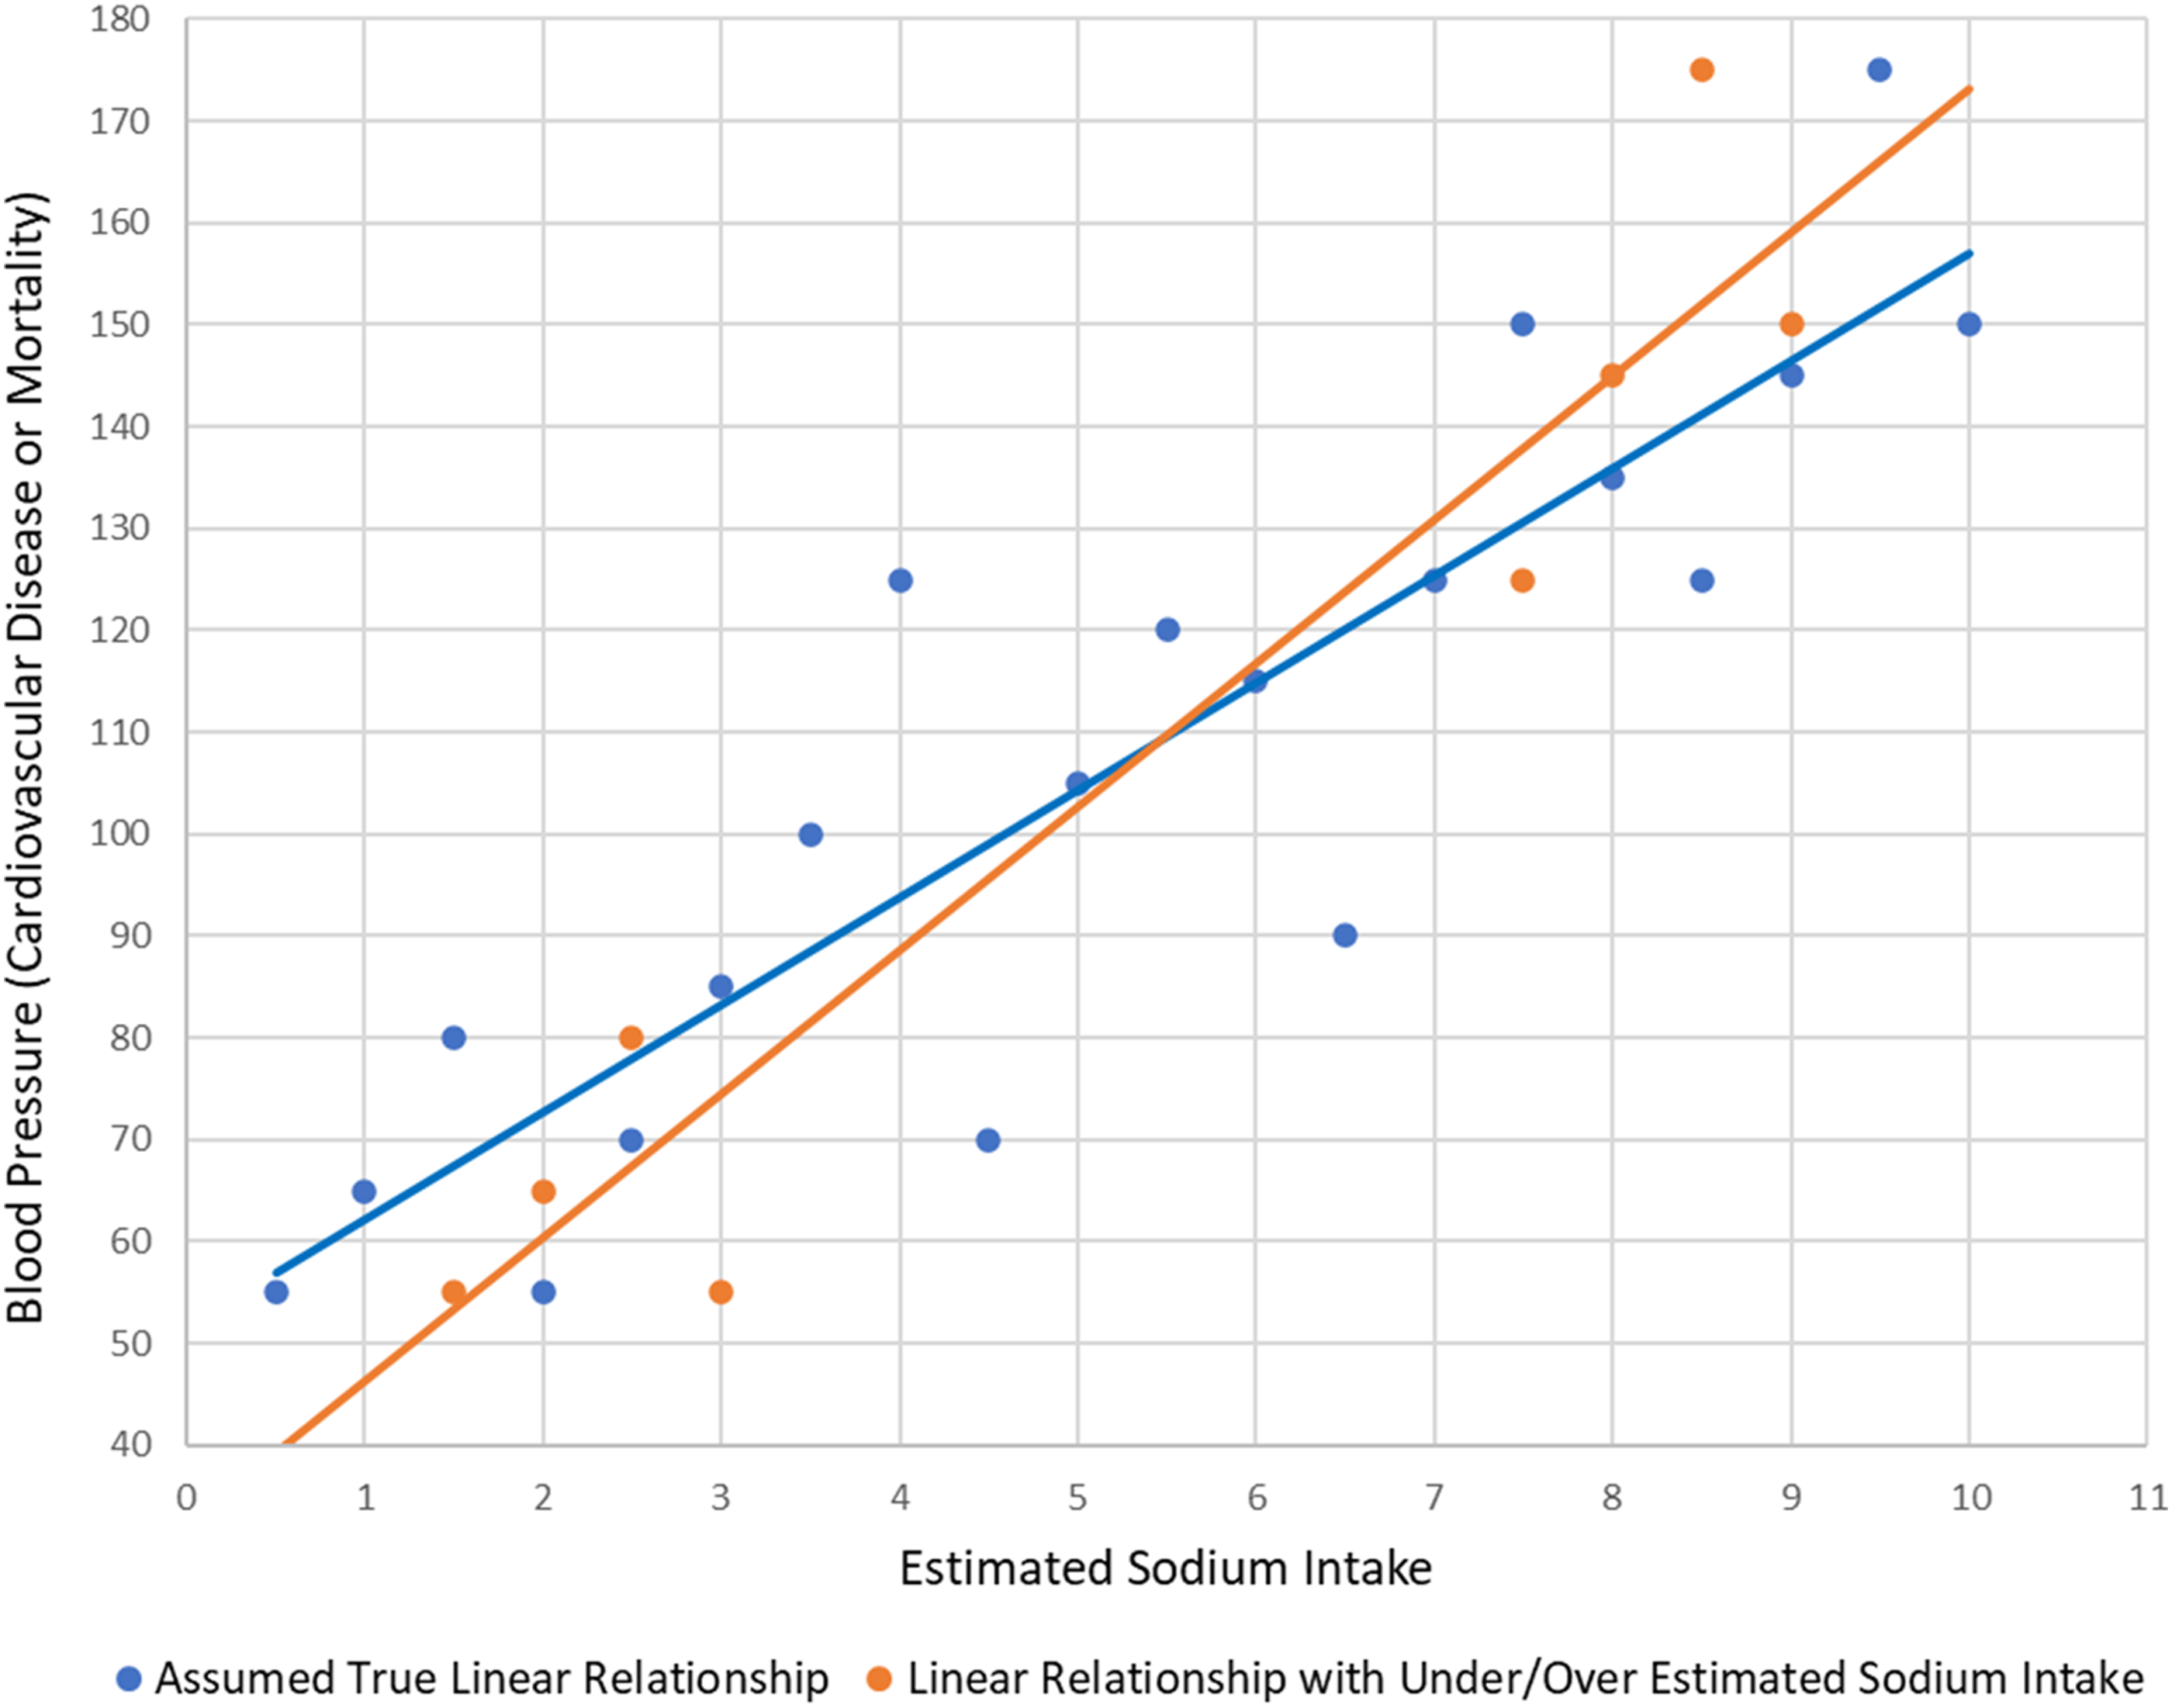
Evidently, the overestimation of low sodium excretion does not exaggerate the harmful effect of low sodium intake, and the underestimation of high sodium excretion does not understate the ill effect of high sodium intake. Instead of changing the linear relationship to the U-shaped, the formula-induced overestimation/underestimation of sodium excretion in fact results in a steeper slope of the linear relationship, which understates the harm of low sodium intake and exaggerates the harm of high sodium intake. This clearly shows the U-shaped relationship between sodium intake and health outcomes (hypertension, CVD, and all-cause mortality) is not due to the formula-induced overestimation/underestimation of urinary sodium excretion.
24-Hour urinary sodium collection(s)
Estimating sodium intake from 24-h urine collection(s) is considered the gold standard. However, for large population studies, this method is burdensome, and the compliance rate can be low. 23 For instance, in a recent study, 1130 participants were selected for 24-h urine collection, but only 827 (73%) completed the collection. 27
Nevertheless, noncompliance per se would not induce serious bias if the missing collections are random among all the study participants. However, given studies showing individuals with poor health are less likely to be employed and thus have more flexible/free time compared to their healthier counterparts,28,29 and lack of time and survey burden are main reasons for not responding to surveys,30,31 there is good reason to believe that healthier individuals are busier, and busier people are more likely to miss urine collections regardless of single or multiple collections. This could contribute to a spurious association: low sodium excretion or intake is correlated with good health.
A more serious problem with 24-h urinary sodium collection is that the sodium loss from sweat is unaccounted for. For individuals who are physically active or on physically demanding jobs, sodium loss through sweat can be substantial. For instance, a study found, “People working in moderately hot conditions for 10 h on average will lose between 4.8 and 6 g of sodium (Na) equivalent to 12-15 g of salt.” 32
Healthier people are more physically active,33,34 albeit the causal direction is unclear. And individuals with poor health are less likely on physically demanding jobs. Therefore, there is good reason to believe healthier people lose more sodium through sweating and thus excrete less sodium in urine, which again can result in a false association – low sodium excretion or intake goes together with good health. Of course, certain medical conditions can induce hyperhidrosis (sweating excessively). But the latest study showed only 4.8% of the general population have this disorder in the US, 35 which include primary hyperhidrosis (idiopathic) and secondary hyperhidrosis resulting from an underlying medical condition such as obesity or using certain prescription drugs.
Theoretically, the bias created by missing collections and sweat can be corrected by controlling for relevant confounders. However, in practice, it is rather challenging if not impossible. For example, major studies on this topic controlled for the confounders by using measures like exercising at least once per week,4–6 or exercising <1, 1-2, or >2 times per week. 11 But variables like these contain no information on the duration and intensity of the exercises and little information on how busy the individuals are. Further, ‘blue-collar’ workers and even many ‘white-collar’ workers (e.g., nurses, and physical therapists) may not need and report any exercises.
Sample size
Conceptually, few do not know the consequences of small sample sizes in studies. However, for whatever reason, the uncertainties resulting from small sample studies are often overlooked in the literature, especially when conducting observational studies on the participants of randomized controlled trials (RCTs). Sample sizes in the hundreds in RCTs assessing short-term outcomes (e.g., how sodium intake affects blood pressure) are decent, but inadequate for meaningful conclusions in observational studies on outcomes such as cardiovascular disease and mortality. For instance, using the data from TOHP (trials of hypertension prevention) I and II,36,37 studies found a linear relationship between sodium intake and all-cause mortality.4–6 However, there were only 246 participants in TOHP I and 66 participants in TOHP II having sodium intake below 2.3 g per day, let alone less than 1.5 g per day.
Not surprisingly, when TOHP I and II were analyzed together with other four studies that used the 24-h urinary sodium collection method, the relationship between sodium intake and all-cause mortality was found to be U-shaped. For unknown reasons, the authors only reported the U-shaped finding in the Supplementary Appendix (page 15; Figure S4) without mentioning it in the main text published in the 2022 January issue of the New England Journal of Medicine. 11
Correlations and causation
A recent systematic review examining 13 meta-analyses of 417 trials showed sodium intake reduction lowered systolic blood pressure (SBP) by an average of 5.79 mm Hg in hypertensive individuals (diastolic blood pressure or DBP was not reported). 2 However, in normotensive individuals, 13 meta-analyses of 369 trials showed reducing sodium intake only lowered SBP by 1.86 mm Hg. 2 And an earlier meta-analysis found the effect of reduced sodium intake was even smaller: for the hypertensive, the reductions of SBP and DBP were 4.06 and 2.26 mm Hg, respectively; for the normotensive, the reductions were 1.38, and 0.58 mm Hg, respectively. 8
There is no doubt that restricting sodium intake can lower blood pressure for many who are hypertensive. However, little has been reported on what proportion of the hypertensive individuals do not respond to sodium intake reduction. And apparently, reducing sodium intake has little effect on the majority of normotensive individuals. In addition, low sodium intake could raise blood pressure in about 15% of the normotensive individuals. 38
In addition to RCTs, cross-sectional studies have also shown a positive correlation between sodium intake and hypertension,1,8,12 however, no meaningful longitudinal studies found such an association. On the contrary, sodium intake has been mostly decreasing worldwide during the last century while the prevalence of hypertension has been rising. In the early 1900s, hypertension was rare in most areas of the world (about 5% of the adult population) while salt consumption was high (e.g., in Europe, the salt intake was about 18 g per day).39,40 Sodium intake has since substantially decreased worldwide but the incidence of hypertension has continued to climb. For instance, in China, the prevalence of hypertension increased from 10.4% in 1991 to 22.7% in 2009, while sodium intake decreased by 29% from 6.6 to 4.7 g per day during the same period. 41 Similar patterns were also observed in other countries such as the US and Canada.42–46
Taken together, although the cross-sectional studies and RCTs showing a positive correlation between sodium intake and hypertension give the impression that high sodium intake is the principal driver of the worldwide hypertension epidemic, longitudinal data contradict this notion. This paradox could be an artifact of confounders that were not properly controlled for in the observational studies where the study participants having high sodium intake consumed more processed food which now accounts for about 80% of our salt intake. 39 In addition to salt, processed food is also laden with other food additives and toxic chemicals that have been shown to induce hypertension.47–50 Hence, the real culprit behind the worldwide hypertension epidemic could be the harmful food additives and other chemicals rather than salt. And bear in mind, in RCTs, although reducing sodium intake can lower blood pressure for many hypertensive individuals, the sodium reduction acts as diuretics rather than addresses the root causes.
Discussion
Dietary sodium reduction policies have significant implications for public health worldwide. Although reducing sodium intake can lower blood pressure for many hypertensive individuals, however, the net health effect of sodium intake restriction remains controversial. Some studies found the relationship between sodium intake and all-cause mortality was linear in a dose-response fashion, while other studies found a U-shaped or J-shaped relationship – both high and low sodium intake were associated with higher all-cause mortality.
The contradictory findings appear to stem from methodological gaps in estimating sodium intake and study sample sizes. This study shows the methods used in estimating sodium intake in the published studies are likely to underestimate the adverse effects of low sodium intake and overestimate the harmful effects of high sodium intake. And the linear relationship between sodium intake and all-cause mortality is most likely due to small sample sizes of the studies.
The finding of the linear relationship implies the less sodium intake the better for health, and many indeed heed the recommendation for very low sodium consumption. But sodium is an essential nutrient and thus there must be an optimal or normal range of daily intake. Based on the large studies that used the spot urinary sodium collection method, the optimal sodium intake range for overall health is between 3 and 5 g per day (7.5 - 12.5 g salt per day). 24 This range is corroborated by a recent large-sample-size study based on 24-h urinary sodium collection, which showed the all-cause mortality rate was at its lowest level when daily sodium intake was about 3.5 g. 11
There is no doubt that hypertension is a serious threat to public health because it is an established risk factor for cardiovascular disease. For those who can meaningfully lower their blood pressure by reducing sodium intake, salt restriction can be an effective option. However, there may be a price to pay when sodium intake is too low and our body goes to a conservation state or ‘safety mode,’ especially for the normotensive and the hypertensive whose blood pressure is not sensitive to sodium intake reduction. This price might be reflected by the existing evidence showing a U-shaped relationship between sodium intake and all-cause mortality.
Obviously, the most effective treatment for hypertension without side effects is to address its root causes. But sodium consumption does not seem to be a major contributing factor to the hypertension epidemic given their divergent temporal trends. On the other hand, during the last century, the incidence of hypertension and many other chronic diseases has been rising in tandem with the production of and exposure to environmental toxins such as pesticides and other chemicals (e.g., volatile organic compounds, and endocrine disruptors). In fact, mounting evidence has linked hypertension to environmental chemicals.51–60 Of course, other factors such as chronic psychological stress and deficiency in micronutrients (e.g., vitamin D, and potassium) are at play too.61–70 Taken together, unfortunately, the campaign against salt could have distracted the public from finding and addressing the real root causes of the worldwide hypertension epidemic.
Conclusions
Given (1) sodium is an essential nutrient, (2) the adverse health effects of low sodium intake appear to be underestimated and the harmful effects of high sodium intake seem to be overestimated based on the existing methods, (3) the finding of a linear relationship between sodium intake and all-cause mortality appears to be a result of random chance due to small sample sizes, and studies with large sample sizes found a U-shaped or J-shaped relationship, and (4) sodium consumption is unlikely to be the major driver behind the worldwide hypertension epidemic and has little effect on the blood pressure of most normotensive individuals, the recommendation for population-wide very low sodium intake merits further evaluation.
Footnotes
Acknowledgements
The author is indebted to Mr Frederick Malphurs, a retired senior healthcare executive, a visionary leader who dedicated his entire 37 years’ career to patient care, for his continued support of research to improve public health.
Authors’ note
The views expressed are my own and do not necessarily represent the views of my employer.
Declaration of conflicting interests
The author(s) declared no potential conflicts of interest with respect to the research, authorship, and/or publication of this article.
Funding
The author(s) disclosed receipt of the following financial support for the research, authorship, and/or publication of this article: This material is based upon work supported (or supported in part) by the Department of Veterans Affairs, Veterans Health Administration, Office of Research and Development.