
Abstract
Keywords
Introduction
As qualitative patient experiences have moved into the forefront of medical literature, so too has the use of patient surveys to gather both qualitative and quantitative data. 1 Direct surveying of patients is the key methodology for discerning the qualitative aspect of healthcare. Traditionally, the delivery of surveys has been in person, over the phone, or via mail, with or without the use of incentives. Recently newer contact means such as email, text-message, and web-based have come into use, with variable success. Despite the importance of patient responses and newer, cheaper mediums for conducting surveys, response rates have been declining. 2 To date there is no consensus as to the required or acceptable response rate, however it is generally accepted that a response rate of 80% is desired to decrease non-response bias and ensure survey validity and reliability.3–6 In the published literature, few studies report response rates greater than 70%, with many failing to disclose a response rate. 3
In-person surveys have been shown to have the highest response rates but are also associated with significantly higher labour requirements.4,7 Phone surveys are a suitable alternative to in-person surveys with lower associated costs; however rates are decreasing, possibly due to the common practice of “screening” callers who withhold their numbers. 8 Getting patients to answer an unknown number is a major barrier to response rates from phone surveys. As cell phone ownership and usage is near ubiquitous, and most cell phones display the number that is calling when they ring, this practice is likely to become more and more established. In addition to direct calls, cell phones allow SMS-text messaging, which has been widely adopted and is often viewed as less intrusive.
As patient-related data is key to understanding behaviour and supporting implementation, we aimed to test a cheap, reliable methodology for a phone-based method of capturing qualitative and quantitative data from patients, with the aim of enhancing the response rate.
Methods
We aimed to prospectively recruit patients who underwent elective and emergent general surgical procedures in two metropolitan hospitals over two waves for a descriptive quantitative and qualitative cohort study surrounding the provision and consumption of postoperative analgesics. Patients must have undergone one of the prescribed procedures, be 18 years or over, and able to comprehend an English survey. Patients were excluded if they had no valid listed phone numbers or required an interpreter to converse in English. Patients who satisfied the inclusion criteria were contacted 1 week after their surgery for participation in a phone-based survey which typically took between 2–5 min to complete. Patients were not aware that they would be contacted. Contact information was gathered from hospital record.
Figure 1 demonstrates the method used for contacting patients for participation in our survey. Specific study phones and numbers were purchased for the purpose of the project. These did not have any privacy blocking features, allowing participants to see the study number, call back as required, and send SMS-text messages if required. Flowchart of attempts and collection timepoints.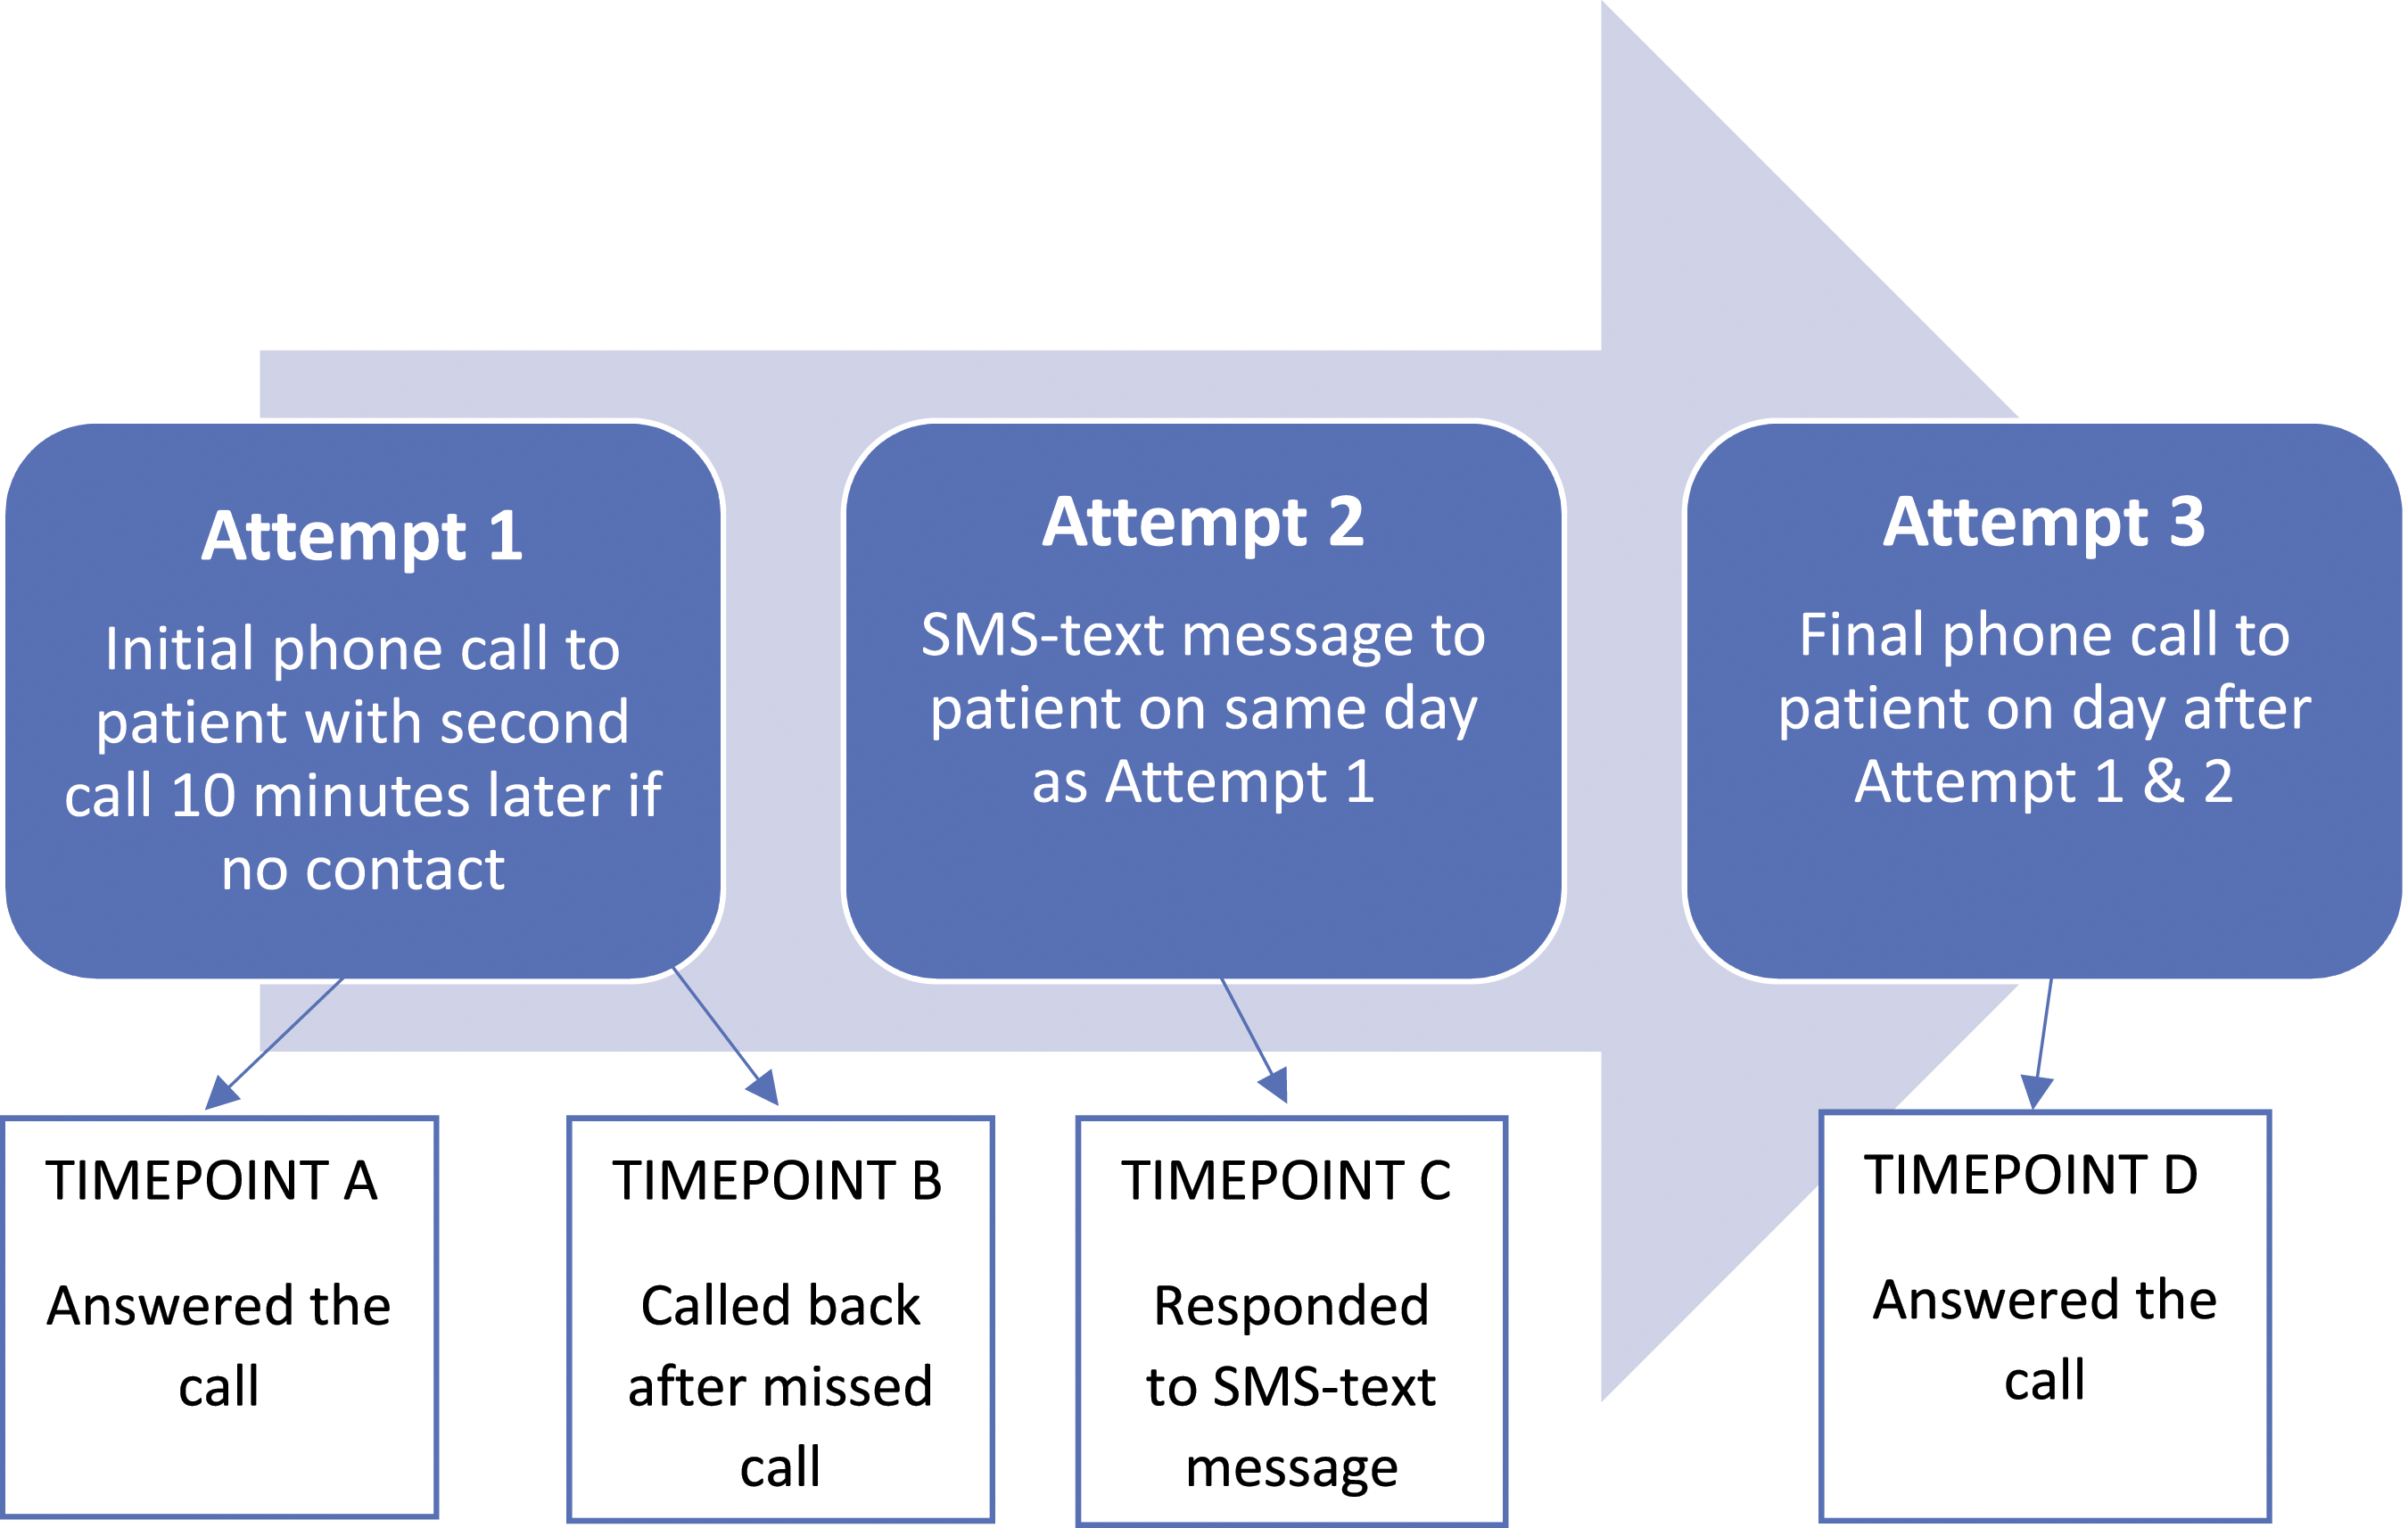
Attempt one consisted of an initial call to the patient, followed by a second call made 10 min later if there was no response to the first call. No voicemail message was left after either call. Patients successfully contacted by this stage were collected as timepoint A.
Those patients who did not answer the call after attempt one, but instead returned the missed call before attempt two was made, were collected as timepoint B. These patients were collected as a direct result of participants being able to call back the unblocked number.
Attempt two was a personalised text message sent to non-respondents from attempt 1. The message read: “Hi [name] my name is [investigator] and I am a [doctor/student doctor] at [hospital]. We are conducting a study looking at [study details]. I was hoping you could spare 2 or 3 min for a quick chat about your recent experience. Are you interested?”. Patients who responded to this text by either text or a call were collected as timepoint C.
Attempt three was a final phone call the day following the text message. Participants gathered at this stage was collected as timepoint D.
Preferentially, patient cell numbers were used as means of contact, however if no valid number was present, a residential number was attempted. If this occurred, no text message could be sent, and patients were only able to be collected in timepoint A or B. Calls were made between 9am-5pm, Monday to Friday excluding public holidays, unless requested by patients to be outside of these hours. Study investigators were either doctors or student doctors. The identities of the respondents were confirmed verbally by requesting their full name and procedure undertaken.
Using this method, we attempted to contact 1313 patients over two waves. In the first wave, 1102 patients over a 12-month period (March 2019–February 2020) were contacted. The second wave occurred 1 year later, with 211 patients being contacted over a 2-month period (February 2021-March 2021).
For comparison, baseline data was sourced from our institution on response rates for routine discharge follow-up phone calls that utilize no caller ID (i.e. blocked numbers). These phone calls were made by nursing staff, between 1–10 days after discharge. Three attempts were made to patients with no utilization of voice or text messaging.
The primary outcome measured was “patient survey participation”; this was collected via a dichotomous “yes-no” variable. A subgroup analysis was performed to assess the effect and significance that collection strategies had on the primary outcome.
A complete case analysis strategy was adopted, where patients without complete data were excluded from analysis. Statistical analysis of continuous variables involved independent t-tests for normally distributed variables; Mann-Whitney U-tests for non-parametric or ordinal factors; and Chi-Squared test for categorical variables. All continuous variables were tested for normality via Shapiro–Wilk test before further analysis as either parametric or non-parametric data.
Further subgroup analyses were performed to determine significance differences in baseline characteristics between dichotomous variable groups. Statistical analysis was conducted via RStudio. 9
Ethics approval was granted by the local authorities (Hunter Research Ethics Committee) for the overarching project (Reference: 2019/ETH03915).
Results
Cohort demographics.
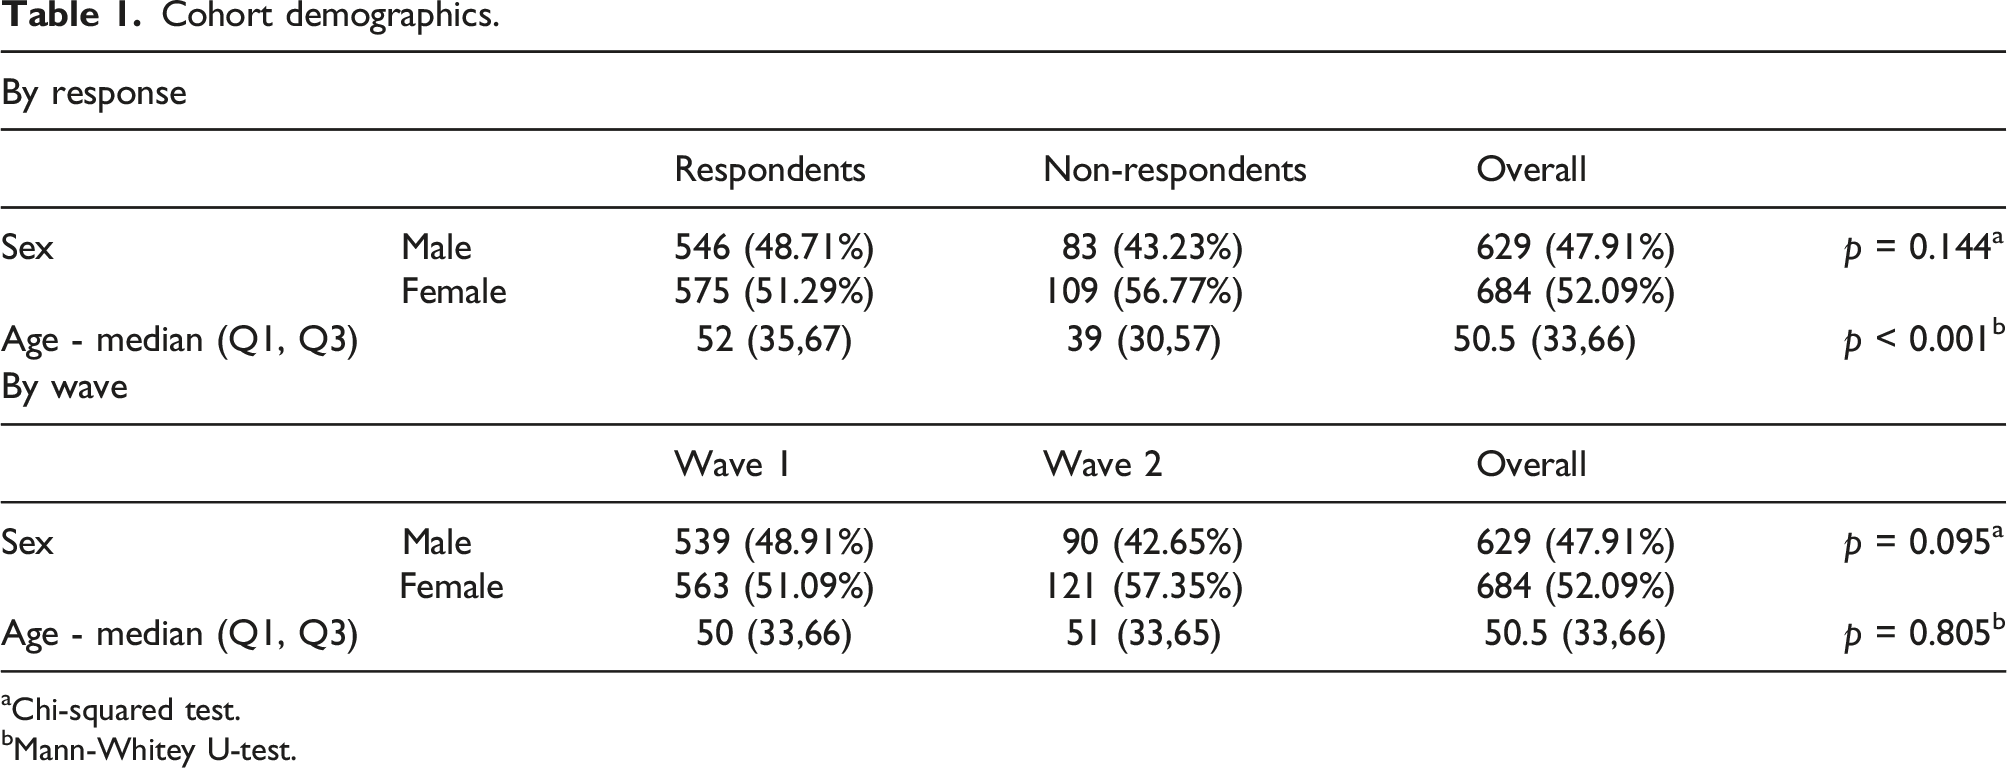
aChi-squared test.
bMann-Whitey U-test.
Age distribution of cohort.
Breakdown of contact and timepoints for total cohort.
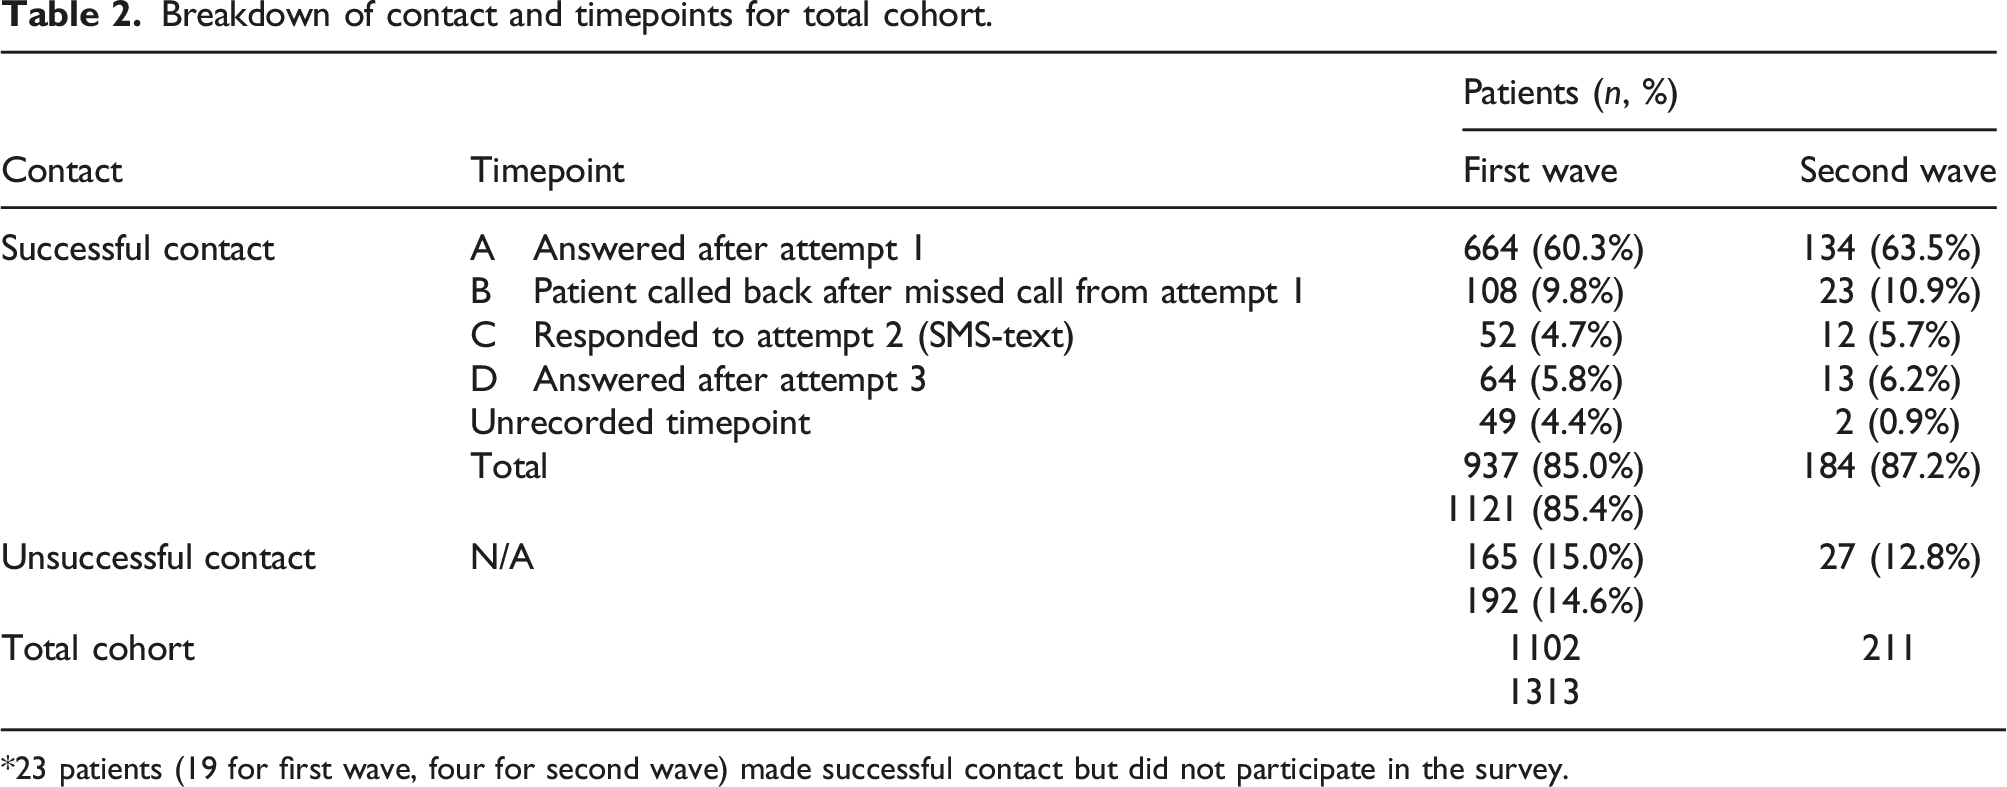
*23 patients (19 for first wave, four for second wave) made successful contact but did not participate in the survey.
60.7% of the total cohort answered the first attempt at contact (timepoint A). 10.0% of the cohort then returned the missed call (timepoint B), in the absence of voice or text messaging. A further 10.7% of the cohort responded (either via text, calling, or answering the call) after receiving a text message (timepoints C and D). 3.9% of the study population successfully answered the call, but the timepoint went unrecorded (Figure 3). Contact rates of cohort for each timepoint.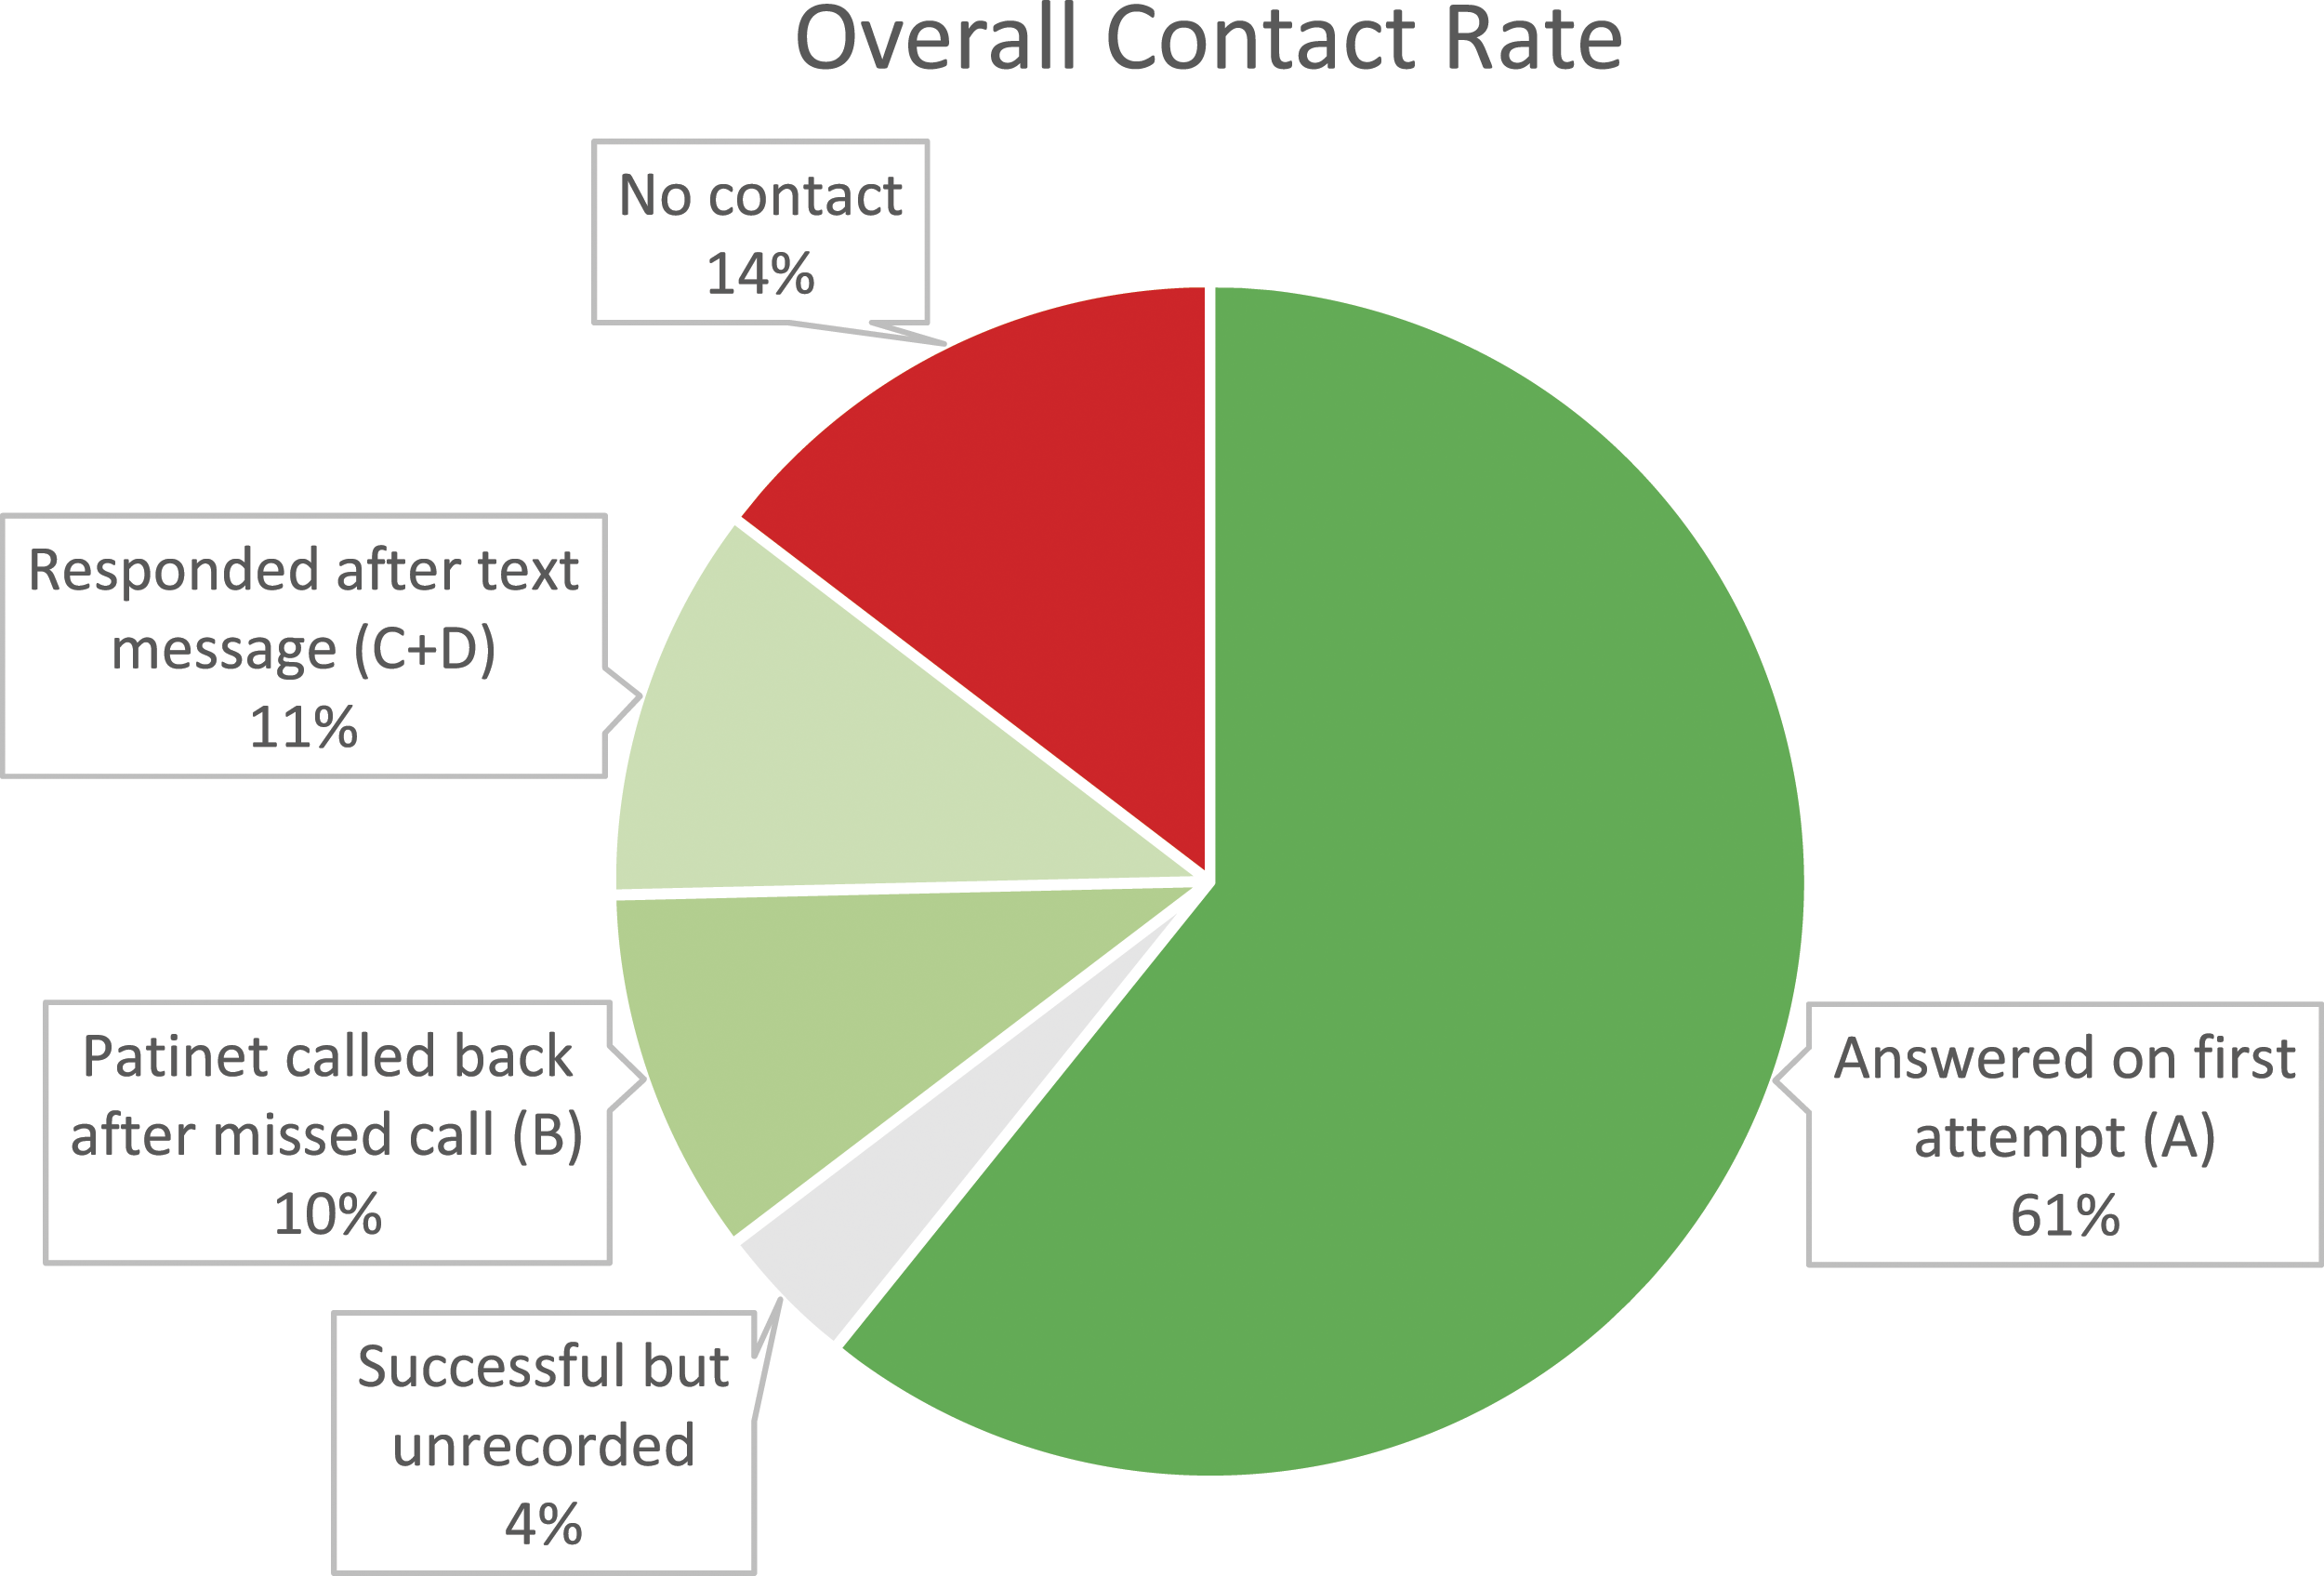
The combination of not withholding our number and sending a text message to the patients led to 224 additional respondents (20.3% more of the overall cohort) in the first wave, and 48 additional respondents (22.7% more of the overall cohort) in the second wave. This increased the number of answered calls from an initial 60.7%–85.4% (a 40.7% increase).
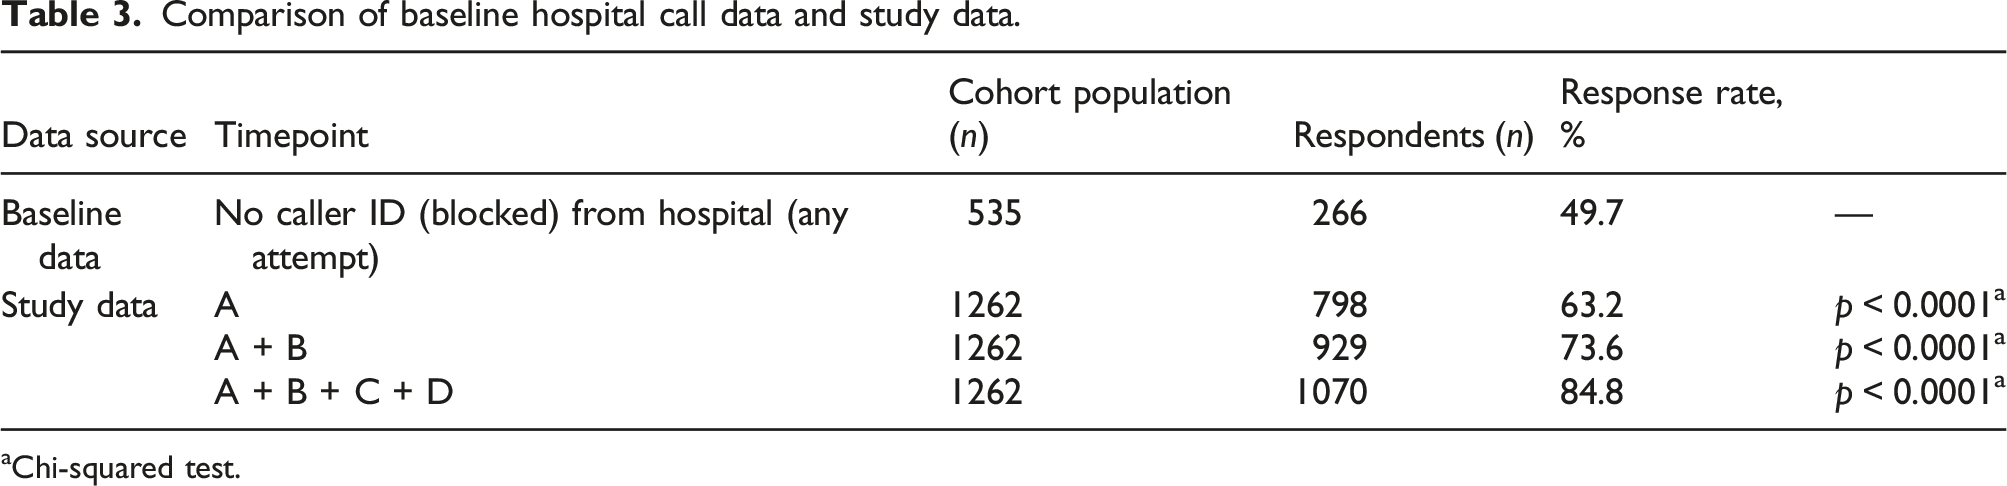
Comparison of baseline hospital call data and study data.
aChi-squared test.
Discussion
A high response rate is vital in reducing non-response bias, thus ensuring reliability and validity of any research involving patient surveys. This is an ever-present challenge in today’s literature and has proven difficult to overcome. Many have written on the topic of improving response rates through differing survey mediums and incentivisation.10,11 The required response rate is controversial. Epidemiological studies and journals typically seek response rates of at least 80%, however published medical literature is varied, with response rates ranging from 25–98%.3,6 With the ever-increasing practice of call screening, getting patients to answer phones for the purpose of patient surveys is becoming difficult.
Our methodology returned a call response rate of 85.4% which converted to successful completion of surveys in all but 21 patients (2%), giving a survey response rate of 83.6%. We attribute this success to several factors: use of cell phones with caller ID; use of text messaging; the relatability of the survey topic; the brevity of the survey tool; and the willingness to engage with medical professionals.
At our institution, all patients are routinely called in the days following discharge by nursing staff using a hospital number that has privacy blocking (i.e. no caller ID). Hospital data reveals a successful call rate of only 49.7%. Contrastingly, with our method, 61% of our study population answered the call on first attempt of making contact. This is 11% higher than our hospital, equating to a 22% increase in responses. Clearly, patients are more likely to answer identifiable calls, which may relate to fear of cold caller salespeople, government agencies, or telephone fraud scams. This difference in responses between similar populations demonstrates the power of calling from unblocked numbers.
Further to this, 10% of patients called back after missing our initial call, enhancing the response rate. This function is not available when using blocked numbers. In addition, another 11% of the study population was able to be recruited after engaging via text message. This was achieved through responding to the text to organise a good time to call, calling back, or answering the call the following day.
Put together, we increased the call answer rate to 85.4% with the use of caller ID and text messaging – a 70.8% increase from the 50% baseline call response from our institution’s data.
Only 2% of those successfully contacted did not consent to proceeding with the survey, resulting in a 98% conversion rate. This may reflect the willingness of post-surgical patients to participate in a survey surrounding their experience of the management of pain after their operations. Other contributors may have been the brevity of the survey and that doctors or student doctors were contacting patients directly.
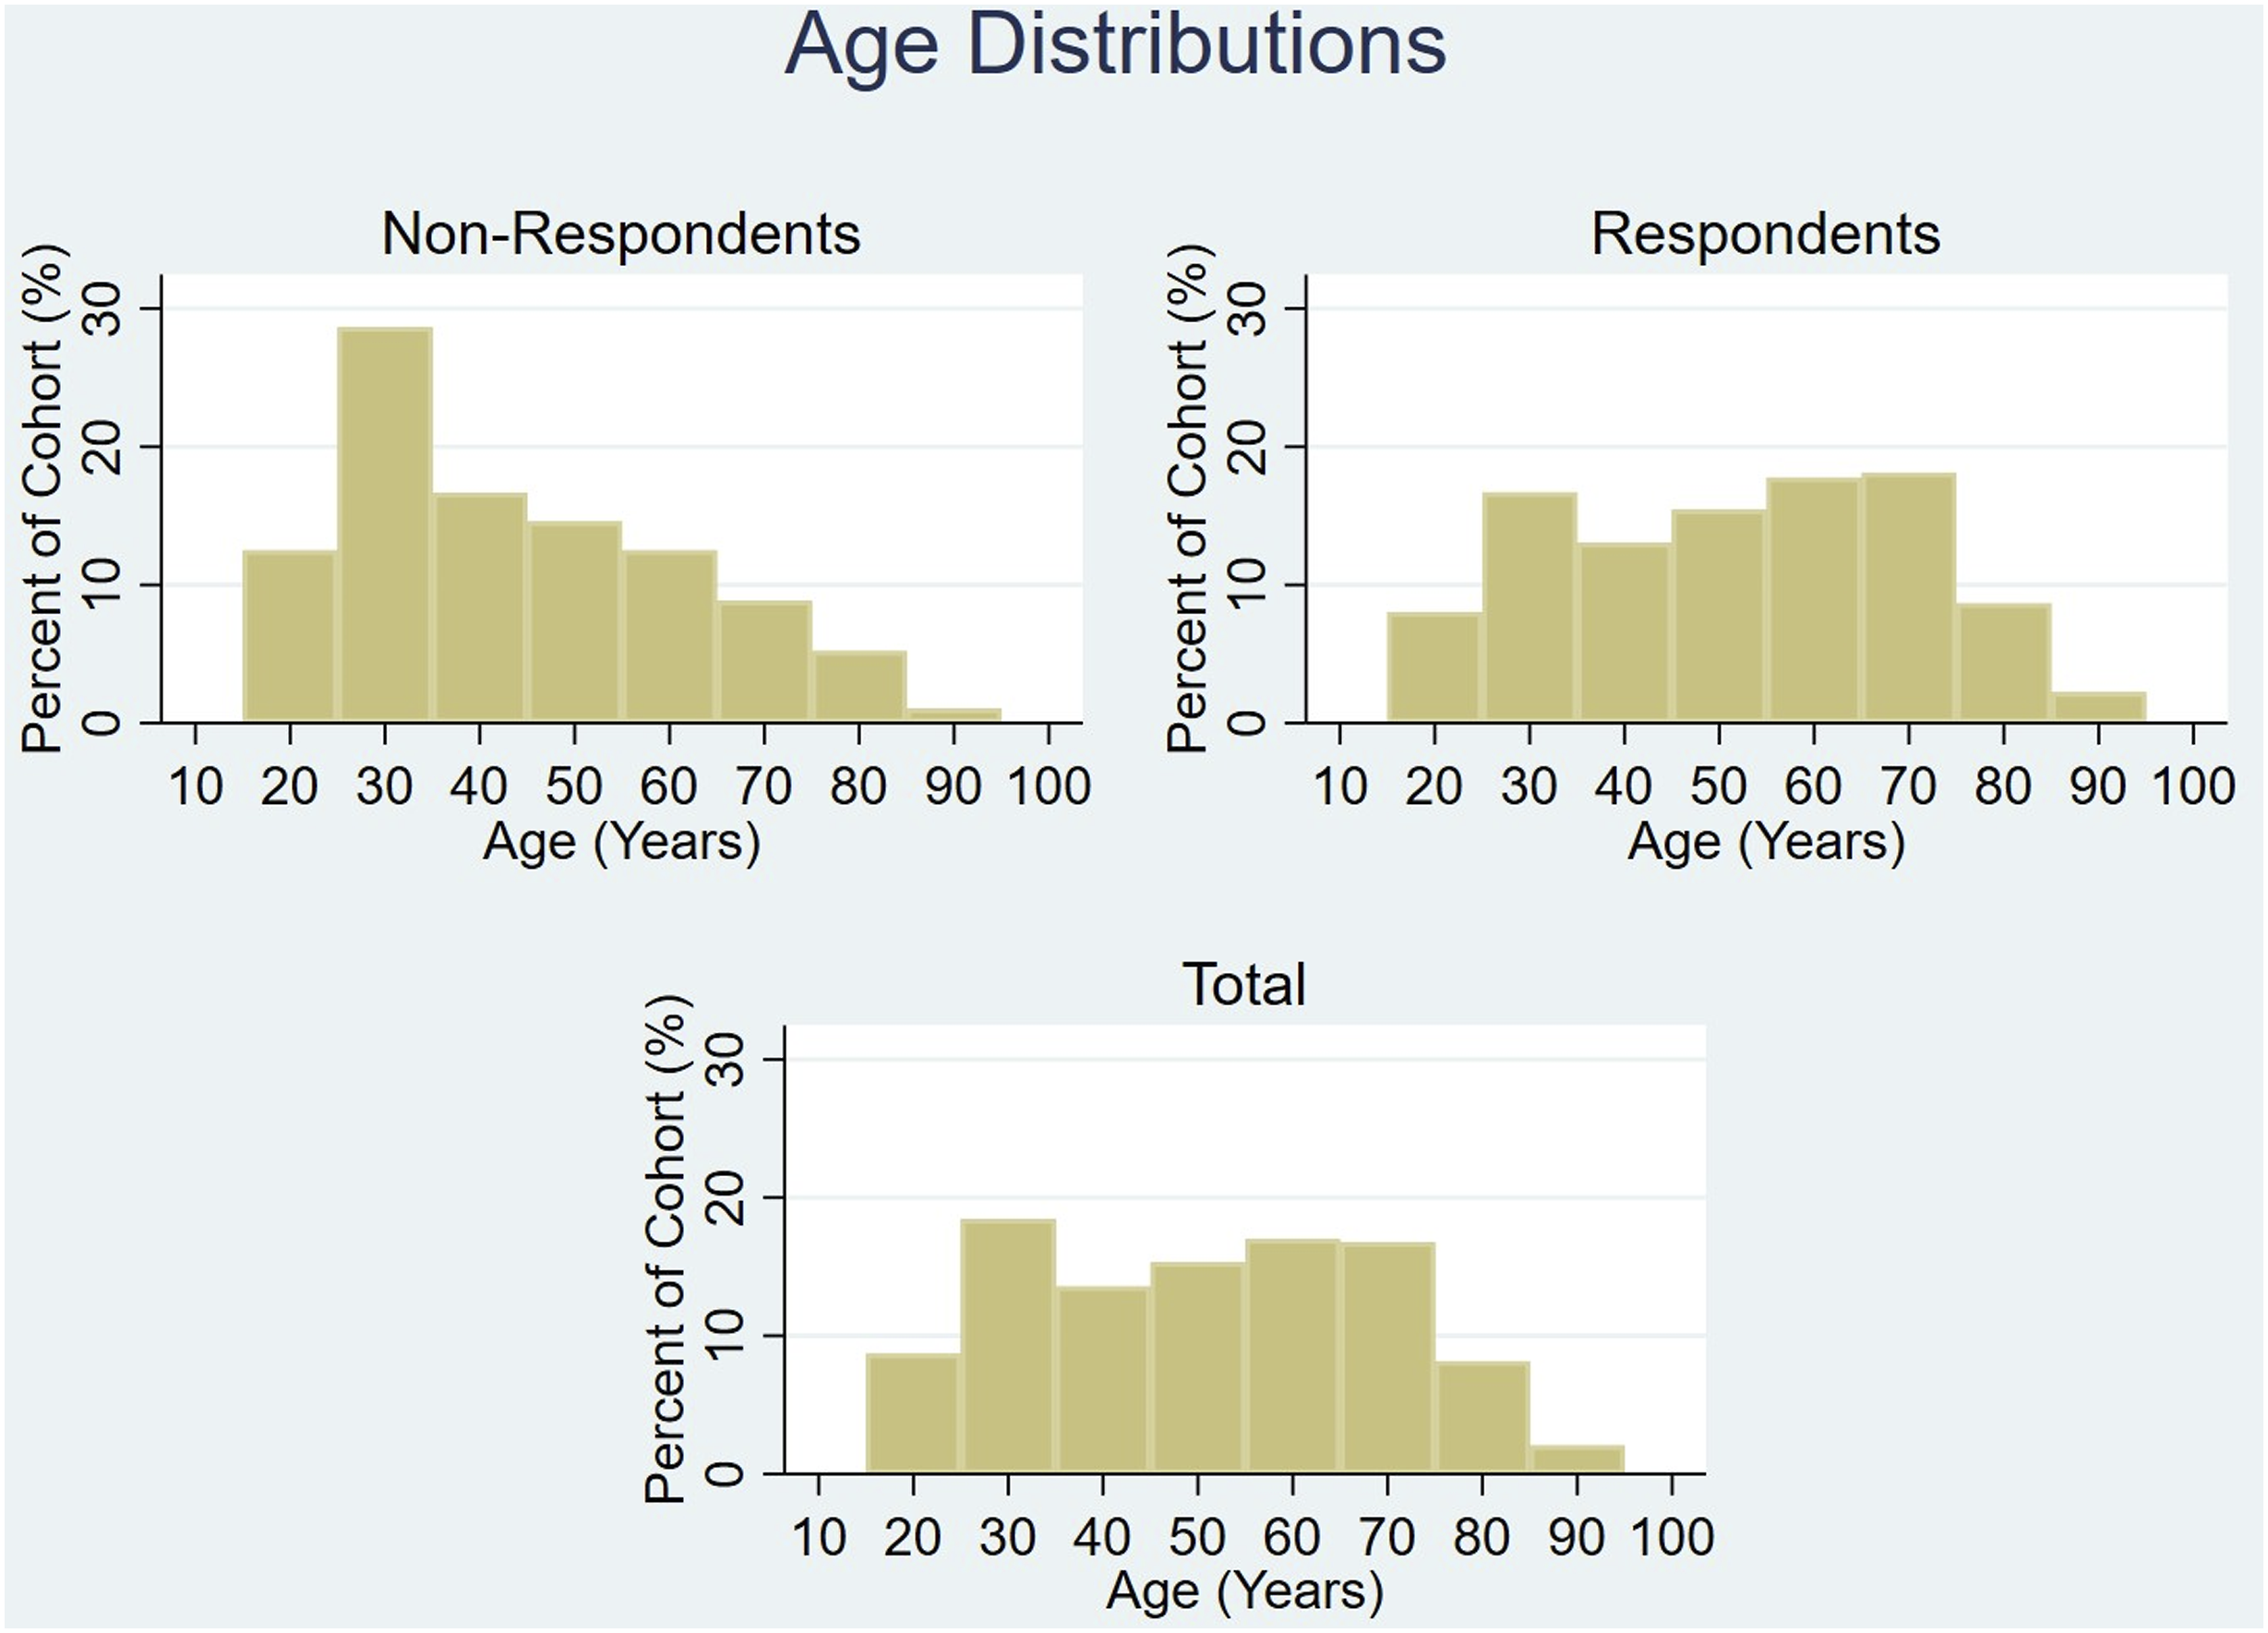
We note that the age distributions are different between the responders and non-responders, most notably in the decade surrounding 30 year-olds. This may represent that our methodology had poorer uptake in this age bracket, perhaps due to a higher likelihood of work commitments and call screening. However, since the non-responder group is significantly smaller than the responder group (211 and 1102, respectively) this may simply reflect an amplification of effect secondary to small sample size.
The cost of this methodology is negligible. Basic cell phones are inexpensive – as are unlimited call and SMS plans without data – making this cost-effective.
The main limitation with this methodology is its generalisability to other studies and other populations. Our study is from a teaching hospital in a large urban and semi-urban district with a similar population structure to the rest of Australia. It is therefore reasonable to assume that similar results would be attained elsewhere in Australia, however thus far it has been untested internationally. It is also untested for different topics of enquiry, longer surveys, and conduction by non-doctors.
Conclusion
With our methodology we were able to get 85.4% of a patient cohort to answer a call from an unknown number which resulted in an 83.6% response rate to a qualitative and quantitative patient survey. This is a 70.8% increase in call response when compared to using blocked numbers alone for contacting patients. The protocol is inexpensive and reproducible over time, however is yet to be implemented outside of Australia.
Footnotes
Declaration of conflicting interests
The author(s) declared no potential conflicts of interest with respect to the research, authorship, and/or publication of this article.
Funding
The author(s) received no financial support for the research, authorship, and/or publication of this article.