
Abstract
Macrophage migration inhibitory factor (MIF) is a key pro-inflammatory cytokine in immuno-inflammatory diseases. For the first time, we examined the expression of MIF in Epinephelus awoara (E. awoara). MIF expressions have been detected in the head kidney, spleen, liver, brain, intestine, gill, heart, stomach, and muscle of E. awoara infected with Vibrio parahaemolyticus. The mRNA levels observed in infected groupers were higher than those in healthy groupers. MIF, tumor necrosis factor-α (TNF-α), and interleukin-1 (IL-1) tissue levels have been measured by ELISA. A significant increase in MIF, TNF-α, and IL-1 tissue levels have been found in the treatment groups compared with those in controls. MIF, TNF-α and IL-1 tissue levels in the spleen, head kidney, intestine, and liver of E. awoara during the challenge trial with V. parahaemolyticus were significantly higher than those in controls. There was evidence of functions of MIF in a positive feedback loop with TNF-α and IL-1 that could perpetuate the inflammatory process in grouper infected with V. parahaemolyticus. In conclusion, these results indicated that MIF was related to pathogen-induced immune response.
Introduction
Groupers are considered as luxury consumption in China, Southeast Asian countries, the Atlantic Ocean, and Mediterranean Sea. A rapid expansion of commercial grouper aquaculture activities were practiced in most parts of world, which resulted in many disease outbreaks. 1 Vibrio parahaemolyticus affects many marine vertebrates and invertebrates including marine teleosts, including Epinephelus awoara. 2
Macrophage migration inhibitory factor (MIF) plays a critical role in several autoimmune inflammatory diseases in mammals, birds, amphibians, and fish.3–5 MIF is the first molecule to get to the inflammation site. MIF measured the degree of cellular inflammation. 6 The mechanism of fish MIF in response to bacterial infection is unknown. MIF has already been considered as a new therapeutic target and a biomarker in the diagnosis and treatment of human multiple septicemia, which prompts us to investigate the role of MIF in immunity against fish vibriosis.
Moreover, in humans, mammals, and zebrafish, MIF protein and mRNA were expressed in many infectious and inflammatory diseases.5,7 To date, MIF genes have been measured in sea lamprey (Petromyzon marinus) and some teleost fish. MIF has not yet been reported in E. awoara.
MIF can promote the secretion of inflammatory cytokines tumor necrosis factor (TNF)-α, interleukin (IL)-6, and IL-12.3,4 MIF further co-stimulates T and B lymphocytes and upregulates the production of IL-6, interferonc, and TNF-α by a feed-forward, positive feedback loop. TNF-α, in cooperation with IL-1, plays an important role in inflammatory diseases.8,9 To our knowledge, there are no studies on the functions of MIF in groupers. Little is known about the relationship between inflammatory diseases and MIF.
For the first time, the MIF mRNA expression of several tissues in E. awoara was examined. E. awoara is infected with V. parahaemolyticus. The MIF, TNF-α, and IL-1 tissue levels in E. awoara have been analyzed using real-time polymerase chain reaction (PCR). These results may allow us to gain more insight into the immunological function of MIF gene in E. awoara. Our results have proved that the MIF mRNA level in some immune organs was responsive to bacterial infection, which was a first step toward the application of MIF in molecular diagnosis or treatment of fish vibriosis and other bacterial diseases.
Materials and methods
V. parahaemolyticus
V. parahaemolyticus was isolated from V. parahaemolyticus-infected grouper. The pathogenicity of the virulent strains have been verified by live grouper infection of V. parahaemolyticus as described in Harikrishan et al., 1 and demonstrated to cause withering syndrome (vibriosis) used in the present study. V. parahaemolyticus was cultured in 50 mL tryptic soy broth (TSB) supplemented with 2.5% NaCl at 28°C; the bacterial pellet was re-suspended in 0.85% NaCl for challenge.
Fish pathogenicity experiments
Healthy E. awoara fish were purchased from Xiamen (Fujian, PR China) market for the bacterial challenge. We distinguished which E. awoara were healthy fish based on visual examination. Results showed that morphological markers on the head, fins, and body of E. awoara were healthy. Thirty E. awoara fish were acclimated for 1 week in the indoor 500-L aquaria and subdivided into two equal groups, each with 15 fish (weighing 1. 35 ± 10 kg each). Then, the obtained V. parahaemolyticus were diluted using phosphate buffer saline (PBS, Bio Basic Inc.) and were prepared to a final concentration of 6. 0 ×107 cfu/mL before intraperitoneal injection. Healthy and diseased E. awoara were treated in a challenge test. The E. awoara injected with PBS (20 mL) served as the control group, whereas the challenge test was conducted by intraperitoneal (I/P) injection with 0. 1 mL of 6. 0 × 107 cfu/mL bacterial suspension. During this trial, the disease symptoms and mortality had been monitored for 2 weeks. E. awoara fish were anesthetized and sacrificed. Tissue specimens were collected from the groupers with clinical signs, and at the same time, tissue specimens from healthy groupers were collected from the E. awoara fish immediately after dissection. Tissues including head kidney, spleen, liver, brain, intestine, gill, heart, stomach, and muscle were excised from bled fish (n = 5); the same tissues samples were then pooled, e.g. all of the head kidneys were pooled together. And the tissues were washed in sterile PBS. Aliquots of RNA extraction were collected and stored at −80°C. Each data point represents the mean of five groupers.
RNA extraction and reverse transcription
Total RNA was extracted from tissue specimens as described above using TRIzol (Invitrogen, Carlsbad, CA, USA) following the manufacturer’s instruction. First-strand cDNA was synthesized from 2 mg of total RNA using a Revert Aid Mu-MLV cDNA synthesis kit according to the instructions of the manufacturer. The RNA were stored at −80°C.
Real-time PCR
Five groupers from each replicate of each treatment were pooled. RNA was isolated as described above. Real-time PCR analysis was performed using the StepOnePlus™ Real-Time PCR System (ABI, USA). Quantitative PCR analysis was then performed to examine the mRNA level of MIF in the tissues following the manufacturer’s instructions. The reactions were carried out in a total reaction volume of 10 µL. The primers used for PCR was as follows: forward primer: 5’-TMATGCCGATGTTYRTCVGTGARCAC-3’, reverse primer:5’-CTGGAATGATCTTYTDTTTC-3’. The primers for β-actin (used as an internal reference gene) were 5’-CGAGAAATCGTTCGTGAC-3’ (forward) and 5’-TGCTGTTGTAGGTGGTCTCGT-3’ (reverse). The mRNA level of MIF gene was normalized using β-actin. The amplification reactions consisted of 35 cycles. In each case, denaturing, annealing, and extension steps were 20 s at 94°C, 30 s at 58°C, and 30 s at 72°C, respectively. Data analysis was performed using the relative standard curve method. All results shown were representative of at least five groupers. All results shown are representative of at least five groupers.
Quantification of MIF, TNF-α, and IL-1 tissue levels
MIF, TNF-α, and IL-1 levels in the tissues were detected by Enzyme Linked Immunosorbent Assay (ELISA) in duplicates using a commercial kit (Wuhan EIAab Science Co., Ltd., PR China) according to the manufacturer’s instructions. The kits include Epinephelus MIF ELISA Kit (Catalog no. E0698f), Epinephelus TNF-α ELISA Kit (Catalog no. CSB-E13254Fh), and Epinephelus IL- 1 ELISA Kit (Catalog no. CSB-E13259Fh). Commercial antibodies include anti-TNF-α antibody and anti- Epinephelus IL-1 antibody (Wuhan EIAab Science Co., Ltd., China). Tissue specimens from healthy and diseased E. awoara infected with V. parahaemolyticus were collected in the same way as shown before. Tissues including head kidney, spleen, liver, intestine, and muscle were snap-frozen and stored in liquid nitrogen at −80°C. A 96-well microplate was coated with assay diluent and diluted standard or samples. The plate was blocked with reagent diluents, which were incubated for 30 min at room temperature and for a total of five washes. MIF conjugate was added to each well for 30 min. Diluted samples and standards (recombinant human MIF) were added in duplicate to each well for 2 h at room temperature, followed by the addition of detection antibody (goat anti-human MIF) for another 2 h. Streptavidine HRP (Immunotools, Friesoythe, Germany) and diaminobenzidine could enhance color development. Substrate solution was incubated for 10 min. The reaction was terminated with a stop solution. Absorbance was read by a microplate reader set to 450 nm. TNF-α and IL-1 levels were also measured by ELISA Kit according to the manufacturer’s instructions. The MIF assay sensitivity was 50 pg/mL. The TNF-α and IL-1 assay sensitivity were 6.7 pg/mL and 1.22 pg/mL, respectively.
Statistical analysis
Results are reported as means ± SE. Statistical analysis of MIF tissue distribution was carried out with GraphPad Prism 5. 0 software. The Relative Expression Software Tool (REST 2008, version 2) was used to calculate the relative expression of mRNA target genes in real-time fluorescence quantitative PCR using the Pair Wise Fixed Reallocation Randomization Test. The mathematical model used was based on the mean crossing point deviation between the sample and the control group, normalized by the mean crossing point deviation of the reference genes. Specific amplification efficiencies were included in the correction of the quantification ratio. All data are presented as relative mRNA expression and the tissue MIF, TNF-α, and IL-1 expression as means ± standard deviation (SD). The Kruskal–Wallis H test was conducted to compare the tissue MIF, TNF-α, and IL-1 expression between control groups and treatment groups. The analyses were performed with SPSS version 13.0 (SPSS Inc., Chicago, IL, USA). One-way analysis of variance (ANOVA) was applied to compare different groups. P <0.05 was considered to be statistically significant.
Results
Clinical signs
The diseased E. awoara fish had lethargy, off anorexia, abdominal distension, and superficial to deep ulcers on the body of the infected fish (Figure 1). Skin depigmentation, hemorrhagic spots, and fin rot were also recorded. The main postmortem lesions demonstrated congestion with ulceration.

E. awoara demonstrating skin ulcers and abdominal distension.
Expression of MIF in fish tissues in response to V. parahaemolyticus infection
To determine the function of MIF, we first screened mRNA expression in the tissues of E. awoara. As shown in Figure 2, MIF was expressed constitutively in all selected tissues and organs from healthy fish and E. awoaras infected with V. parahaemolyticus. In contrast, compared to uninfected tissues of control E. awoara, MIF mRNA levels in the tissues of infected groupers increased significantly. MIF expression in the head kidney, liver, brain, and spleen of infected groupers was significantly greater than that of tissues from the control group (P <0.05). PBS was induced in control reactions. MIF expression was generally in low abundance in the tissues sampled under normal physiological conditions.

MIF expression in nine selected tissues and organs of E. awoara measured by quantitative real-time PCR. Comparison of tissue MIF expression levels in the head kidney, spleen, liver, brain, intestine, gill, heart, stomach, and muscle tissues of control samples and tested samples. The values were given as means ± SEM of five independent groupers. *P <0.05 compared with control subjects.
Tissue MIF, TNF-α, and IL-1 expression in V. parahaemolyticus infected E. awoara and controls
MIF, TNF-α, and IL-1 levels in the tissues of E. awoara infected with V. Parahaemolyticus and healthy fish serving as controls were assessed by ELISA. Compared to controls, experimental infection with the bacterial pathogen V. Parahaemolyticus caused significant induction of MIF (Figure 3a), TNF-α (Figure 3b), and IL-1 (Figure 3c) levels in the head kidney, spleen, liver, and intestine. Tissue MIF levels in diseased fish head kidney, spleen, intestine, and liver were 9.385 ± 0.72 ng/mL, 8.327 ± 0.64 ng/mL, 8.268 ± 0.64 ng/mL, and 7.807 ± 0.21 ng/mL higher than the MIF levels in healthy controls (6.796 ± 0.36 ng/mL, 6.875 ± 0.36 ng/mL, 6.752 ± 0.36 ng/mL, and 6.98 ± 0.12 ng/mL). The difference between the treatment group and controls was statistically significant (P <0.05, Figure 3a).
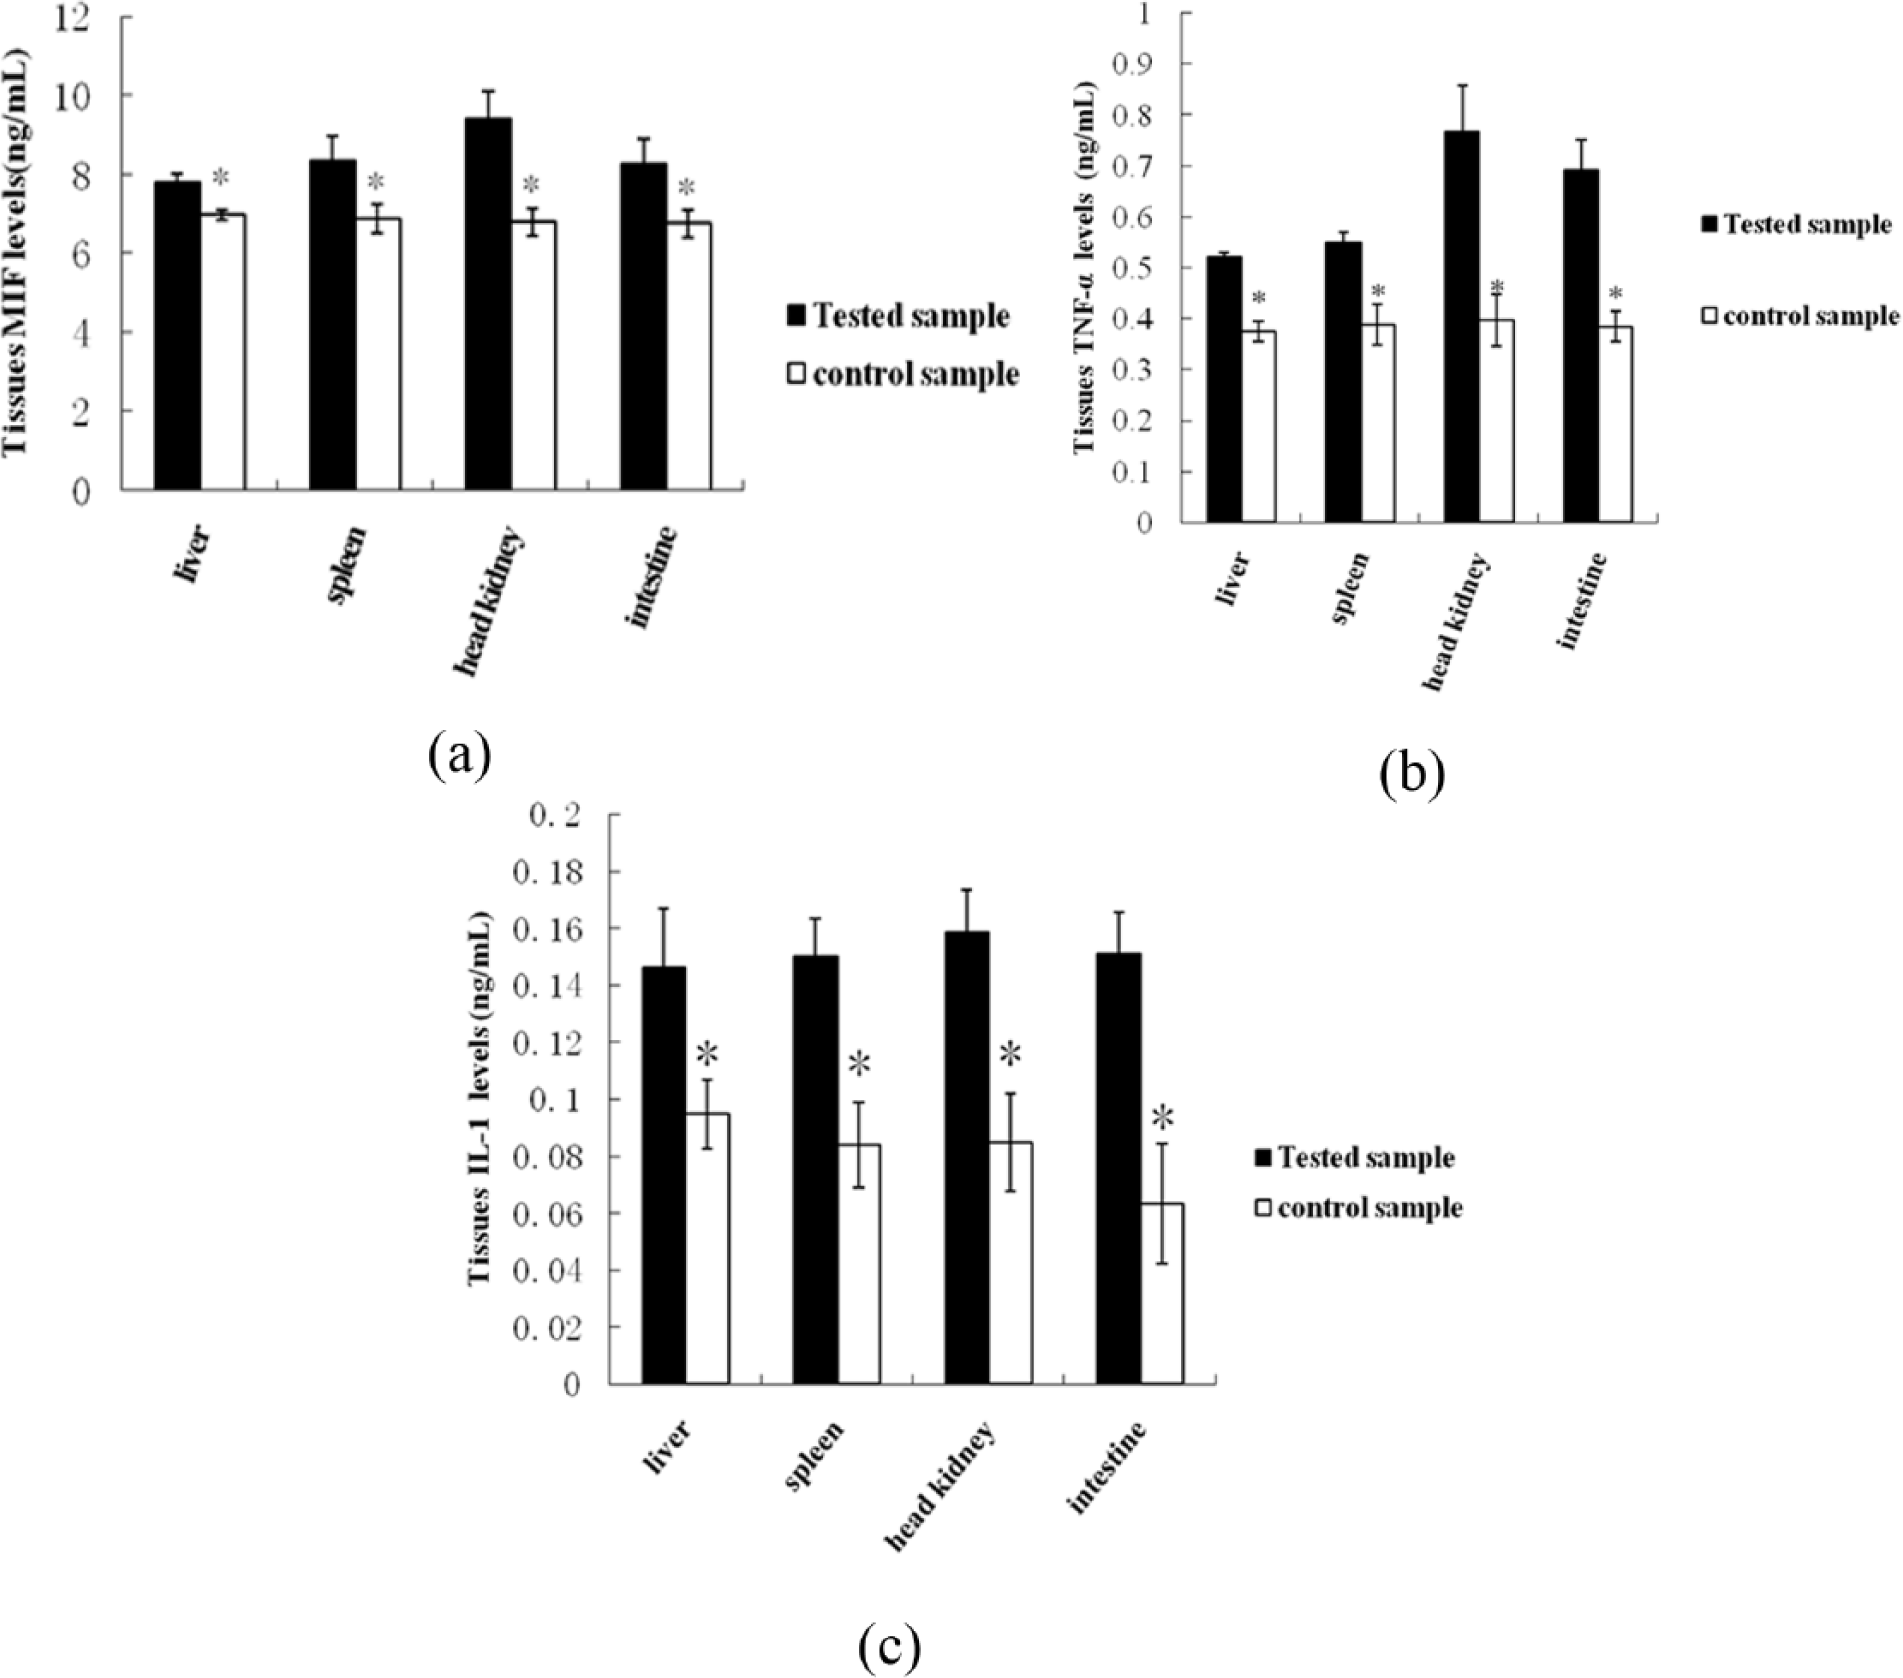
Tissue levels of MIF, TNF-α, and IL-1 of E. awoara infected with V. parahaemolyticus and controls (healthy groupers) were measured by ELISA. (a) There was a significant increase (*P <0.05) in MIF tissue levels in E. awoara infected with V. parahaemolyticus compared to those in controls. (b) There was a significant increase (*P <0.05) in TNF-α tissue levels in E. awoara infected with V. parahaemolyticus compared to those in controls. (c) There was a significant increase (*P <0.05) in IL-1 tissue levels in E. awoara infected with V. parahaemolyticus compared to those in controls. Data are represented as means ± standard deviation (SD). These results were averaged from five independent experiments.
A difference in TNF-α levels in tissues was noted between treatment group and controls. The concentrations of TNF-α in head kidney, intestine, spleen, and liver were 0.768 ± 0.09 ng/mL, 0.691 ± 0.06 ng/mL, 0.549 ± 0.02 ng/mL, and 0.521 ± 0.01 ng/mL in the infected group, and 0.397 ± 0.05 ng/mL, 0.384 ± 0.03 ng/mL, 0.389 ± 0.04 ng/mL, and 0.374 ± 0.02 ng/mL in controls. There was an obvious difference in TNF-α levels in the infected group compared with controls (P <0.05). As shown in Figure 3b, diseased E. awoara had higher head kidney TNF-α expression than other tissues. This was also observed in healthy controls.
In our series, expressions levels of IL-1 in infected fish were higher than those in non-infected groups. The IL-1 content in the tissues of the head kidney, intestine, spleen, and liver of E. awoara from the V. alginolyticus challenge were 0.159 ± 0.015 ng/mL, 0.151 ± 0.013 ng/mL, 0.150 ± 0.015 ng/mL and 0.146 ± 0.021 ng/mL, respectively. The IL-1 concentrations in the tissues of the head kidney, intestine, spleen, and liver of healthy E. awoara were significantly lower (0.085 ± 0.017 ng/mL, 0.063 ± 0.021 ng/mL, 0.084 ± 0.015 ng/mL, and 0.095 ± 0.012 ng/mL, respectively). The difference between the treatment groups and controls was statistically significant (P <0.05, Figure 3c).
The results showed that MIF, TNF-α, and IL-1 levels in the liver were significantly higher than those in spleen, head kidney, intestine, and muscle of diseased fish (Figure 3).
Furthermore, circulating MIF, TNF-α, and IL-1 levels in V. parahaemolyticus-infected individuals showed a significantly positive correlation with serious pathology in E. awoara. The concentration of MIF, TNF-α, and IL-1 in the tissues was also collectively observed in healthy controls.
Discussion
V. parahaemolyticus is one of the major pathogens that caused significant economic losses in grouper aquaculture. 5 Our pathogenicity assay revealed that V. parahaemolyticus was pathogenic to E. awoara.
For the first time, we detected MIF expression in tissues of E. awoara infected with V. parahaemolyticus by quantitative PCR. Our results were similar to those were observed in other Teleosts and vertebrates.2,5,6,10 In our study, the constitutive expression MIF of tissues including head kidney, spleen, liver, brain, intestine, gill, heart, stomach, and muscle in E. awoara were measured. When E. awoaras were infected with V. parahaemolyticus, the expressions of MIF in tissues were significantly higher than the tissues in healthy fish. The higher levels of MIF mRNA were measured in the head kidney, spleen, liver, and intestine. These results indicated that MIF was related to host immune response against bacterial infection.
In our study, tissue levels of MIF, TNF-α, and IL-1 were significantly increased in the tissues of V. parahaemolyticus-infected E. awoara in comparison to those from the control fish; this finding was also consistent with previously reported studies. 9 Remarkably, there was a positive feedback loop between MIF and pro-inflammatory cytokines such as TNF-α and IL-1. 3 The results showed that MIF played a role in the inflammatory response to bacterial infection in E. awoara, which can contribute to revealing a new mechanism involved in the pathogenesis. These results may offer novel therapies aimed to control inflammatory and infectious diseases of E. awoara.
Footnotes
Declaration of Conflicting Interest
The authors declare that there is no conflict of interest.
Funding
This work was supported by the Science Foundation of the Fujian Province, China (#2016J01167, #2016NZ0001-3, Jimei University research〔2015〕19), the National Natural Science Foundation of China (General Program #31502194). Regional Demonstration of Marine Economy Innovative Development Project under contract No.12PYY001SF08, 14PYY050SF03 and 14CZP032HJ06.