
Abstract
This study applies machine learning (ML) techniques to predict fines imposed by the Mutual Fund Dealers Association of Canada on investment advisors who violate securities laws. Anchored in deterrence theory, the research evaluates whether fine allocation reflects proportionality, consistency, and severity. Using probabilistic and ML models with feature selection and extraction methods like PCA and RFE, the study identifies key predictors of fines. Results show that investigation costs and commissions are consistent predictors, while more serious offenses like quasi-criminal violations have limited influence. These findings raise concerns about regulatory leniency and the adequacy of current fine structures securities violation enforcement. The results from this study offers insights for a data-driven framework to improve fairness and effectiveness in regulatory enforcement.
Keywords
Introduction
Investment fraud in Canada has intensified over the past decade, raising concerns about the effectiveness of regulatory enforcement as a service provided by self-regulatory organizations (SROs). Securities violations have resulted in over $45 million in fines (Canadian Broadcasting Corporation, 2020), yet fraudulent activities continue to undermine investor confidence and market stability. High-profile cases, such as the Montreal-based Ponzi scheme that defrauded investors of over $500 million and the InvestTech FX fraud that deceived nearly 2000 investors worldwide, highlight critical gaps in regulatory oversight (Canadian Broadcasting Corporation, 2021). These incidents expose vulnerabilities in the financial sector and reinforce the need for a robust, data-driven regulatory approach to ensure compliance and protect investors. The ability of SROs to effectively allocate fines is not only a matter of enforcement but also a key aspect of service management in financial regulation, where fairness, consistency, and deterrence play a central role in maintaining trust in the industry.
Despite ongoing regulatory efforts by the Canadian Securities Administrators (CSA) and provincial securities regulators, the persistent nature of investment fraud raises questions about the adequacy of existing enforcement mechanisms. Complex fraud schemes often exploit offshore structures and target vulnerable investors, challenging the capacity of regulators to administer penalties that serve as effective deterrents. As a service function, regulatory enforcement should aim to ensure consistency in fine allocation and maintain proportionality in sanctioning offenders. However, concerns persist regarding whether fines reflect the severity of violations and whether penalties are applied equitably. A critical aspect of financial service management is understanding whether regulatory decisions align with deterrence theory, while remaining proportionate to the nature and extent of the misconduct.
This study applies machine learning algorithms to predict fines imposed by the Mutual Fund Dealers Association of Canada (MFDA), an SRO responsible for overseeing mutual fund dealers in Canada. The MFDA plays a crucial role in financial service management by enforcing ethical standards and compliance within the mutual fund industry. However, critics argue that SRO-imposed fines are often inconsistent and may not adequately reflect the actual harm caused to investors (Anand, 2018; Boyle et al., 2024; M. Lokanan & Masannagari, 2021). Grounded in deterrence theory, this research addresses the following question: How effectively can machine learning algorithms predict fines imposed by the MFDA, and to what extent do these fines align with the principles of proportionality and severity central to deterrence theory? The study pursues two key objectives: (1) To develop machine learning models that predict fines imposed by the MFDA based on offense severity and other key case characteristics. (2) To evaluate whether fines are proportionate and consistent with deterrence theory, ensuring that enforcement strategies promote regulatory fairness and deter future violations.
By positioning regulatory enforcement as a key component of financial service management, this study provides insights into how data-driven models can enhance the transparency, consistency, and effectiveness of fine allocation within the securities industry.
This study contributes to the literature on artificial intelligence (AI) in regulatory services by demonstrating how machine learning can enhance efficiency, transparency, and consistency in financial crimes enforcement. First, while previous studies have applied machine learning to detect financial crimes (M. Lokanan & Sharma, 2024) and predict dispute resolution outcomes (Fonseca, 2023; Wen & Ti, 2024), limited work has focused on predicting regulatory fines. Addressing this gap, the study applies machine learning to analyze fine allocation by the MFDA, offering new insights into the proportionality and fairness of financial sanctions.
Second, while prior research has primarily employed singular machine learning (ML) experiments to predict penalties in dispute resolution (M. Lokanan & Sharma, 2024; Ruohonen & Hjerppe, 2020; Wen & Ti, 2024), this study adopts a multi-experimental approach that systematically compares a range of statistical and ML models. Traditional benchmarks were established using Ordinary Least Squares (OLS) and Weighted Least Squares (WLS) regression models. Dimensionality reduction techniques, including Principal Component Analysis (PCA) and Singular Value Decomposition (SVD), were used to improve model interpretability, while Recursive Feature Elimination with Cross-Validation (RFECV) helped refine variable selection. The study also evaluates several ML models—including Linear Regression, Ridge, Lasso, Elastic Net, Random Forest, Decision Tree, and K-Nearest Neighbors (KNN)—to capture both linear and non-linear relationships in fine allocation. This comprehensive framework provides regulatory agencies with a data-driven methodology to integrate artificial intelligence into enforcement processes and enhance the efficiency and consistency of compliance monitoring.
The remainder of this paper is structured as follows: first, a literature review and discussion of deterrence theory as a framework for evaluating fine proportionality. Second, the experimental setup, including data collection, feature engineering, and the statistical and machine learning methods used. Third, findings from both baseline statistical models and machine learning algorithms are presented, highlighting key predictors and model performance. Fourth, the discussion interprets results in relation to deterrence theory and enforcement practices. The paper concludes by summarizing key contributions, outlining limitations, and suggesting future research directions to improve fine allocation in SRO regulatory processes.
Literature Review
Regulatory Enforcement and the Case for Data-Driven Fairness in Securities Penalties
Securities regulation in Canada is overseen by the Canadian Securities Administrators (CSA), with enforcement responsibilities delegated to provincial regulators and SROs, particularly the Canadian Investment Regulatory Organization (CIRO). CIRO—formed through the merger of the MFDA and IIROC—regulates investment and mutual fund dealers, overseeing licensing, compliance, enforcement, and investor protection (CIRO, 2024). Common offenses include fraud, insider trading, market manipulation, and disclosure violations (Anand, 2018; Russell & Cheng, 2019). However, current fine structures have drawn criticism for being inconsistent and insufficiently punitive, failing to reflect the harm caused or deter future misconduct (Boyle et al., 2024; Canadian Broadcasting Corporation, 2020). Others have argued that disparities in penalties for similar offenses undermine public trust, leading to calls for more uniform enforcement (Anand, 2018; Canadian Broadcasting Corporation, 2020; Russell & Cheng, 2019).
Fairness and consistency are essential for maintaining regulatory legitimacy (Agranov & Buyalskaya, 2022; Davies & Malik, 2022). Studies show that SRO-imposed penalties often fail to match the financial harm caused, with similar offenses receiving vastly different sanctions (Boyle et al., 2024; M. Lokanan & Sharma, 2024; Tuch, 2014). Subjective factors—such as an offender’s financial status or jurisdiction—also influence outcomes (Wen & Ti, 2024). Excessive reliance on post-offense mitigating factors further weakens proportionality-based penalties (Ghafoor et al., 2022; M. Lokanan & Masannagari, 2021). These inconsistencies raise concerns about regulatory bias and leniency, prompting calls for the adoption of computational techniques to improve fairness and consistency in enforcement practices. Recent research supports the use of data-driven tools to improve fairness in enforcement practices, arguing that machine learning models can systematically identify offense-relevant features, reducing human bias and enhancing consistency (Metsker et al., 2019; Ruohonen & Hjerppe, 2020). More recent research shows that machine learning’s predictive capabilities make it particularly effective for identifying the factors associated with securities law violations, addressing concerns around arbitrary or inconsistent fines (M. E. Lokanan & Sharma, 2022).
Machine Learning in Predictive Regulatory and Legal Applications
Machine learning has gained considerable traction in regulatory and legal domains for its potential to enhance predictive accuracy and decision-making efficiency. Machine learning has been used to predict tax rulings, outperforming traditional regression methods (Alarie et al., 2016). Support vector machine (SVM) classifiers have been applied to forecast human rights decisions from the European Court of Human Rights, achieving strong accuracy for past cases (Medvedeva et al., 2020). Similarly, K-Nearest Neighbors (KNN) and ensemble models have proven effective in dispute resolution, supporting fair and consistent rulings (M. E. Lokanan, 2023).
Advanced machine learning methods, including deep learning and natural language processing (NLP), have significantly enhanced predictive tools in legal contexts. Researchers have employed logistic regression, SVMs, convolutional neural networks (CNNs), and long short-term memory (LSTM) models to accurately predict court judgments (Shelar & Moharir, 2021). Others demonstrated that deep learning algorithms could outperform human experts in predicting appeal outcomes in Brazilian courts (Jacob de Menezes-Neto & Clementino, 2022). Systematic reviews further support these findings, showing that classifiers such as SVMs, classification and regression trees (CART), and boosted models consistently achieve high predictive performance (Rosili et al., 2021). Rosili et al. (2021) argued that the predictive accuracy is particularly strong when multiple algorithms are combined in ensemble models.
Despite the success of machine learning techniques in regulatory enforcement, limitations regarding tuning, model transparency, and interpretability persist. Machine learning lacks the higher-order reasoning required for nuanced legal decisions (Markou & Deakin, 2019; Surden, 2021) and often functions as a “black box,” limiting transparency (Bhambhoria et al., 2021; Možina et al., 2005). Critics also note machine learning’s limitations in replicating legal intuition, arguing that while these models can identify patterns and correlations in data, they often lack the contextual understanding, moral reasoning, and interpretive flexibility that human legal experts apply when making decisions (Osei Bonsu, 2020). However, most legal work involves service delivery, not just courtroom argumentation, making machine learning a valuable tool for augmenting efficiency and reducing errors in legal services (Brockman et al., 2002; Sheldon & Krieger, 2014).
The Use of “Prediction” in Machine Learning Models
The term
In this study, prediction is used within the framework of supervised machine learning to evaluate whether fine amounts can be reliably estimated from observable case characteristics. Predictive performance, assessed using measures such as root mean square error (RMSE), serves as an objective benchmark for comparing algorithms and validating model accuracy. Unlike explanatory models focused on causal inference, predictive models help identify systematic patterns in enforcement decisions, offering insights into the consistency and proportionality of sanctions. Used alongside explanatory techniques, predictive modeling offers a complementary approach for assessing regulatory fairness in fine allocation.
Theoretical Framework: Deterrence Theory
Deterrence theory posits that the threat of punishment deters individuals from engaging in undesirable behaviors (Natarajan, 2016; Piquero et al., 2011; Rorie & West, 2022). Initially grounded in rational choice models—where actors weigh costs and benefits (Matsueda et al., 2006; Paternoster, 1989; Piliavin et al., 1986)—the theory has since evolved to consider psychological, social, and situational influences on behavior. Current work emphasizes the importance of the certainty, severity, and swiftness of sanctions (Abramovaite et al., 2023; Buckenmaier et al., 2021; Earnhart & Friesen, 2023; Roche et al., 2020) and integrates informal controls such as moral norms and peer influence (Heitkamp & Mowen, 2024; Homer & Maume, 2024; Kim et al., 2019; Wang et al., 2019).
Despite its ascendancy in explaining crime and deviance, deterrence theory has been subjected to criticism. One of the fundamental propositions of deterrence theory is that prospective offenders are actors who calculate the costs and benefits of their actions (Abramovaite et al., 2023; Piquero et al., 2011). However, critics argue that many decisions involve non-rational decision-making (or impulsive decision-making), where individuals act without premeditation due to immediate situational pressures, such as sudden financial strain or retaliatory violence in response to an insult. These crimes often occur in moments of intense emotional arousal or distress, leaving little room for the calculation of the net utility of potential risks and rewards (Mulder, 2018; Paternoster, 1989).
Others argue that deterrence theory overlooks how social, cultural, and economic contexts shape individuals’ responsiveness to sanctions (Kahan, 1997; Makkai & Braithwaite, 1994; Mulder, 2018). Company directors under economic or political strain may view misconduct as a necessity rather than a choice, with external pressures creating organizational stress that drives behavior beyond what deterrence theory can explain (Kahan, 1997; Makkai & Braithwaite, 1994). That said, others have shown that deterrence theory incorporates variables to address socio-economic factors that mitigate some of the concerns of classical deterrence theory (Auriol et al., 2022; Spalding, 2014).
Deterrence theory serves as a valuable framework for evaluating the consistency and proportionality of fines imposed to deter misconduct. The present study utilizes this framework in conjunction with machine learning techniques to assess the alignment of fine allocation with the severity of offenses. However, there are still important gaps in the current research: earlier studies have not used machine learning to look at fines imposed by Canadian SROs, and the use of deterrence theory for financial penalties has not been thoroughly examined. Furthermore, few studies empirically evaluate the fairness of fine allocation through predictive methodologies. By integrating machine learning with deterrence theory, this study provides novel insights into the consistency and proportionality of regulatory enforcement within the securities sector.
Experimental Setting
Data Source
Data for this paper comes from the MFDA tribunal hearings. The data came from cases heard by the MFDA tribunal between 2005 and 2019. The year 2005 marks the first set of data available, and we stop at 2019 to ensure that sufficient time has passed to allow for the publication and completeness of case outcomes. Rather than collecting data on a sample of the cases, we decided to code the entire population of cases available on the MFDA website. Sampling the data could have led to larger Canadian provinces being overrepresented in the database, introducing bias into the analysis. While we cannot guarantee that all cases heard by the MFDA are published online, we made extensive efforts to ensure that every available case on the MFDA website was coded for analysis. After cleaning the data to remove irrelevant entries such as news releases, procedural motions, and adjourned cases, we collected a total of 625 cases heard by the MFDA regulatory tribunal across Canada. The dataset includes detailed information on the infractions committed by individual offenders and the penalties imposed for those infractions, forming a comprehensive basis for the analysis.
Variables and Measurements
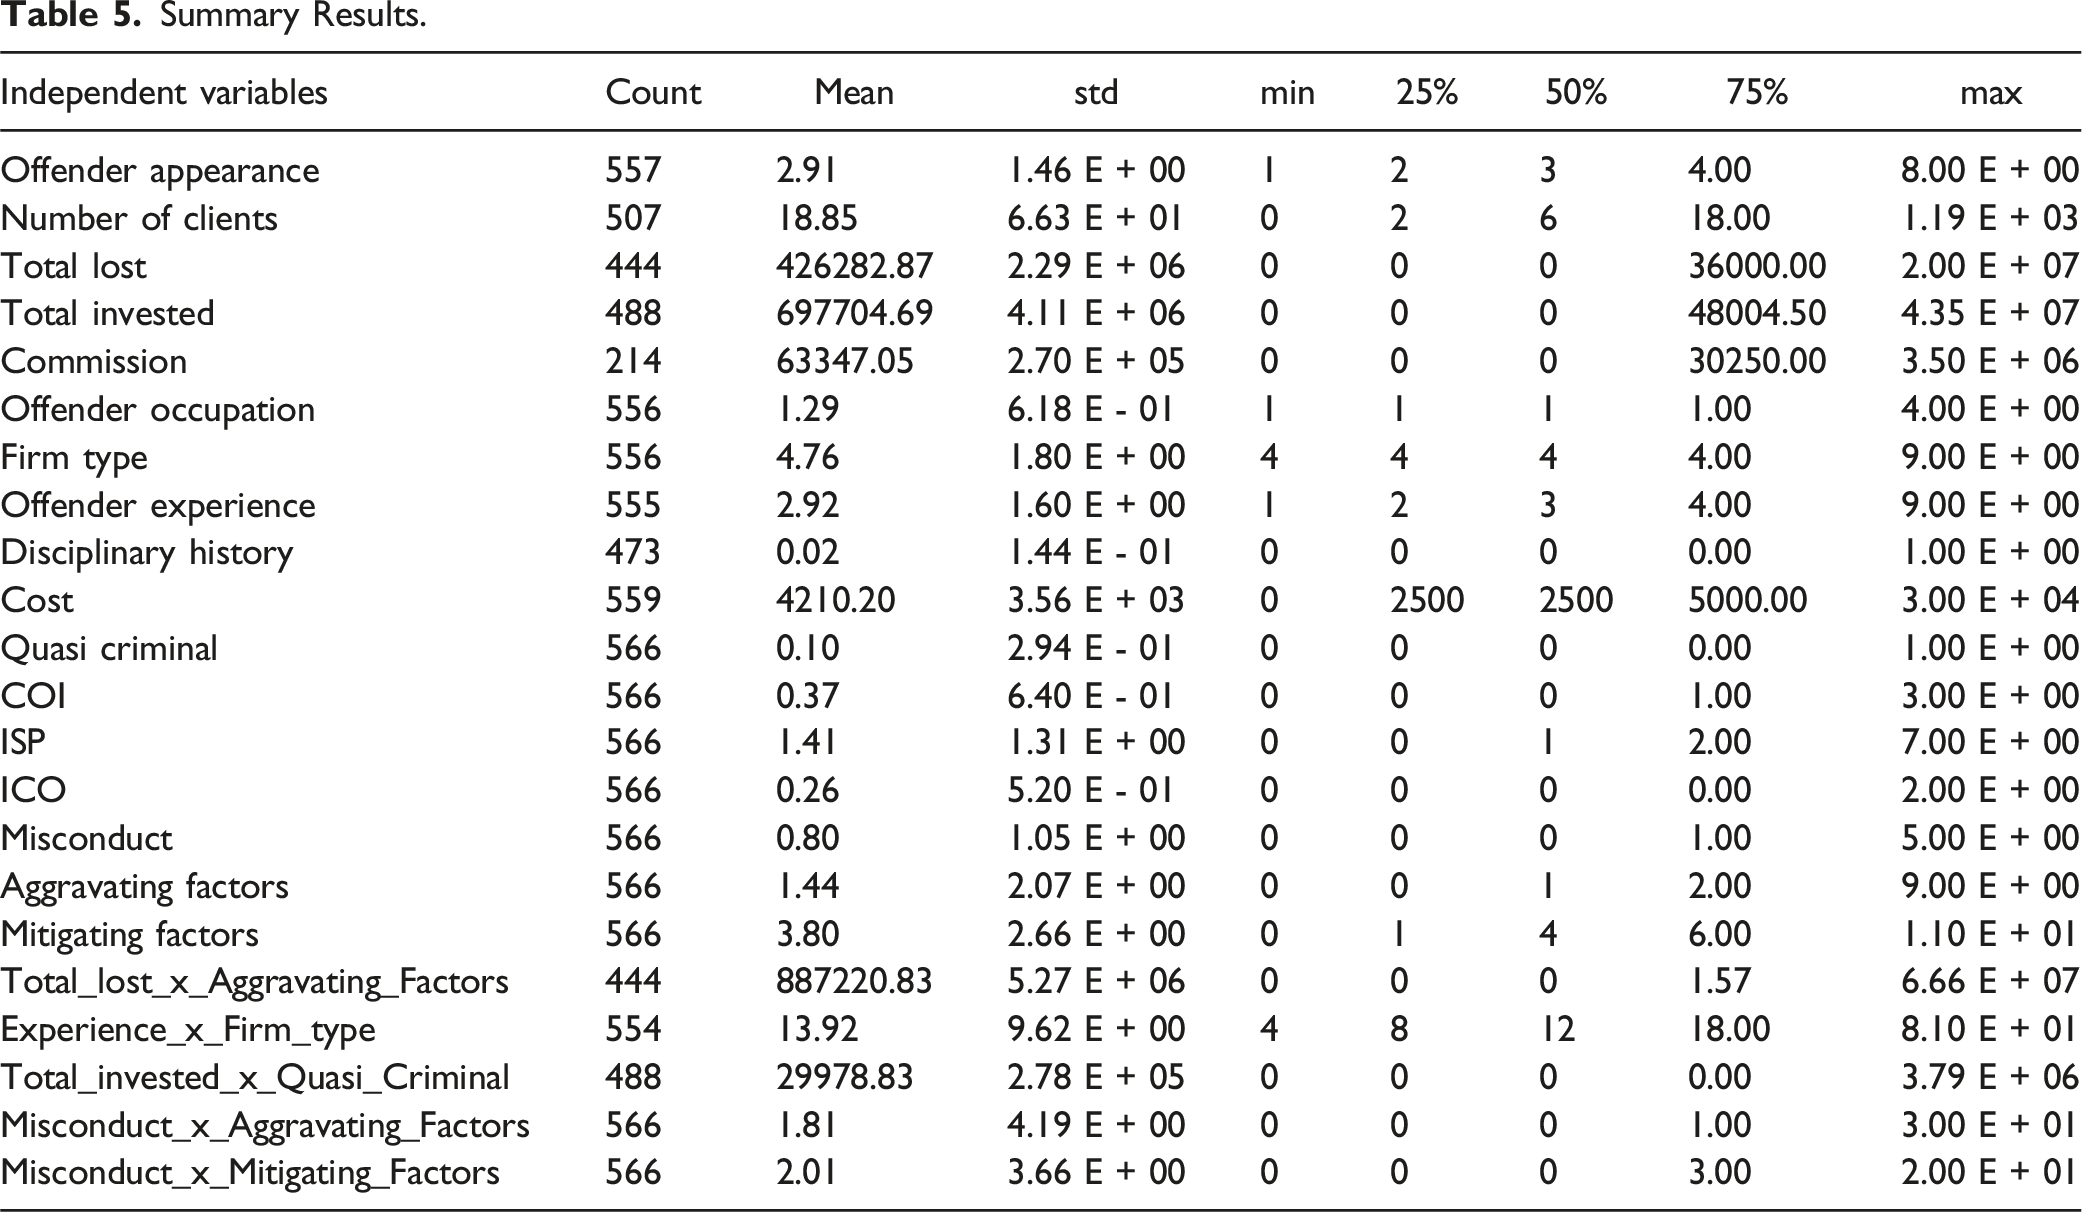
The dependent variable in this study is the total fines imposed by the MFDA tribunals for violations of securities law, which serves as a measure of punishment severity—a fundamental aspect of deterrence theory. The fines imposed on offenders reflect the gravity of the offense and various contextual factors that affect penalties. Aggravating factors, such as prior misconduct or investor harm, are likely to result in increased fines, whereas mitigating factors, such as cooperation or remedial actions, may lead to reduced fines. The range of penalties varies from $5000 to over $1 million, fulfilling both punitive and deterrent functions by promoting compliance and safeguarding investors’ interests.
Variables and Measurements.
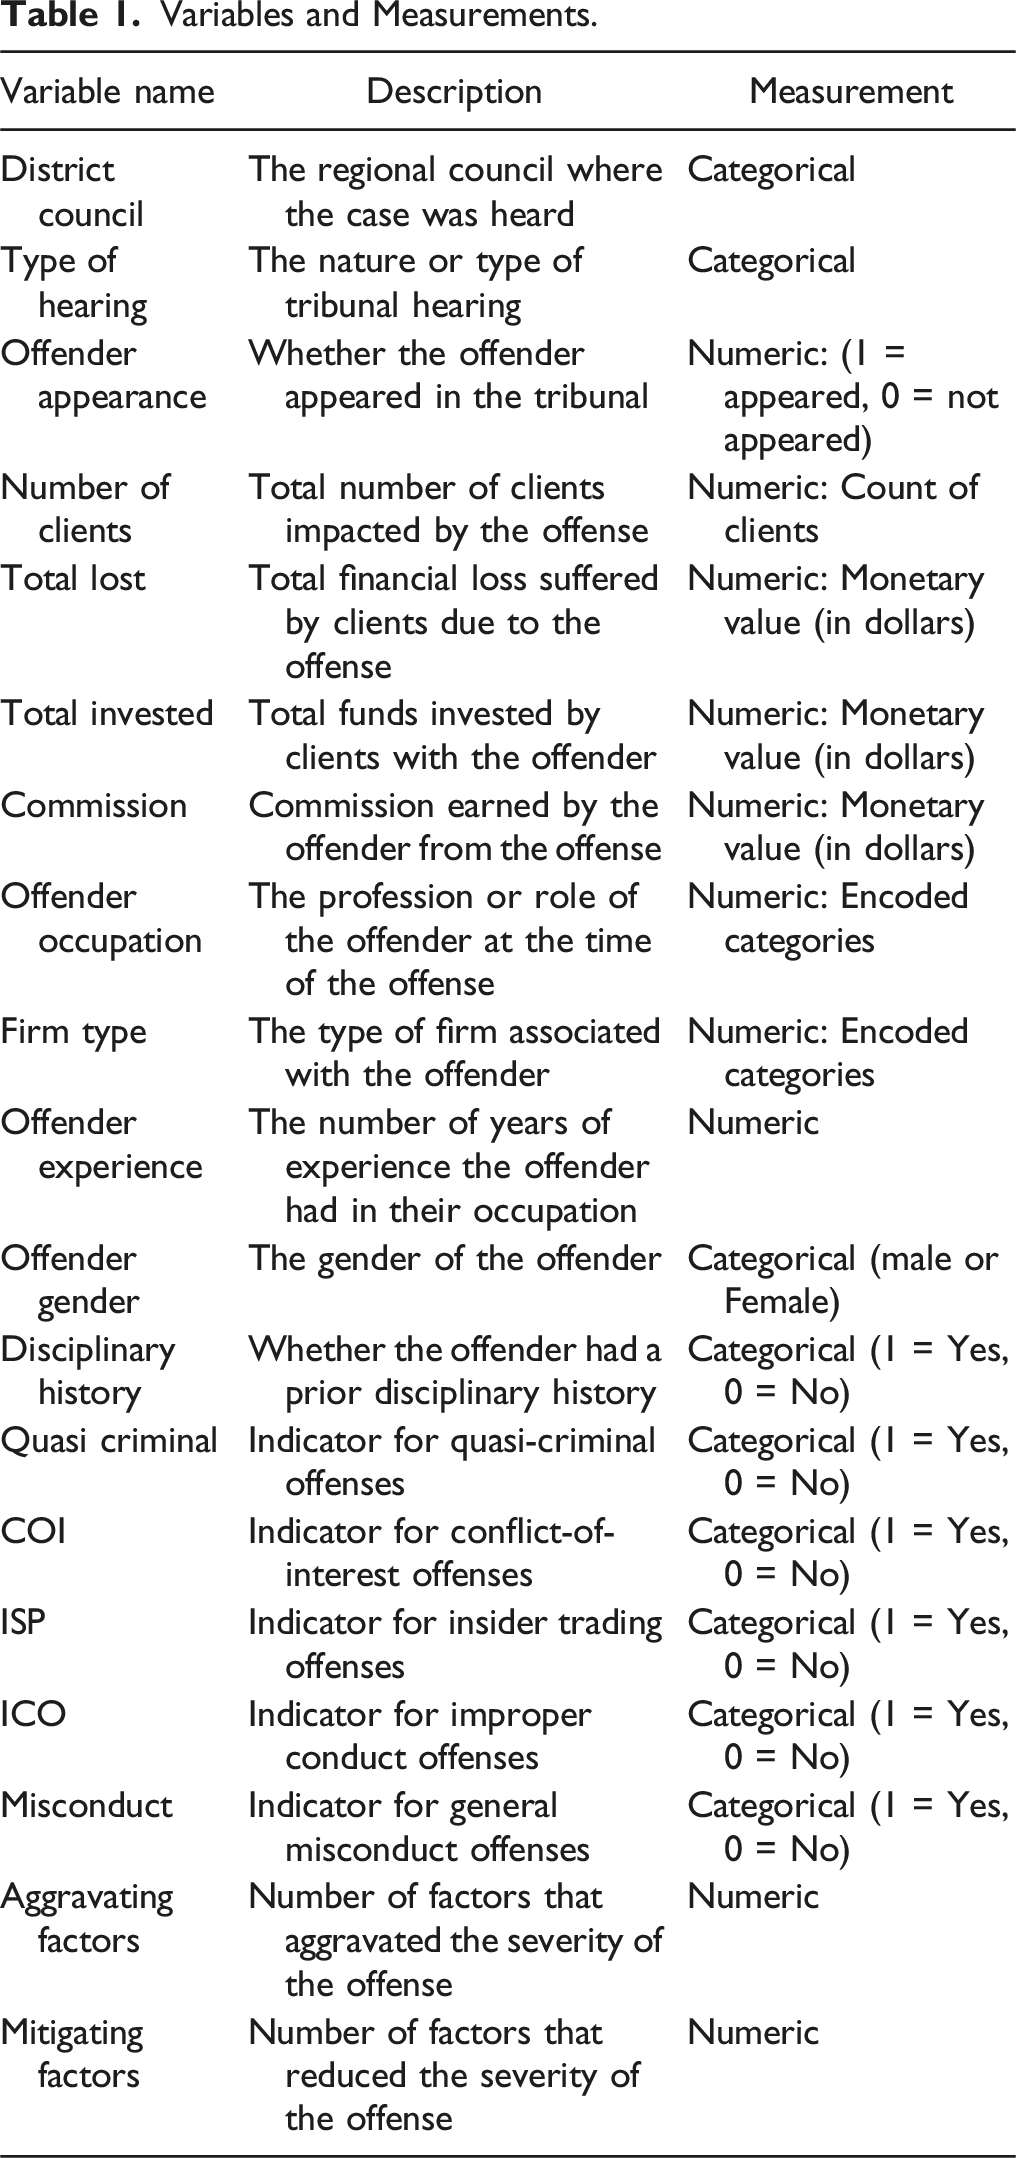
Swiftness of punishment, or celerity, pertains to the promptness with which sanctions are administered following the detection of an offense. Direct measurement of swiftness was not feasible in the current study due to the lack of timestamped data indicating the timeline from offense detection to penalty imposition. Nevertheless, variables such as investigation costs and type of hearing were included as indirect proxies for procedural pace. The underlying rationale is that more streamlined and cost-effective enforcement processes may suggest a quicker resolution timeline, thereby reinforcing the perceived swiftness of punishment and enhancing the overall deterrent effect.
Additional variables were incorporated to control for contextual, economic, and demographic influences. District council, offender gender, occupation, firm type, and experience account for jurisdictional and individual-level variations. Financial variables, including total invested, total lost, and commission, serve to control for case magnitude, while the number of clients captures the scale of impact. Offense-type indicators, such as quasi-criminal activities, conflicts of interest, insider trading, improper conduct, and general misconduct, reflect normative distinctions that may influence the severity of fines.
Data Cleaning and Preprocessing
Addressing Missing Values
A structured approach was used to handle missing data while preserving analytical validity. Variables with under 30% missing values—such as “Number of Clients” (10%), “Total Lost” (22%), and “Total Invested” (15%)—were retained and imputed using KNN imputation, which estimates missing values based on similar cases (Cismondi et al., 2013; M. Lokanan & Sharma, 2024). KNN preserves relationships in the data and is suitable for moderate, non-random missingness. Variables with minimal missingness—like “Type of Hearing” (1%) and “Offender Gender” (4%)—were similarly imputed with negligible impact. Despite a higher missing rate (62%), “Commission” was retained due to its relevance in predicting fines. KNN imputation enabled plausible estimation by leveraging related features, minimizing data loss and maintaining dataset robustness.
Variable Encoding and Feature Engineering
Categorical variables were transformed using OneHotEncoder to make them compatible with machine learning algorithms. “Type of Hearing” and “Offender Gender” were converted into numerical format to ensure accurate interpretation by the models. New features were created to reveal deeper relationships within the data. For instance, the “Total Lost / Total Invested” ratio captured the proportional financial impact of offenses, while counts of aggravating and mitigating factors reflected severity. The ten district councils were grouped into three regional categories—Central, Western, and Atlantic Canada—to streamline jurisdictional analysis. These engineered features improved the model’s ability to detect meaningful patterns in the data.
Outlier Detection and Treatment
Outliers were identified using interquartile ranges (IQR) and z-scores to ensure robust preprocessing of the data. The IQR method flagged values in “Total Lost,” “Total Invested,” and “Commissions” as outliers. These features naturally involve large monetary values, and extreme values may reflect legitimate high-severity cases rather than anomalies. Given the dataset’s size (600 observations), such occurrences are expected and were not removed without further consideration.
To validate these findings, z-scores were also calculated. Outliers detected using z-scores were relatively few—ranging from 0 to 16 per variable—which is acceptable for a dataset of this scale. While z-scores assume normal distribution, which may not hold for all features, they helped cross-check the distribution of extreme values and confirmed that most flagged points were not errors but valid extremes (Chikodili et al., 2021). To minimize the influence of these values on model performance, a robust scaler was employed. Unlike z-score normalization or min-max scaling, which are sensitive to outliers, the robust scaler algorithm transforms data by centering on the median and scaling by the IQR. Scaling the data ensures that features like “Total Invested” and “Commissions” remain informative while preventing distortion due to outlier influence (Ozkara et al., 2023). The result is a dataset that preserves critical information while maintaining modeling stability.
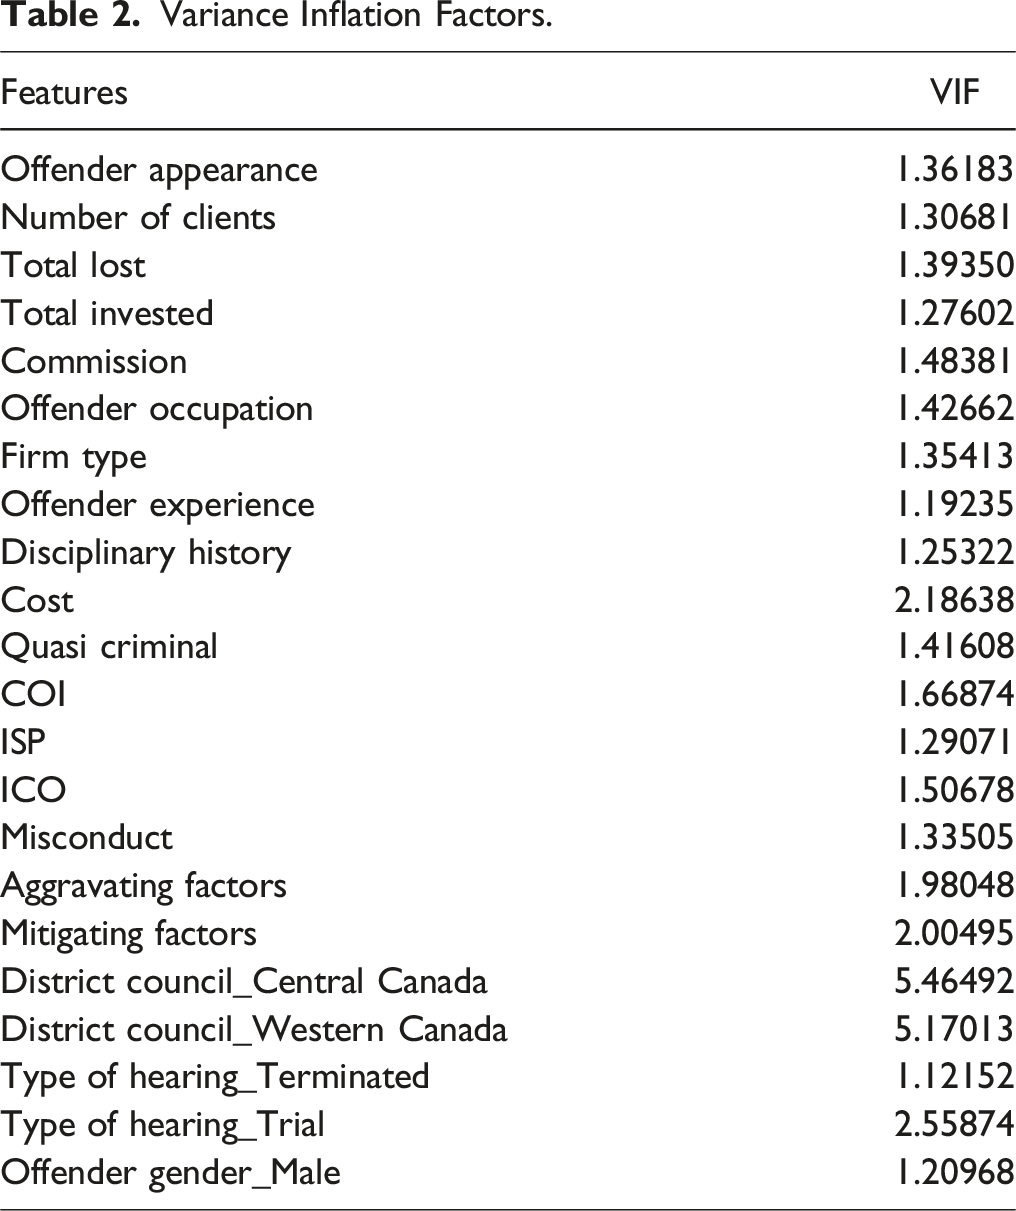
Multicollinearity and Variation Inflation Factor
As shown in Figure 1, none of the features were highly correlated with each other, indicating that multicollinearity may not be a widespread issue in the dataset. However, specific variable relationships, such as those with moderate correlations (i.e., > .50), should still be carefully evaluated to ensure robust modeling. Note also that the correlation matrix only displays pairwise relationships between independent variables, providing a limited perspective on multicollinearity. In contrast, the Variance Inflation Factor (VIF) is a much more robust measure because it quantifies how strongly an independent variable is related to all other variables in the dataset and provides a comprehensive view of how the features interact, helping to address potential issues that might impact model stability and interpretability. Correlation matrix.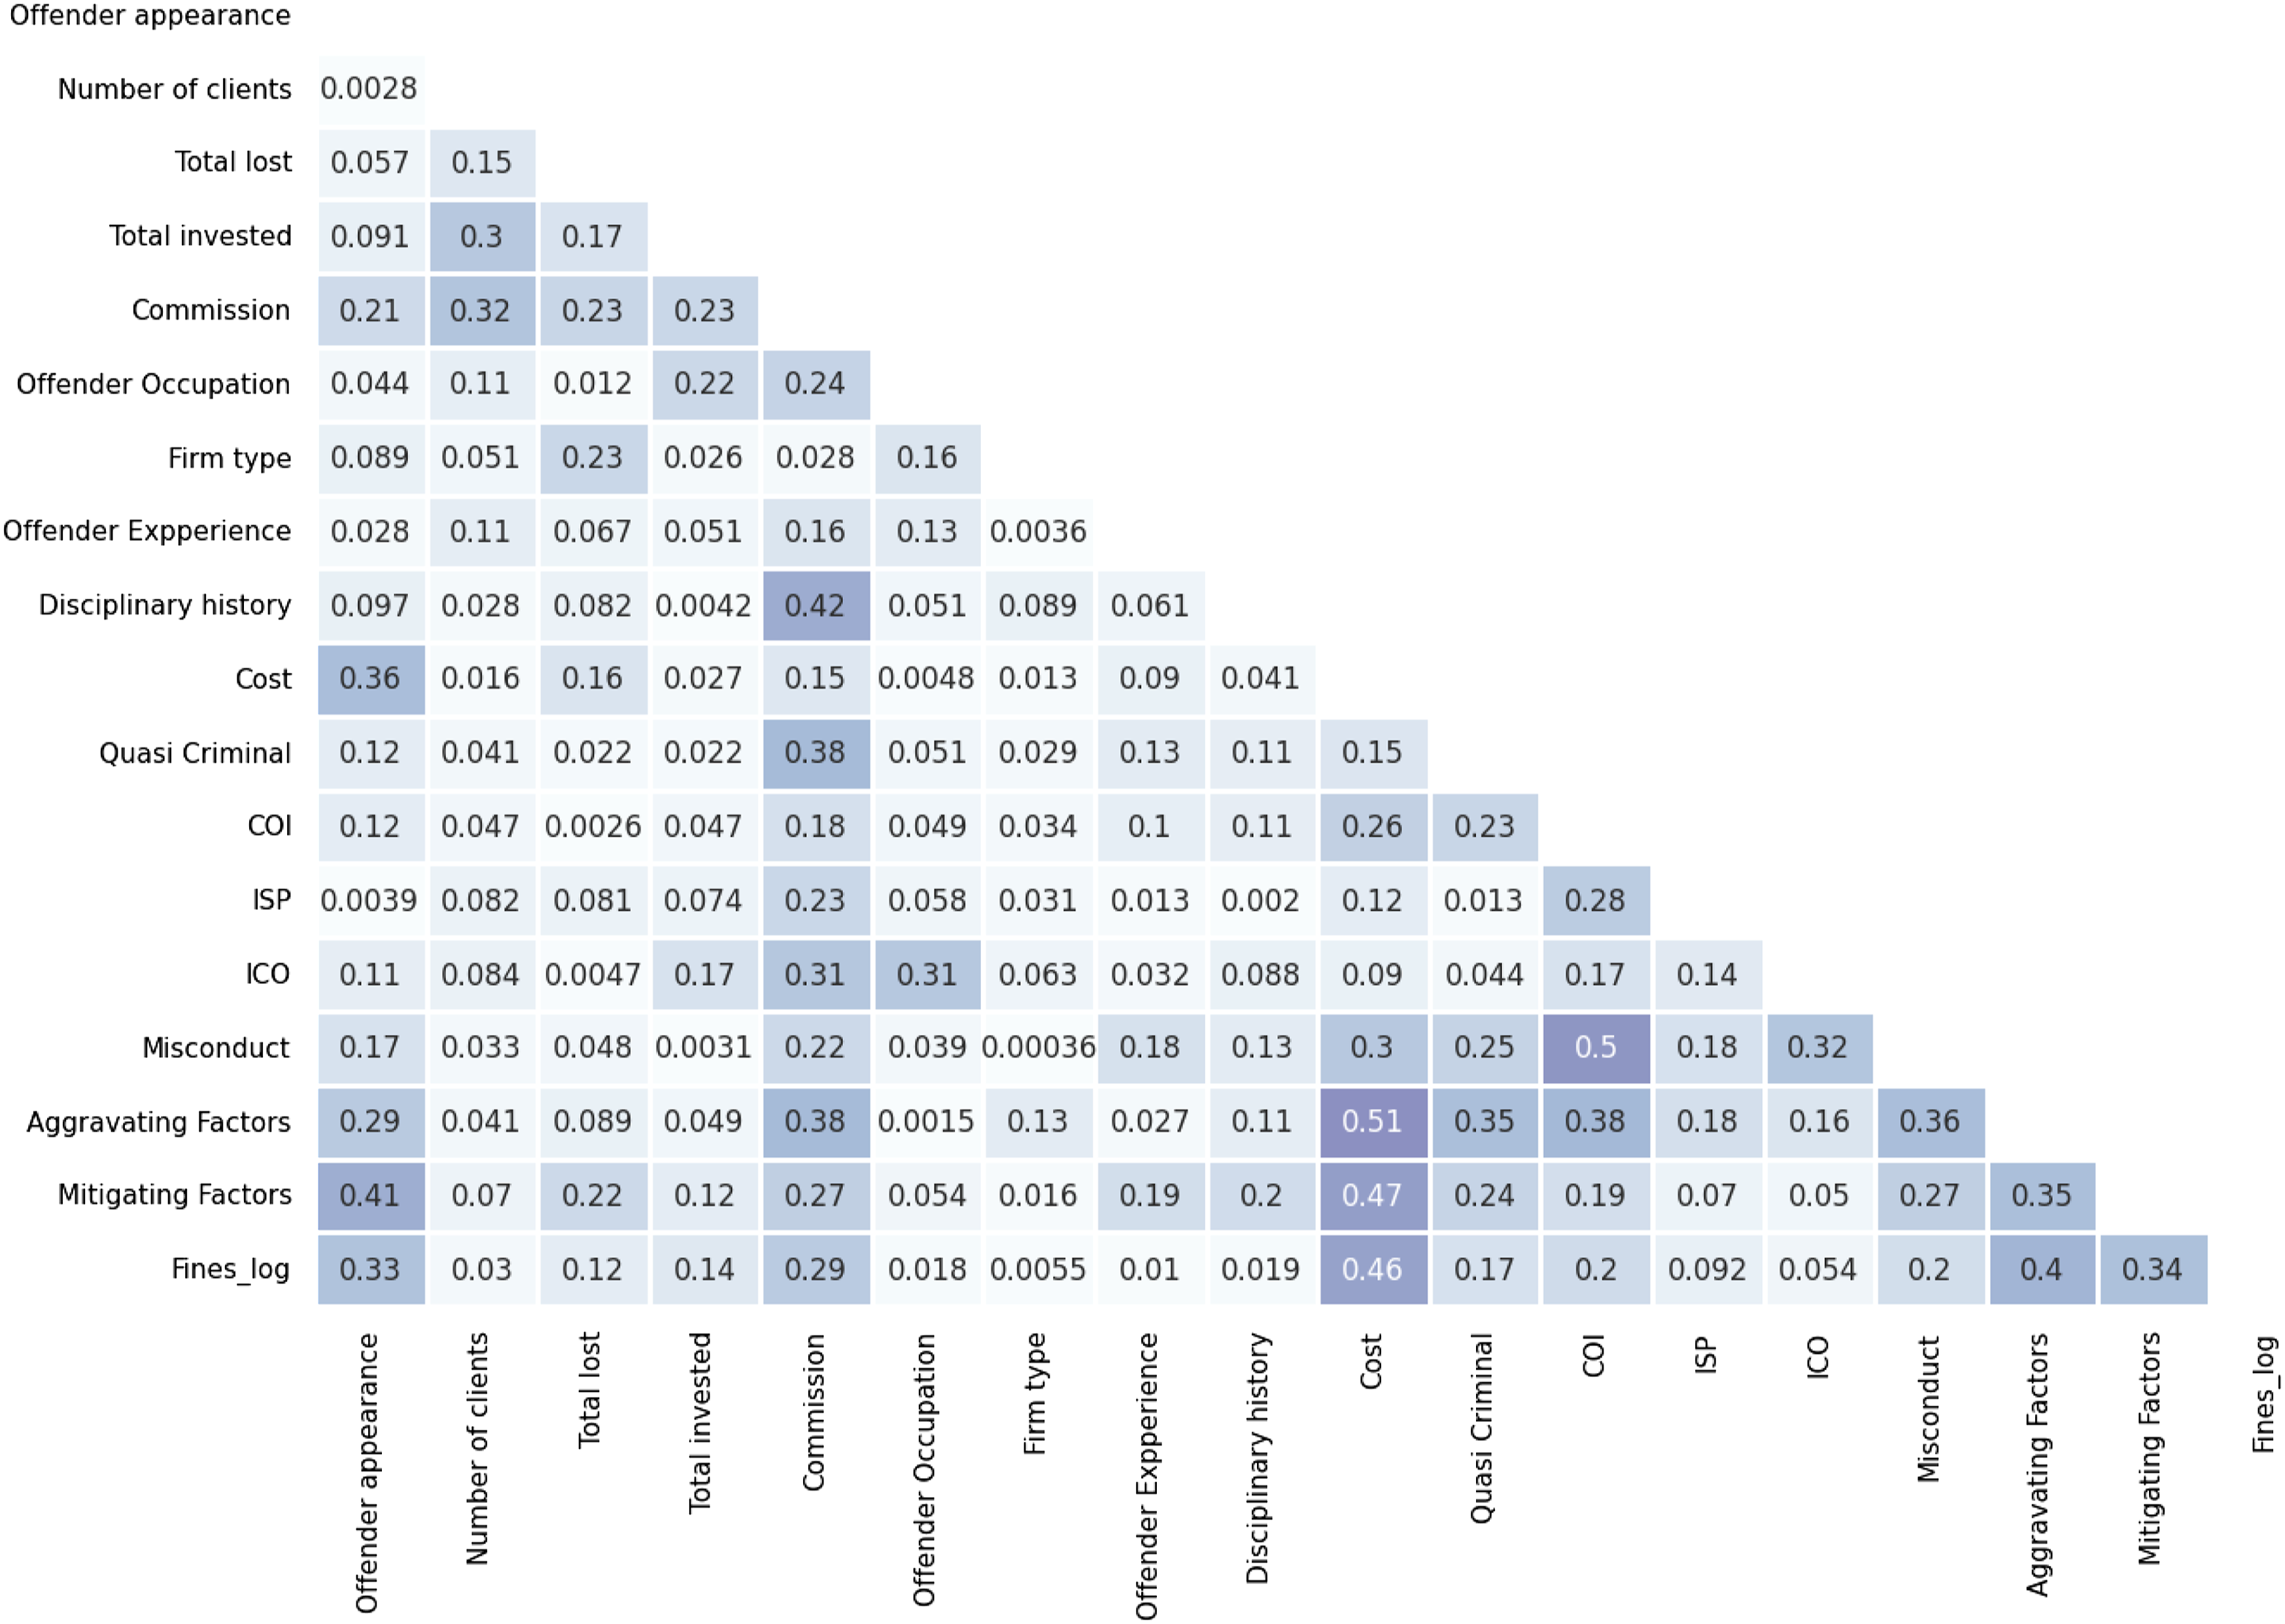
Variance Inflation Factors.
Splitting Data for Analysis
To ensure the validity and reliability of the models, multiple data-splitting techniques were employed. A standard train/test split was performed, allocating 80% of the data for training and 20% for testing to evaluate model performance on unseen data. Additionally, five-fold cross-validation was applied to further enhance robustness by training and testing the models on different subsets of the data. These approaches ensured reliable results by reducing the risk of overfitting and providing a comprehensive assessment of model performance for both in-sample and out-of-sample data from the train/test split method and across various data samples for five-fold cross-validation.
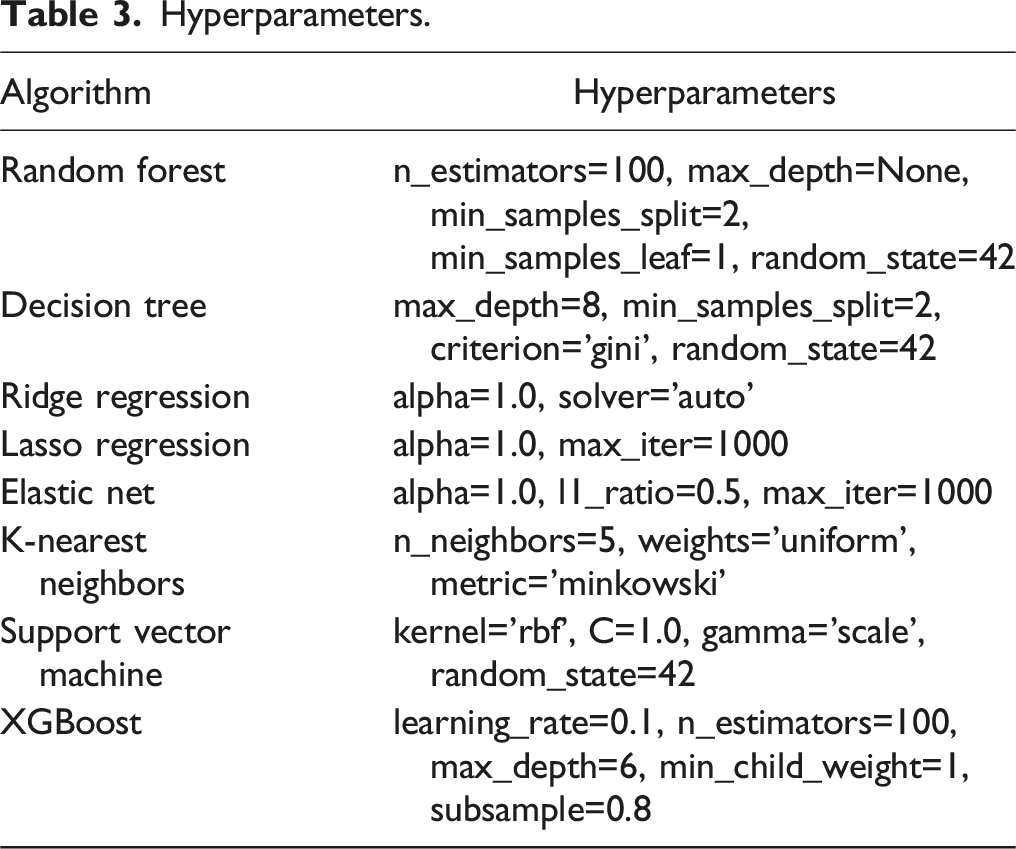
Parameter Tuning
Hyperparameters.
Experiments and Algorithm Selection
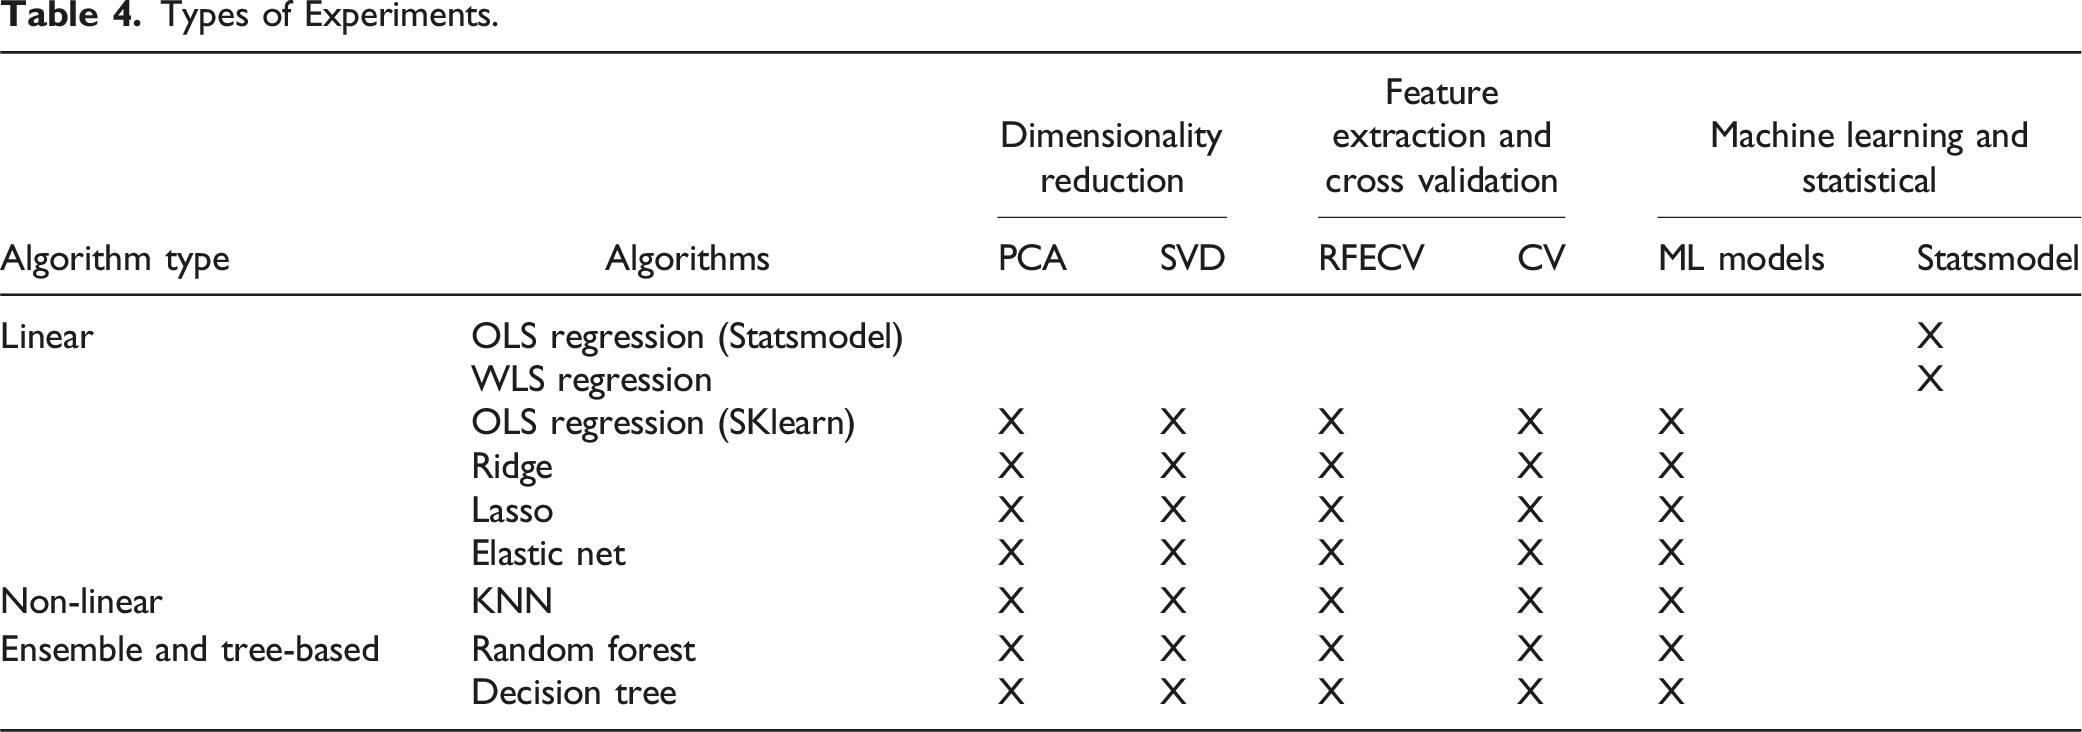
Types of Experiments.
Dimensionality Reduction
After data preprocessing, the final dataset consisted of 21 features. To avoid redundancy, PCA and SVD were applied to reduce the dataset’s dimensionality. These feature reduction techniques improved model interpretability and efficiency by focusing on the most critical features, particularly in a high-dimensional dataset. Additionally, the use of these dimensionality reduction methods helped address potential multicollinearity issues among variables, ensuring that the models performed more robustly and reliably.
Recursive Feature Elimination with Cross-Validation
RFECV was used to identify the most predictive variables. This method systematically removed irrelevant or redundant features, retaining only those with the strongest contributions to model performance. Feature selection improved the model’s accuracy and efficiency by reducing noise and focusing on the most critical predictors.
Linear Algorithms
As seen in Table XXX, linear, non-linear, ensemble, and tree-based algorithms were used to identify patterns and provide insights on the data. Linear algorithms assume a linear relationship between the features and the target variable, making them interpretable and efficient for structured datasets. The general formula for linear algorithms is: • Ŷ = predicted value • B0: is the intercept • B1, B2, …B
n
are the coefficients • X1, X2, … Xn are the independent variables
The regression models build on each other to provide a more robust and reliable understanding of the findings. OLS regression with statsmodels serves as the baseline model, estimating coefficients and the p-values by minimizing the sum of squared residuals. OLS regression assumes homoscedasticity (constant variance of errors) and independence of the data. In the presence of heteroscedasticity, WLS regression is a better choice for the data (Halunga et al., 2017; Romano & Wolf, 2017). WLS regression addresses heteroscedasticity by weighting observations differently based on their variances, which makes it more suitable for datasets where error variances vary across observations (Funke et al., 2021; Zafar & Aslam, 2023). Ridge and Lasso regression build upon the OLS and WLS models by performing L2 regularization to penalize large coefficients to reduce the risk of overfitting by keeping all the variables in the model, while Lasso adds L1 regularization, which not only prevents overfitting but also performs feature selection by shrinking some coefficients to exactly zero. Elastic Net regression combines L1 and L2 penalties, balancing the strengths of Ridge and Lasso to handle correlated features and ensure both shrinkage and feature selection of relevant predictors while mitigating multicollinearity, making it particularly effective for datasets with highly correlated or numerous features.
Non-Linear Algorithms
Non-linear algorithms capture complex relationships between the features and the target variable that cannot be modeled by linear methods. A commonly used non-linear algorithm for regression tasks is KNN. For regression tasks, KNN works by predicting the target based on the average value of the KNN. KNN was chosen for this project because it is one of the methods used in the literature on regulatory enforcement. The formula for KNN is shown in equation… • N
k
(x) represents the set of k-nearest neighbors of x.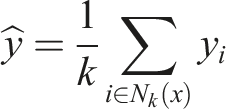
Ensemble and Tree-Based Algorithms
Ensemble and tree-based algorithms are more robust at finding patterns in non-linear data and were used to improve and optimize the performance of the models. Decision Trees split data recursively based on feature values, minimizing impurity measures using the Gini impurity. The formula for the Gini impurity is shown in equation… • p
i
the proportion of samples in class i.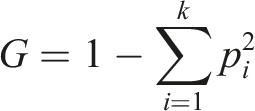
Random Forests, as an extension of decision trees, were employed because they are widely used in the literature on regulatory enforcement, demonstrating strong performance on regulatory datasets (Jacob de Menezes-Neto & Clementino, 2022). In this study, Random Forests enhance the traditional decision tree model by constructing multiple trees on random subsets of the data and combining their predictions through averaging, resulting in improved accuracy and robustness. Random Forests further improve generalization by aggregating diverse models. The formula for random forest is given as: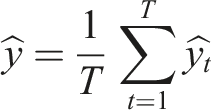
T is the total number of trees.
Findings and Analysis
Summary Results
Summary Results.
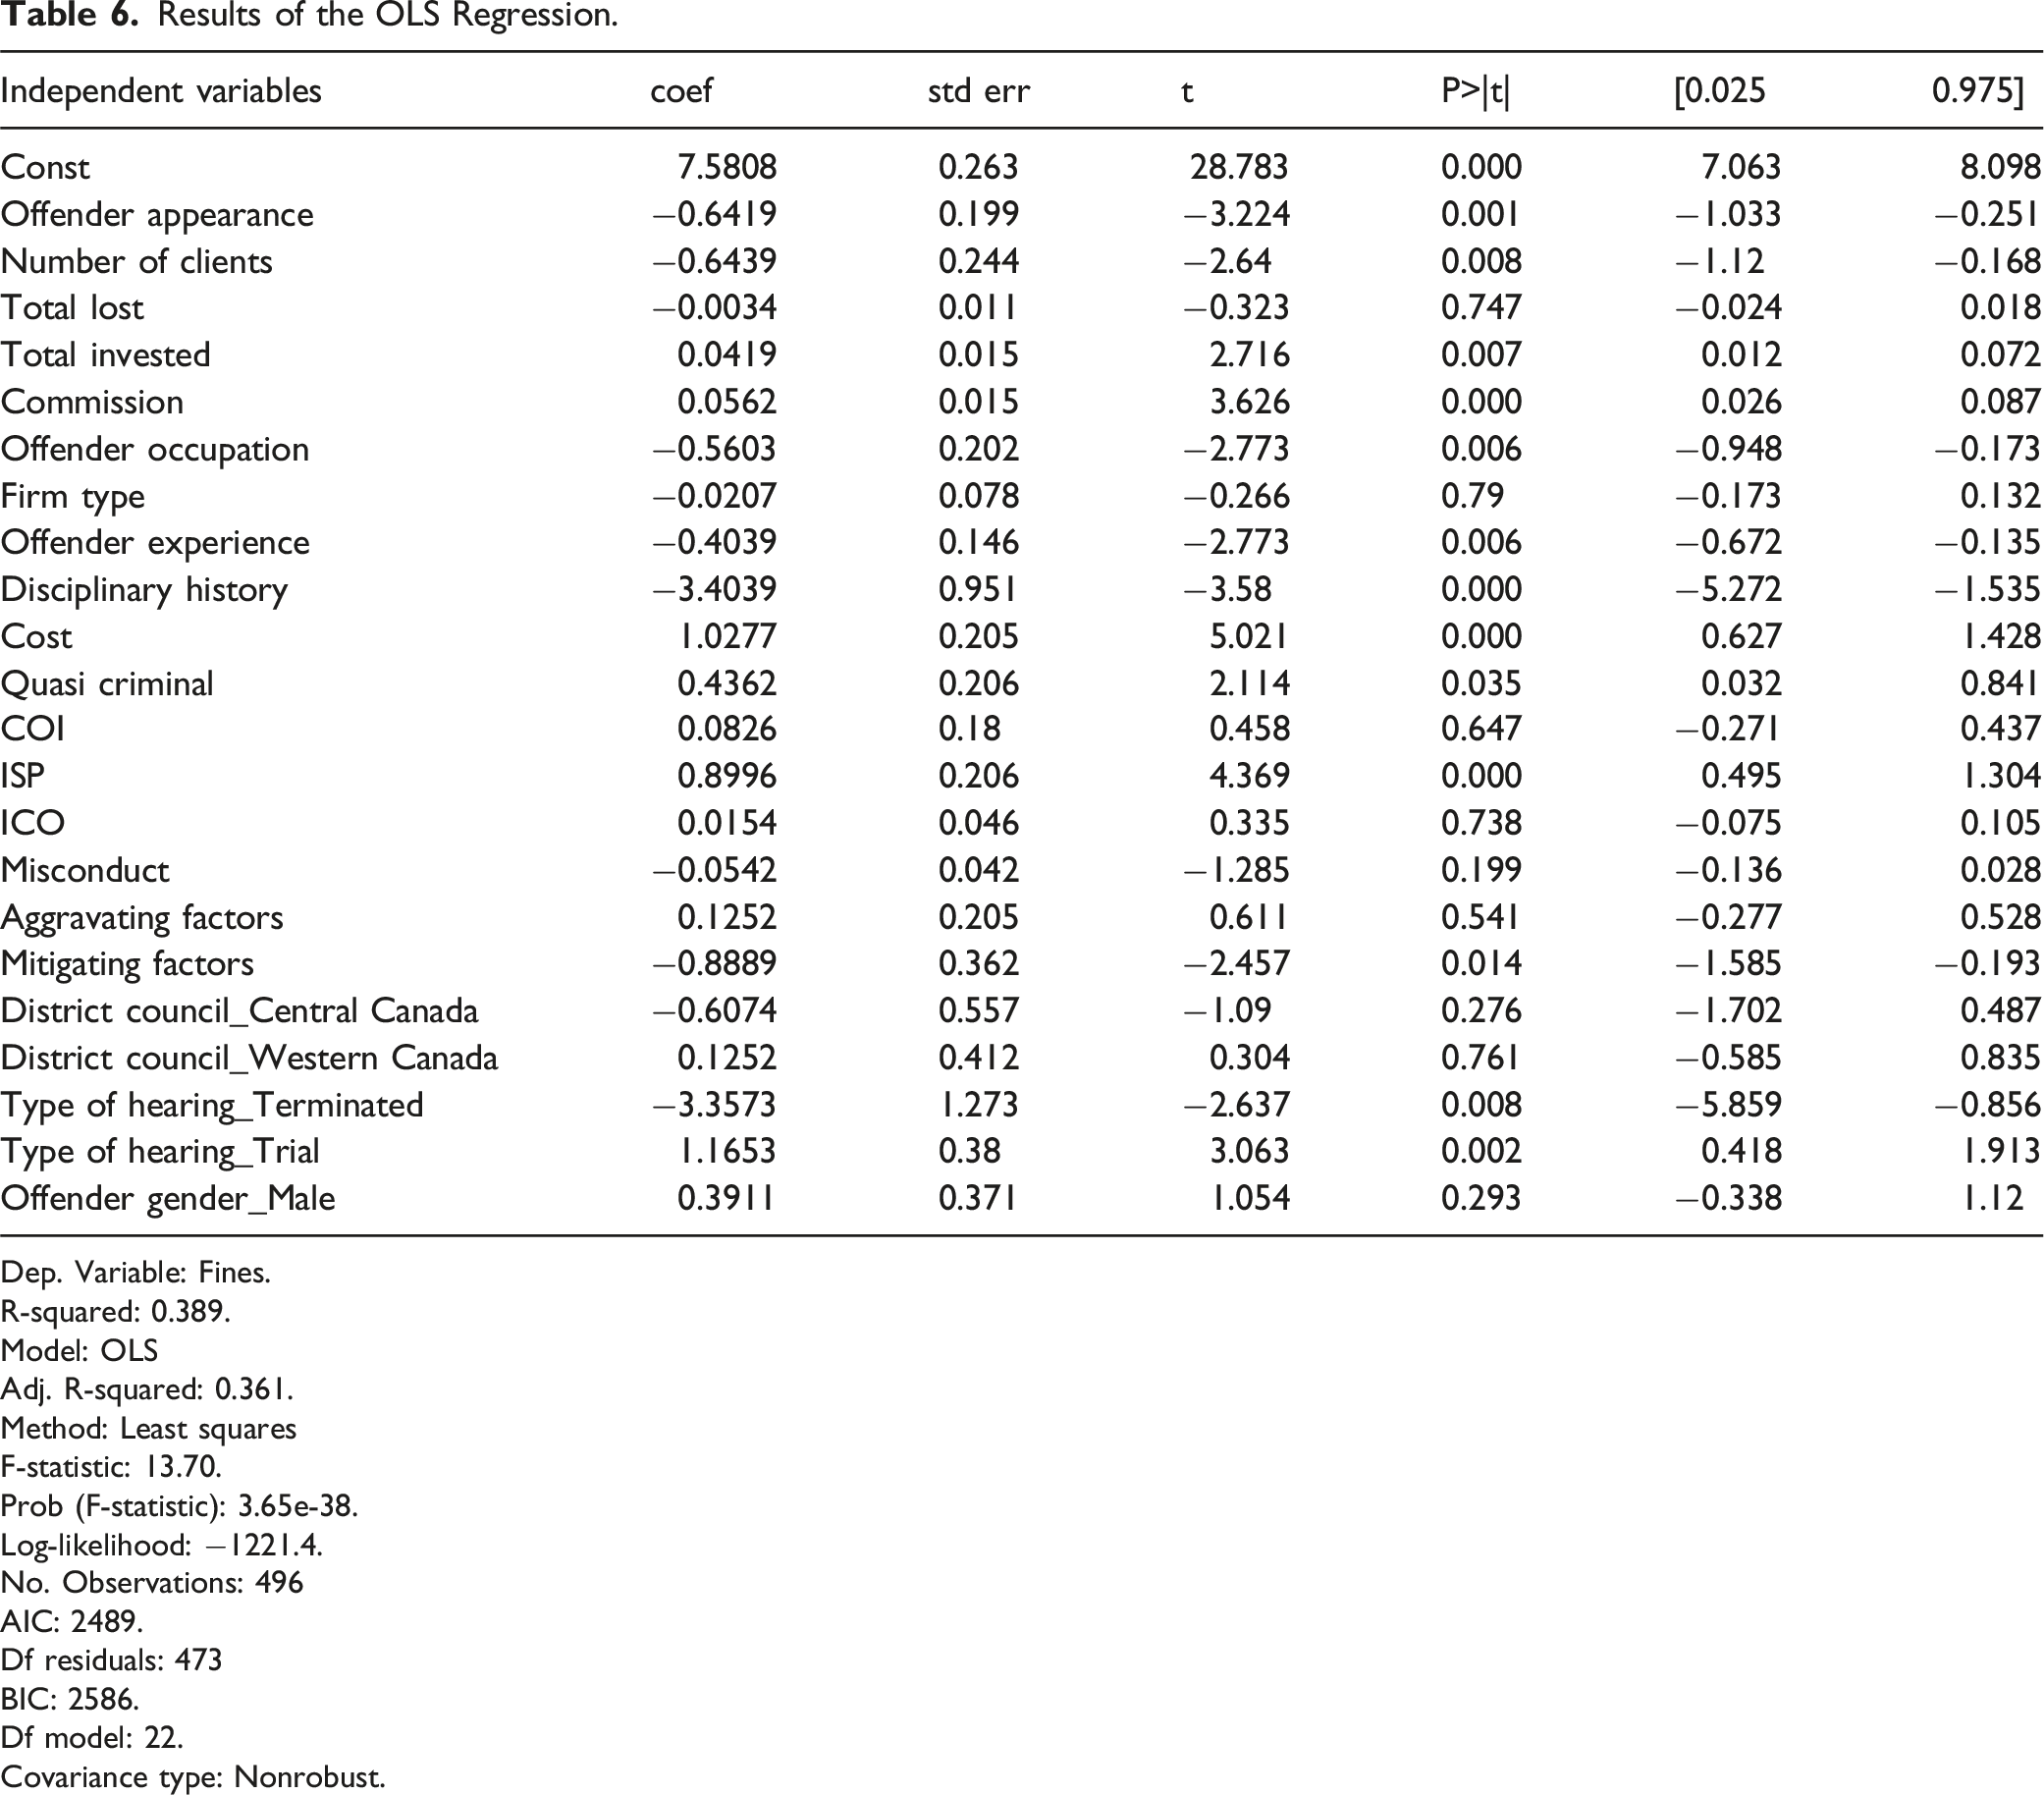
Results of the OLS Regression.
Dep. Variable: Fines.
R-squared: 0.389.
Model: OLS
Adj. R-squared: 0.361.
Method: Least squares
F-statistic: 13.70.
Prob (F-statistic): 3.65e-38.
Log-likelihood: −1221.4.
No. Observations: 496
AIC: 2489.
Df residuals: 473
BIC: 2586.
Df model: 22.
Covariance type: Nonrobust.
Baseline Statistical OLS Models
The baseline OLS model exhibits moderate explanatory power, with an R2 of 0.389 and an adjusted R2 of 0.361, indicating that about 36.1% of the variance in fines is explained by the predictors. The model’s F-statistic of 13.70 (p < .001) confirms its overall statistical significance. Key financial predictors such as Commission, Hearing Cost, Total Invested, and Number of Clients show strong associations with fine levels, reflecting their substantive importance in enforcement decisions. Offense characteristics including Quasi-criminal (p < .035) and Improper Sales Practices (ISP) (p < .001), along with offender traits like Appearance (p < .001), Occupation, Experience, and Disciplinary History (all p < .006), also emerge as significant. Contextual and procedural elements such as Mitigating Factors (p < .014) and specific hearing types—Terminated (p < .008) and Trial (p < .002)—are similarly influential, highlighting the importance of legal context and circumstances in fines imposed on offenders.
On the other hand, Firm Type, Misconduct, and Aggravating Factors lack statistical significance. The non-significance of Aggravating Factors is unexpected given their theoretical relevance to offense severity, suggesting they may be inconsistently applied or less quantifiable in practice. Their influence may be overshadowed by variables more easily measured, such as costs or disciplinary history. The model’s overall fit remains limited; only 40% of the variance in fines is explained by the predictors. A drop to 36% in adjusted R2 reflects the penalty for irrelevant predictors. These results point to potential heteroscedasticity, where variance in errors may differ across observations, possibly affecting the reliability of coefficient estimates.
To check for heteroscedasticity, we conducted a Breusch-Pagan test. The results revealed a test statistic of 56.62 and a p-value of 6.96 × 10⁻⁵, which is well below the common significance threshold of 0.05. Based on these findings, we reject the null hypothesis of homoscedasticity in the OLS regression model, confirming the presence of heteroscedasticity. The low p-value further suggests that the variance of the residuals is not constant across observations, which may impact the reliability of the coefficient estimates. To address heteroscedasticity, we employed WLS regression.
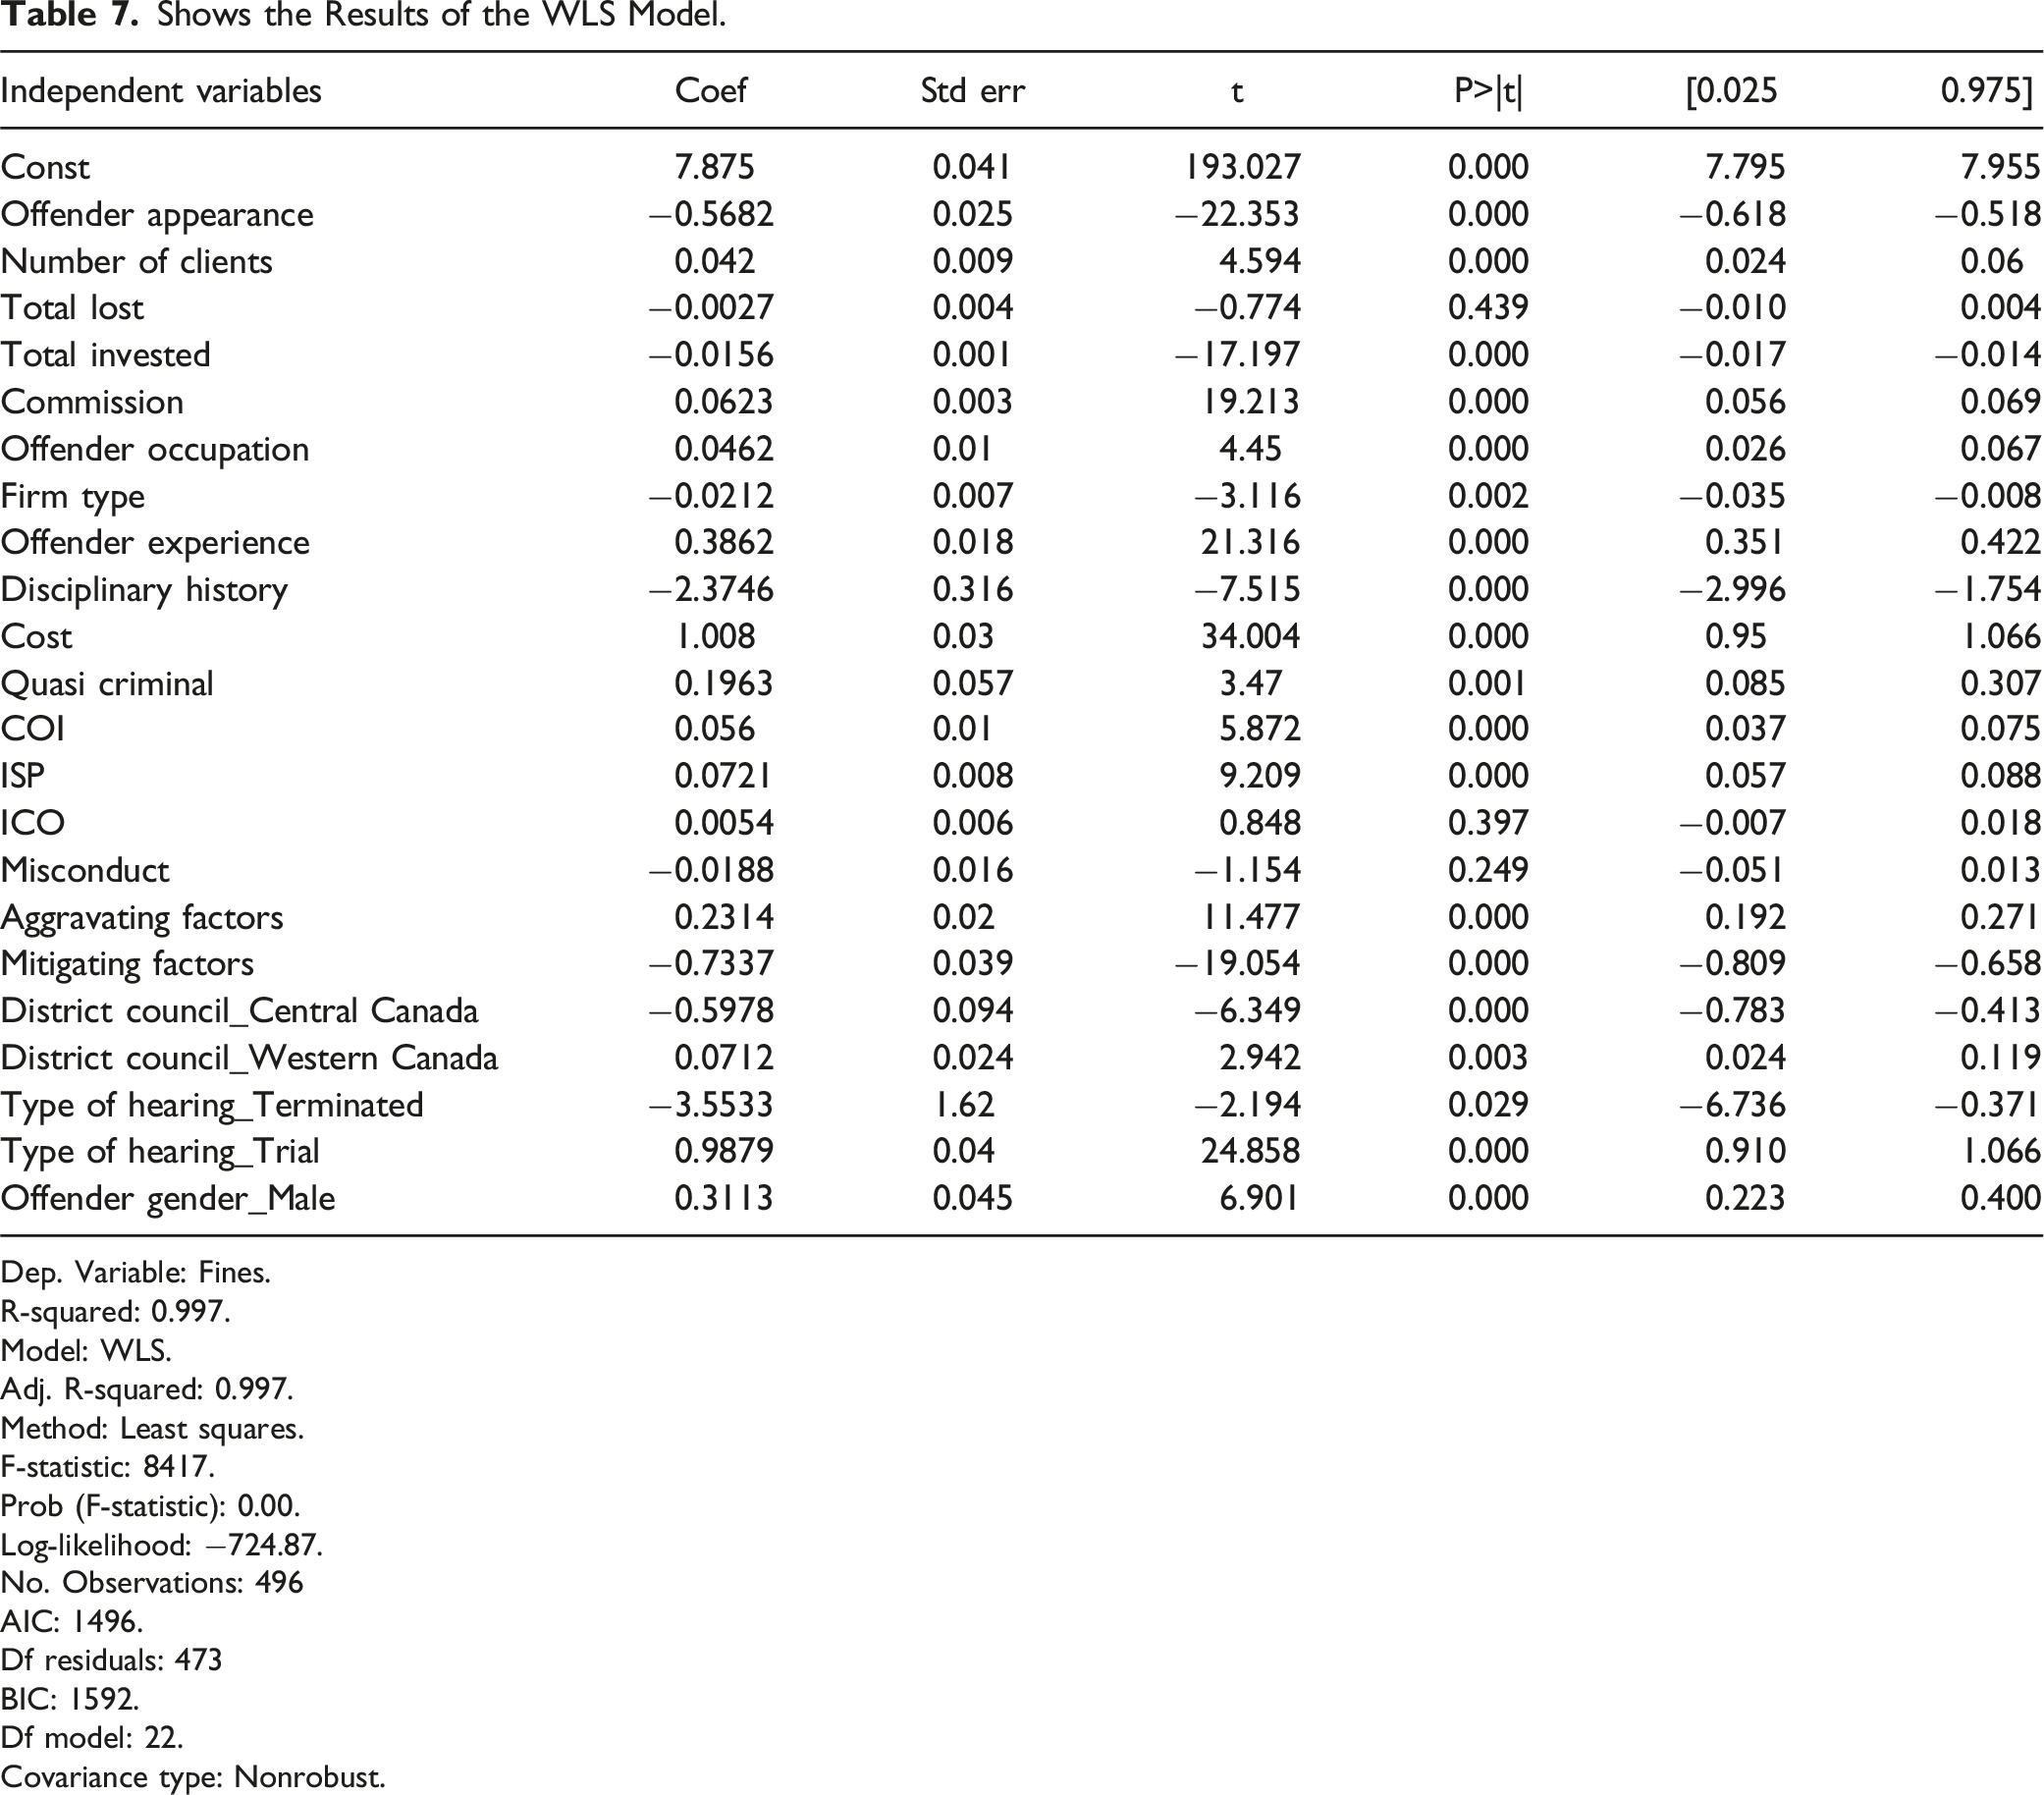
Shows the Results of the WLS Model.
Dep. Variable: Fines.
R-squared: 0.997.
Model: WLS.
Adj. R-squared: 0.997.
Method: Least squares.
F-statistic: 8417.
Prob (F-statistic): 0.00.
Log-likelihood: −724.87.
No. Observations: 496
AIC: 1496.
Df residuals: 473
BIC: 1592.
Df model: 22.
Covariance type: Nonrobust.
Several predictors remain statistically significant in both the WLS and OLS models, including Commission (p < .001), Cost (p < .001), Offender Experience (p < .001), Mitigating Factors (p < .001), and Quasi-Criminal offense (p < .001). The consistency in these features highlights their contribution to explaining fines across models. Offense-related variables such as Improper Sales Practices (ISP) (p < .001) and the type of hearing, in this case, Trial (p < .001), remain significant predictors of fines.
There were deviations with features from the OLS to the WLS model. Aggravating Factors, which were not significant in the OLS model, become highly significant (p < .001) in the WLS model. Firm type (p < .002) and District Council_Western Canada (p < .003) are newly significant in the WLS model, suggesting regional and organizational differences in determining fines. While Total Invested is significant in the WLS model (p < .001), it had a weaker influence in the OLS model, indicating that the variability in this feature’s impact was better captured with the heteroscedasticity adjustment. The significance of Offender Occupation (p < .000) also improves in the WLS model. These findings suggest that accounting for heteroscedasticity enhances the predictive power of this variable, indicating its importance in influencing fines. Conversely, Misconduct and Internal Control Offenses (ICO) remain statistically insignificant in both models, suggesting that they do not meaningfully contribute to explaining the variance in fines. The increase in adjusted R2 and the changes in the significance of key predictors emphasize the importance of using a model that accounts for non-constant variance in residuals, ensuring more accurate coefficient estimates and better interpretation of results.
Figure 2 presents the results of the WLS regression model. The standardized coefficients highlight the relative importance and direction of influence for each predictor in determining fines. Type of hearing_Terminated and disciplinary history emerge as the most influential negative predictors, with large negative coefficients and statistically significant p-values (p < .01). These findings suggest a strong inverse relationship between these variables and the fines imposed. Specifically, the large negative coefficients indicate that when cases are resolved as terminated hearings or when offenders have no prior disciplinary history, the fines tend to decrease significantly. One possible explanation is that terminated hearings, often resolved quickly, may involve less severe cases or procedural dismissals, leading to lower penalties. Likewise, offenders without a history of misconduct may receive more lenient treatment, reflecting a regulatory approach that takes mitigating circumstances into account when determining fines. Standardized coefficient for regression model.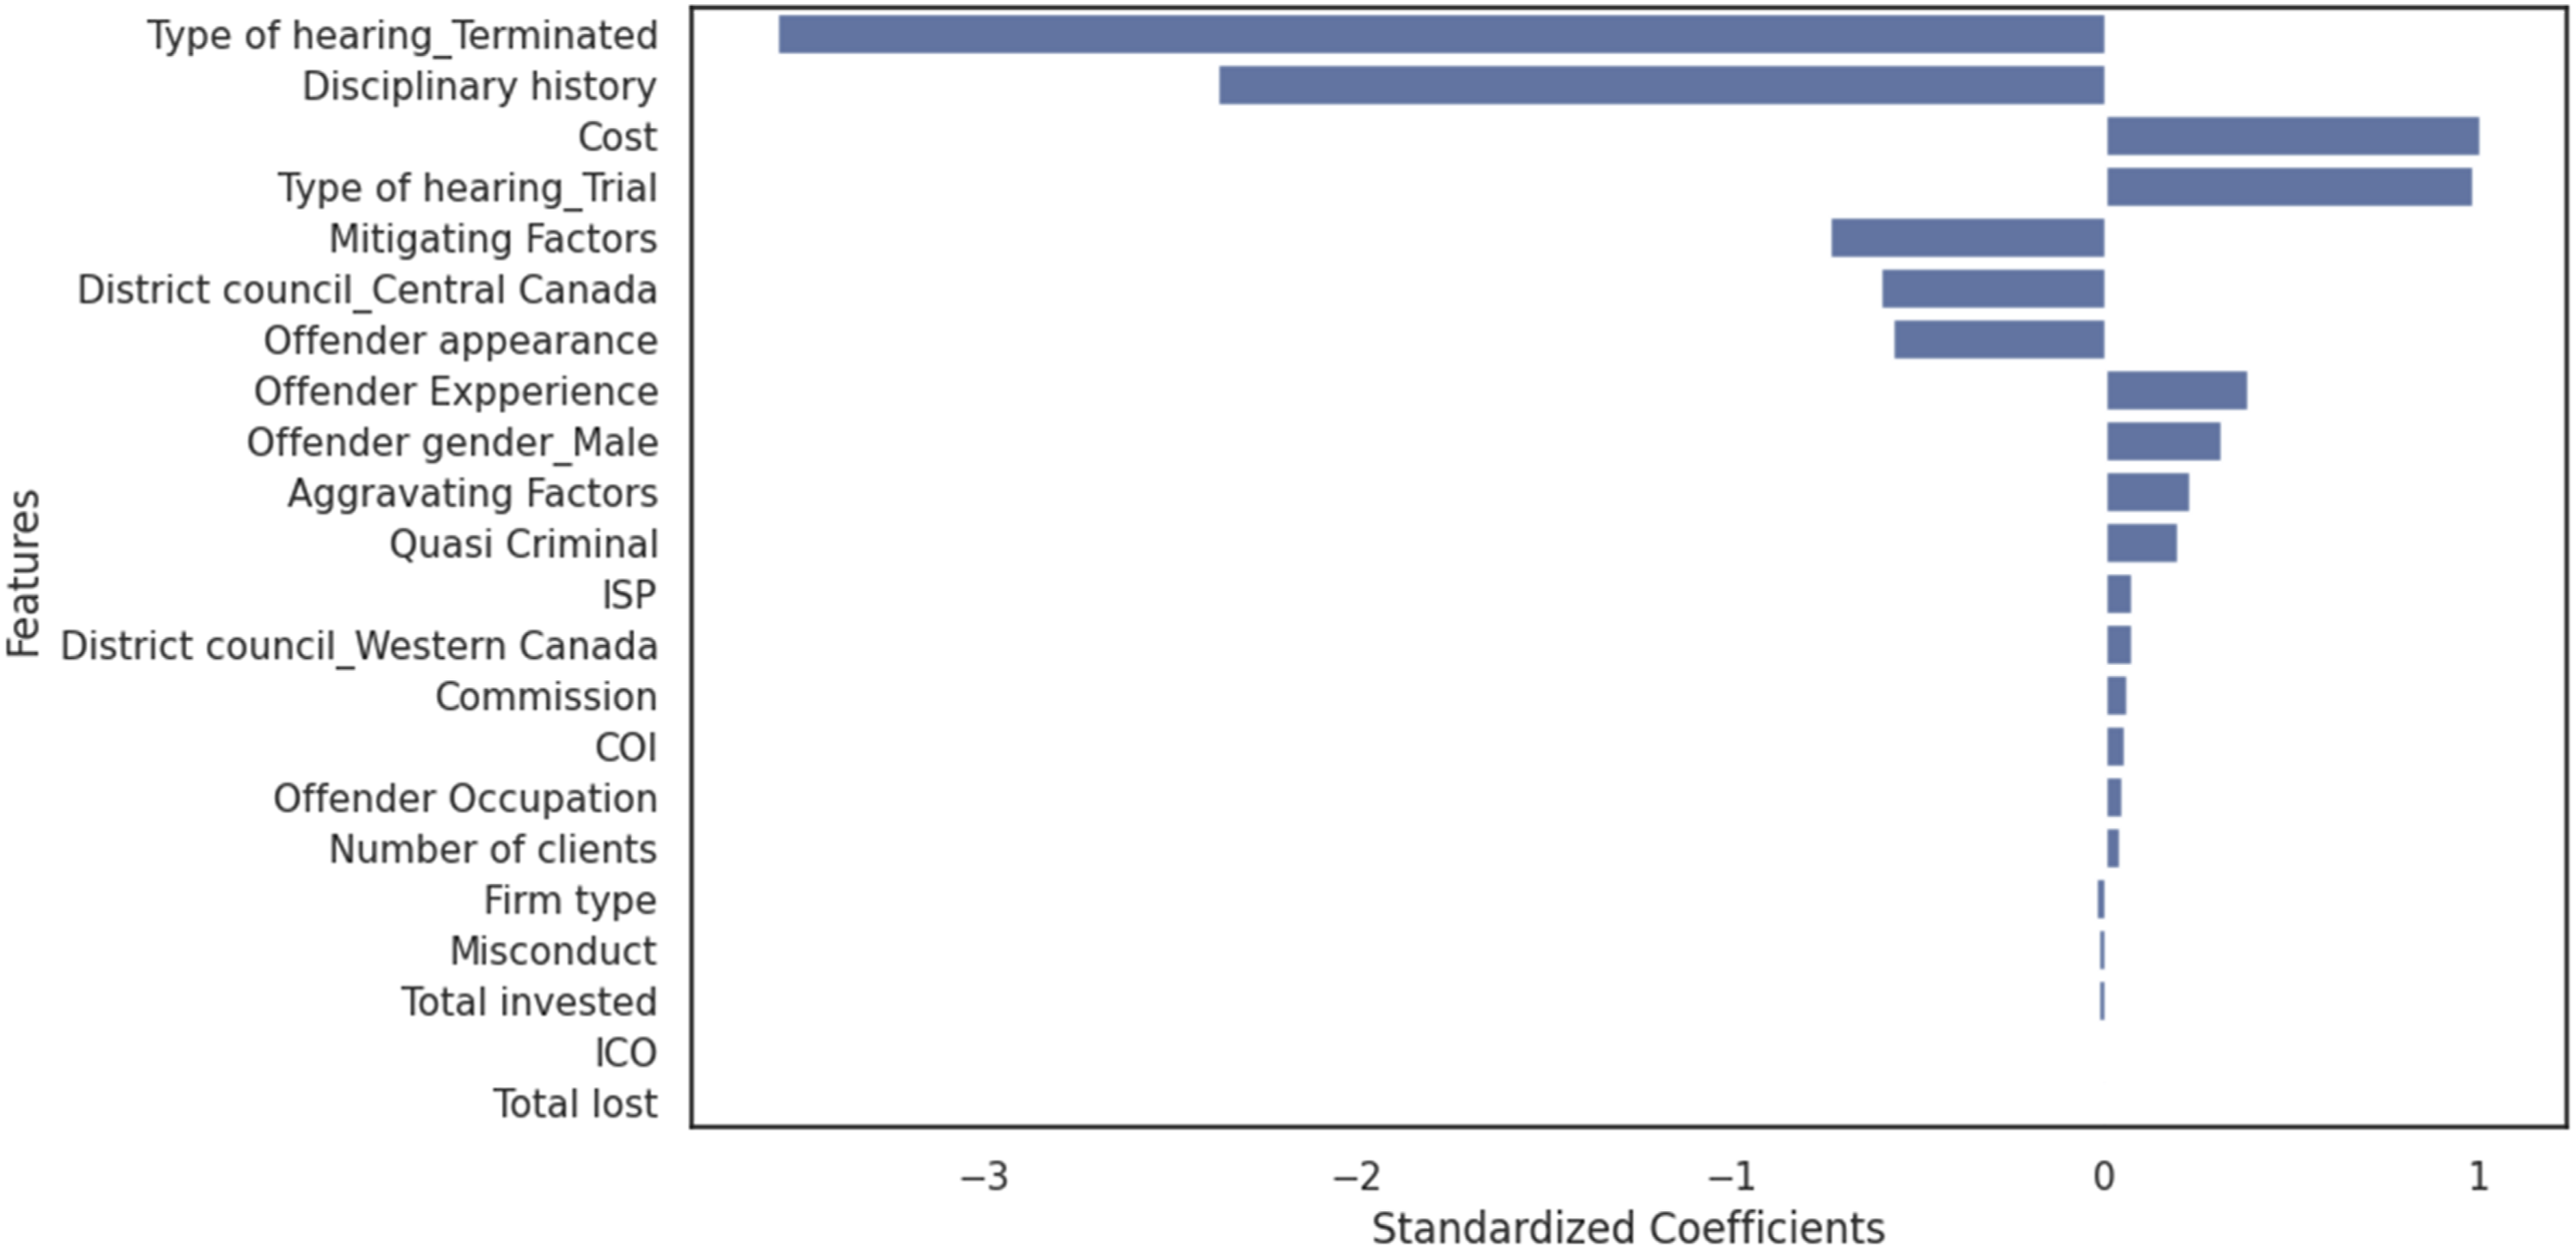
Variables such as mitigating factors, district council_Central Canada, and offender appearance also display significant negative coefficients, indicating that these factors play a lesser role in increasing fines. Specifically, their negative coefficients suggest that the presence of mitigating factors, cases heard in Central Canada, or the appearance of the offender at the hearing are associated with lower fines. These findings may reflect the consideration given to mitigating factors in penalty impositions, regional variations, or the perception that offenders appearing at hearings may demonstrate cooperation, potentially influencing the fines imposed by the district council.
Results from Machine Learning Models
Results of the Machine Learning Models With Sklearn.
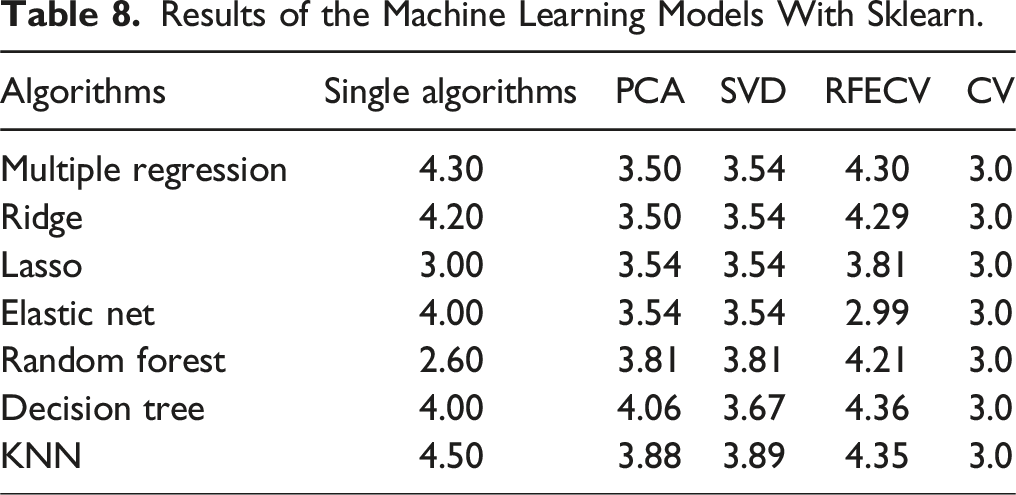
Among the single-algorithm approaches, Random Forest achieves the best performance, with the lowest RMSE of 2.6. Similarly, Elastic Net with RFECV achieves the lowest RMSE overall at 2.99, demonstrating the effectiveness of dimensionality reduction and feature selection in enhancing model performance. The RMSE values for these models, being significantly below the standard deviation, suggest high precision and proportionality in their predictions. In contrast, KNN and Decision Tree consistently produce higher RMSE values across all experiments, indicating they may be less effective for this dataset.
Dimensionality reduction techniques, such as PCA and SVD, exhibit lower RMSE means relative to the fines, but some variability is observed with certain algorithms. Specifically, Random Forest, Decision Trees, and KNN show slightly higher RMSEs in relation to the standard deviation of fines, suggesting that these methods may not fully leverage the dimensionality reduction benefits for certain models. The results from the cross-validation experiments further validate the robustness and reliability of the models. Across all algorithms, the cross-validation experiments yield the most consistent RMSE scores, clustering around 3.0. These RMSE values are well below the mean and standard deviation of fines, indicating that the models generalize effectively to unseen data. The low RMSE values further affirm that the predictive models are reliable and capable of forecasting fines proportionate to actual values, making them suitable for practical application and deployment.
Feature Relevance
Given that Random Forest was the best predictor and that it has its own inbuilt feature relevance mechanism, it was used to identify the most important features contributing to the prediction of fines. Figure 3 shows the feature relevance derived from the Random Forest model, highlighting which variables have the greatest influence on fines. Notably, Cost, Total Invested, Number of Clients Affected, Offender Appearance, and Commissions Earned from the Fraud emerge as the top predictors, indicating their substantial contribution to the imposition of fines. These features represent tangible financial impacts and procedural considerations directly tied to the severity and scale of offenses. On the other hand, features such as ICO, COI, Misconduct, and Aggravating Factors had negligible effects on the prediction, suggesting that their role in determining fines is limited or overshadowed by more quantifiable variables (M. Lokanan & Masannagari, 2021). These findings underscore the importance of focusing on financially and procedurally significant factors when predicting regulatory penalties. Feature relevance.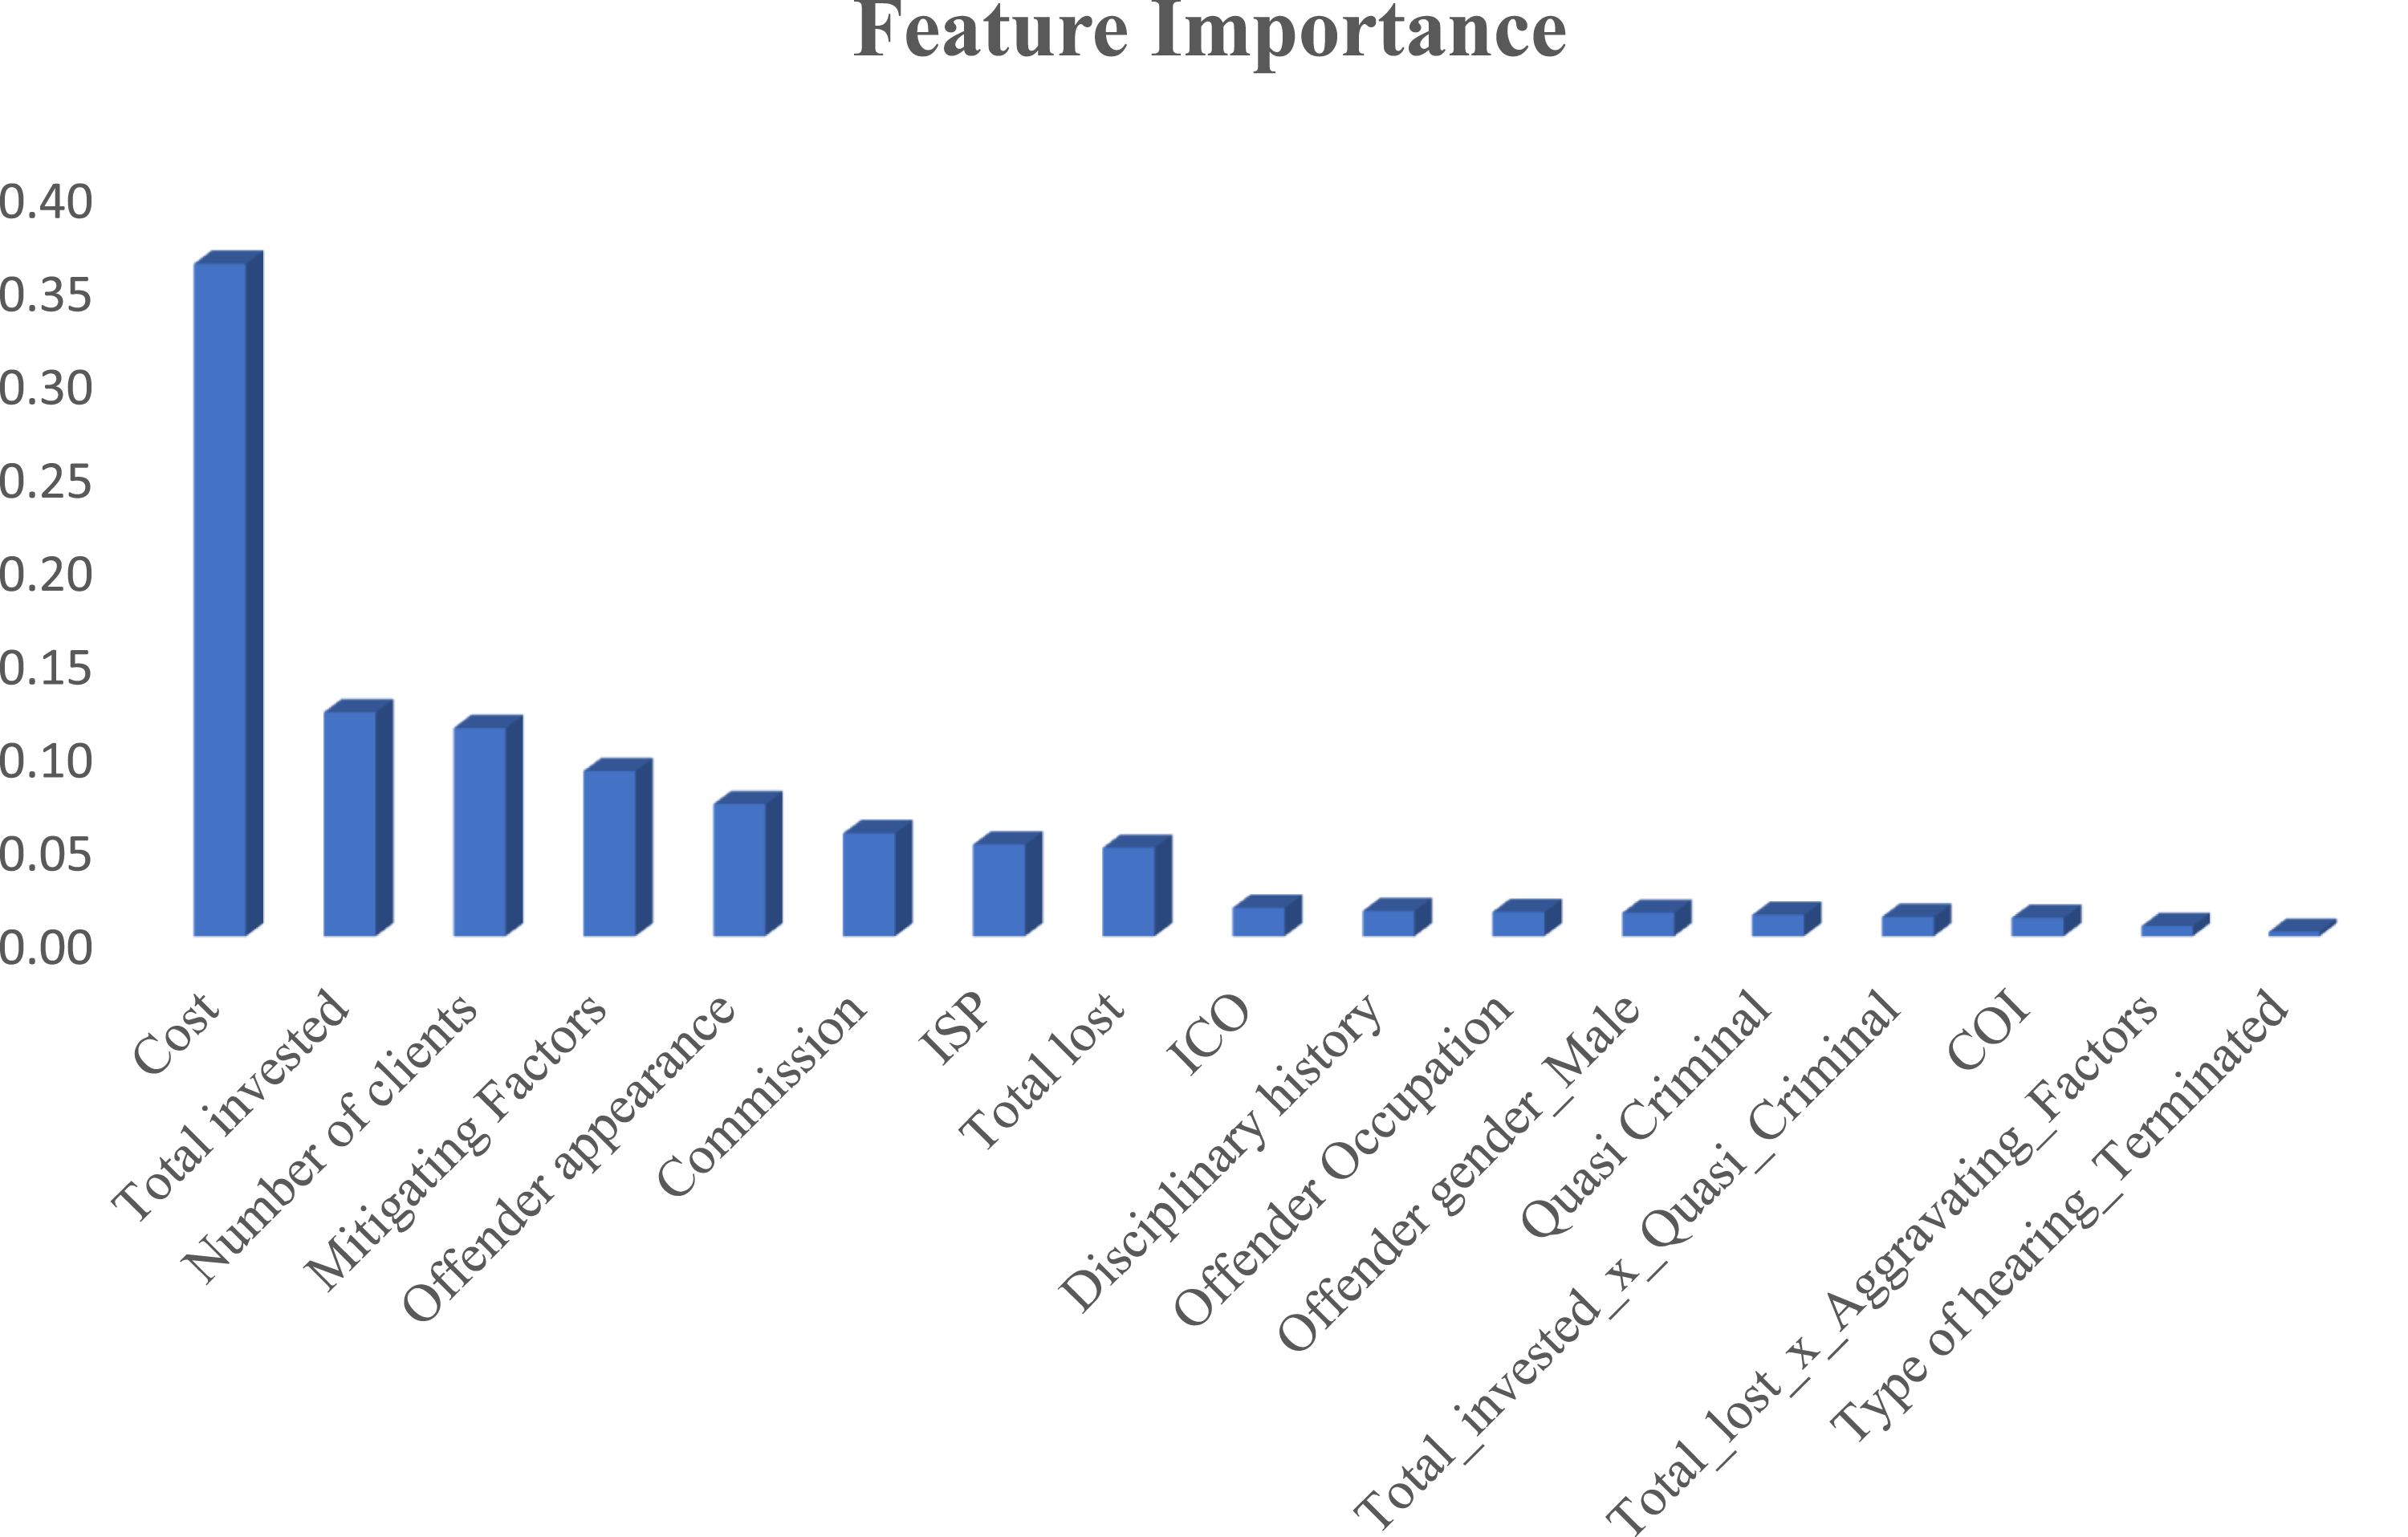
Discussion and Conclusions
The findings underscore the importance of effective regulatory enforcement as a key aspect of financial service management. The superior explanatory power of the WLS model over the OLS model highlights the need for sophisticated analytical techniques to ensure consistency in fine allocation. Addressing heteroscedasticity and assigning appropriate weights to relevant predictors increased the adjusted R2 from 0.361 in OLS to 0.997 in WLS, demonstrating the value of using weighted models for complex regulatory datasets (Halunga et al., 2017). Consistently significant predictors across models, such as Cost, Commission, Offender Experience, and Type of Hearing_Trial, reinforce their critical role in fine determination. However, additional significant predictors, including Aggravating Factors, the number of clients affected, and fraud-related financial losses, became evident only in the WLS model, suggesting the necessity of advanced methodologies to uncover hidden patterns in enforcement decisions (Funke et al., 2021; Zafar & Aslam, 2023).
Regulatory enforcement functions as a critical service provided by SROs to ensure compliance and maintain market integrity. The findings suggest that Cost incurred in investigations and Type of Hearing_Trial are the most influential positive predictors of fines, aligning with deterrence theory’s emphasis on ensuring sanctions are severe, certain, and proportional (Abramovaite et al., 2023; Piquero et al., 2011). The emphasis on investigation costs and the type of hearing reflects an effort by the MFDA to streamline enforcement processes, potentially enhancing the swiftness of sanctions and reinforcing the celerity dimension of deterrence theory. A more expedited enforcement process may enhance the perceived swiftness of punishment, thereby contributing to the deterrent effect. However, while these features reflect procedural efficiency, their relevance to deterrence theory lies in their influence on the timing and visibility of sanctions rather than in the direct severity or certainty of punishment. Similarly, Offender Experience, Offender Gender_Male, and Quasi-Criminal offenses significantly impact fines, implying that penalties are designed to discourage experienced offenders and address gender disparities in enforcement. These patterns align with the service management principle of fairness, ensuring that regulatory enforcement is predictable and transparent (Buckenmaier et al., 2021; Davies & Malik, 2022; Matsueda et al., 2006).
However, inconsistencies remain. Factors such as Total Lost, ICO, and Misconduct exhibit negligible influence, while interactions between Total Lost and Aggravating Factors, though statistically significant, have limited practical impact. The inconsistent application of these variables challenges the certainty and proportionality components of deterrence theory (Matsueda et al., 2006; Paternoster, 1989). These findings suggest that regulatory enforcement, as a service, does not uniformly apply penalties in ways that reflect the severity of financial misconduct.
One of the most pressing concerns is whether fines are severe enough to outweigh the perceived benefits of noncompliance. The significant role of Cost and Commission in fine determination suggests that penalties may be designed to recover losses rather than act as effective punitive measures. These findings align with critiques that regulatory sanctions often fail to impose adequate deterrents for serious violations (Davies & Malik, 2022; Earnhart & Friesen, 2023; Spalding, 2014). Quasi-Criminal offenses, which should result in the most severe penalties, had limited predictive power in fine determination, suggesting regulatory leniency and a failure to align enforcement with the principles of deterrence and proportionality (Anand, 2018; Boyle et al., 2024). The risk of offenders perceiving fines as manageable business costs rather than meaningful deterrents undermines the deterrent effect of financial penalties, raising concerns about whether fine structures require recalibration to ensure compliance and market stability.
These findings reinforce the need for data-driven, transparent, and consistent regulatory frameworks in the service management of financial oversight. Machine learning models provide a means to improve regulatory decision-making by identifying key predictors of fines, exposing inconsistencies, and enhancing fairness in enforcement practices. Regulatory bodies should leverage these models to refine their fine structures, ensuring penalties align with deterrence objectives and industry expectations. Implementing machine learning into enforcement decision-making can increase accountability and promote confidence in the regulatory system, reinforcing its role as an essential service in financial markets.
Conclusion and Future Directions
Through various experiments, we explored the application of machine learning algorithms to predict fines imposed by the MFDA. Specifically, we assessed the proportionality and severity of fines to determine their effectiveness as deterrents to securities law violations. The findings revealed that the statistical approach using WLS and the machine learning approach, particularly Random Forest, achieved high predictive accuracy, effectively identifying the costs incurred during the investigation, trial hearing, the total amount invested, and the number of clients affected as significant predictors of fines. These features appear to have influenced the amount of fines imposed across both the statistical and machine learning approaches. However, the findings also revealed discrepancies, with factors like Quasi-Criminal offenses and Aggravating Factors—typically associated with severity—having limited predictive power. These findings raise concerns about the proportionality of fines in certain cases and their ability to uphold deterrence principles.
The findings from this study provide critical insights into the imposition of fines by SROs in the securities industry, particularly regarding their deterrence objectives to hold offenders accountable to law and ethics standards. Deterrence theory underscores the need for penalties to be proportional, consistent, and sufficiently severe to discourage future misconduct. While features such as costs and the amount invested suggest a focus on restitution and punishment, the limited influence of offenses with criminal elements (i.e., Quasi-Criminal) raises questions about whether fines are applied in a manner that reflects the seriousness of violations. The inconsistencies in fines imposed by the MFDA’s tribunals may undermine the certainty and fairness of regulatory sanctions, thereby reducing their deterrent effect.
Limitations and Future Research
A key limitation of this study is the inability to assess the swiftness, or celerity, of punishment. Measuring celerity would require access to timestamped data such as the dates of offense, investigation, hearing, and final sanction, which were not available in the MFDA dataset. Without timestamped data, the analysis cannot capture how quickly sanctions follow violations, leaving a gap in understanding how timing affects deterrence. Future research should seek to obtain complete procedural records that include time intervals to examine whether delays in enforcement diminish the perceived certainty or effectiveness of sanctions.
A further limitation concerns the scope of the dataset, which includes only enforcement cases formally adjudicated by the MFDA. A substantial number of securities violations may go unreported or be resolved internally by firms or through informal settlements, leaving them absent from the available data. The absence of these cases constrains the generalizability of the findings and may result in an underestimation of the true extent of misconduct in the industry. Future research could address this limitation by incorporating data from other regulatory bodies and including non-adjudicated cases to capture a more complete picture of enforcement practices.
Footnotes
Declaration of Conflicting Interests
The author declared no potential conflicts of interest with respect to the research, authorship, and/or publication of this article.
Funding
The author disclosed receipt of the following financial support for the research, authorship, and/or publication of this article: Funding was receuved from the Social Sciences and Humanities Research Council of Canada (200775).