
Abstract
Drawbells are large constructions that allow the flow of the broken ore at the production level within the drawpoints. The results of drawbell construction are crucial for a successful mine plan extraction in a block caving mine. Analysis and integration of all the topics related to a drawbell can improve the performance of the surrounding area of drawbells, particularly the damage associated to induced stress during the different stages of a block caving operation. The improvement of operational aspects related to the drawbells would decrease the risk of failure, particularly in deep mines subject to large stresses, which are more likely to experience sudden violent or progressive failure. A large-scale numerical model was developed to analyse different mining sectors using sub-models. It was found that the geotechnical response is highly correlated to the stress field, which also controlled the resulting seismicity. In a scale of a drawbell, the drawpoint drift roof and the bridge pillar between the drawbell and the undercutting level were found the most critical zones in the design. When geological structures are present, they can be activated in the construction at an earlier stage and, therefore, could easily become critical in the resulting rock mass damage.
Keywords
Introduction
Drawbells in block caving are cavities connecting the undercut level with the production level, allowing the flow of rock material through drawpoints. These cavities and the rock mass surrounding them, as well as the drawpoints, need to remain stable for the lifespan for which they were designed (Brown, 2007).
Depending on the size of a mine footprint, which can vary from 30,000 m2 to more than 170,000 m2 (Flores et al., 2004), the number of drawbells drilled and blasted for a normal operation would typically range between 50 and over 300 drawbells. Large projects could include more than 1000 drawbells over its mine life, as Chuquicamata underground is currently contemplating (Rodríguez et al., 2020).
As mines get deeper, the induced stress approaches the inherent strength of the rock mass. Current block-caving projects show that the average depth of the block-caving projects is 1000 m below the surface (Bustos, 2022). At that depth, the induced stress can approach the UCS value for a variety of intact rock types, so the potential for failure is considerably greater than in shallower caving operations.
The stability performance of the production level can be affected by drawbells construction due to dynamic failure or a progressive failure, where cumulative damage during drawbell construction negatively impacts the overall stability. El Teniente Mine is the scenario of one of the largest underground block caving projects called New Mine Level (Landeros, 2022), with more than 350 drawbells planned in the first stage and thousands considered in the lifespan of the current plans. Understanding the historical databases of damage and seismicity at their shallower levels could help to improve the geotechnical analysis of the new mine sectors, and can also be applied to other operations.
This article presents the induced stress condition surrounding drawbells at a block caving operation. The analysis was undertaken using a mine-scale numerical model developed to analyse the El Teniente mine in Chile. The model creation has considered the results and improvements of previous studies, particularly the work undertaken by Brzovic and Villaescusa (2007), which resulted in the use of P32 of weak veins to define rock mass units within numerical models. This concept was calibrated using seismic data in the work of Brzovic et al. (2008). In Cuello et al. (2010) and Orrego et al. (2010), in-house mine site numerical models were calibrated for Reservas Norte and Pilar Norte mine sectors using stress measurements, seismic activity and most importantly, damage location. The same concept was used and expanded by Pardo et al. (2012) and Pardo (2015), with a detailed numerical model for Esmeralda Mine, and the historical damage of that sector was used to build strength envelopes for several rock types. Cabezas et al. (2014) explained a novel technique to include the hydraulic fractures in a large numerical model by changing the shear module in a particular direction and transforming the material into anisotropic. Most of this previous work was summarised in a large global numerical model developed and described by Bustos and Balboa (2014) and later updated in MVA-Geoconsulta (2018), which also included large geological features used in the calibration process. Inside the latest described numerical model, three large sub-models were included for detailed analysis of the stress redistribution at different sectors and mining steps.
The methodology for analysing the stress around the drawbell consisted of four stages. First, each sub-model result at a large scale was analysed, allowing an understanding of the nature of the seismic response. That analysis was followed by drawbell scale modelling, focused on the zones more affected by the induced stress. The third stage was the structural analysis, including the calibration of infill properties. Finally, two mine sectors were analysed in detail using plastic properties from previous numerical modelling calibrations. This approach allowed the understanding of various aspects of the stress re-distribution surrounding the drawbells at each stage.
Numerical model description
Figure 1 shows the plan view of the area included in the large mine-scale FEM numerical model built in Abaqus, 36 km Easting and 20 km Northing, with 8 km depth. Ten million tetrahedral elements were used, with four nodes each, resulting in approximately 6 million degrees of freedom. This mine scale model was first developed by Bustos and Balboa (2014) in conjunction with MVA Geoconsulta, and the model was updated in 2017 (MVA-Geoconsulta, 2018). The mine-scale model calibration included in situ stress measurements, observation of damage, monitored seismicity and laboratory-measured properties.
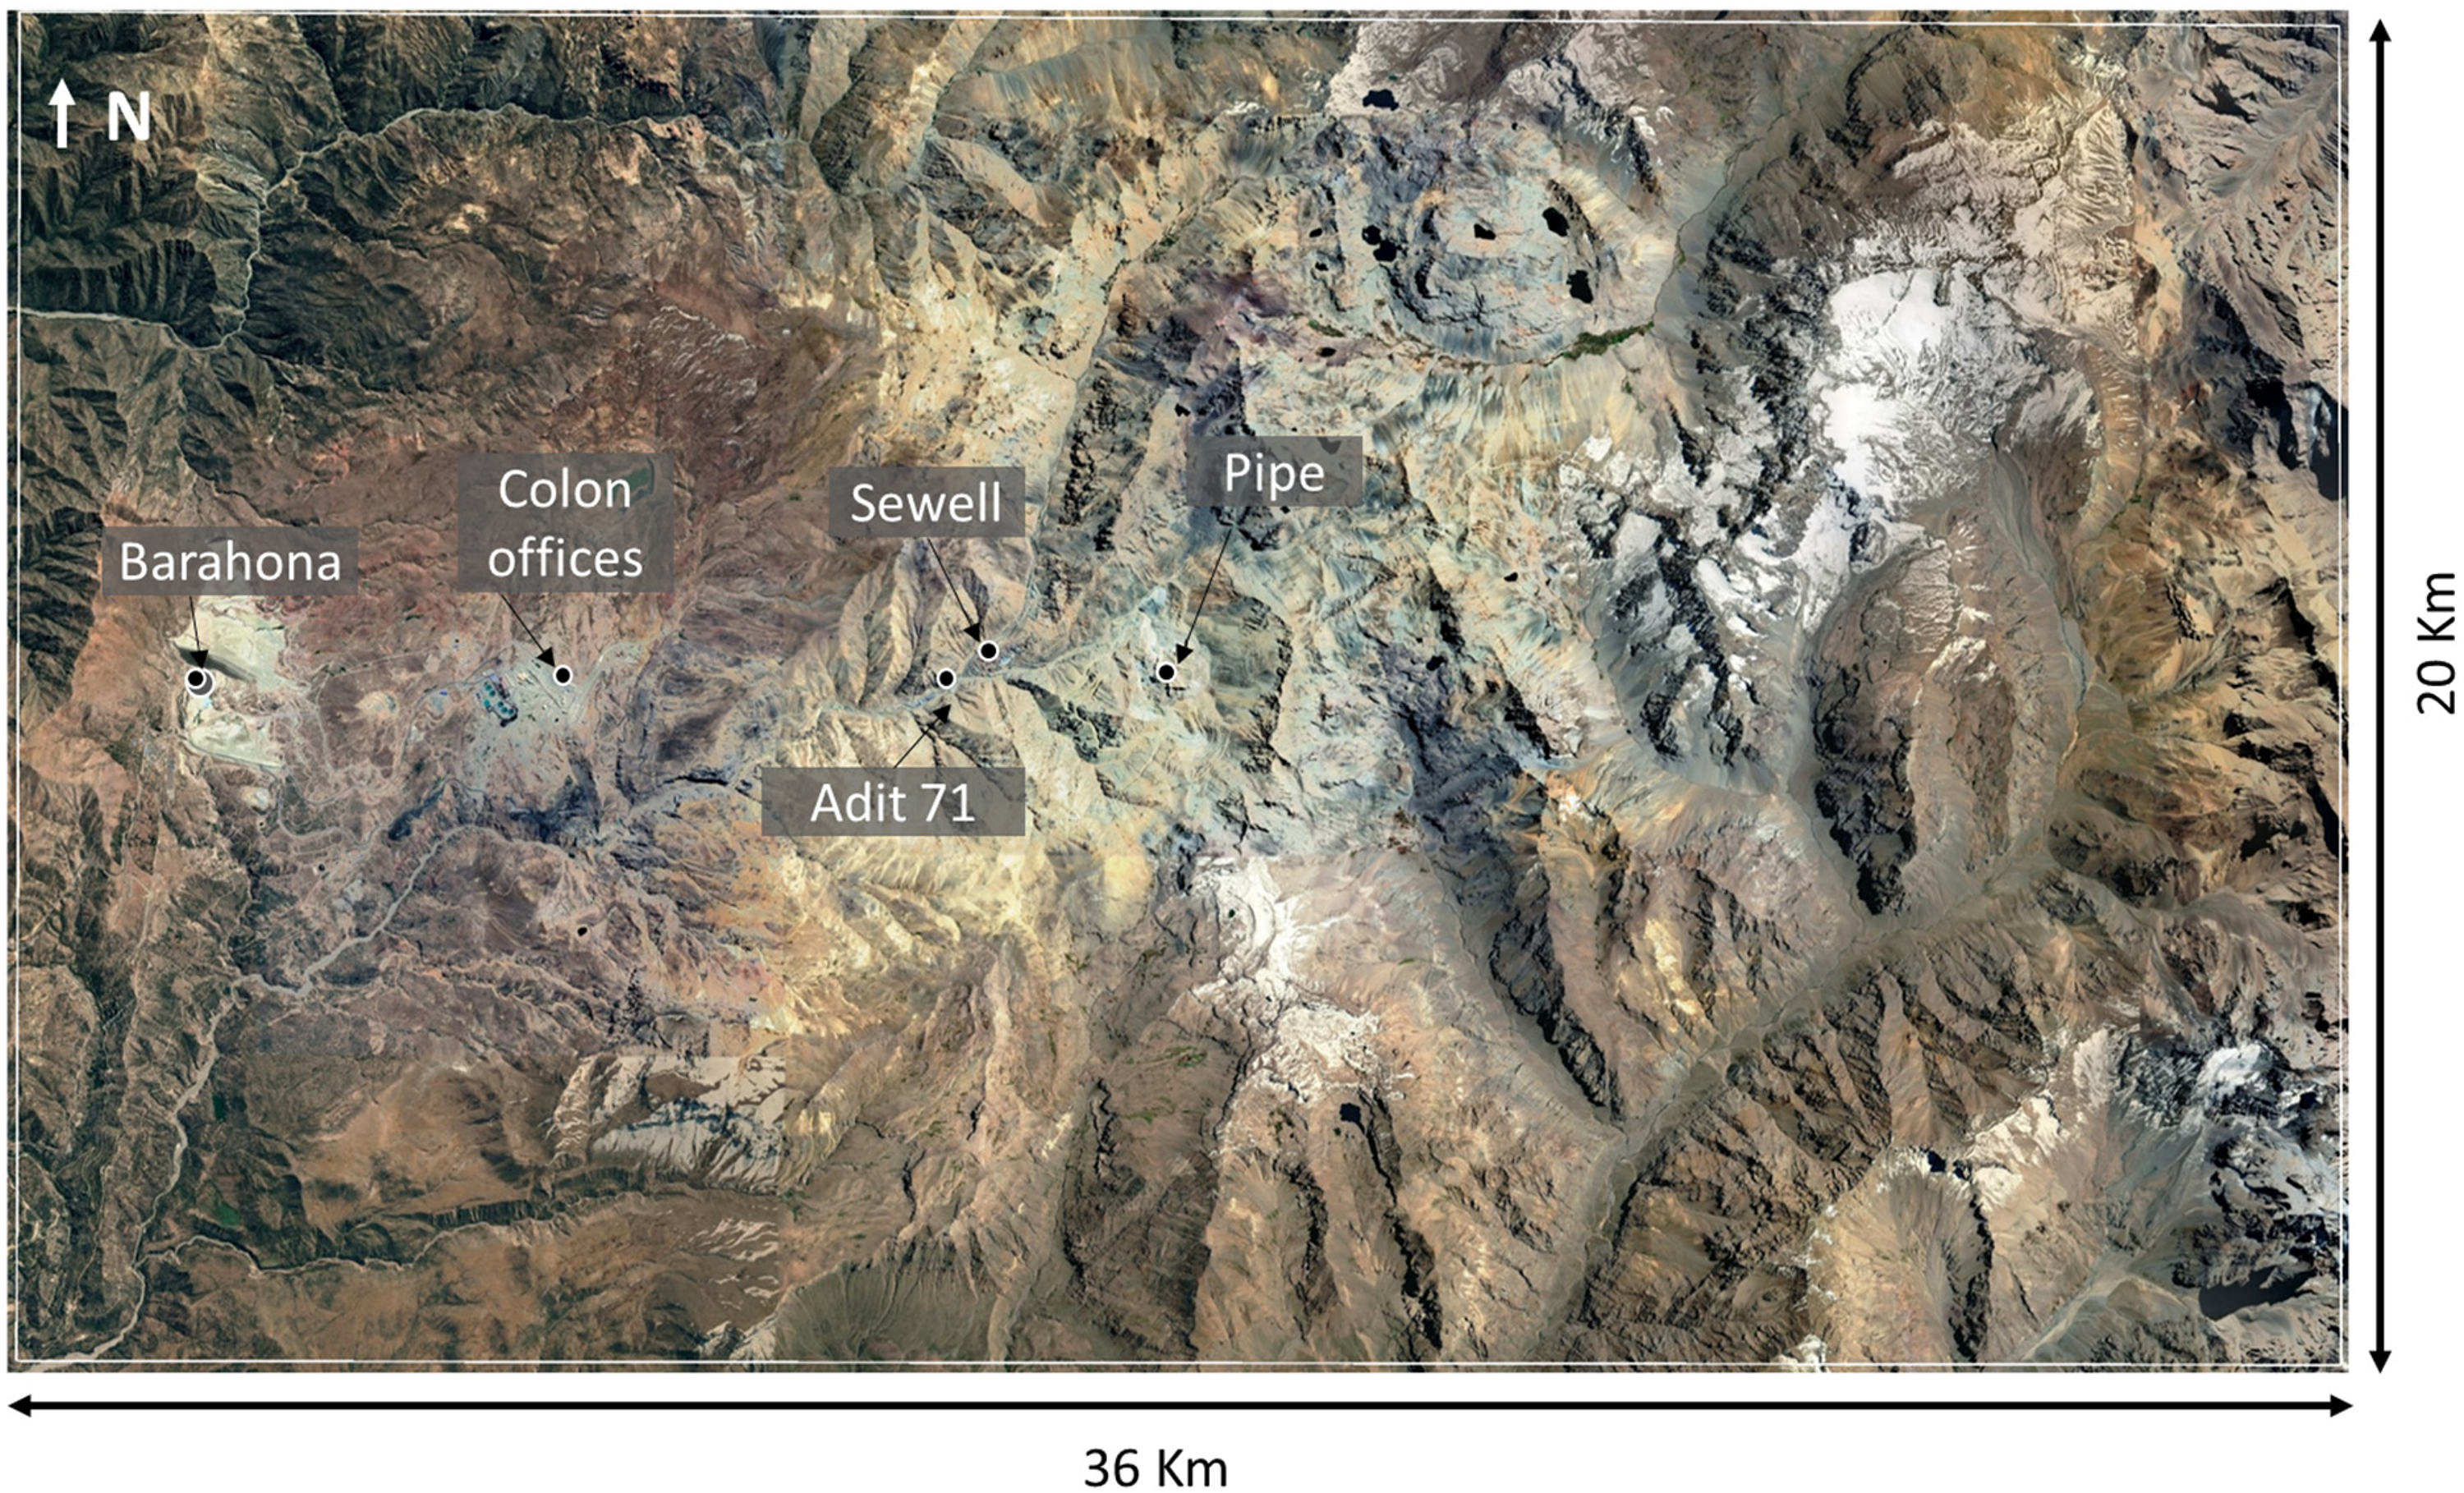
Mine scale model dimensions, plan view.
Three pre-defined volumetric zones called Submodels were created inside the large mine model for the mine sectors Pacifico Superior, Reservas Norte and Esmeralda (see Figure 2). The size of each submodel was large enough to allow geometrical changes that do not significantly modify the stress condition in the pre-defined volume borders. For each submodel, a series of geometry steps were considered to represent the conditions around a specific drawbell.
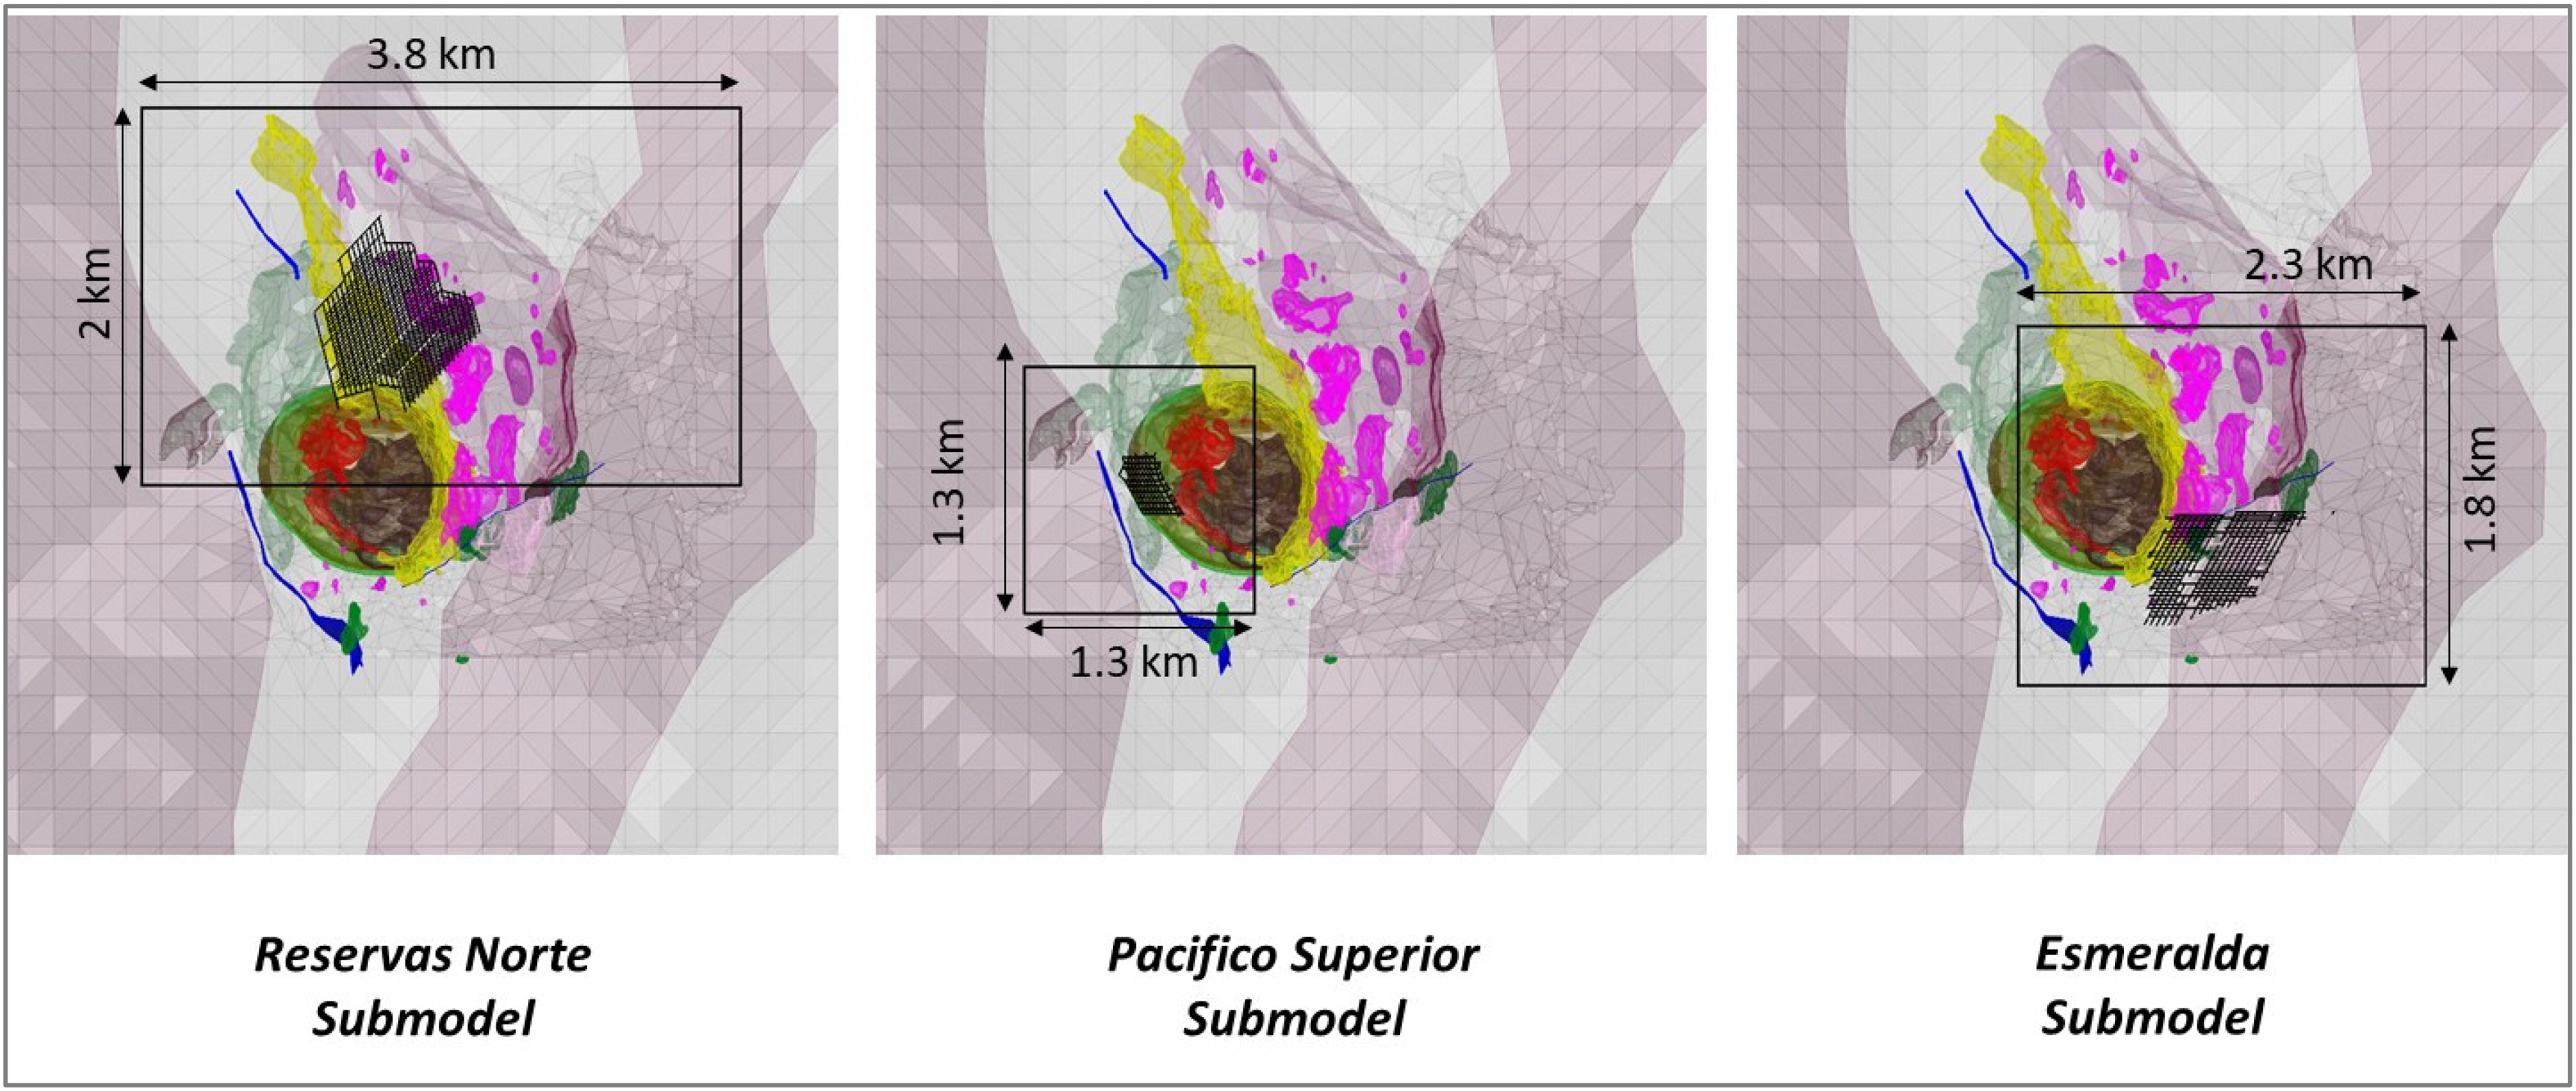
Location and sizes of the three submodels used.
The geological model used in the mine scale model has fourteen different lithologies, detailed in Table 1, supplied by the Geology Supertintendency of El Teniente mine (2014–2017). The largest and oldest lithology corresponds to El Teniente Mafic Intrusive Complex (CMET), previously referred Andesite, which acts as the host rock (Skewes et al., 2002; Brzovic, 2010). The other rock types are Felsic Intrusions and Breccias (Brzovic, 2010; Skewes et al., 2002). Figure 3 shows the lithology units incorporated in the mine-scale numerical model. The CMET rock type was divided into two rock types, CMET-Fw and CMET-Hw, as interpreted by Brzovic (2010) and Millan (2014). The CMET-Fw was the most affected area by a late PH hydrothermal alteration, which increased the intensity of weak vein infill frequency. The CMET-Hw corresponds to the affected by LH hydrothermal alteration resulting in a lower frequency of weak veins (Brzovic, 2010).
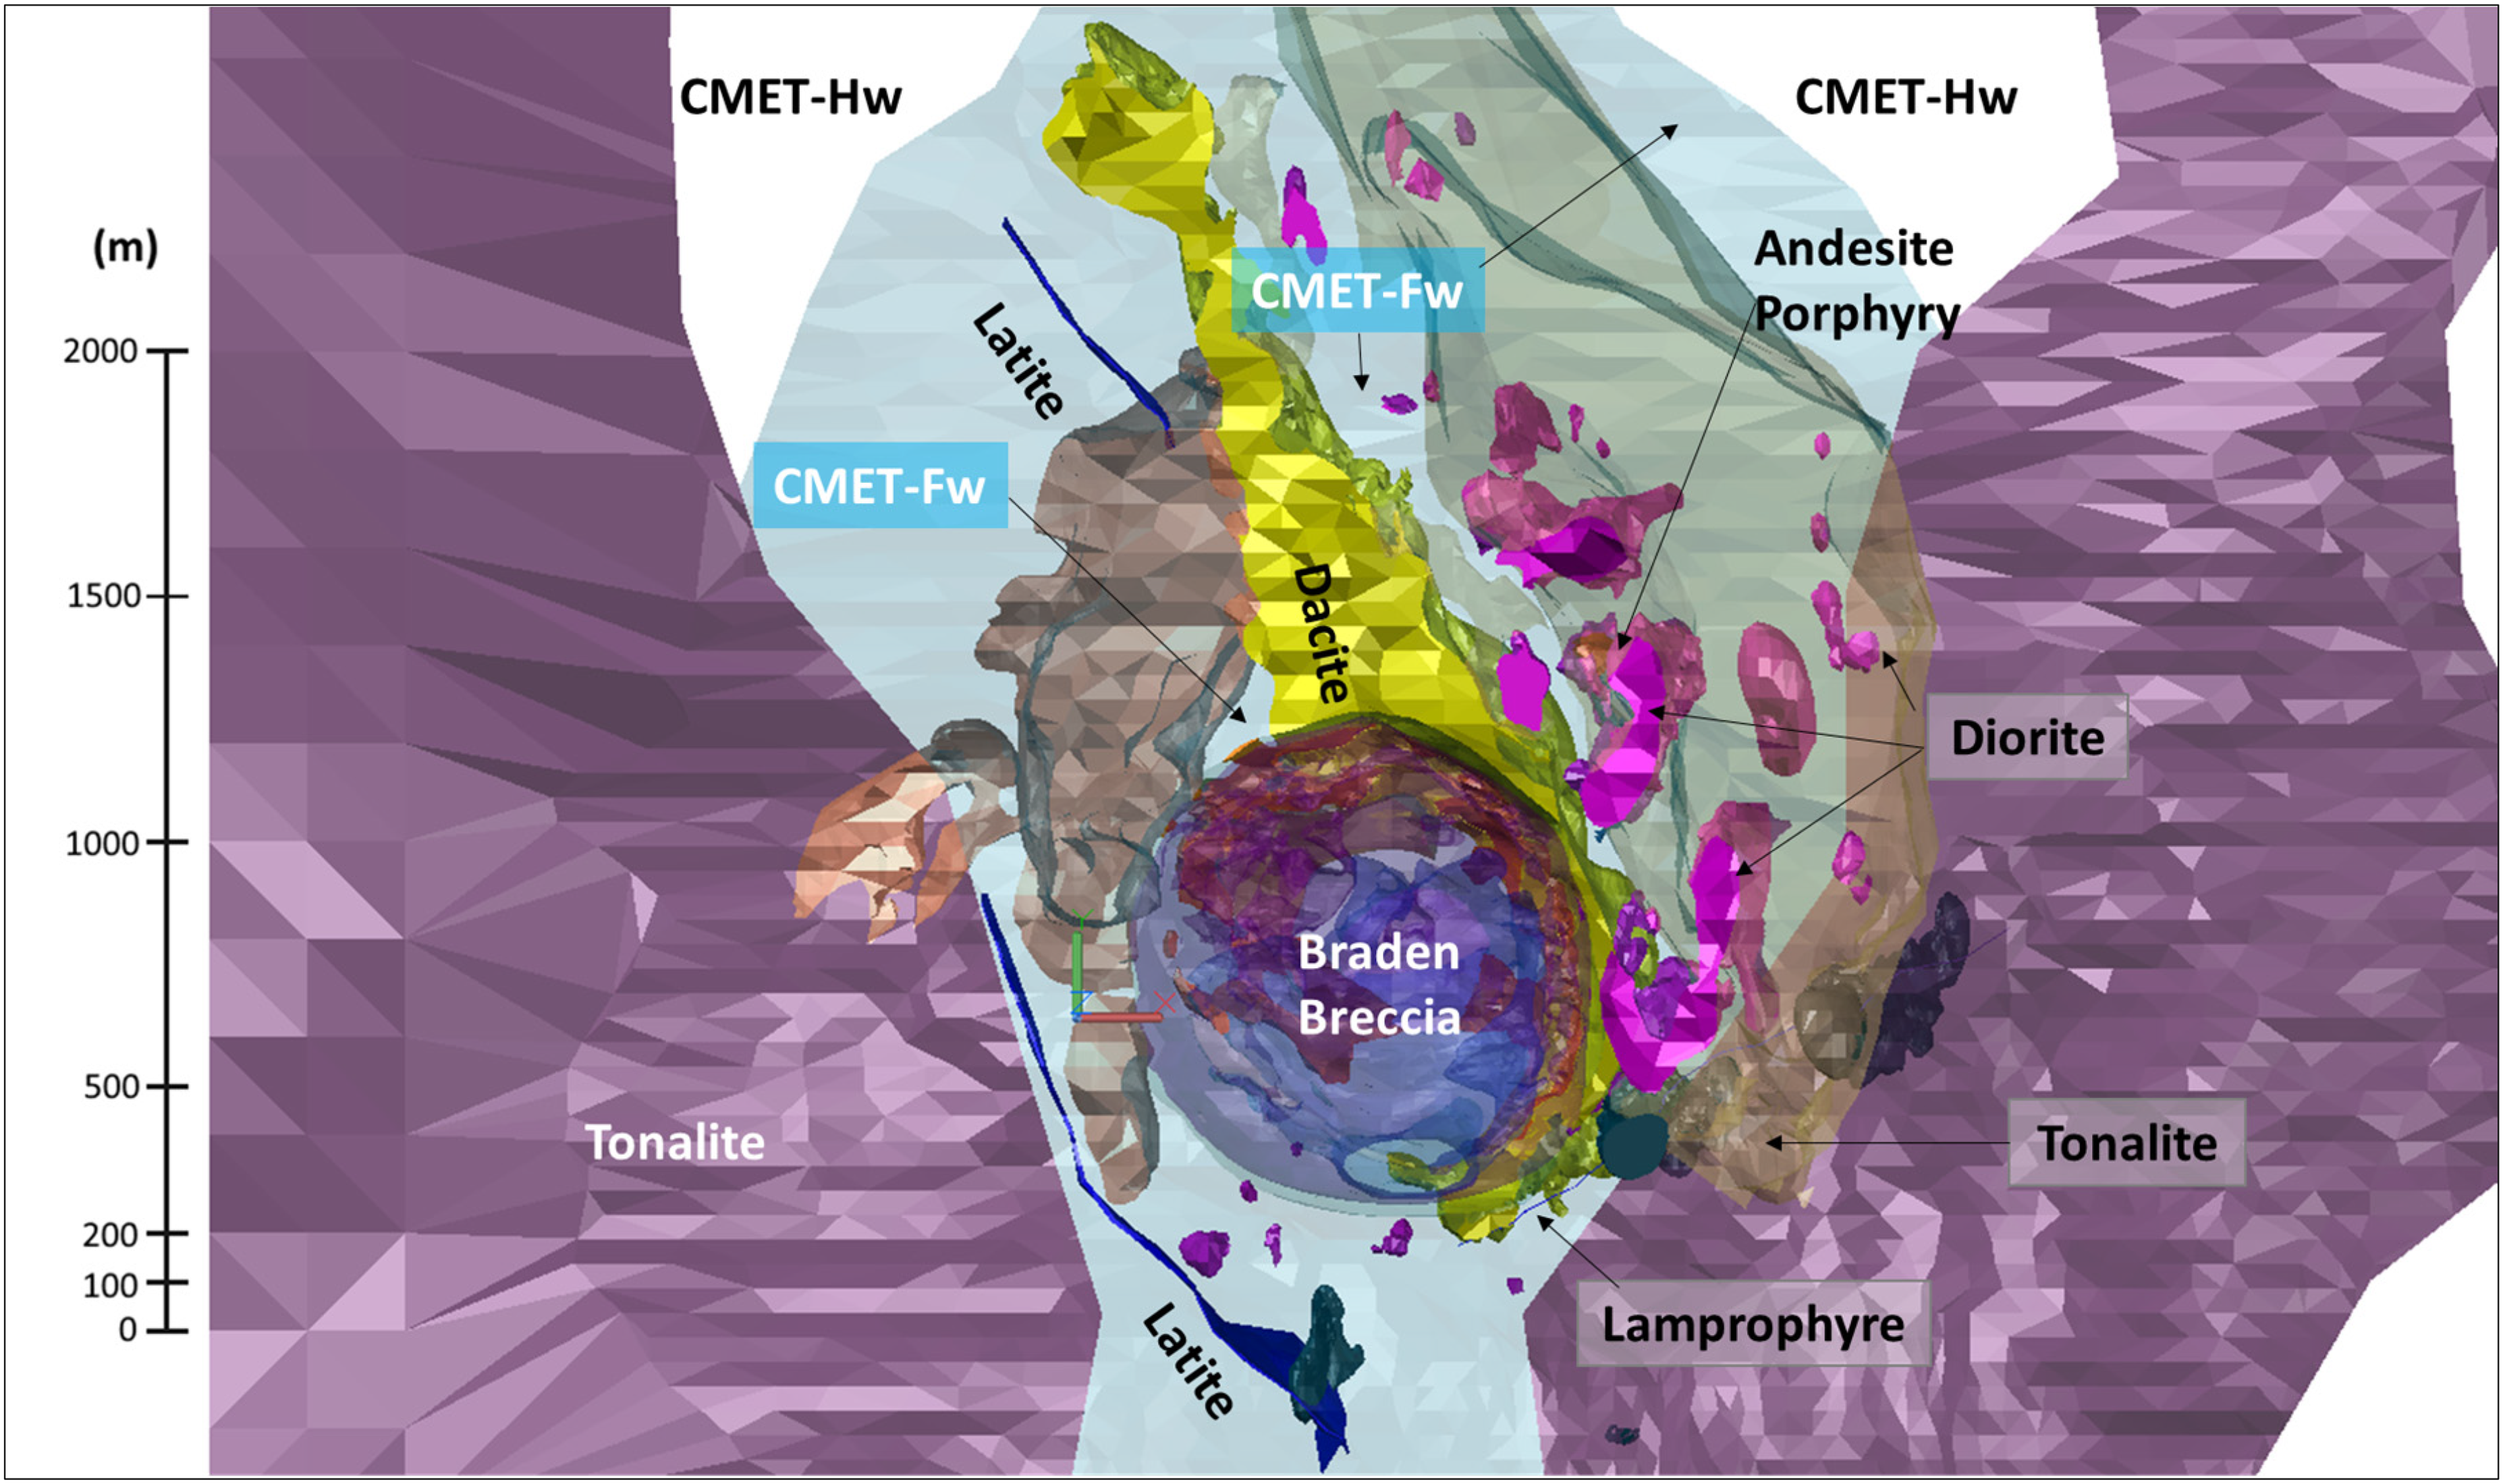
Lithology modelled modified from MVA-Geoconsulta (2018).
Rock units and properties used in the numerical model.
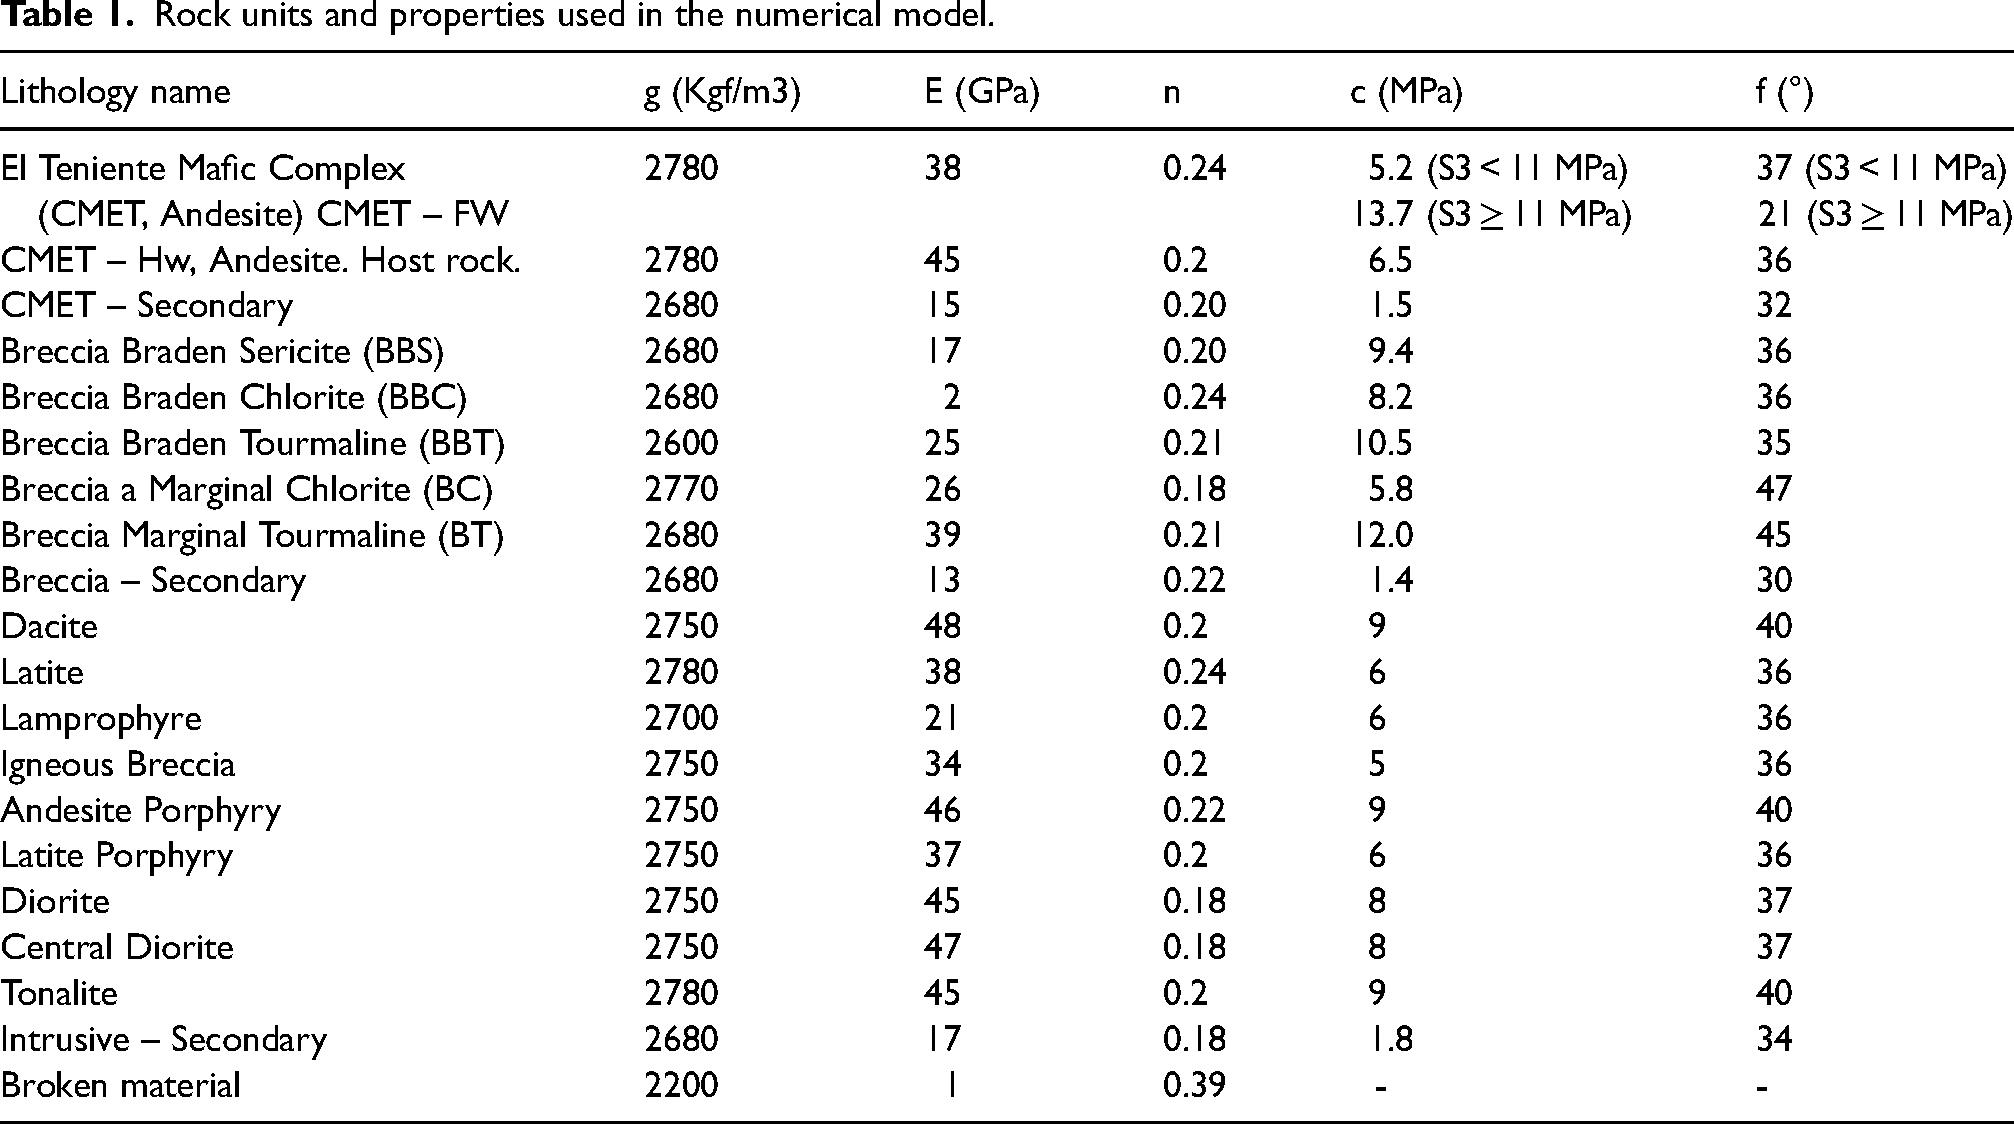
The properties shown in Table 1 resulted from the calibration process undertaken by the geotechnical and geology teams at the El Teniente Mine for many years. Nevertheless, this is considered an ongoing process, which that takes into account the latest field observations. This process has been particularly detailed for CMET-Fw, which has encountered various failure processes in the past (Cuello et al., 2010; Orrego et al., 2010; Pardo et al., 2012). The calibration was done using the results of elastic models to build a Mohr–Coulomb plastic strength envelope (Bustos, 2022; Pardo and Rojas, 2016; Rojas et al., 2016).
The ore body has also been divided by supergene alteration zones. The zones defined the secondary ore (100–600 m below the surface) and the primary ore, which occurs without alteration, as shown in Figure 4 (Cuadra, 1986). The model also includes a talus material (see Figure 4). The talus incorporation was relevant for calibration purposes, particularly where service tunnels have experienced large seismic events during construction (Landeros and Rojas, 2022).
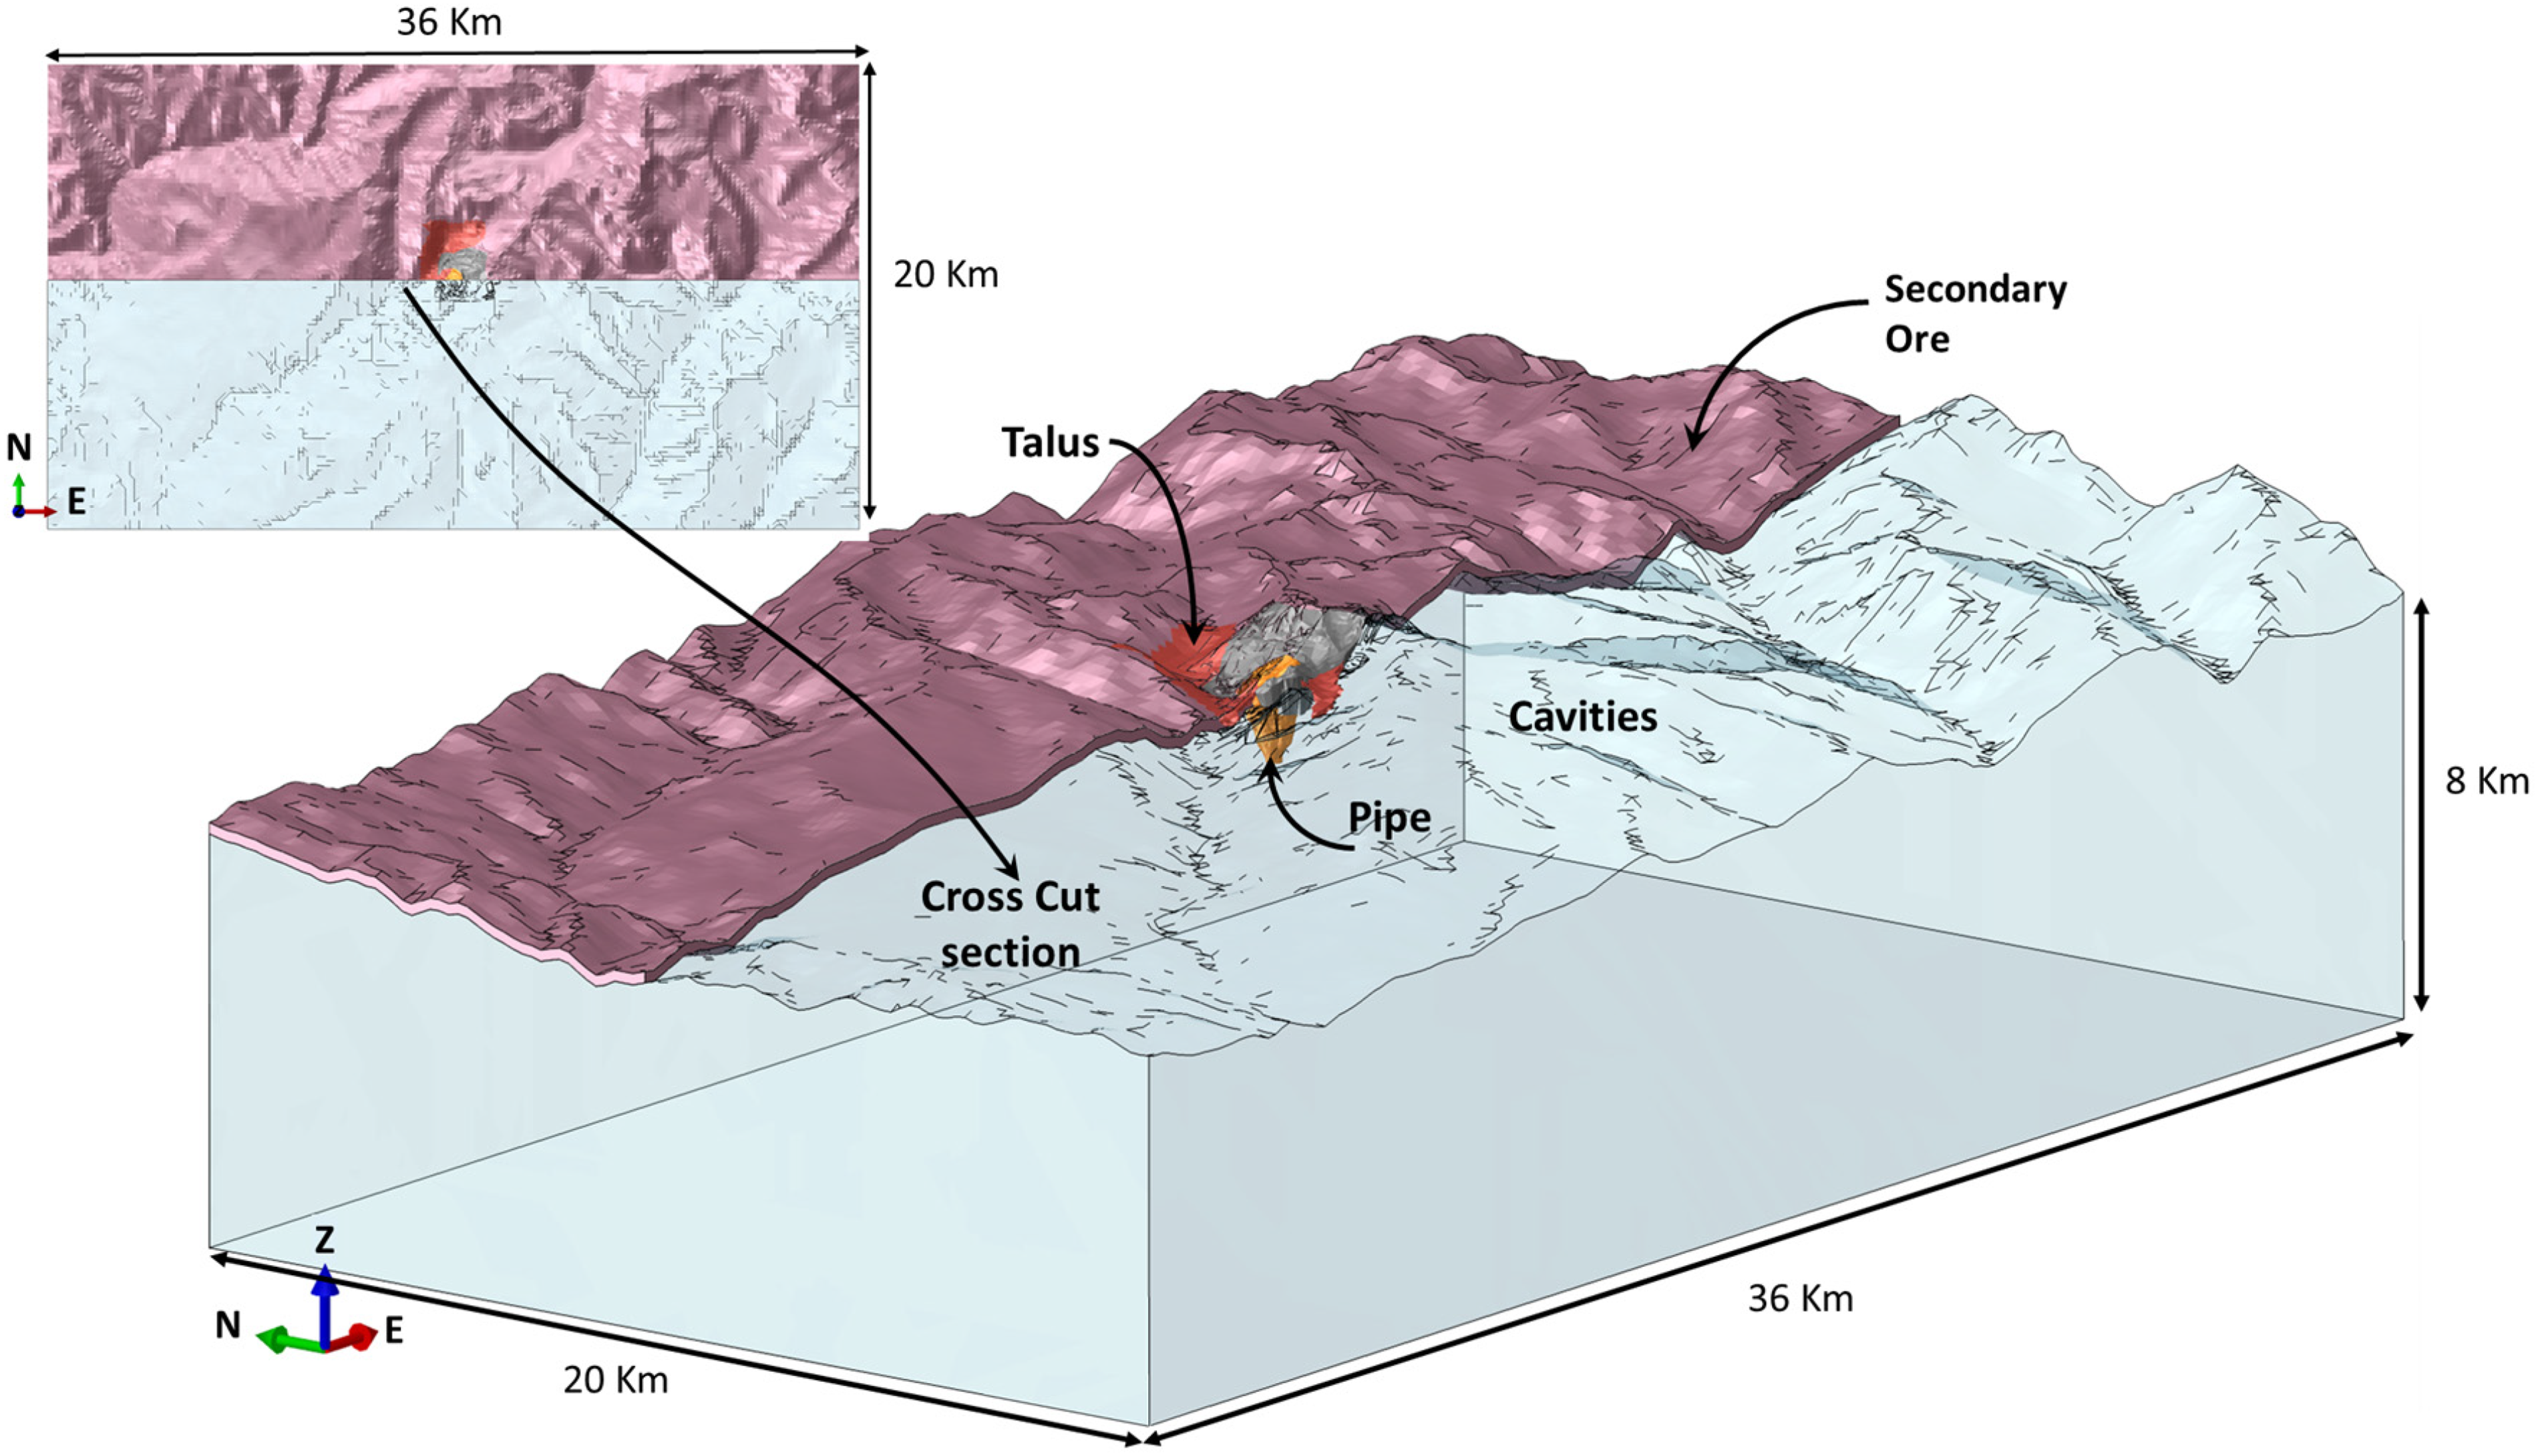
Isometric view of modelled Talus, cavities and Braden breccia. Cross-section of secondary ore across the centre of the plane view. Modified from MVA-Geoconsulta (2018).
Calibration process
The stress field of the El Teniente mine was described after a reconciliation of a large stress measurement database with information from other sources (Windsor et al., 2006). The reconciliation took into account the El Teniente Shear Zone (ETSZ), described by Cladouhos (1994), in which the major principal stress within the shear zone is sub-horizontal, oriented NW-SW (azimuth 150°). Rock-type properties and the application of the forces before equilibrium are the main inputs to reconcile results with the stress measurements. The measured stresses are also influenced by factors that could be included in the models, being the most relevant: the structural geometry, topography, interpretation of geological history, historical rock mass damage, stiffness differences across and within geotechnical domains, and active tectonic loading (Beck et al., 2012). In this model, the tectonic force was applied using lateral pressure coefficients, considering two different values for N-S and E-W directions. The distribution is calculated considering a reference plane, generated as an average surface and then raised vertically to include the erosion effect at some level and tried to replicate the remaining horizontal stresses measured from pre-mining conditions. Also, the load application intended to simulate the secondary formation and the Pipe intrusion. This process included initiating them with primary rock-type properties, followed by the application of tectonic loading pressure (t = 0) and then gravity forces (t = 1). After that (t = 2, pre-mining step), the secondary, talus and Pipe rock-type properties were decreased, and a new equilibrium was reached. The rest of the steps were associated with different cavity shapes and mining geometries. This process improved the resulting stress redistribution in the surrounding areas of those rock types, with a better match of geotechnical conditions and stress measurements, as shown in Figure 5.
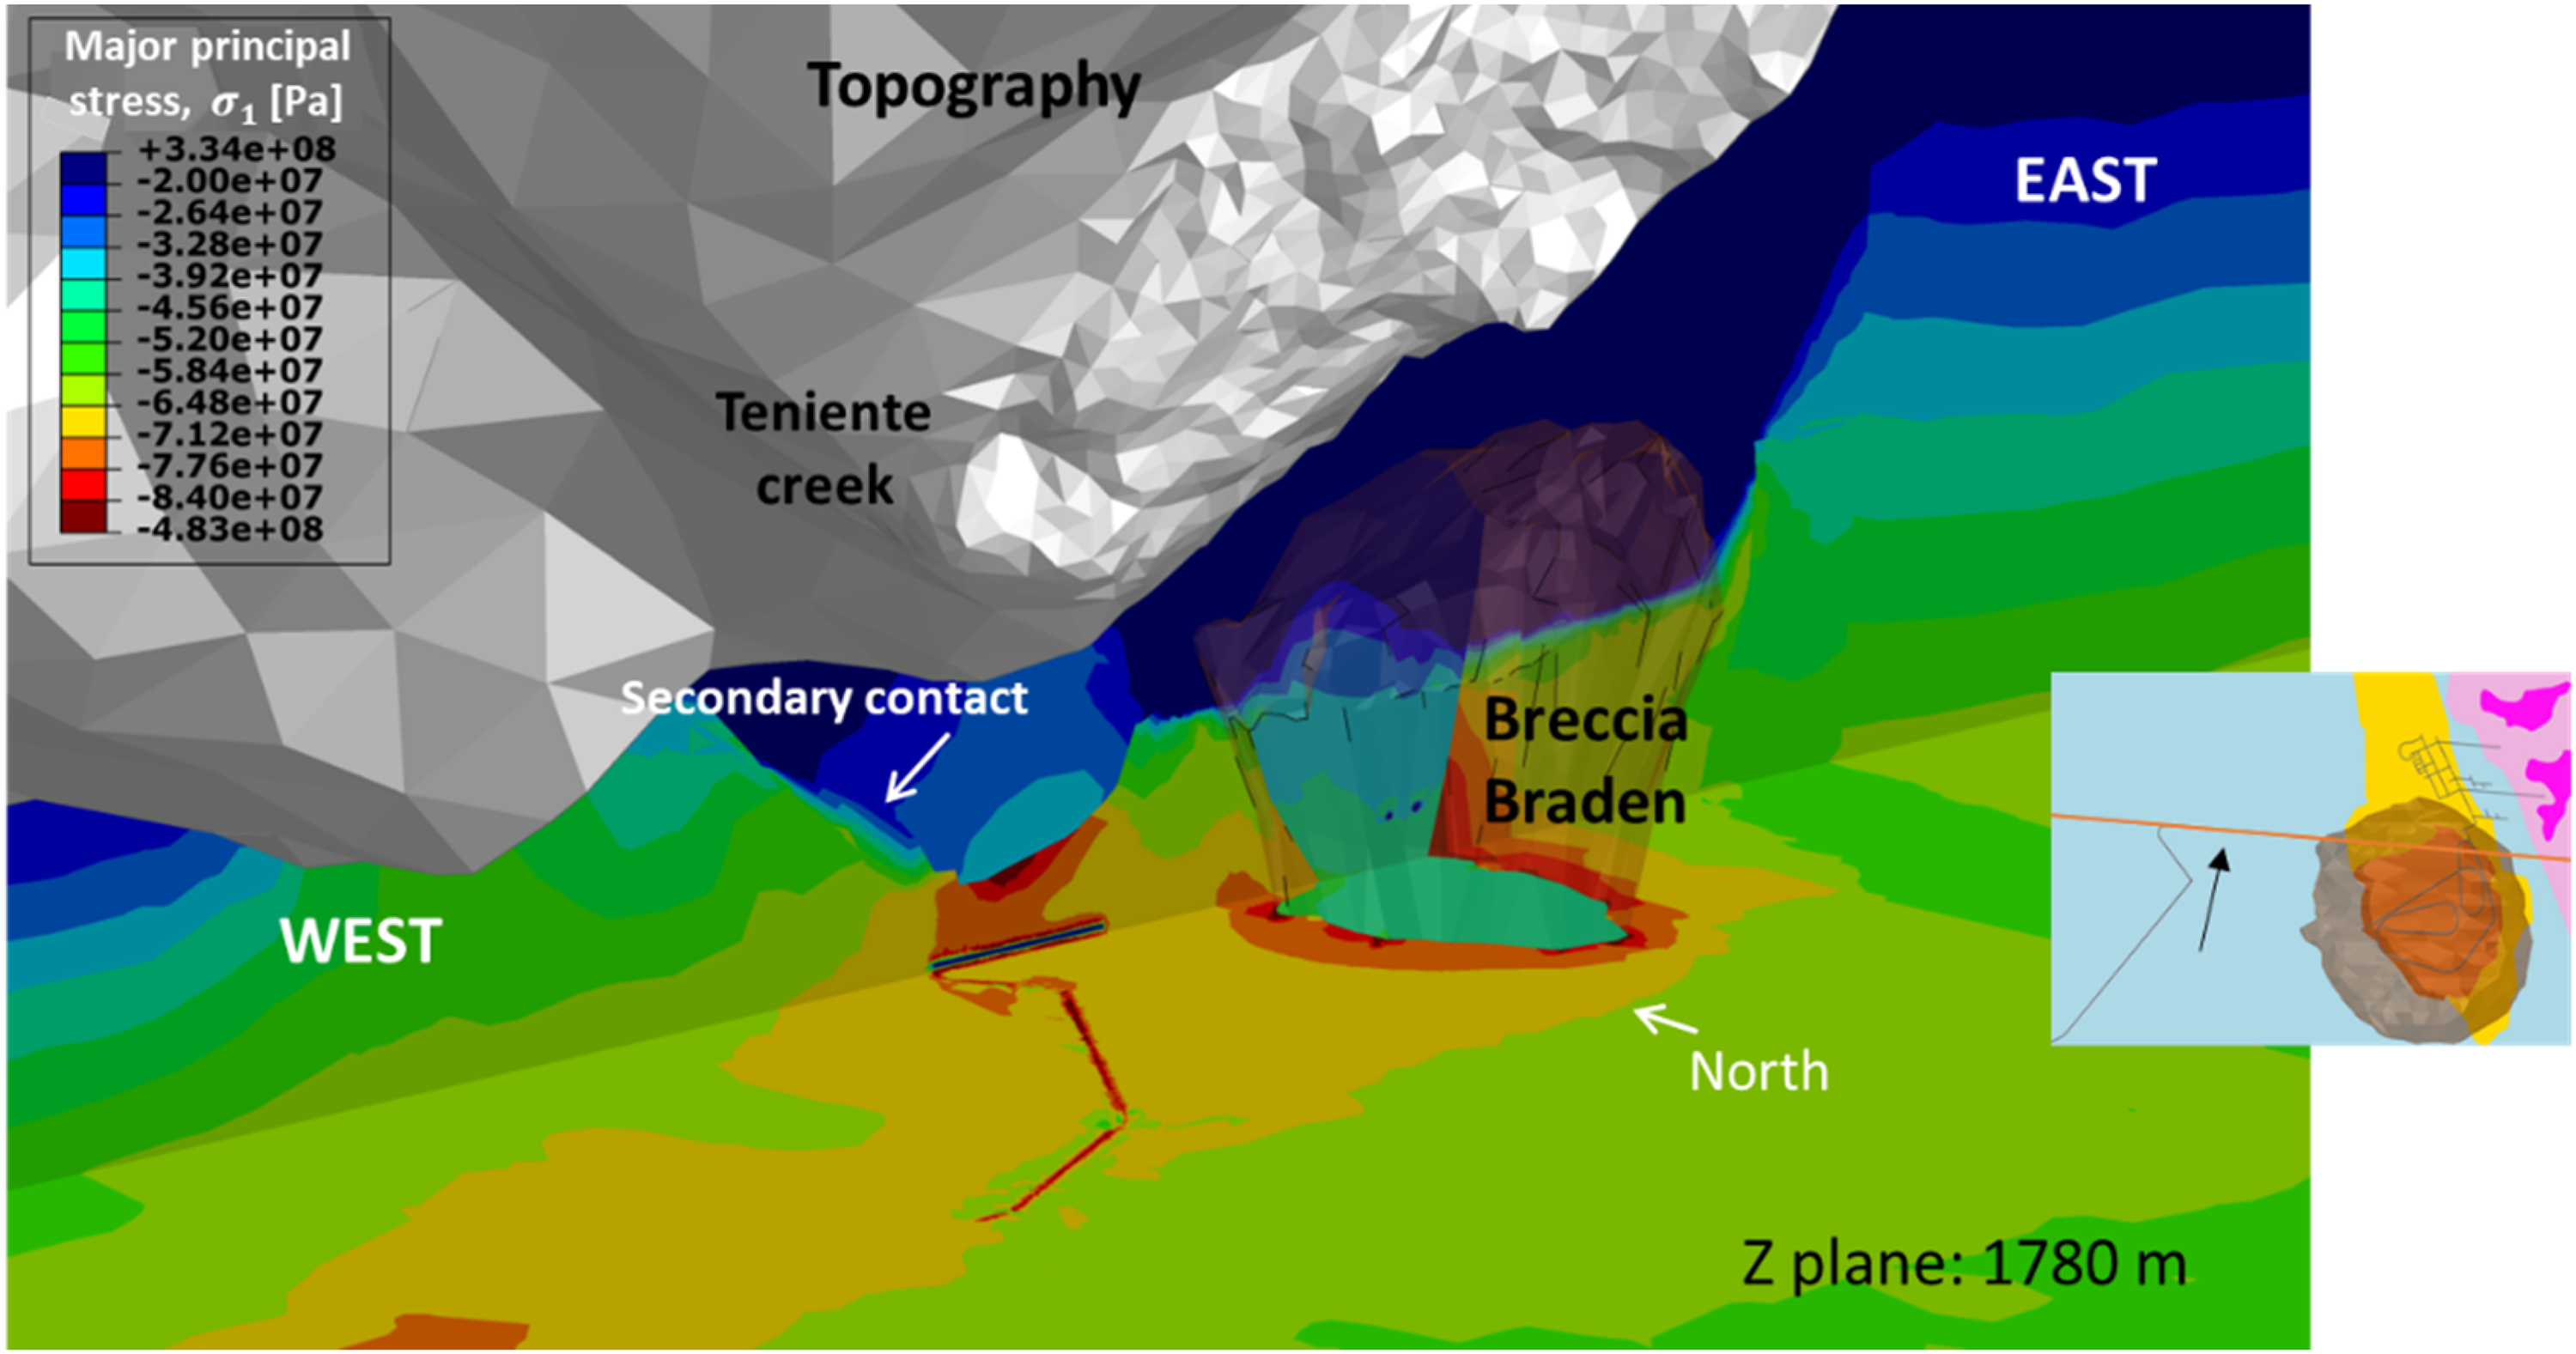
Stress redistribution from Breccia Braden intrusion and secondary ore due to mechanically modelled steps, modified from Rojas et al. (2015).
A total of 180 stress measurements were assigned to six model steps. Each measurement represented the step's stress condition when it was undertaken ± 2 years of timing compared to the modelled geometry. In addition, any feature located within 160 m from a cavity is considered part of the pre-mining stress conditions.
Figure 6 summarises the stress comparison, showing that 69% of the 105 points have σ1 and σ2 errors less than 10 MPa. Additionally, 62% of σ3 have an error of fewer than 5 MPa. It also shows the variability in stress orientation when comparing measured and modelled values.
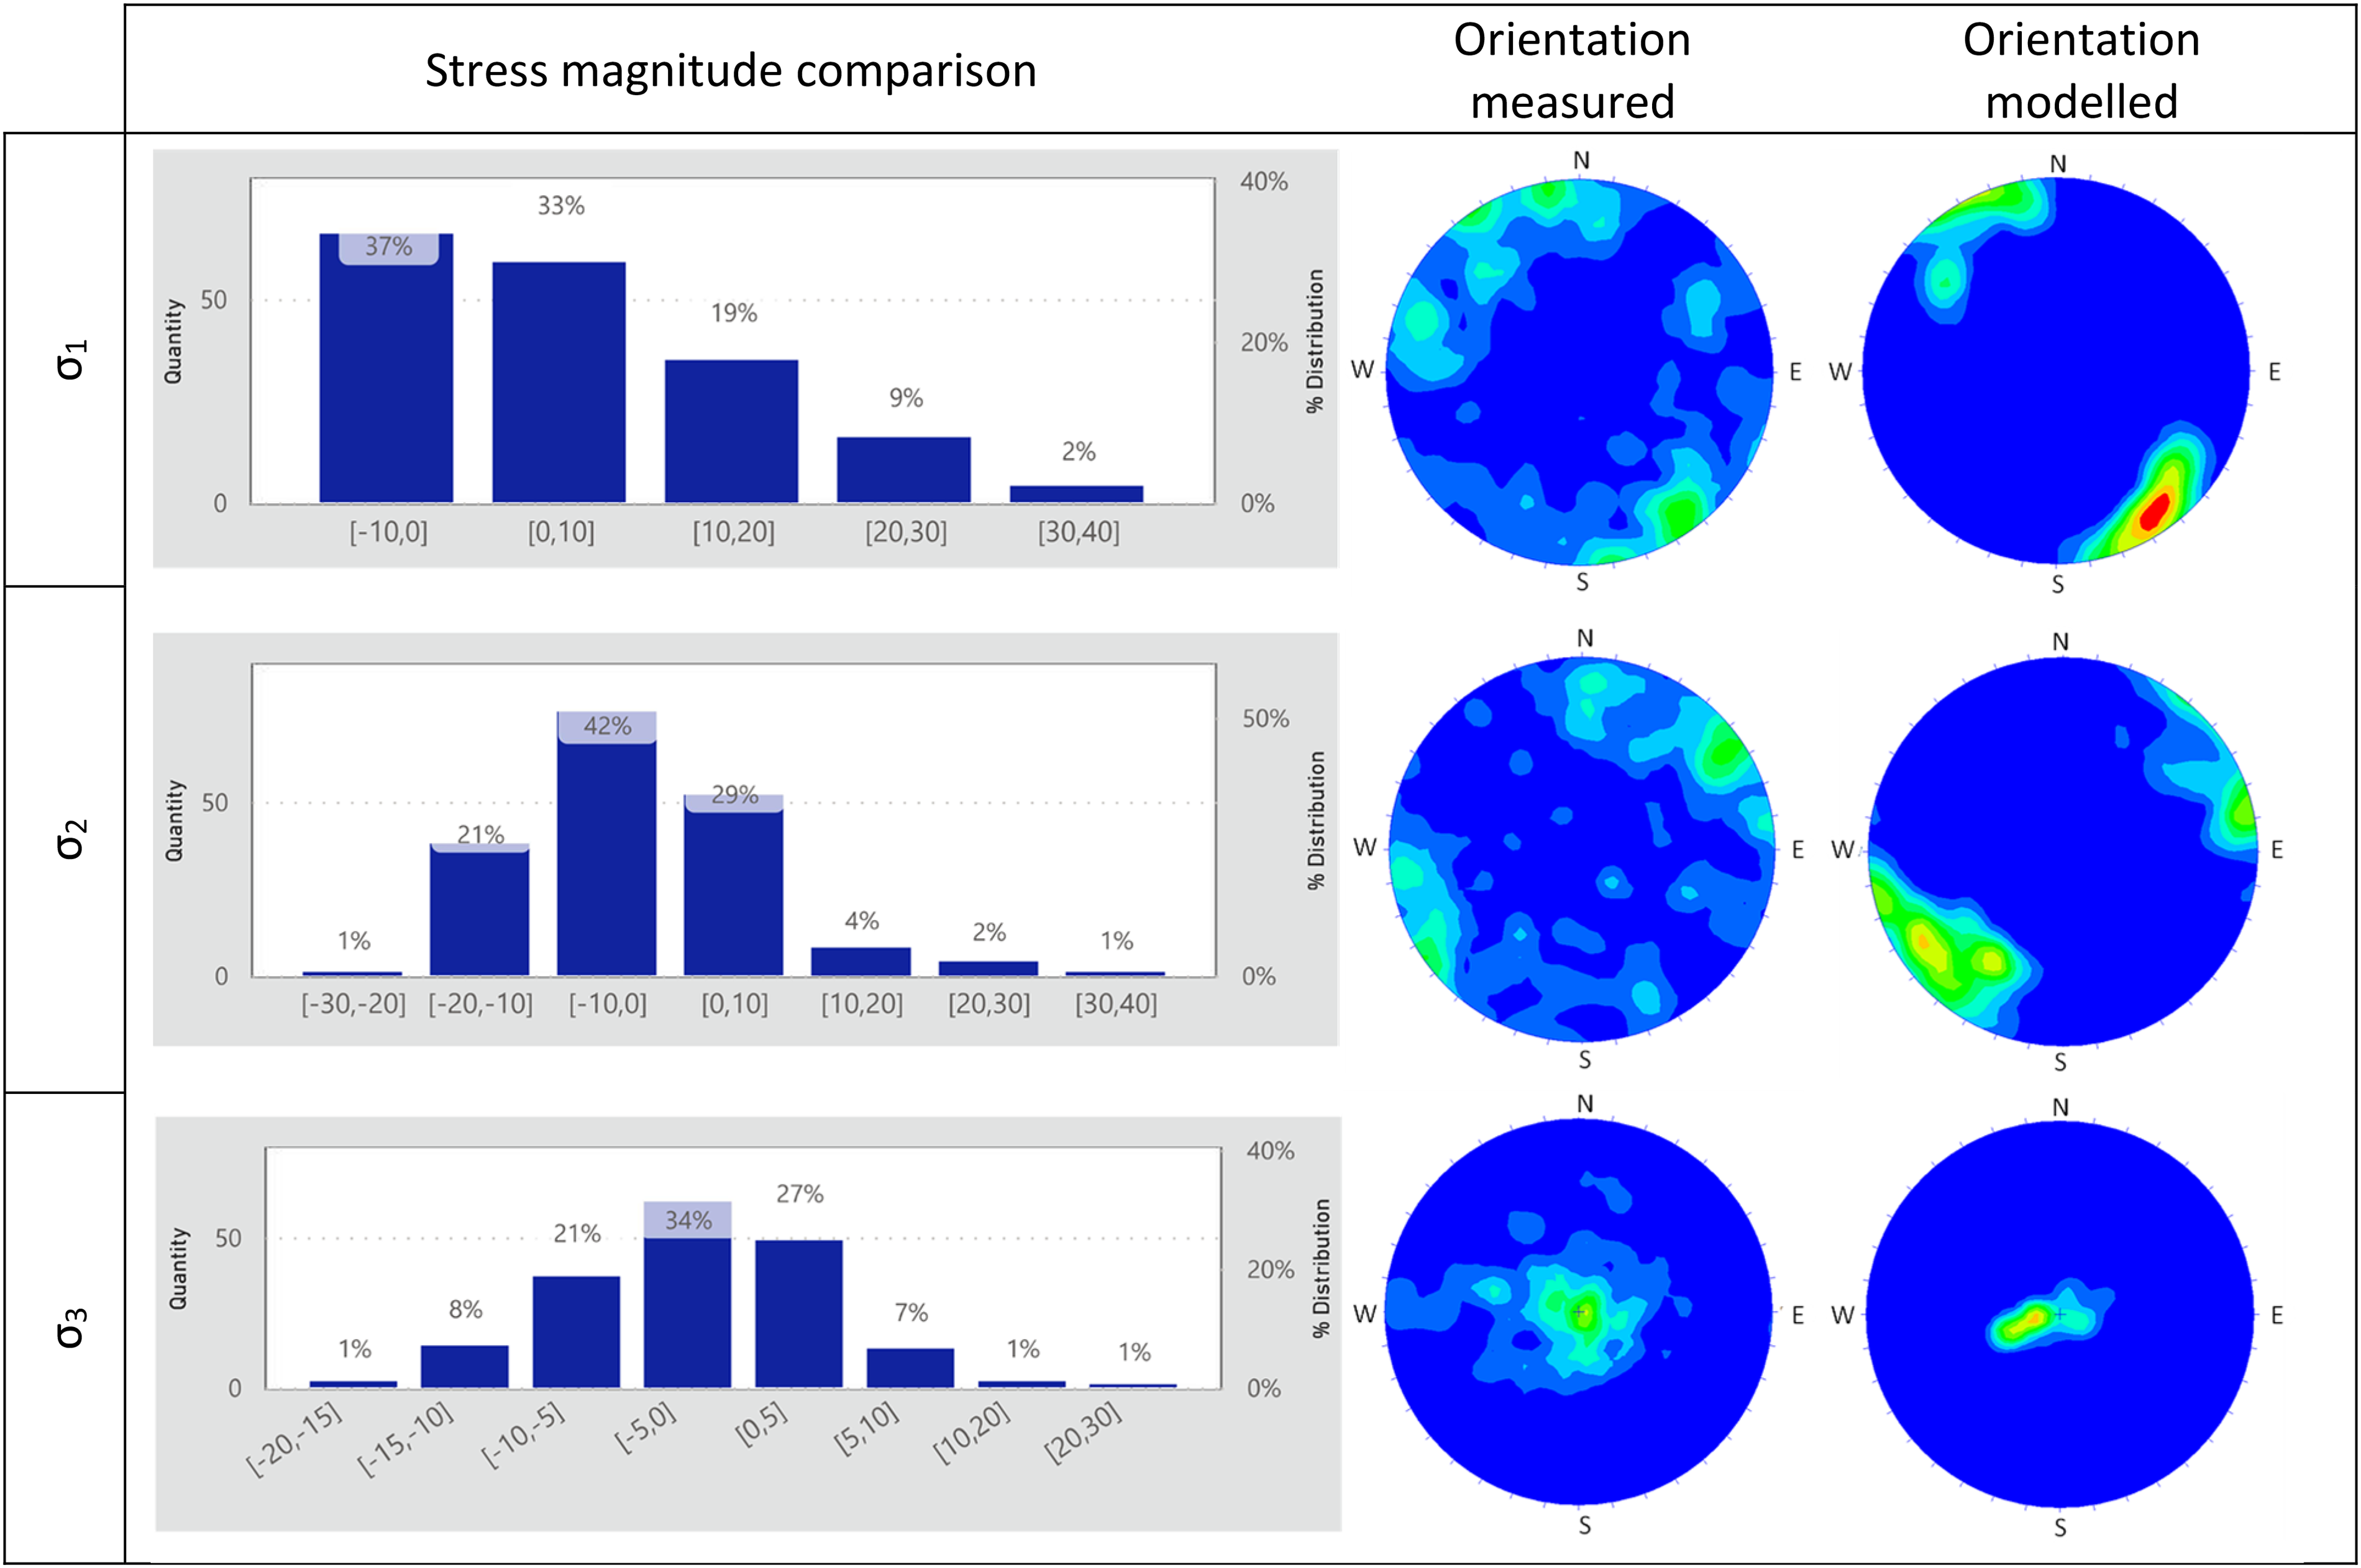
Distribution of error for measured versus modelled stress magnitudes at CMET lithology.
It is observed that values showing more differences are located closer to geological features not represented accurately in the model. Also, some of the measurements could be taken under induced stress conditions that have not been exactly represented in the model.
As a comparison, Figure 7 shows the in-situ stress measurements undertaken by the WA School of Mines using the acoustic emission (AE) methodology using oriented core (Windsor et al., 2006). The figure shows the magnitude and orientation of the measured and calculated principal stresses with depth. The pre-mining loading of the model consistently follows the information given by the AE results. In terms of absolute values, the difference between the modelled and the WASM AE magnitudes is less than 10 MPa.
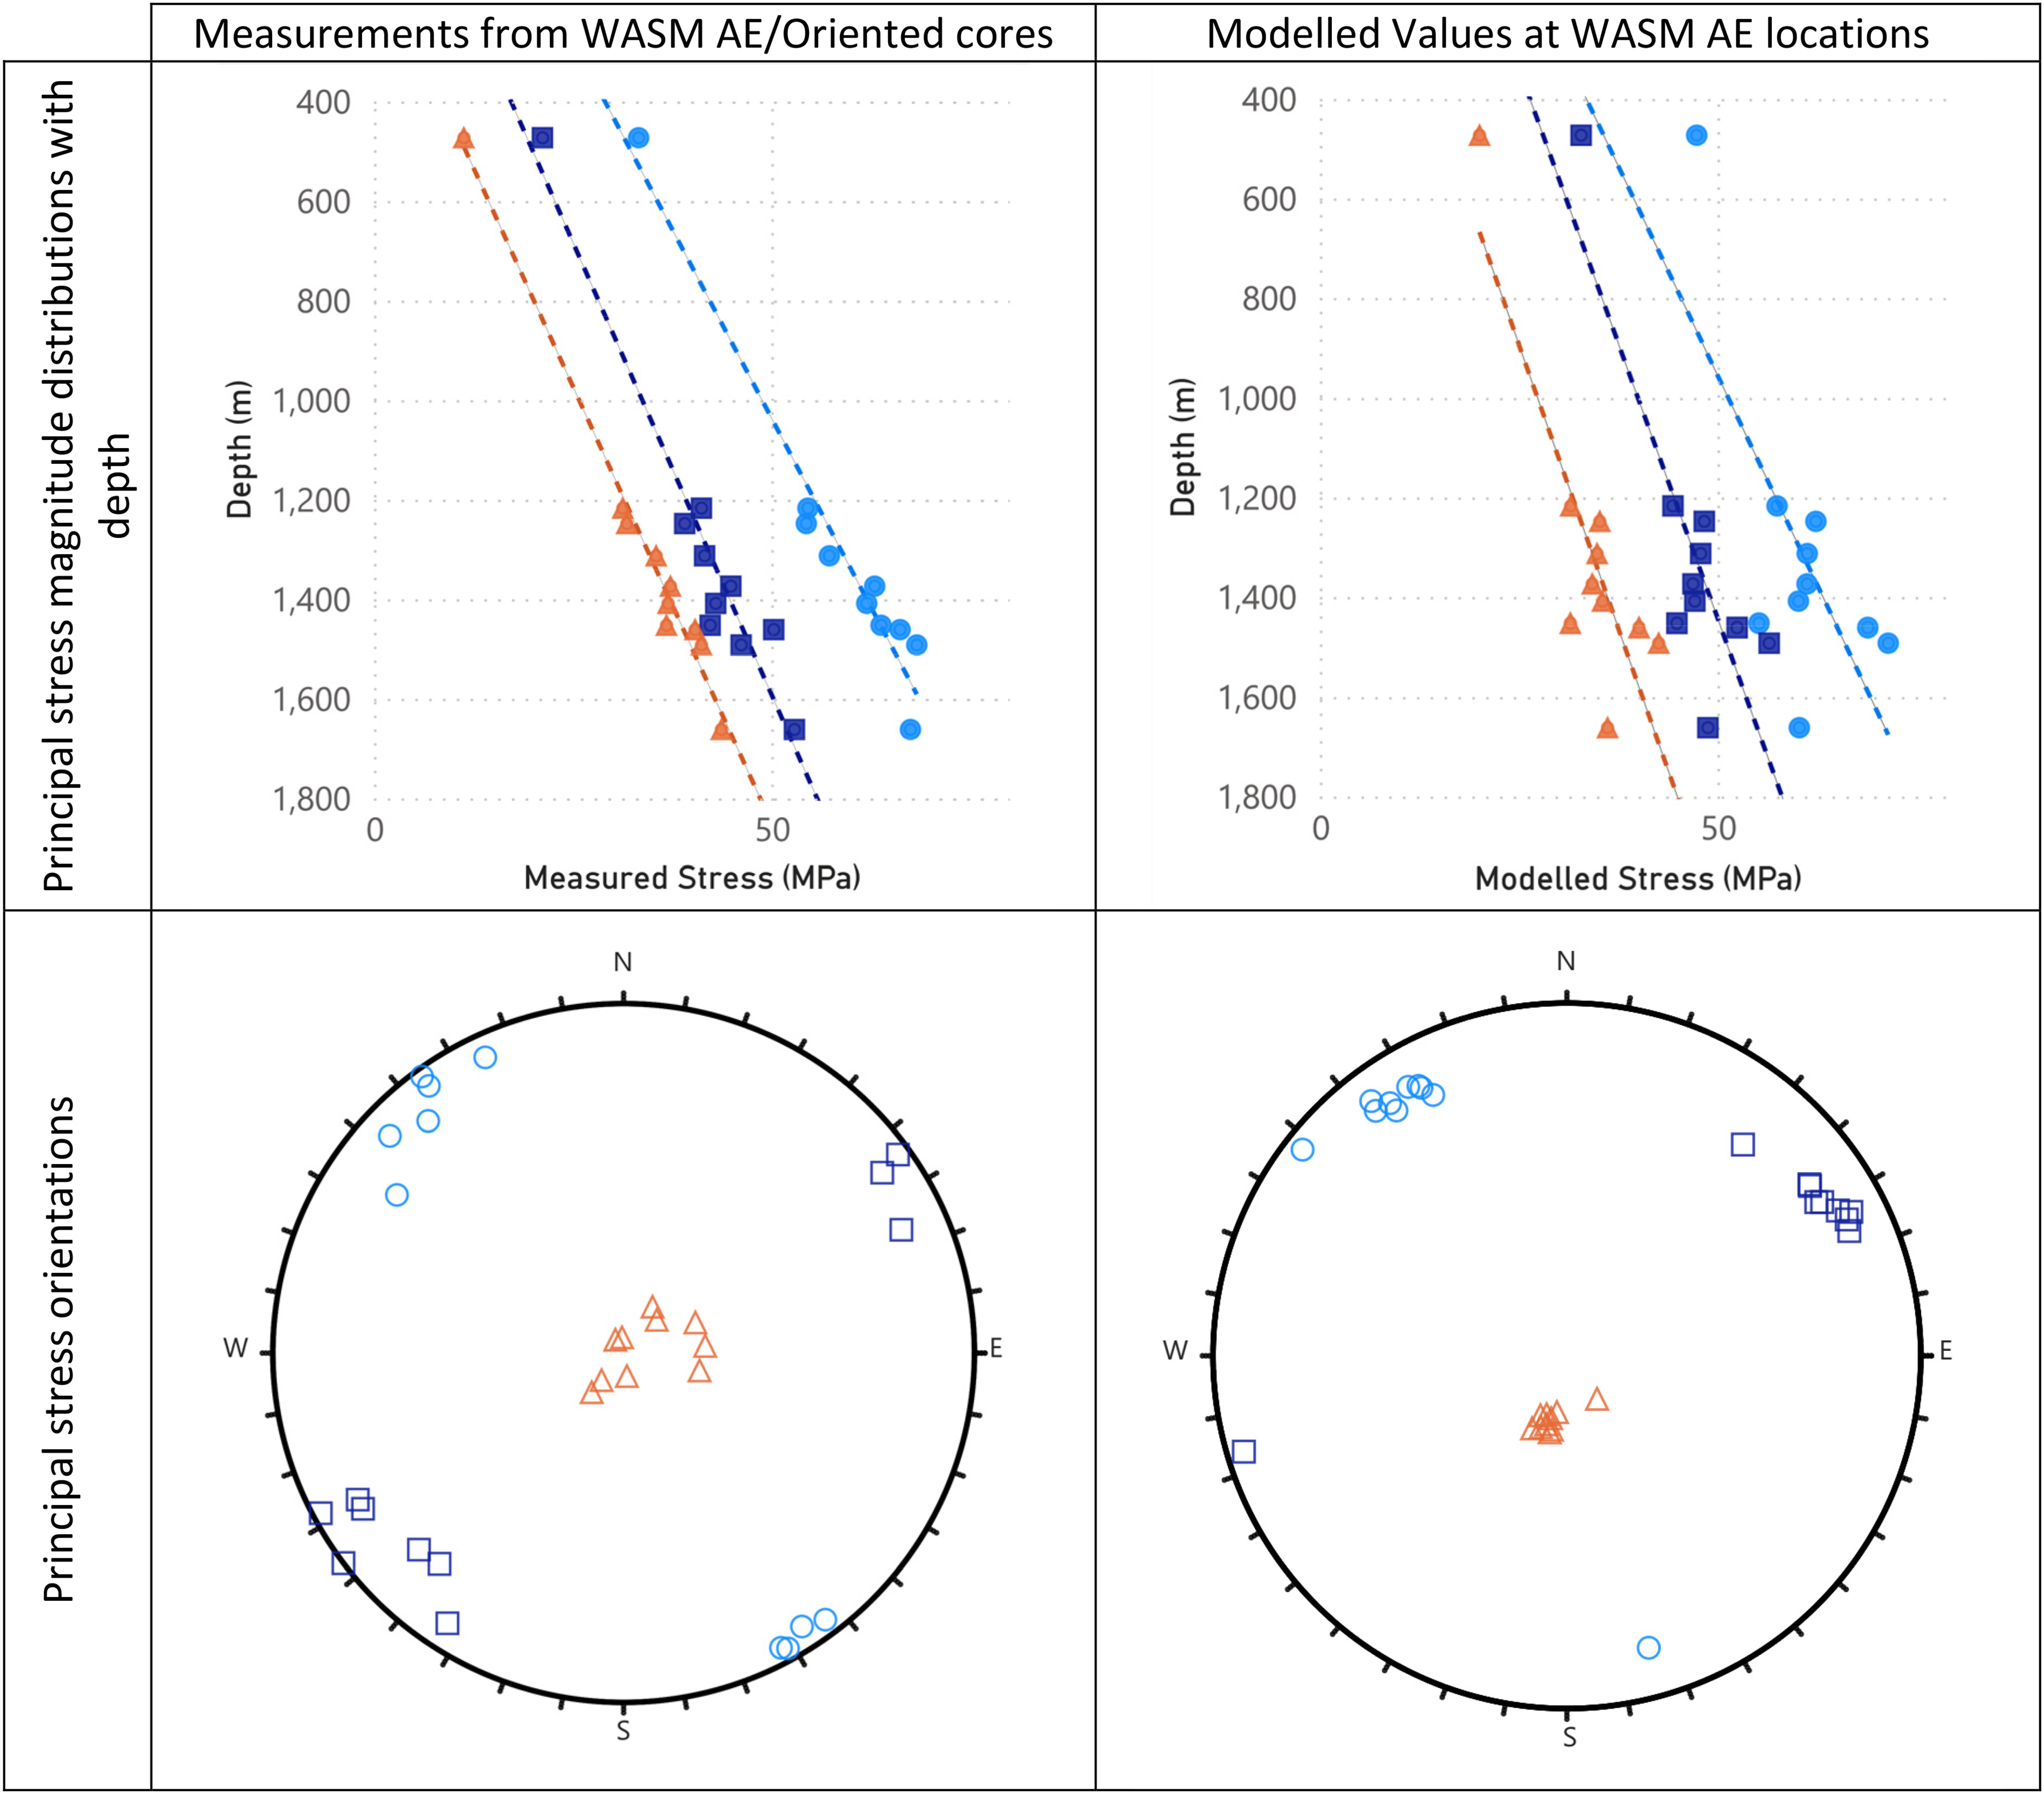
WASM AE comparison with the modelled stresses.
Results
Sector scale observations
The three elastic submodels for Pacifico Superior, Esmeralda and Reservas Norte (shown in Figure 2) were analysed at a sector scale. The information was evaluated using the Integrated Geotechnical Data (IGD) platform developed by Bustos (2022). The IGD has been prepared to analyse data from different sources into one dashboard, allowing the integration of multiple visual and statistical filters. In this case, the IGD was set up to study several equivalent mine steps for the three sectors. The zones studied were area equivalent, including 56,000 m2 for each mine, which for the El Teniente production rate corresponds to approximately eight undercut drifts incorporated over a two-year production period.
The stress results were analysed at different elevations, including major (σ1) and minor (σ3) principal stresses, deviatoric stress (σ1–σ3) and factor of safety (FoS). The FoS definition used in this paper is the quotient between the σ1 calculated from the Mohr–Coulomb envelope (for a certain σ3 from the numerical model) and the σ1 from the model. In the three models, the highest concentration of stresses occurred at the border of the cave front and in the proximity of excavations, and the lowest concentration was behind the cave's front. Those redistributions induce a high concentration of deviatoric stress, particularly at the bridge pillar, undercut drifts and the roof of the drawpoint drift.
Figure 8 compares the stress variables in the drawbell's centre level for the mine sectors. Each sector included one year of mining activity, with 23–26 drawbells in extraction. The results indicate that Reservas Norte is the sector with larger principal stress concentrations, while Esmeralda shows larger minor principal stress conditions (more confinement).
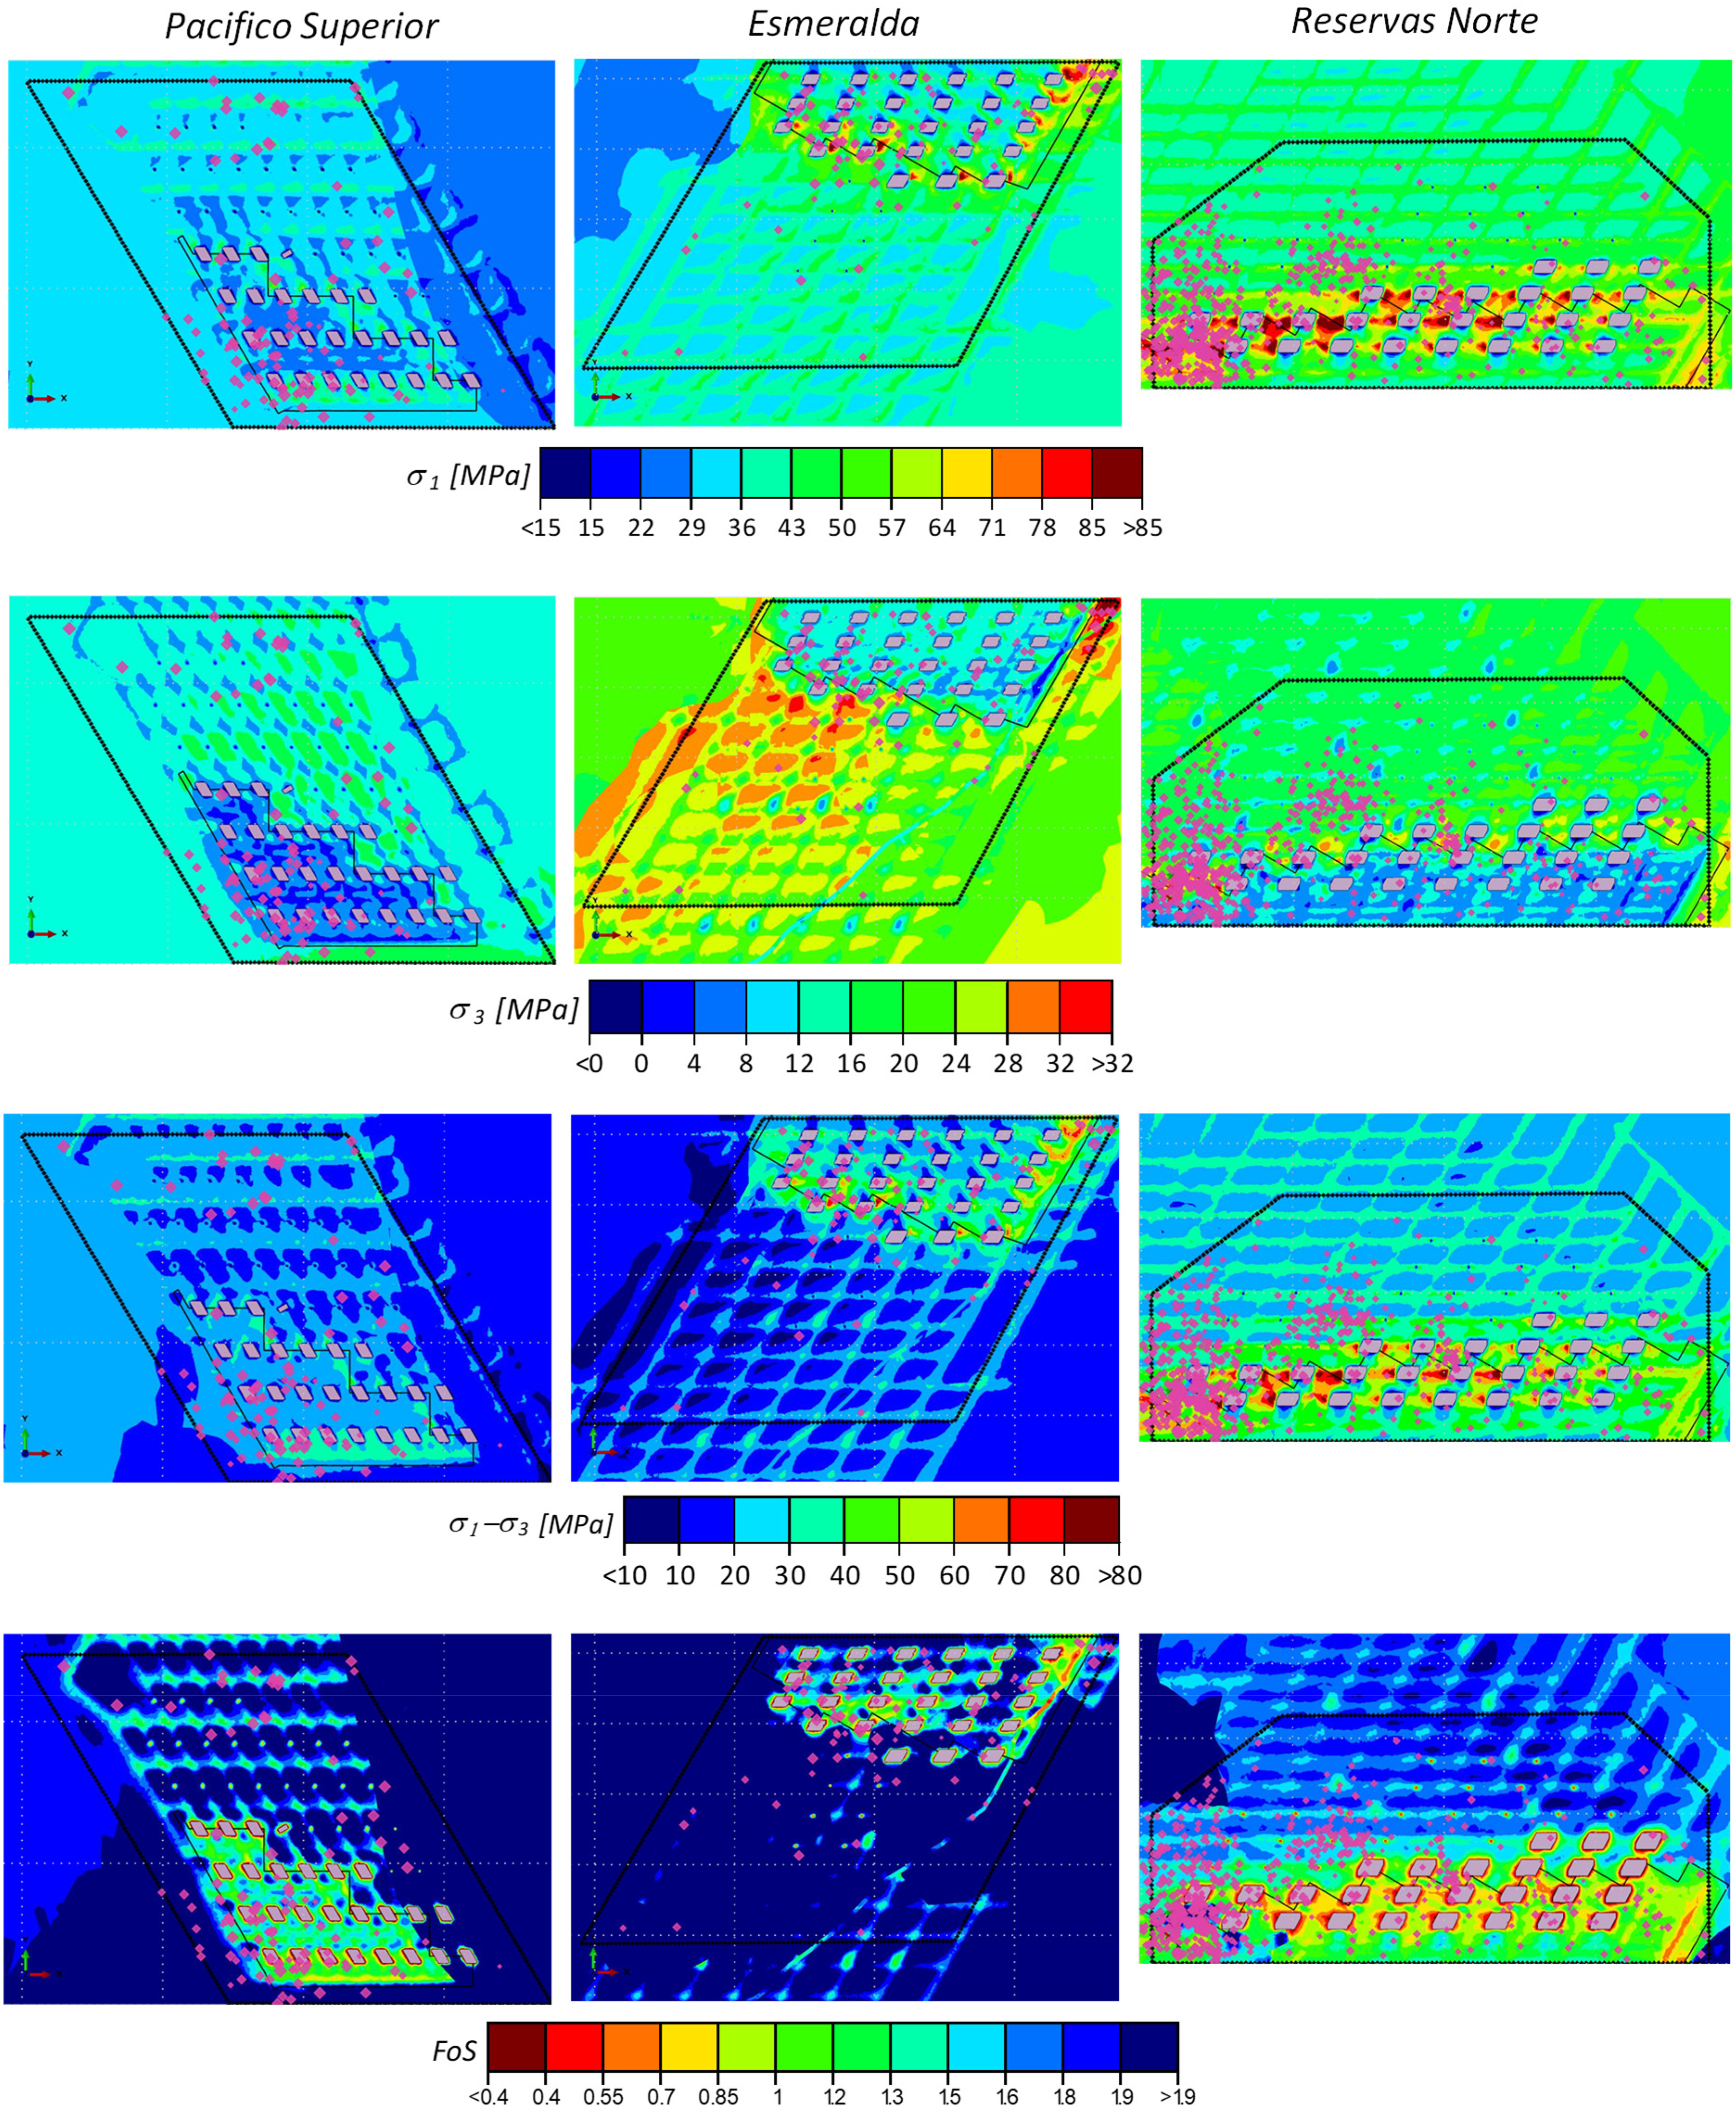
Major and minor principal stresses, deviatoric stress, FoS and seismicity comparison between different mine sectors, including one year in the same area with an extraction of 23–26 drawbells.
Zones with σ1–σ3 greater than 70 MPa are found in Esmeralda and Reservas Norte. Those areas generally match the areas presenting the smallest safety factor. The smallest safety factor is shown in the areas where σ3 was lower. Pacifico superior shows deviatoric stress no greater than 40 MPa. However, the safety factor is lower than 1 in the South layout border, where the minor principal stress is very low. This border, located north of Diablo Regimiento Sector (50 m below), might be influenced by their caving interactions.
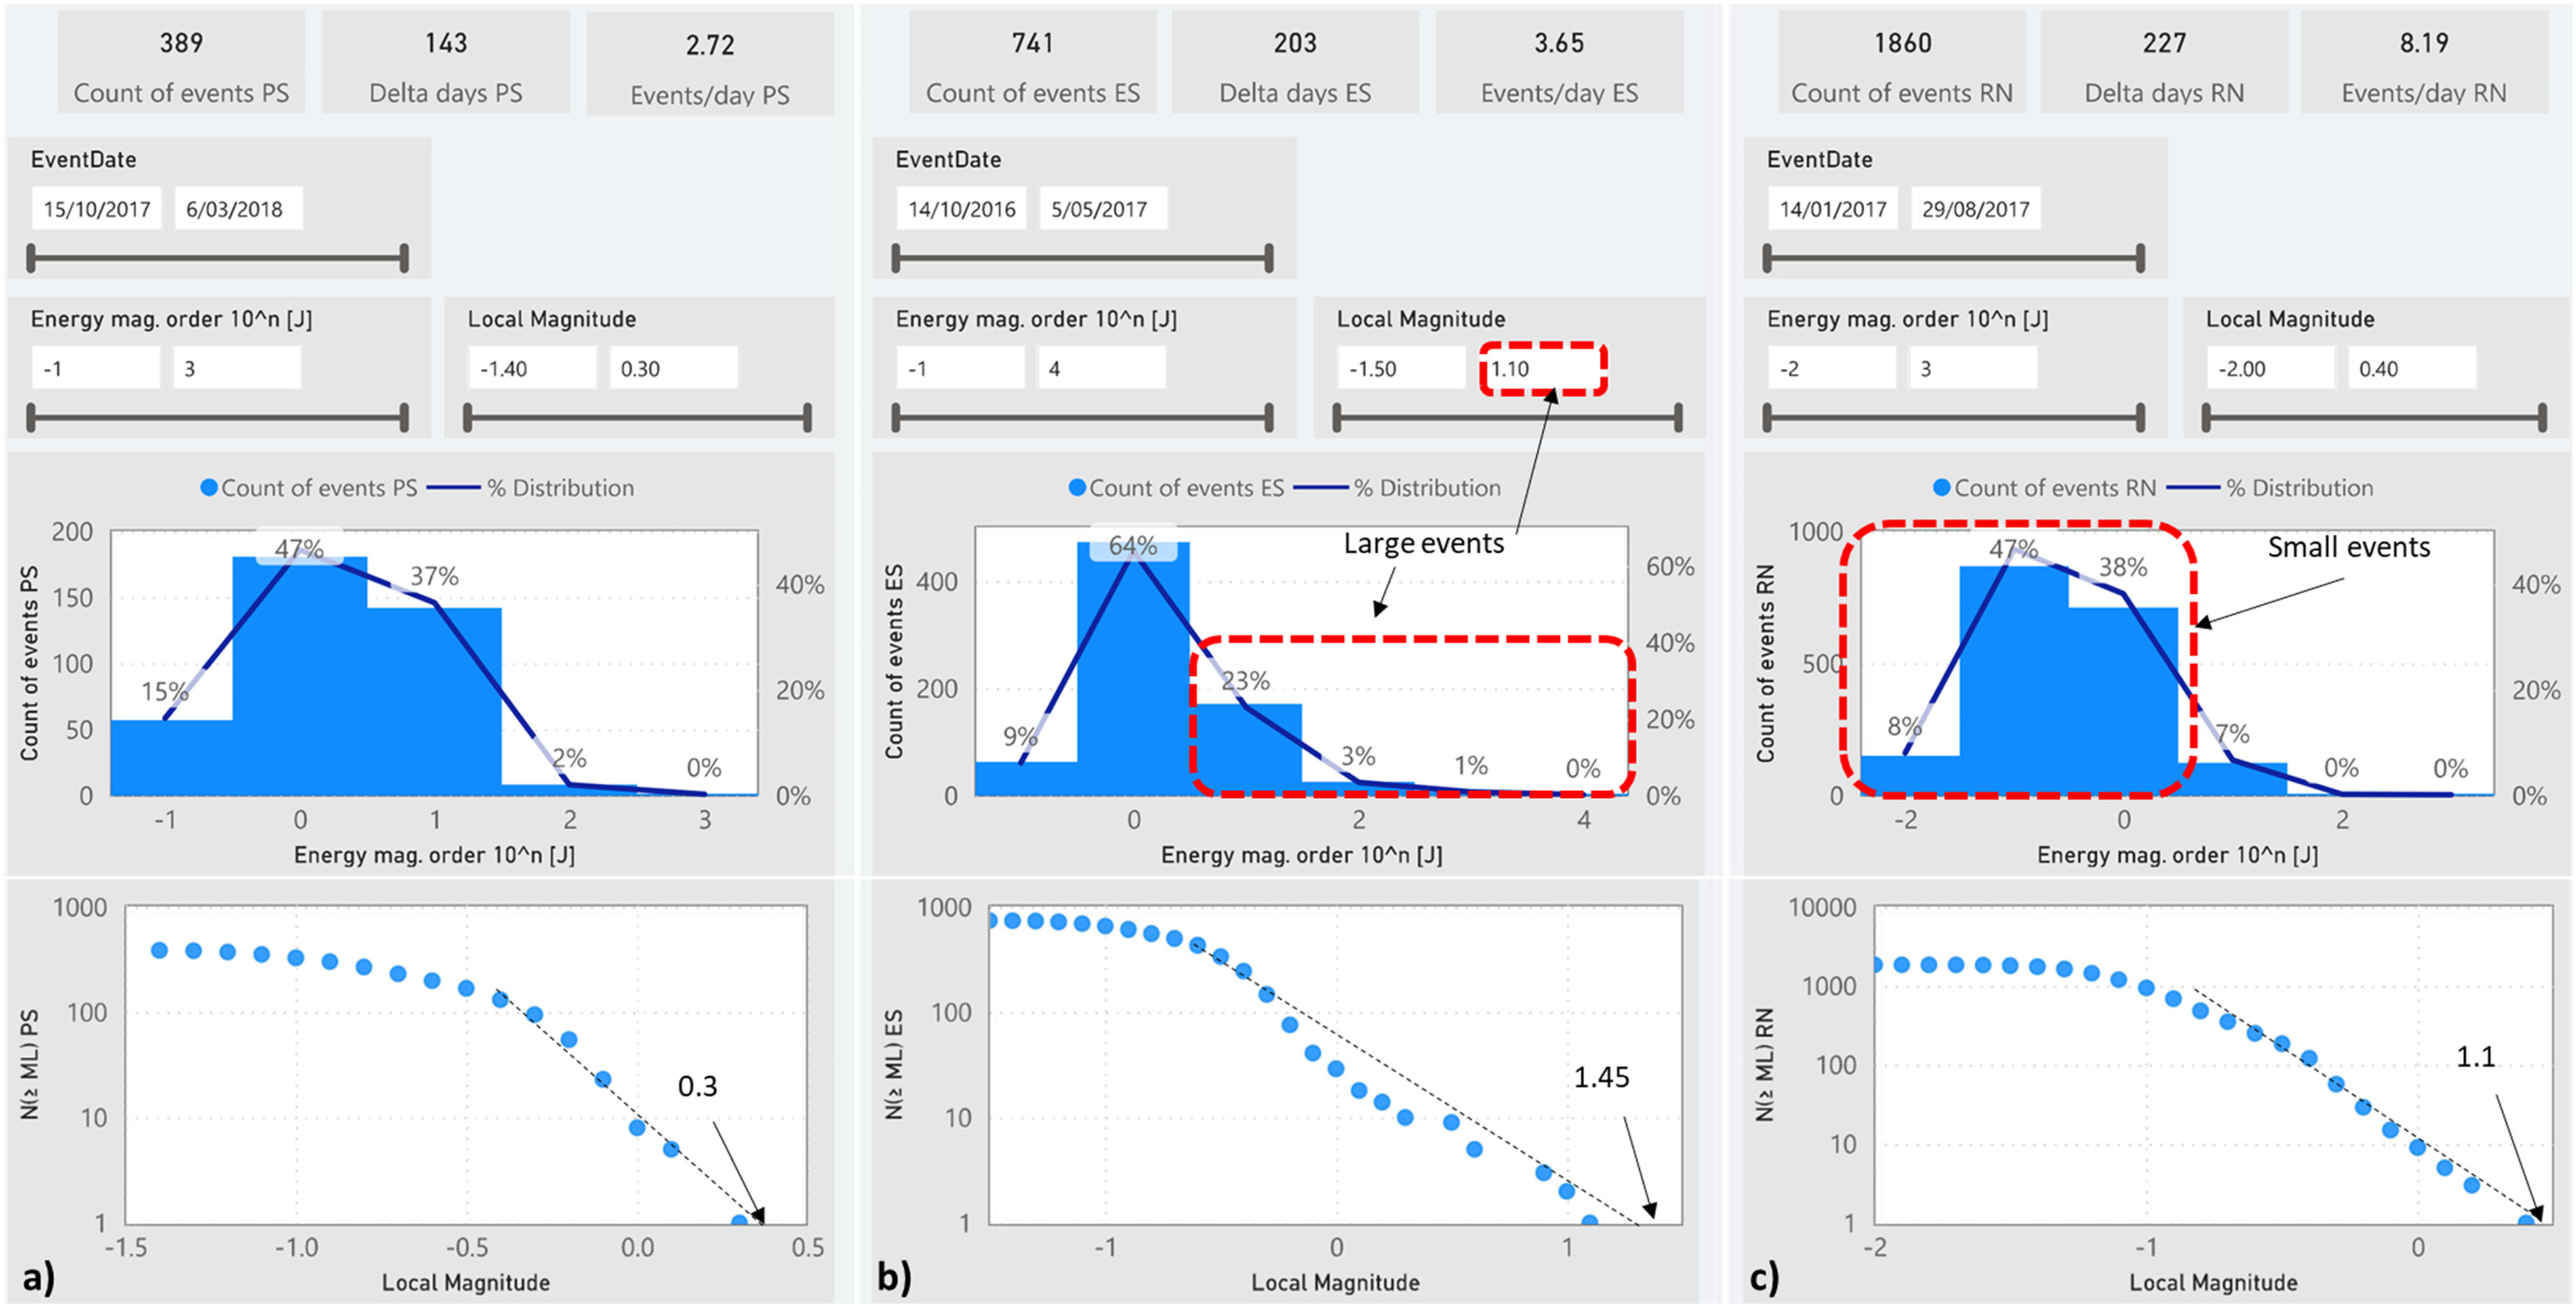
The average number of events per day for a three-year period was 4.92 ev/day for the Reservas Norte sector, while Pacifico had 2.05 ev/day and Esmeralda 2.25 ev/day (see Figure 9). This agrees with the factor of safety in Reservas Norte. Low confinement and greater values for principal stress indicate that the activation of structures is more likely to occur. Esmeralda has the greater factor of safety of the three sectors. A lower amount of events is expected for this sector, and the confinement of the sector anticipates that events could release more energy when they occur. The deviation of stress, which is a good indicator of the likelihood of shear failure, is greater at Reservas Norte and much lower at Pacifico Superior. In Pacifico Superior, the factor of safety is lower than in Esmeralda, and the confinement is lower. However, the seismic network within this sector might not be collecting small events or have a greater vertical error position due to the lack of sensors at the relevant height.
Seismic comparison using two intermediate mine steps: (a) Pacifico Superior, (b) Esmeralda and (c) Reservas Norte.
If the analysis of the events is limited to seismicity occurring between the production and undercut levels (data filtered between −20 m and 20 m), the statistics are clearer. Figure 9 shows fewer events with more energy in Esmeralda, increasing the maximum event expected by the Gutenberg–Richter envelope to ML 1.45 (Mendecki et al., 1999). Many analyses can be done using the IGD tool, reaching a similar conclusion. The exercise shown in Figure 9 uses two mine steps and displays the number of events according to their magnitude. It can be seen that the average of events follows the same tendency, with 8.2 ev/day at Reservas Norte, 3.7 ev/day in Esmeralda and 2.7ev/day in Pacifico Superior, respectively. It can also be noticed that 55% of the events at Reservas Norte have an energy lower than 1 J, while in Esmeralda, only the 9%. In terms of large events, in Esmeralda, a total of 27% of the events had energy greater than 10 J, while in Reservas Norte, only 7% exceeded that threshold.
This type of analysis can help to quantify the seismicity response during a drawbell construction. However, a local seismic network is required to analyse a drawbell construction scale problem.
Drawbell scale analysis
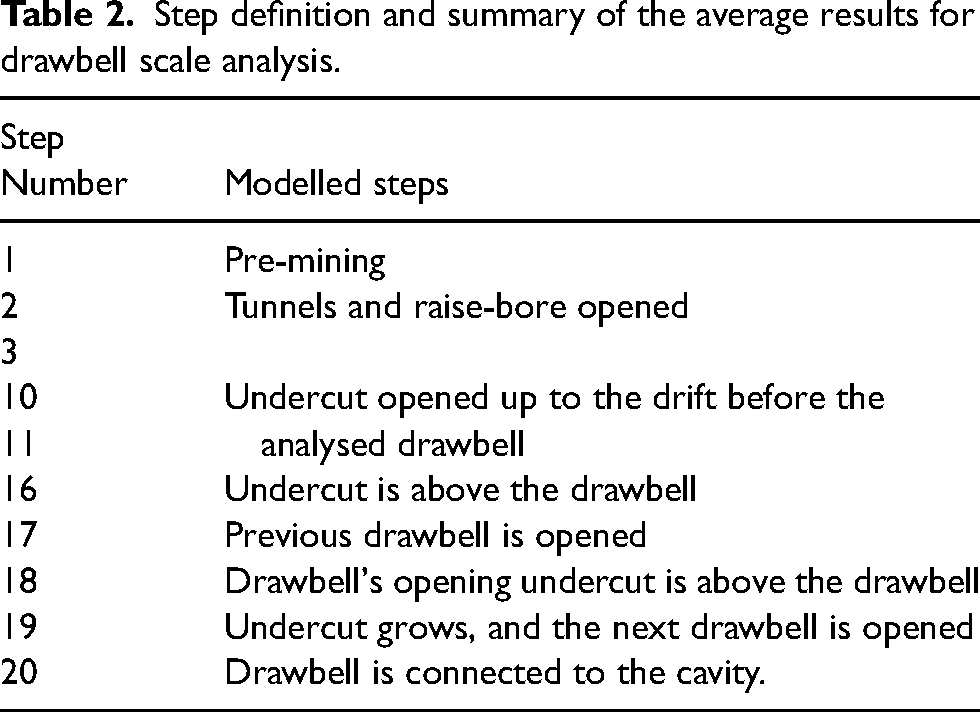
The drawbell scale stress redistribution was studied at Pacifico Superior Sector for a drawbell identified as D04P05P06. This analysis included 20 mining steps, and 10 of them was used to analyse the condition of this particular drawbell using elastic properties. Each stage corresponds to a different mining geometry, which is detailed in Table 2.
Step definition and summary of the average results for drawbell scale analysis.
The analysis was undertaken using the IGD, with filtering through steps, zones, and parameters that allowed the determination of three critical zones of possible instability (see Figure 10): the bridge pillar (Zone 1), the top of the crown pillar (Zone 2) and the drawpoint drift roof (Zones 3 and 4).
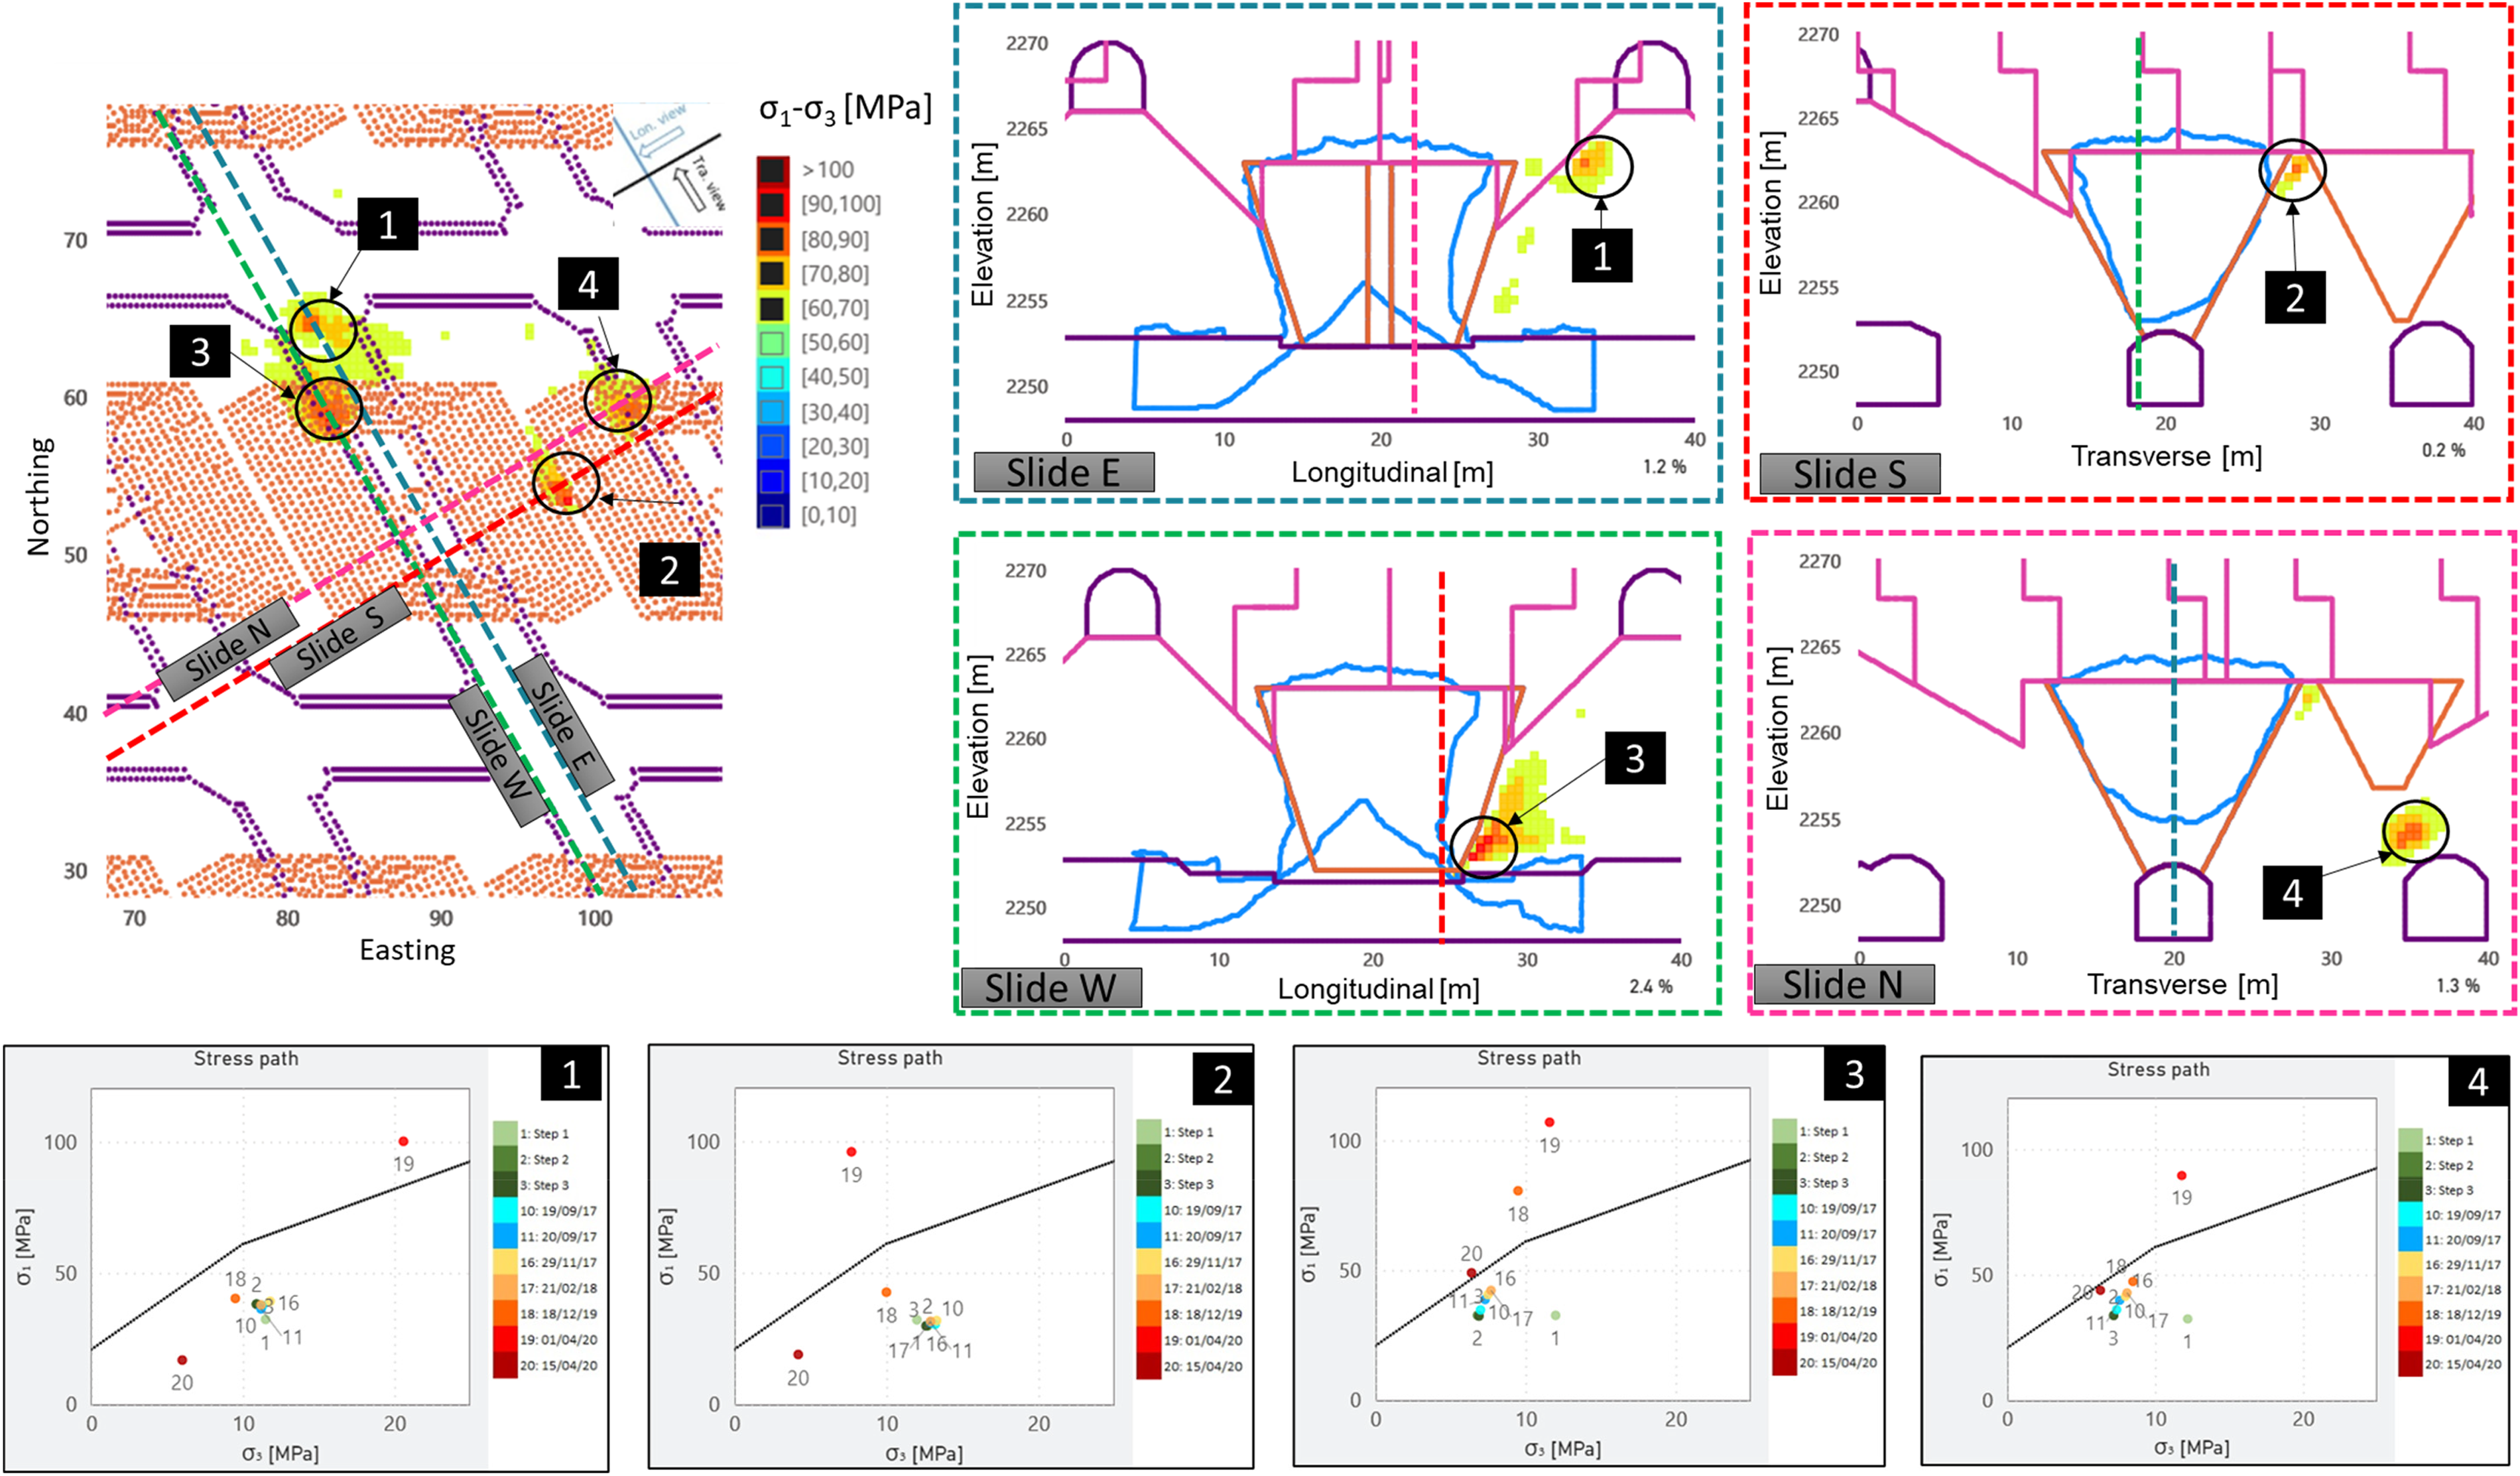
Zones with deviatoric stress greater than 60 MPa at step 19.
Zone 1 is a complex volume, presenting high-stress concentrations that might trigger a seismic event or negatively impact the connection between the drawbell shape and the undercutting level. Damage to the holes drilled down from the undercutting rings (bridge pillar) could generate a deficient blasting and temporarily remnant pillars, which could cause a negative impact on the production level stability because it generates something similar to a point loading concentration. When the undercutting level tunnel is damaged, operational measures must be undertaken to overcome the undercutting failure, as Rivera et al. (2016) detailed for the undercutting recovery of the Reservas Norte. The process involves drilling and blasting long up-holes from the production level to blast the undercutting ring and the bridge pillar. This method can be effective if the production level remains stable. However, it must be avoided because it generates ore extraction delays, and it requires drilling and blasting of long holes, with potential drillhole deviation and associated blast damage (Bustos et al., 2020). Also, these practical approaches must be diligently undertaken without delay because they can impact production-level stability.
Zone 2 was found to be quite reduced, showing only 0.2% of points having more than 60 MPa of deviatoric stress in that plane, and the minor principal stress was low. Some damage can be expected, but this should not impact the production level's stability or flow when the drawbell shape is achieved.
Zones 3 and 4 directly affect the stability of the production level. The failure can occur at very high confinement, depending on the location of the front cave. Figure 11 summarises the principal stress, 2 m above the drawpoint drift roof at different mining steps. The pre-mining stress rotated significantly since the drifts were developed, but especially when the cave front is bigger, the direction becomes E-W even before the drawbell is blasted (step 17). After the drawbell is blasted, the principal stress is concentrated in the drawbell's acute corner, which is Zone 3 or 4.
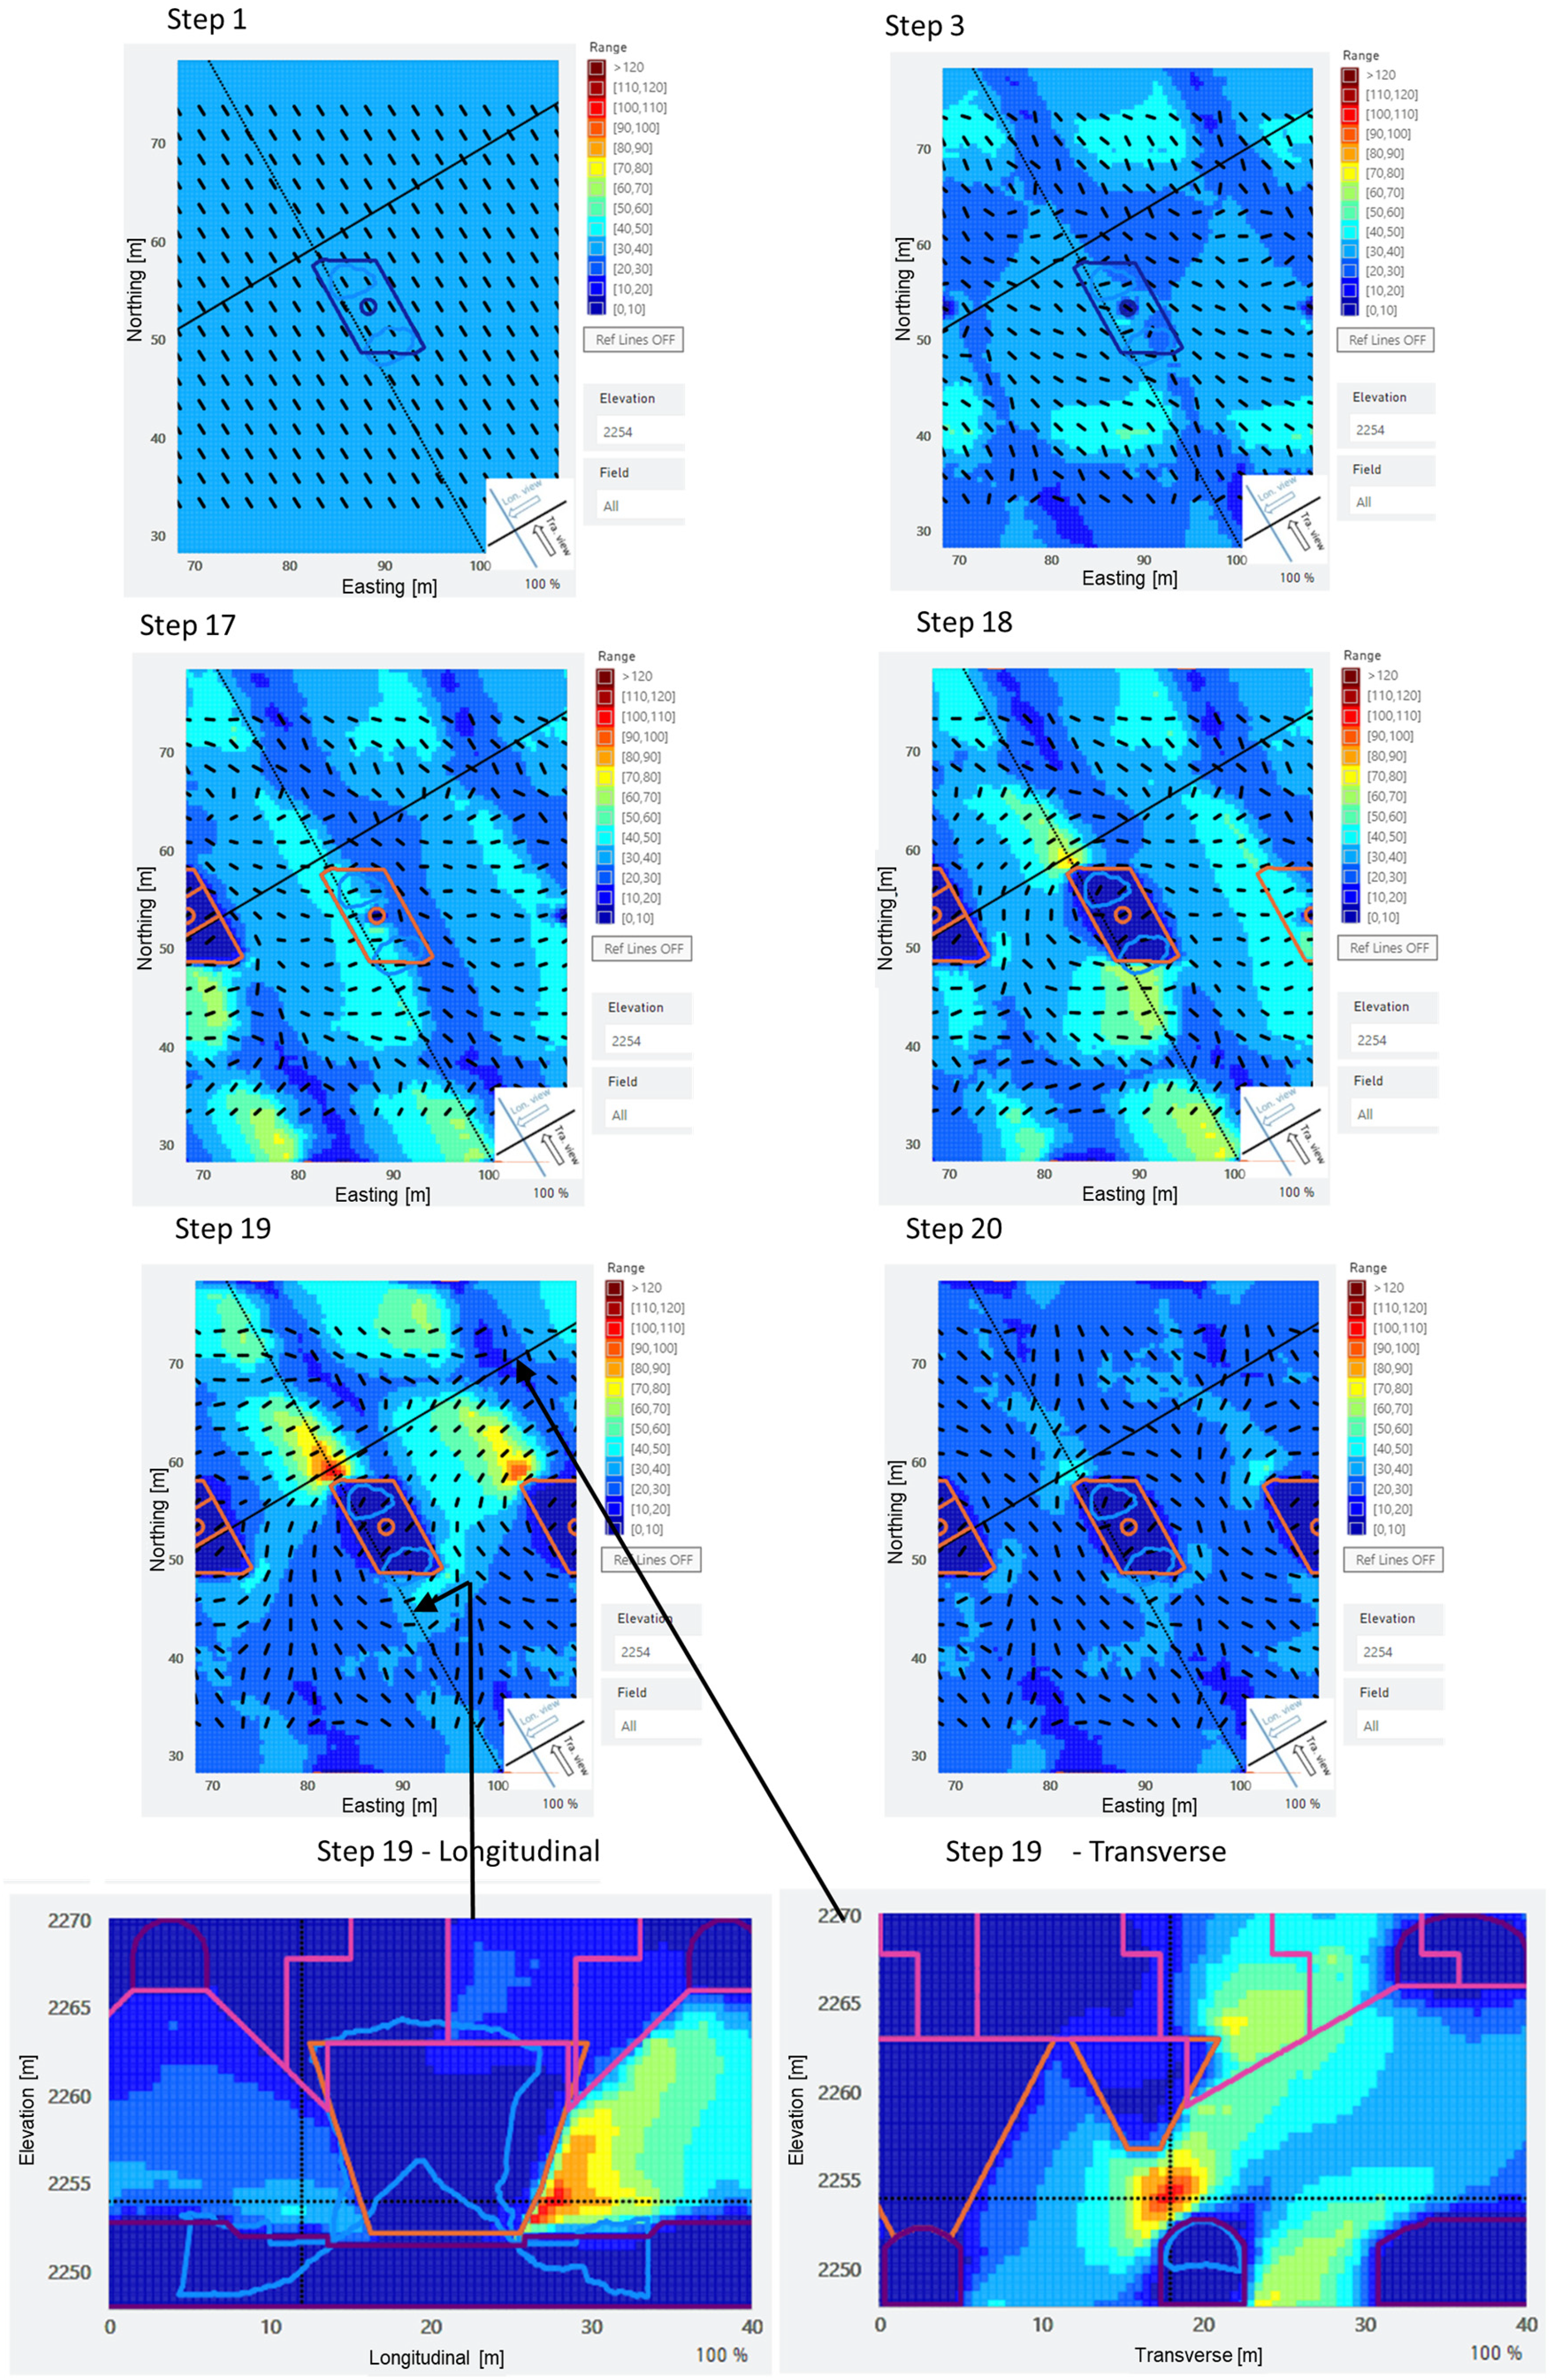
Major principal stress distribution showing the azimuth on the horizontal views at different steps and vertical view of the stressed zone in step 19.
A transverse section for step 19 is shown in Figure 11 (right-down picture). It can be seen that the critical zones in the roof of the drawpoint and the bridge pillar can be temporally connected when the front of the caving is above the drawpoint. It has been found the stability might be diminished at the bridge pillar and the corner drill holes, which are experiencing heavily confined blasts due to large drillhole deviation measured at the less inclined holes (Bustos et al., 2020). These confined blasted zones experienced more than 2.2 m of dynamic burden, which is correlated with large zones of underbreak (Bustos et al., 2023).
The same zones were also found in the plastic strain analysis (see section damage analysis using plastic strain). However, the elastic numerical model analysed in this chapter resulted in a better tool to predict the energy involved in the failure by examining the stress path. The failure at the bridge pillar was found to occur at a higher level of confinement. Thus, this zone is more likely to encounter dynamic failure under the stress conditions of the Pacifico Superior Sector.
Structural analysis
El Teniente Mine has implemented photogrammetric technology to include structural mapping as part of most of its tunnel development construction cycle (Brzovic and Leon, 2017). Using 147 geological structures mapped in Pacifico Superior Sector (drawpoint drifts 4 to 6 and undercut drifts 5 and 6), a digital line mapping was undertaken, as presented in Figure 12. The left side of the figure shows the lines selected to intersect all the structures that pass through them. The central picture shows an isometric view of the structure lines intersected by P6, and the right picture shows the sampling line indicating each of the intersections where structures are digitally defined by the line, marked with blue dots. The mapped information from the 38 structures on this line was ordered into a scanline template prepared for analysis using the computer software SAFEX (Villaescusa et al., 2019; Windsor and Thompson, 1992). Three other lines were mapped, two in the drawpoint drift having 21 and 18 structures each and one line in the production drift 5, having 28 structures. Four structural sets were identified (Figure 13) and used to define a rock mass model formed by 18 structures according to average spacing and trace parameters.
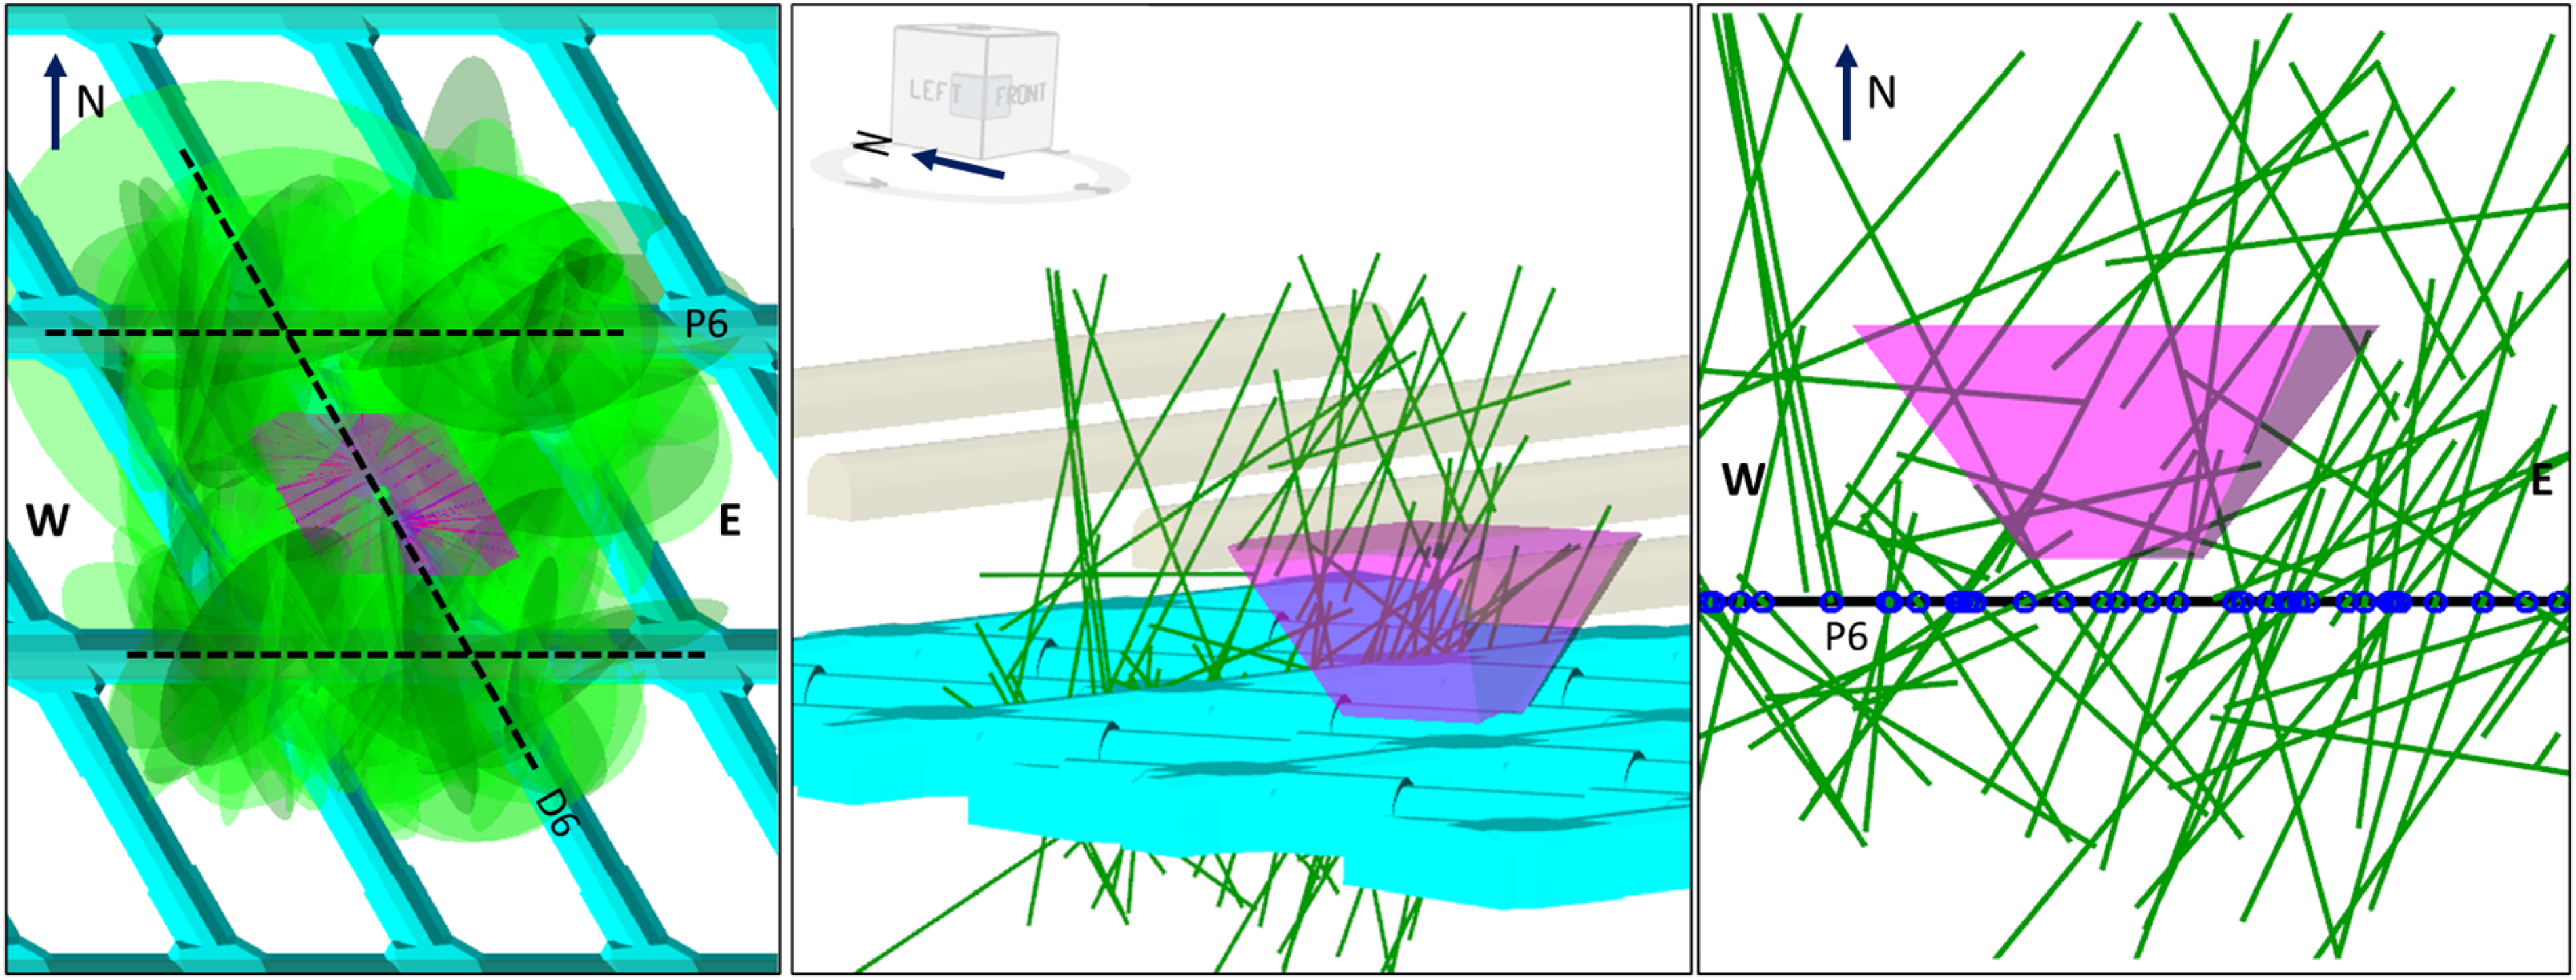
Details of digital line mapping process using 3Dcad tools.
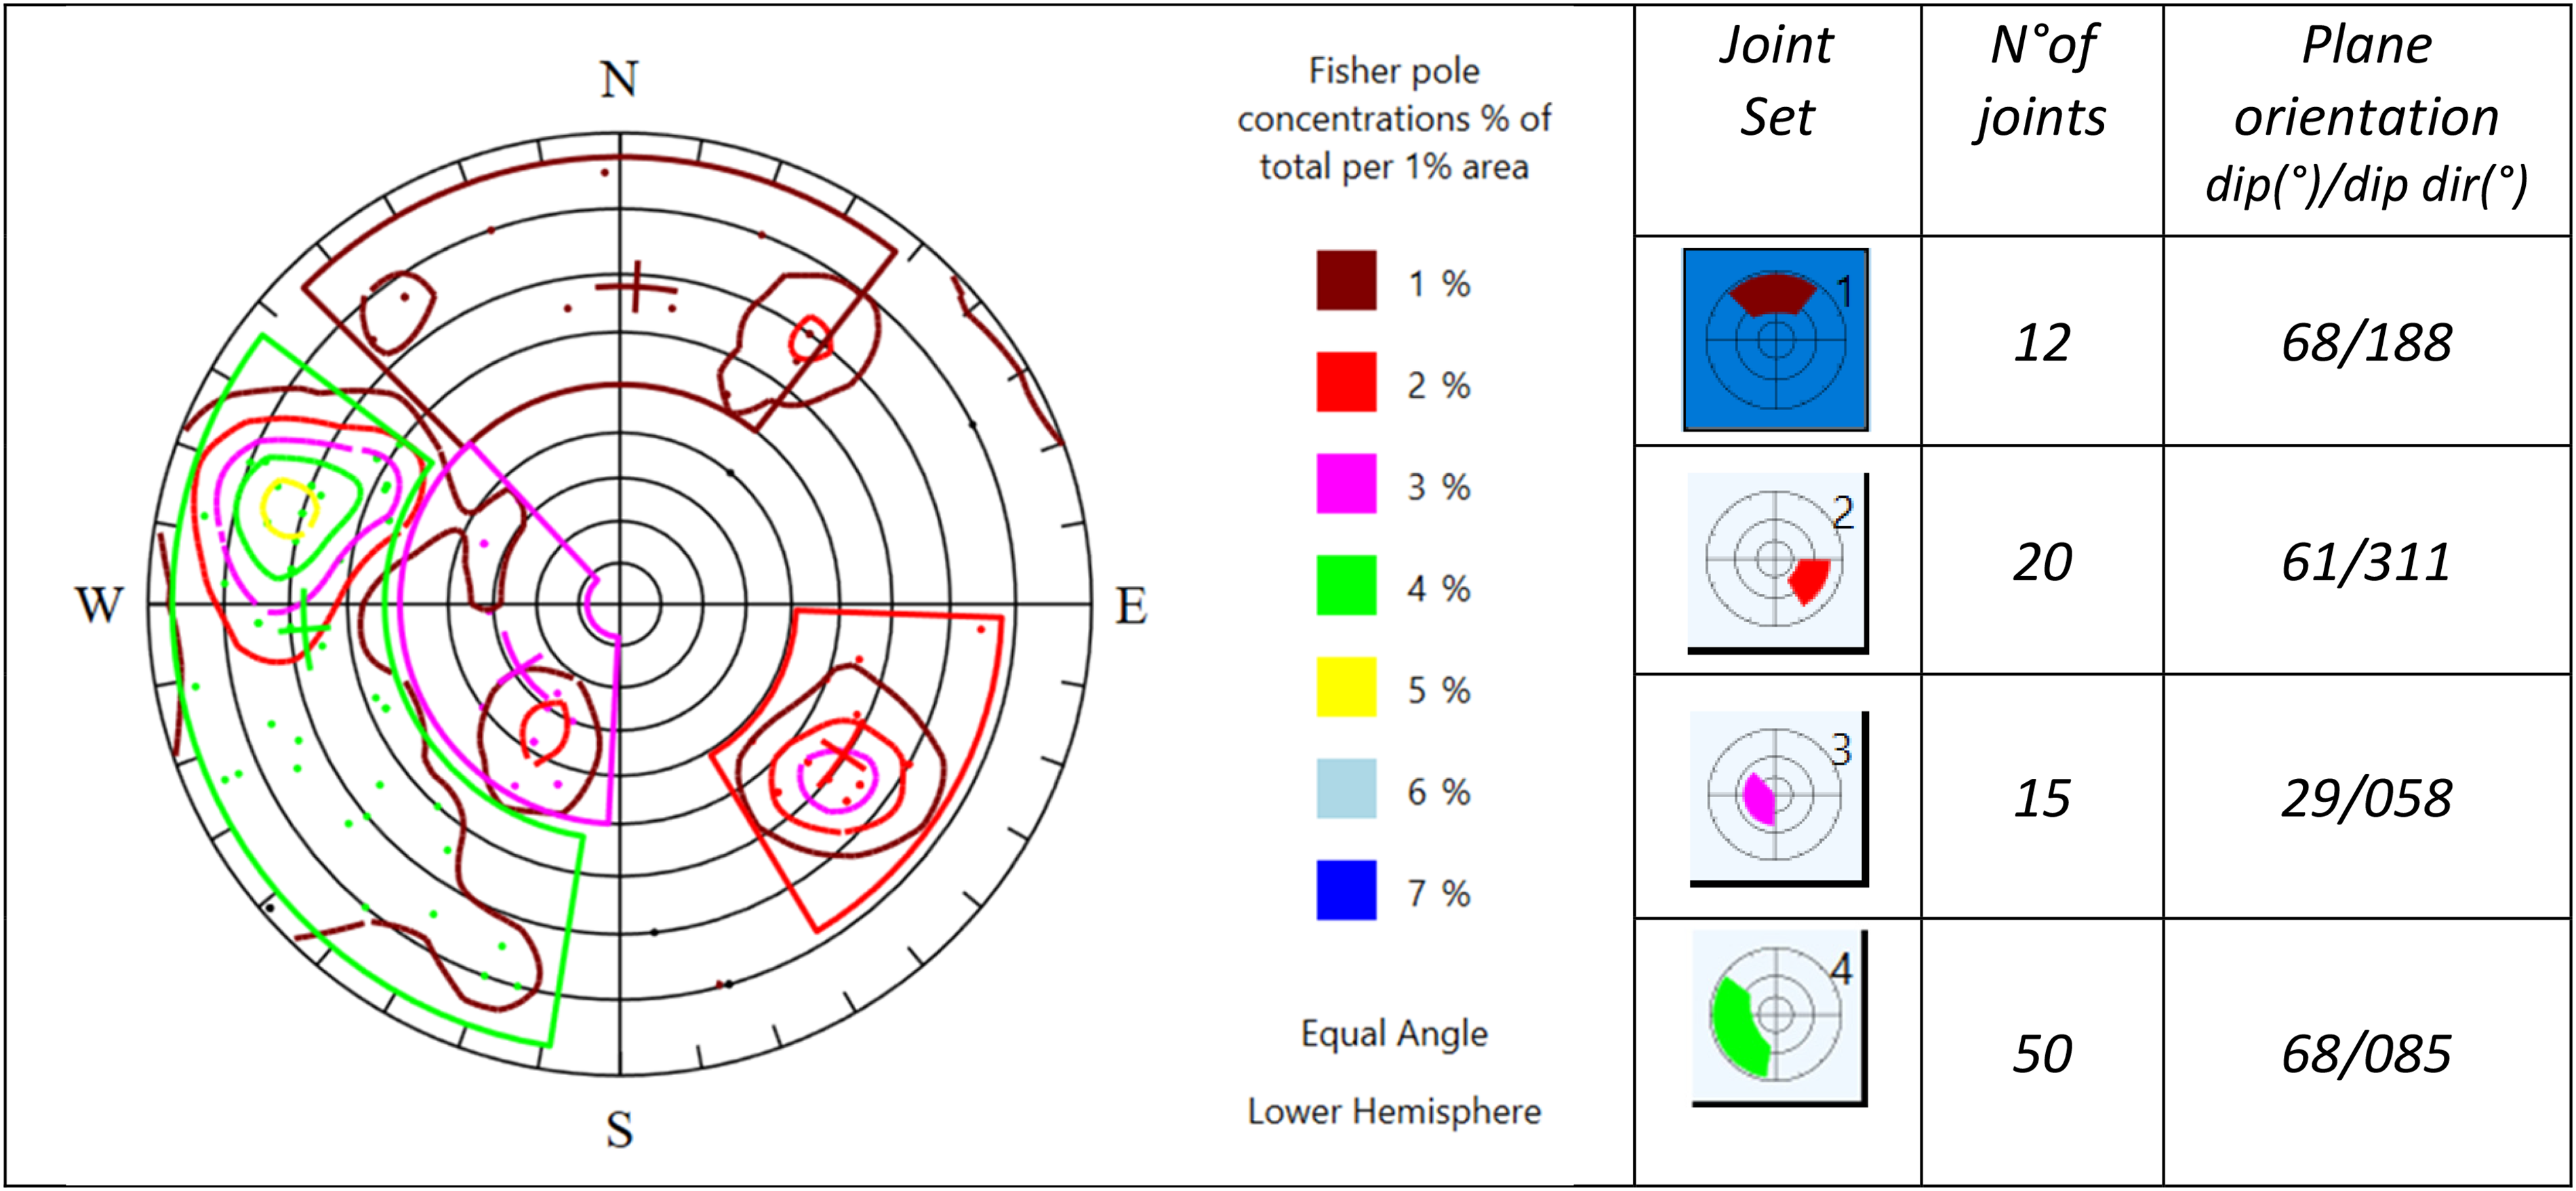
Joint sets definitions.
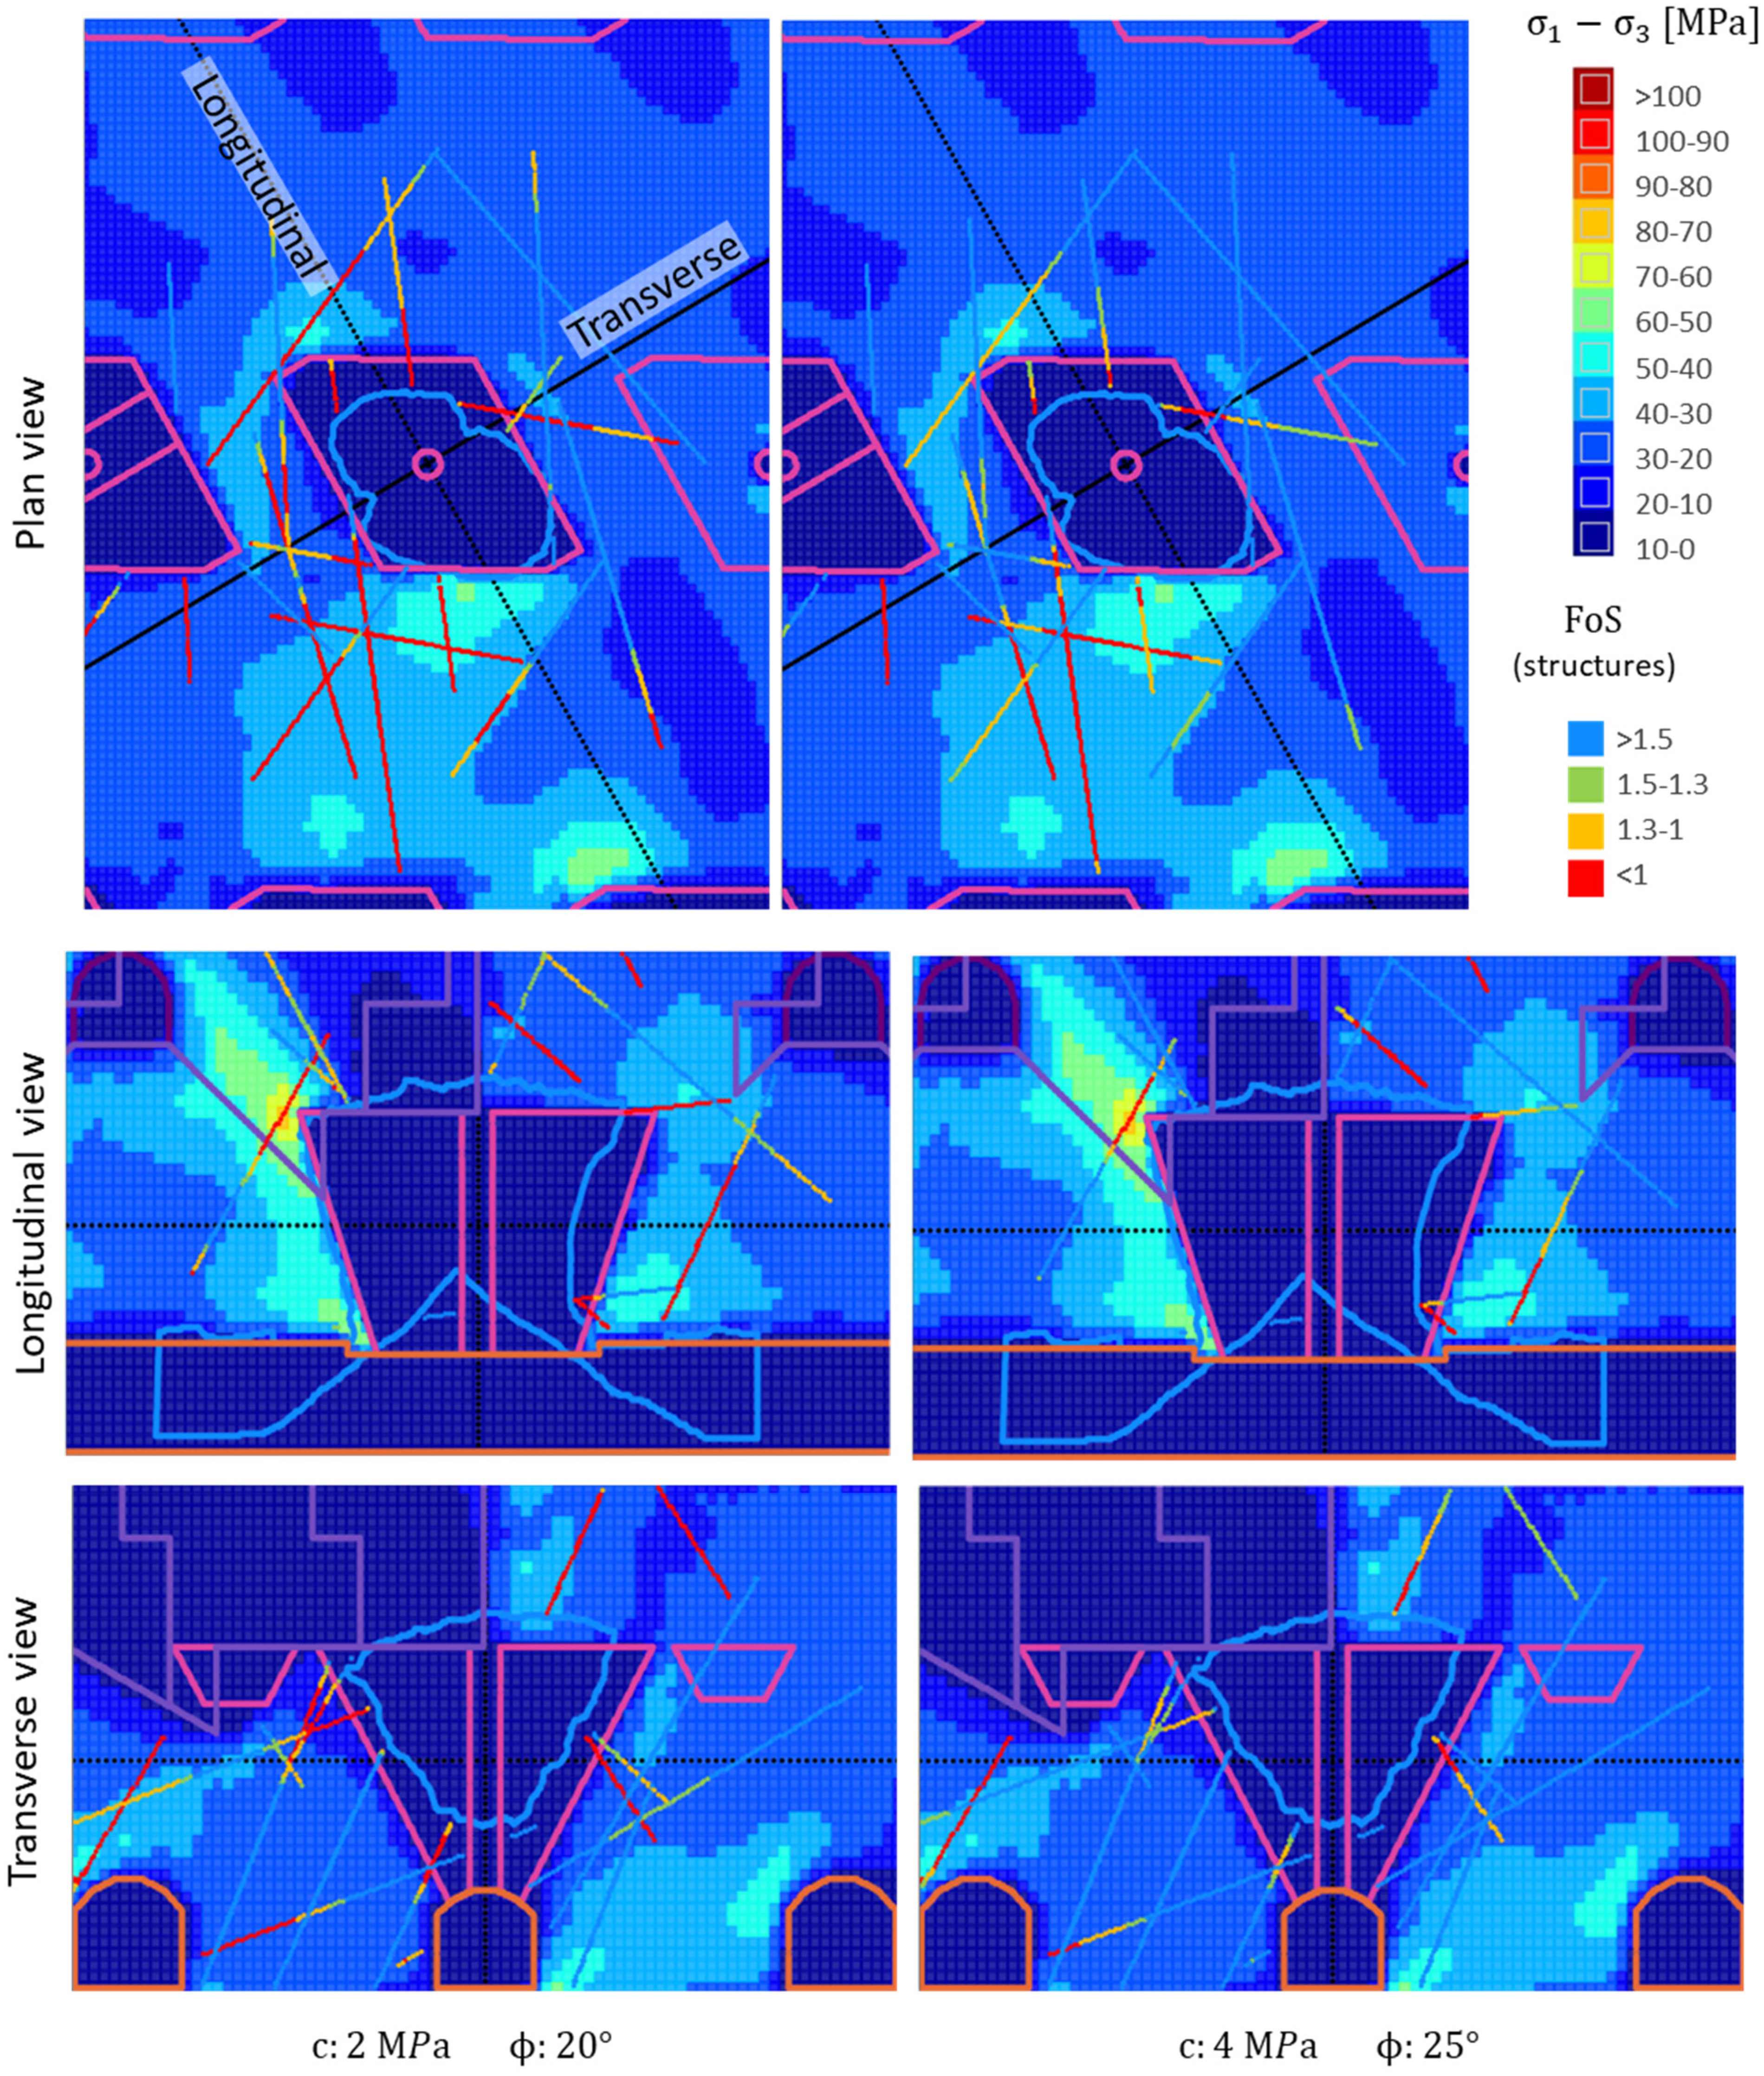
The normal and tangential stress distribution along the structures was extracted from the model and studied. Figure 14 shows the results for different modelled steps comparing values of 2 and 4 MPa for cohesion and 20° and 25° for friction, respectively. It was determined that a small increment in cohesion and friction angle substantially increased the safety factor statistics by at least 20%. More interestingly, using those increased properties, the structures within the underbreak areas of the corners seem more stable, consistent with the CMS results of the drawbell shape. The mapped structures were classified as anhydrite and gypsum-infilled veins, whose properties were previously estimated at 21° to 29° for friction and 3.7 to 17 MPa for cohesion (Bustos et al., 2019).
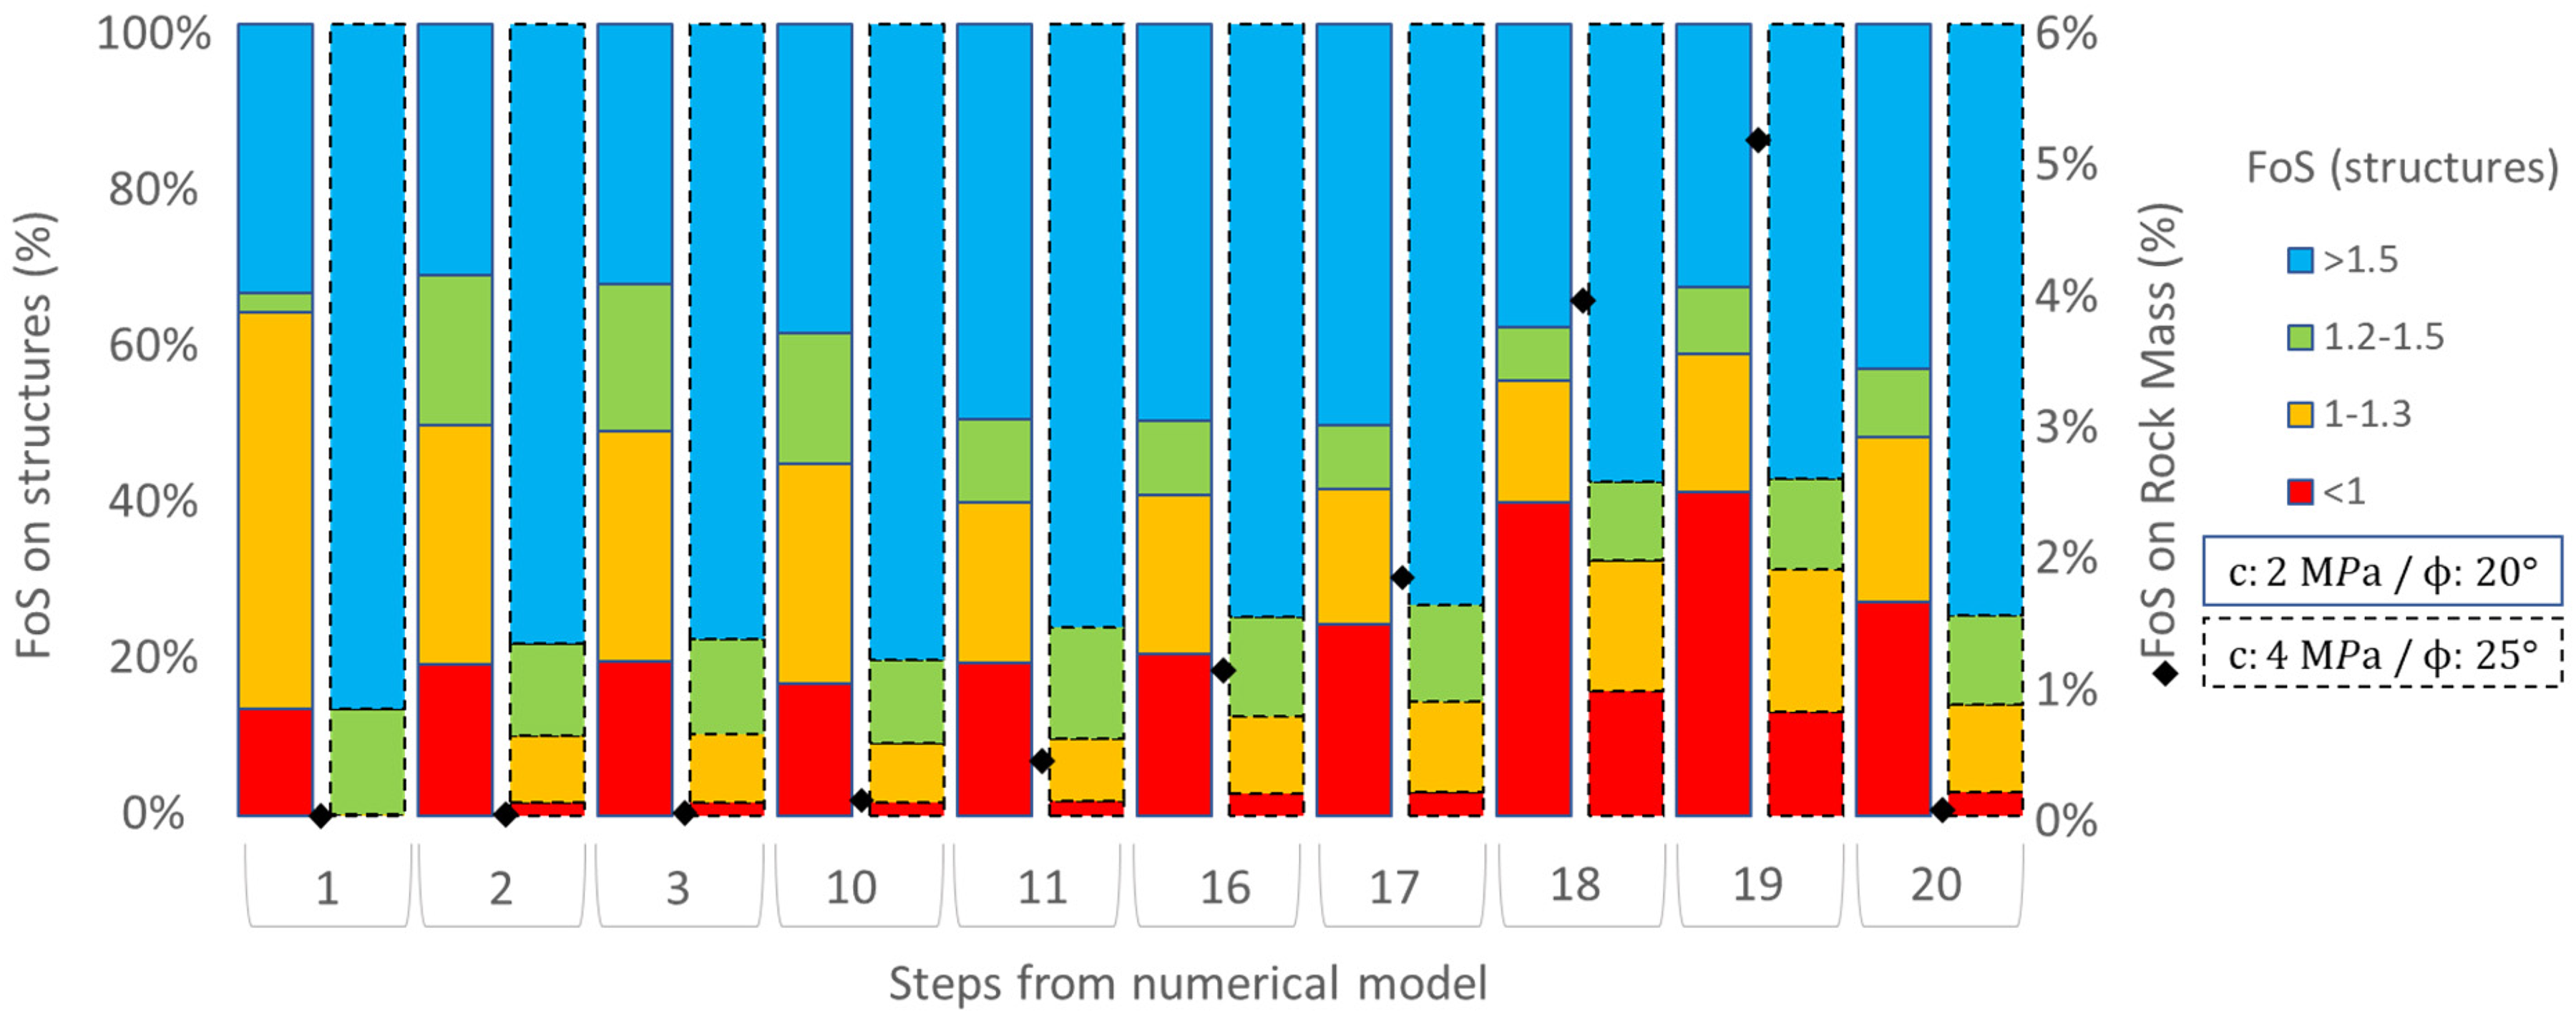
Factor of safety and structures and rock mass per step.
Figure 14 also shows the volume % of rock mass on failure (stress condition above the Mohr–Coulomb envelope) at each step. Another observation concerning the geological structures is that they appear to become unstable one step before the rock mass, which is step 19, as shown in Figure 15. This instability would increase the stress concentrations and plastic strain around the structures.
Finally, the results also indicate that joint sets can be unstable in early stages of the caving method, even when the abutment stress is not acting, but only because the spacial distribution is unfavourable with the pre-mining stress field.
Damage analysis using plastic strain
A comparison of two plastic strain models results of the Pacifico Superior (PS) drawbell D04 P05-P06 and D25 P14-P15 for Reservas Norte (RENO) Sector, including a total of 18 geometrically equivalent geological structures was undertaken. The idea was to estimate how the same 18 structures could influence the stress redistribution and the plastic strain (damage) in the surrounding volume of both drawbells. The investigated values of 4 MPa for cohesion and 25° friction angle were used as infill properties for all the structures.
The effect of stress concentrations can be seen in the equivalent plastic strain (referred as PEEQ in Abaqus) shown in Figure 16. The larger plastic strain regions are located in the drawpoint drift roof (Numerical model description section, Reservas Norte), at the top of the crown pillar (Results and Discussion sections Reservas Norte) and at the bridge pillar (Conclusion and further reading section, both sectors).
Major principal stress and safety factor comparison on defined structures for step 18 (drawbell blasting step).
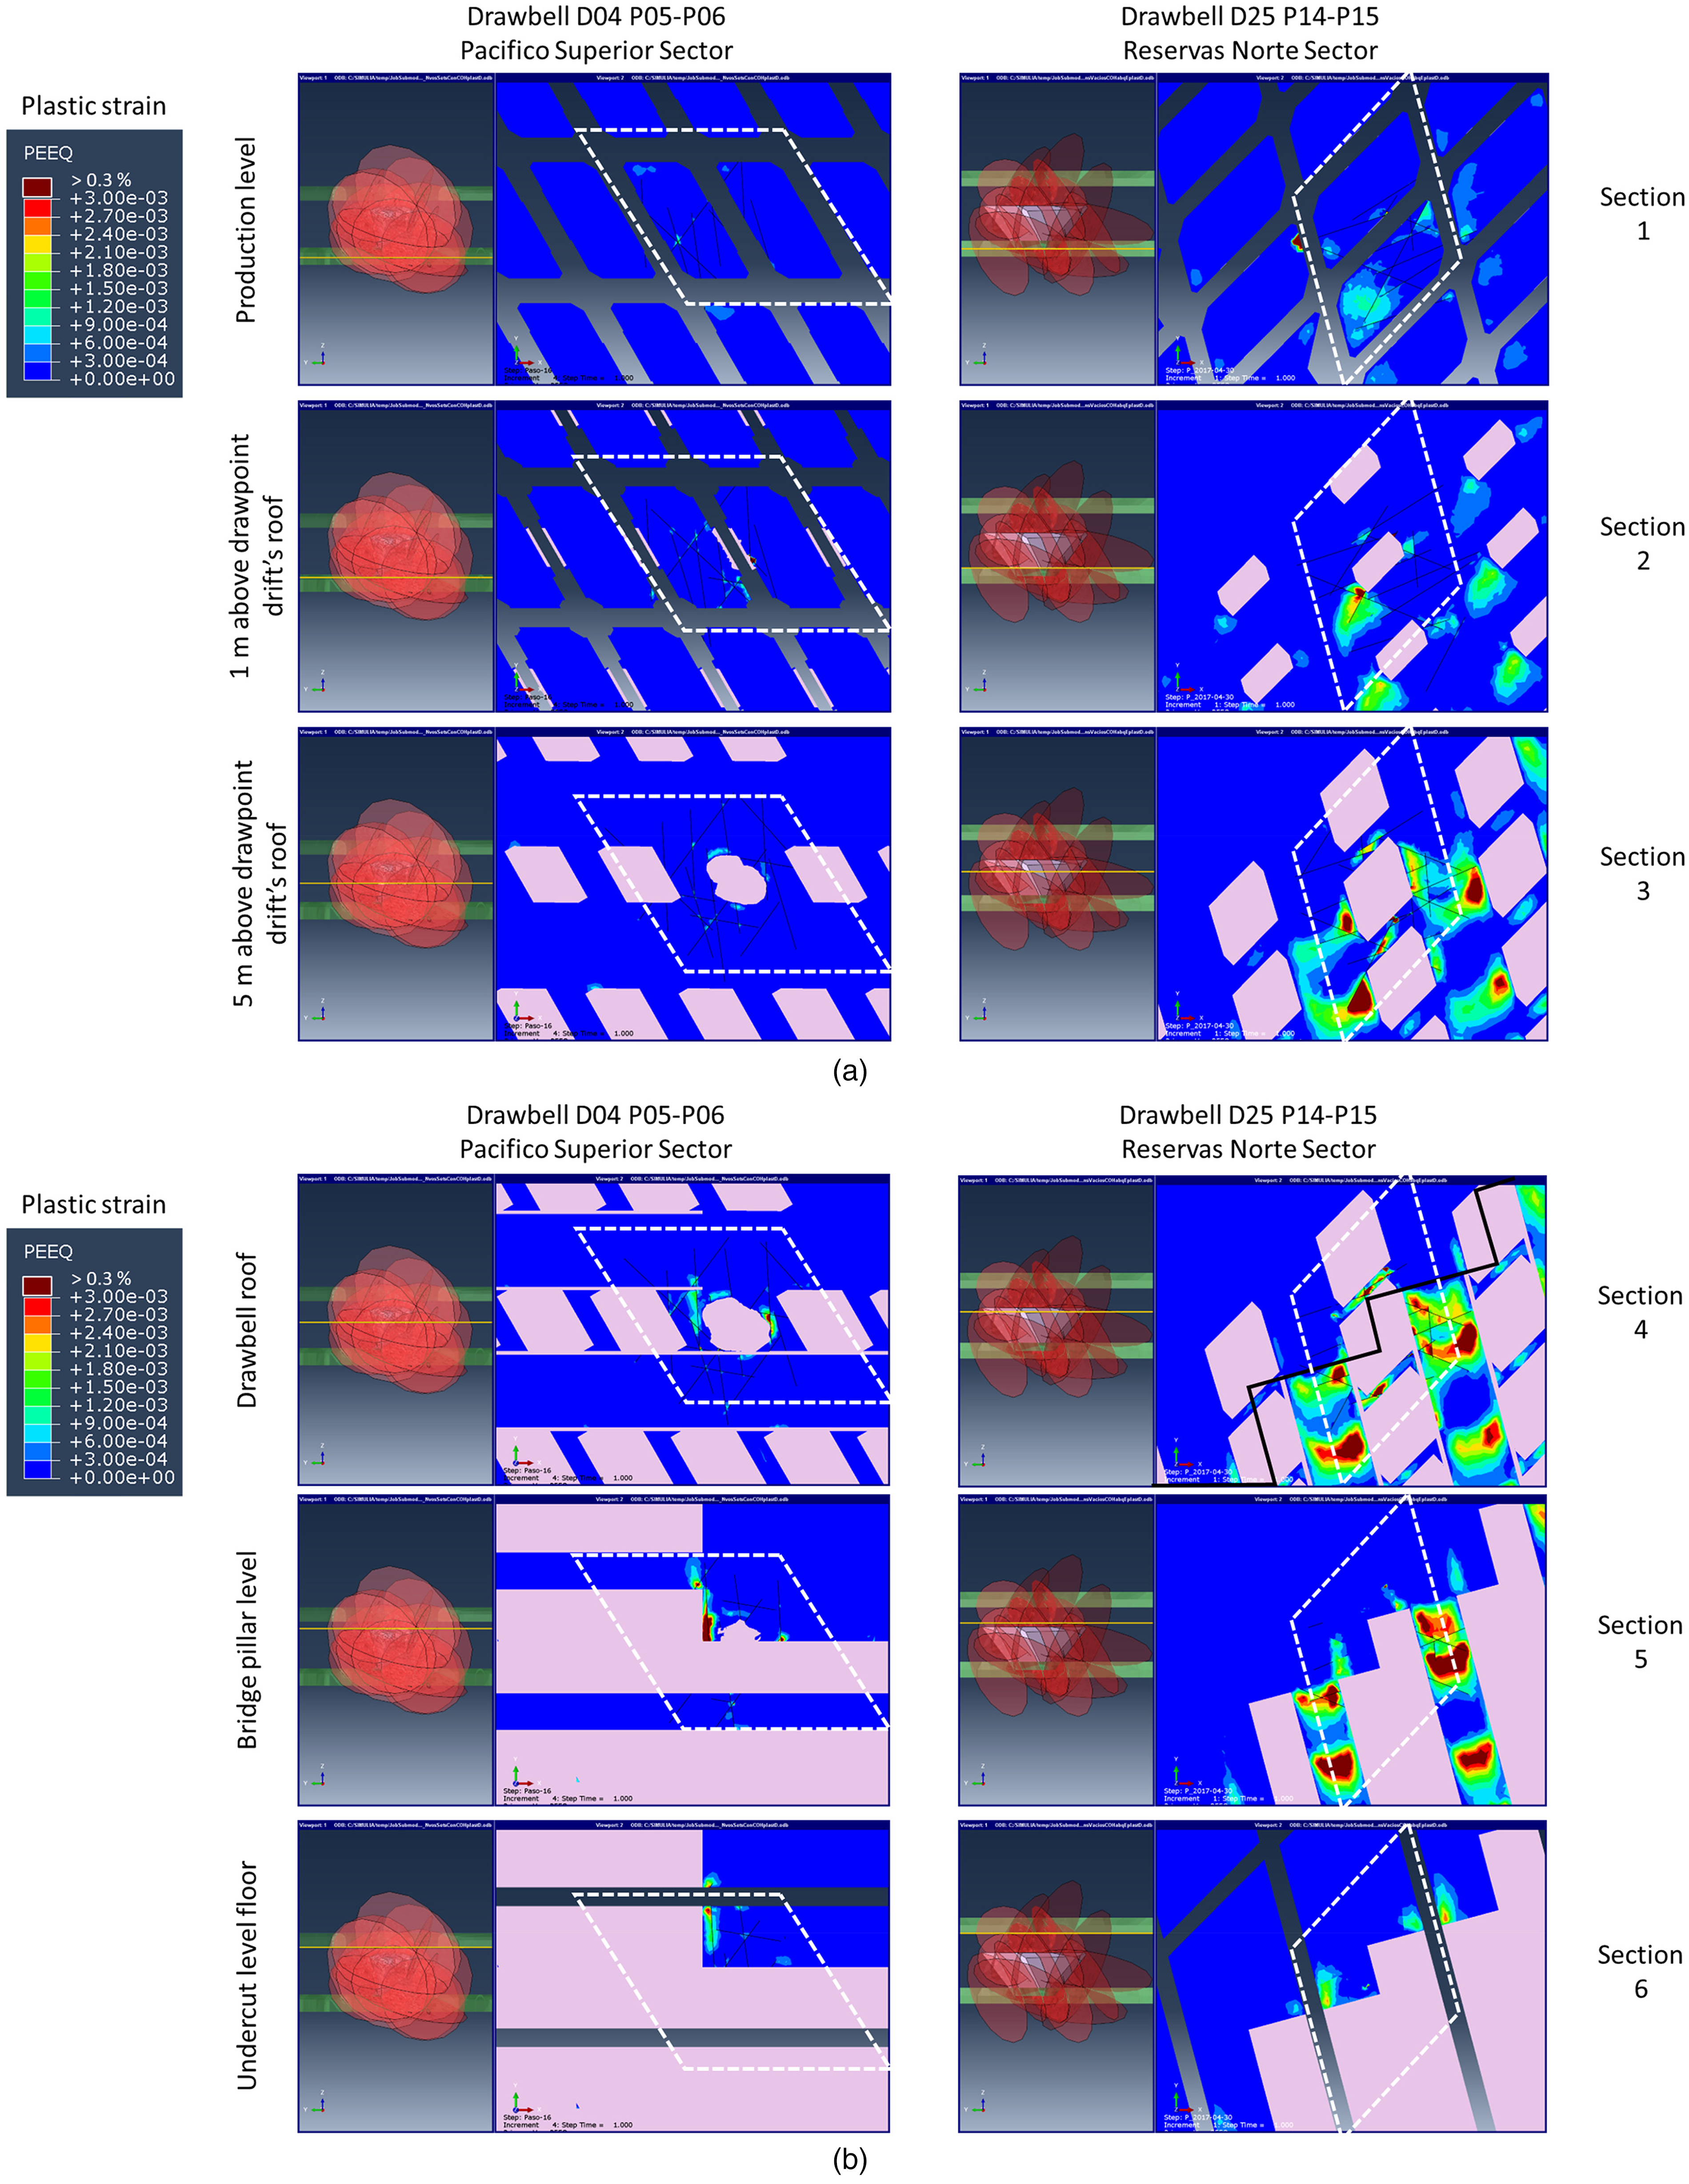
(a) Horizontal planes of PEEQ at D04P05P06 in Pacifico Superior Sector and at D25P14P15 in Reservas Norte Sector. (b) Horizontal planes of PEEQ at D04P05P06 in Pacifico Superior Sector.
It can be concluded that both drawbells could experience local instability under the predicted levels of plastic deformation. Those damaged zones are more likely to appear in the Reservas Norte drawbell. However, the values and volume showing larger plastic strain seem insufficient to indicate that pillars would become unstable due to progressive failure (Bustos, 2022; Pardo, 2015).
The most important zones for production-level stability are the drawpoint drift (Numerical model description section) and bridge pillar (Conclusion and further reading section). The drawpoint drift zone must remain stable over the lifespan of the production cycle. The bridge pillar is a temporary pillar that must remain to allow drilling and blasting operations through its rock mass. However, the damage to this zone might affect the blastholes causing difficulties during pillar blasting (Figure 17). In those cases, the block caving method is susceptible to remanent pillars, as indicated before. In addition, the previous analysis indicated that the confinement in this zone is high, so the likelihood of dynamic failure is greater.
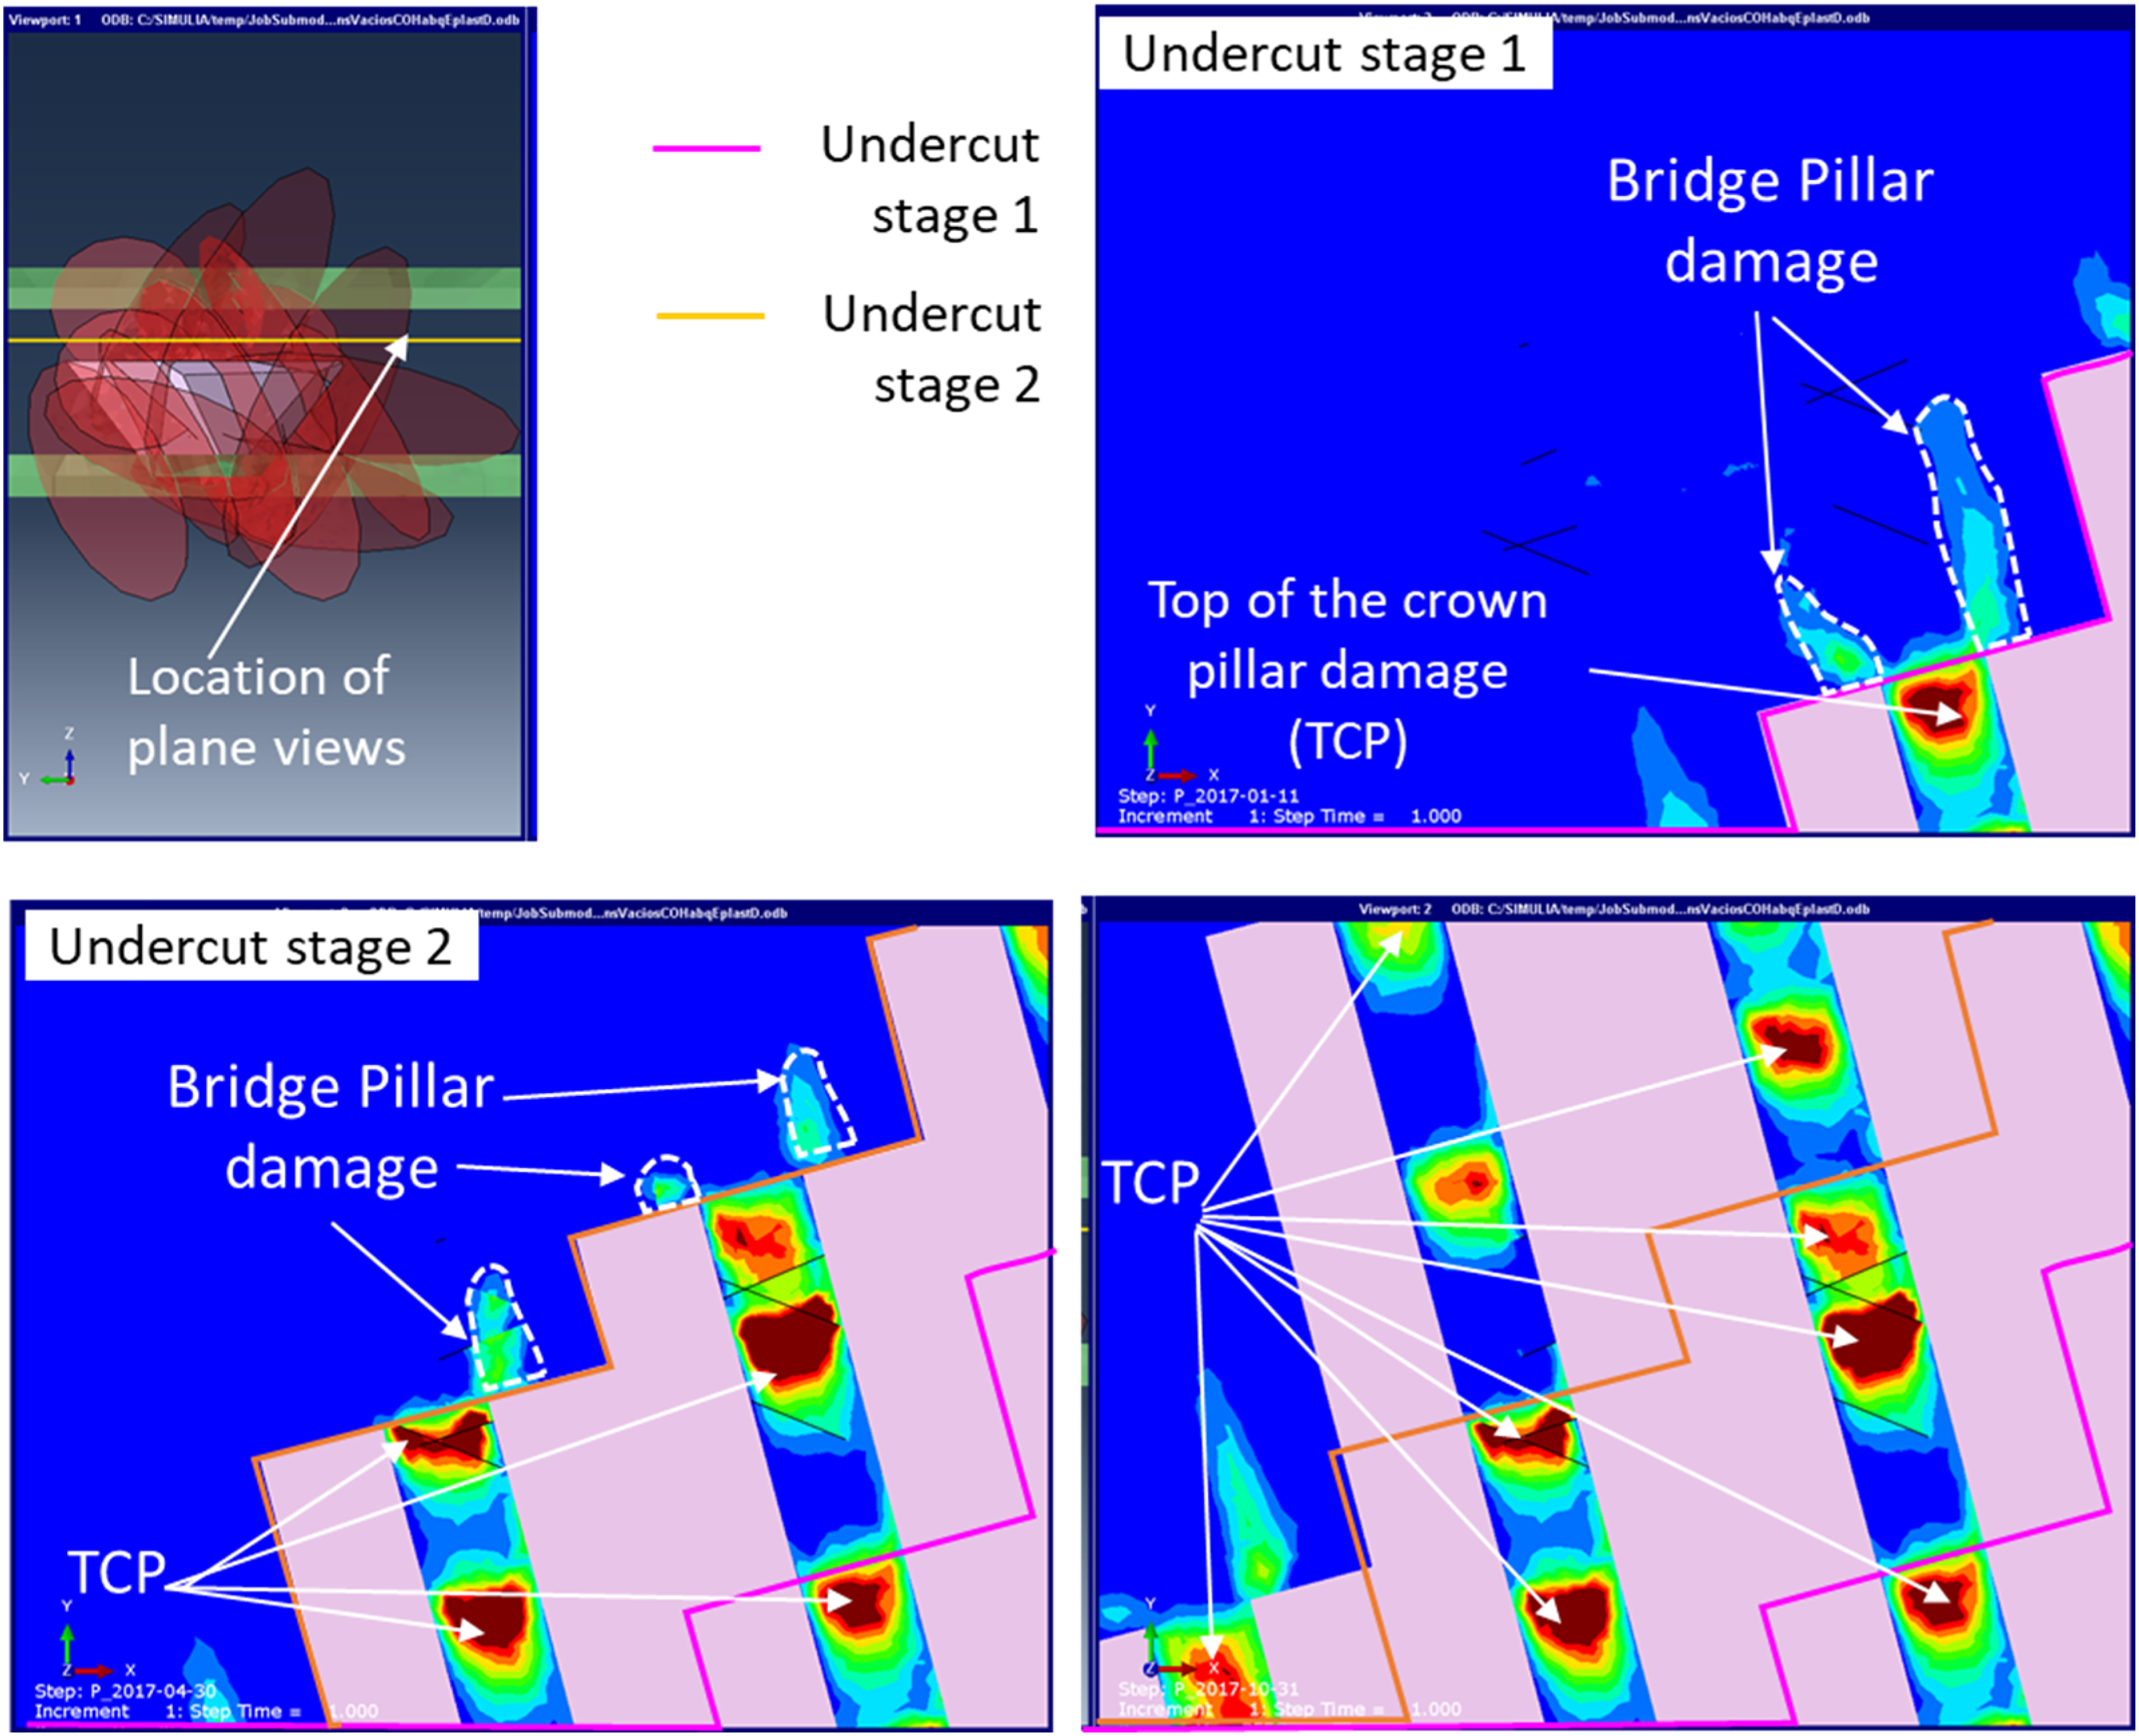
Plastic strain affecting the top of the crown pillar and bridge pillars at different undercutting stages for Reservas Norte Mine.
The Reservas Norte sector experienced a local progressive failure in one crown pillar during 2016 (Rivera et al., 2016), at less than 100 m from this analysed drawbell. If blast damage occurs, the surrounding structures could be weakened. This phenomenon would concentrate the plastic deformation and might define a considerably larger volume experiencing plastic deformation, which could lead to a progressive failure (collapse). The local distribution of stresses varies according to the location of the undercut front. In areas where the risk of failure of the bridge pillar is greater, the operational planning might include this parameter in the schedule, trying to reduce the blasting periods above the opened drawbells.
Discussion
Further analysis was undertaken using the IGD platform to compare three drawbell scale results, one located at each of the mining sectors. An example combining deviatoric stress, FoS, seismicity, CMS results and the dynamic burden is shown in Figure 18, at 7.6 m above the drawpoint's drift roof. The Reservas Norte drawbell seems less stable when comparing deviatoric stress than the other two mines. However, the values are lower than 60 MPa for the three drawbells, suggesting no excessive damage would be experienced (Bustos, 2022). The Reservas Norte drawbell concentrates the highest levels of deviatoric stress, having structures showing larger unstable areas. Also, the rock mass shows a total of 17.6% of points above the Mohr–Coulomb envelope, while only 4.3% and 1% are shown for the Esmeralda and Pacifico Superior drawbells, respectively.
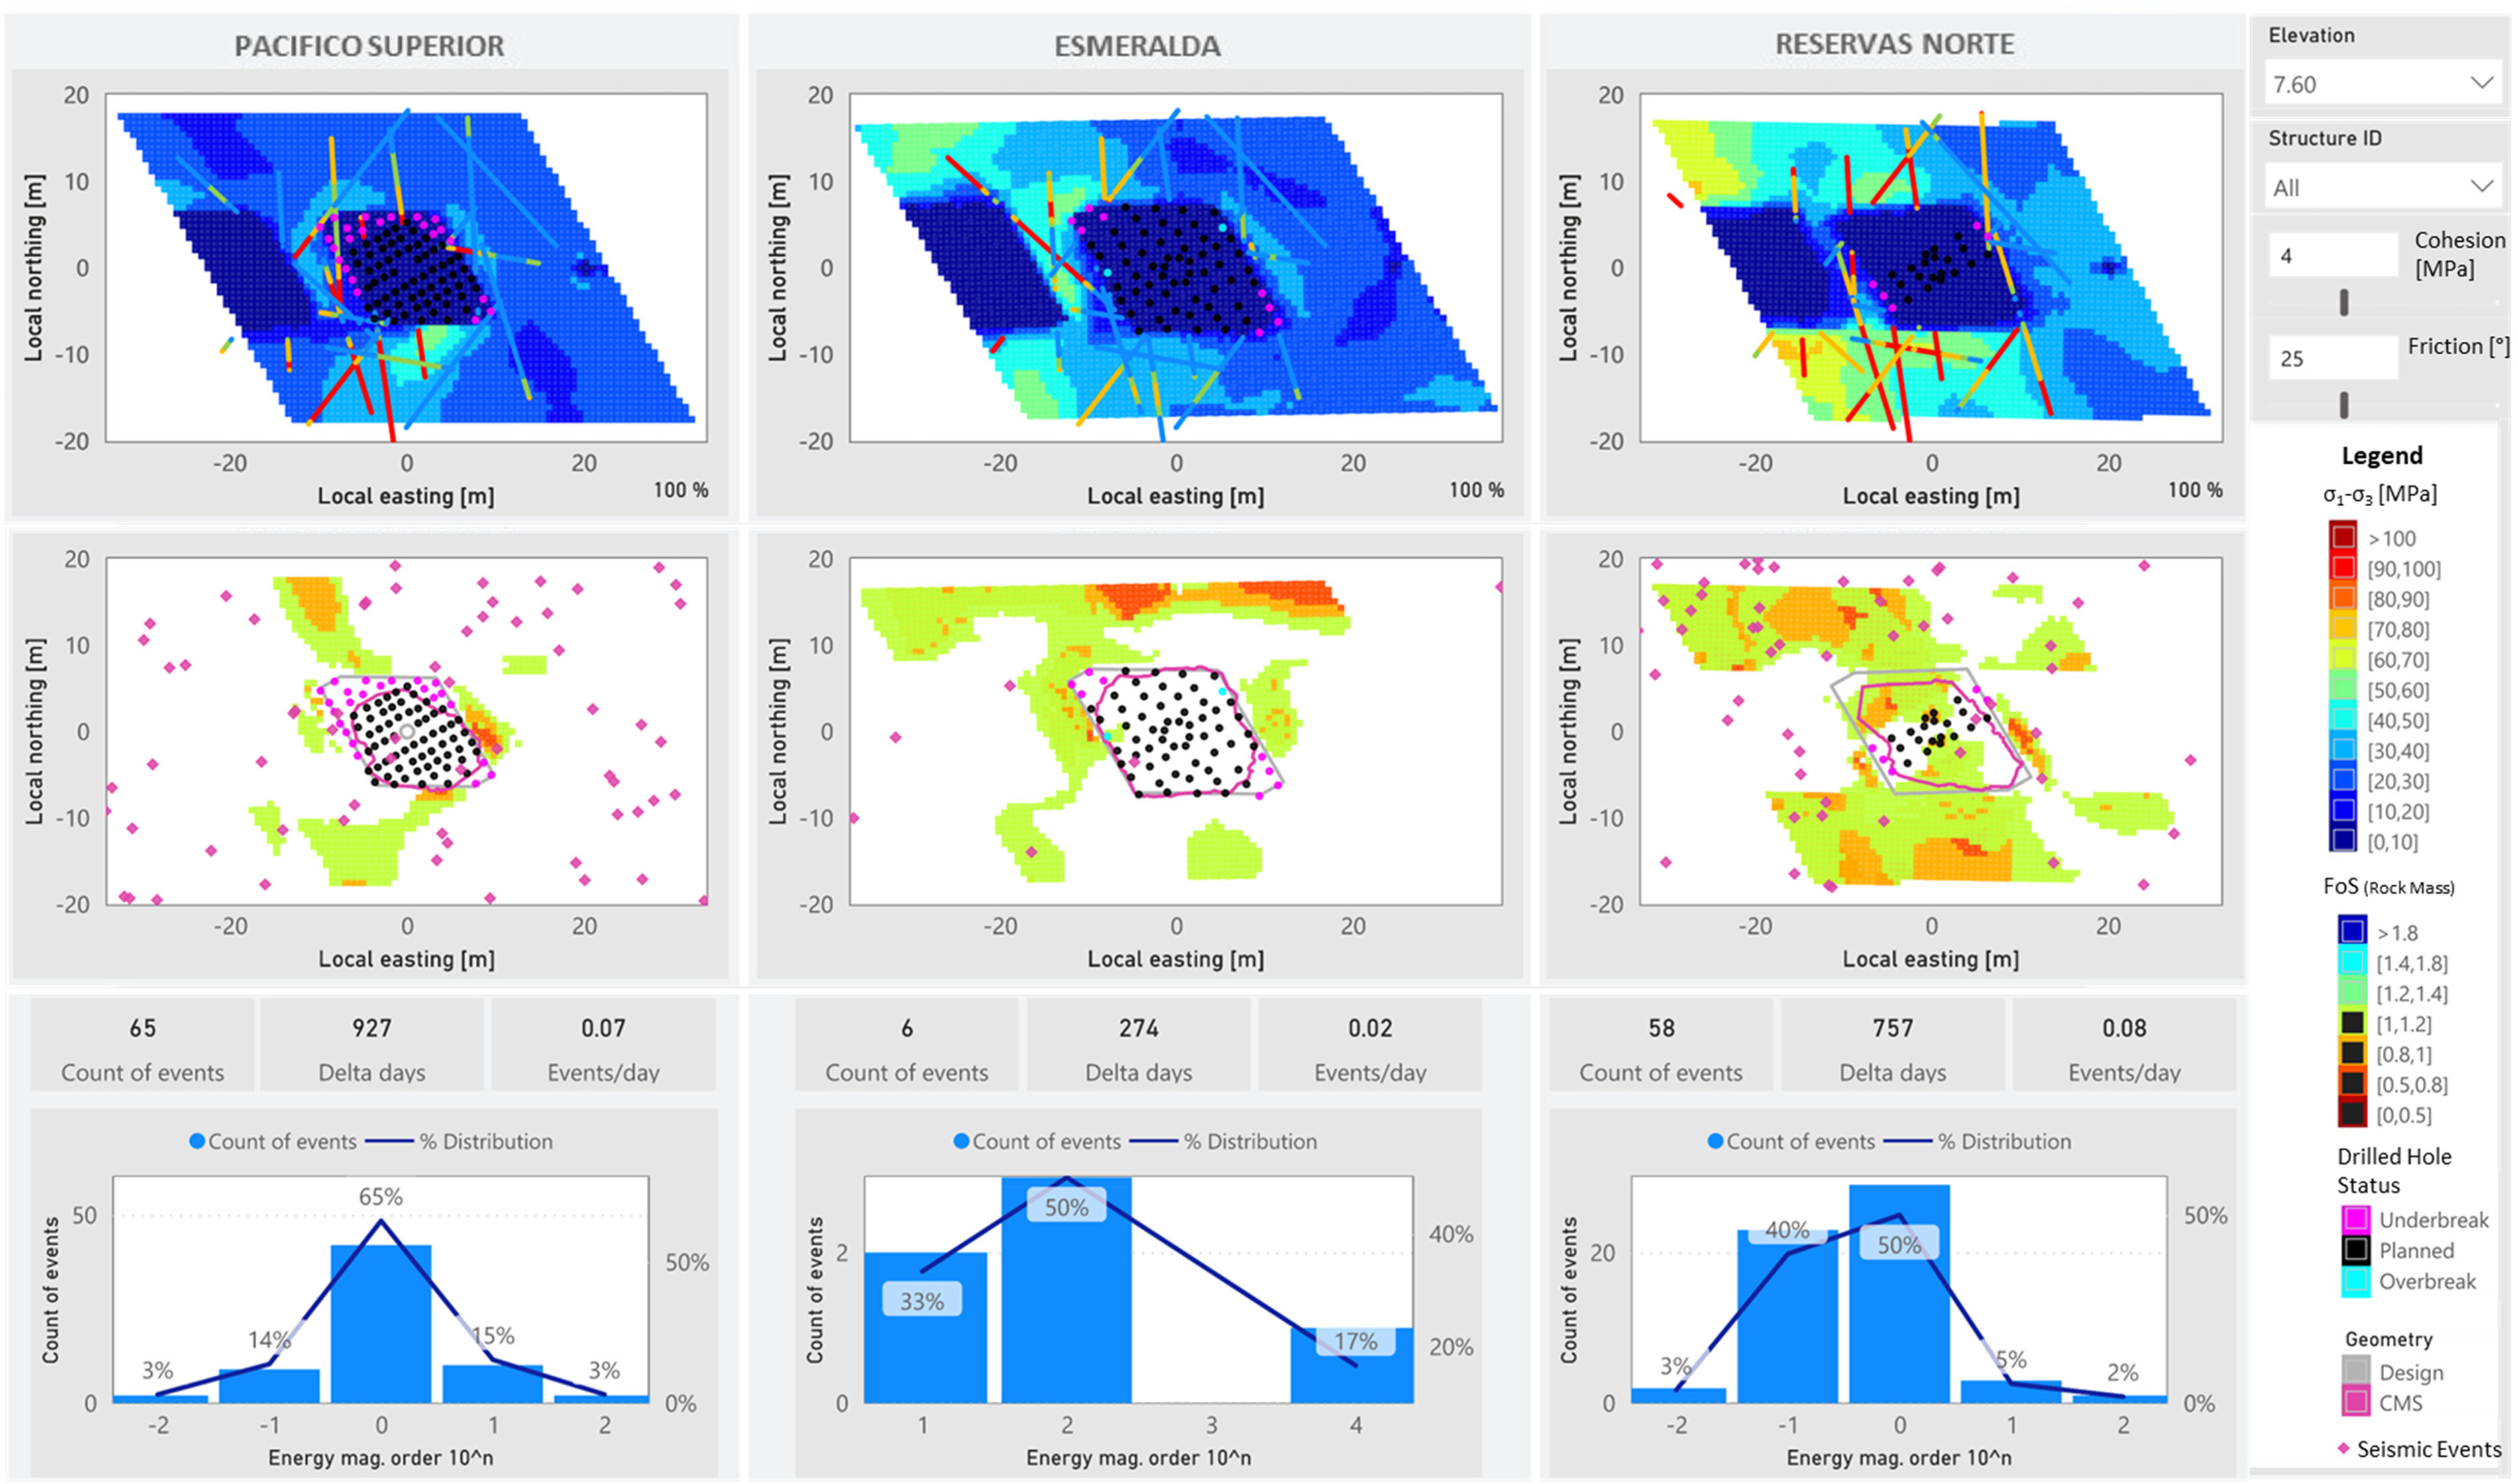
Integrated stress analysis results within the IGD for drawbell analysis.
The drilled hole status is indicated in three colours, black for holes meeting the planned criterion. Holes resulting in overbreak are shown in cyan colour. Similarly, holes resulting in underbreak with respect to the planned cavity shape are shown in magenta. It can be seen that the holes located in the boundary and acute corners show underbreak status, which has been associated with large burden requirements and confined blast issues, among other problems detailed in Bustos et al. (2023)
In terms of structures, a total of 45% of traces located at this height are unstable in the Reservas Norte Drawbell, indicating much higher chances of experiencing seismic activity during its lifespan. In comparison, 2% and 3% are found unstable for Pacifico Superior and Esmeralda at the same step, respectively. The results show that although the rock mass may be stable, the Reservas Norte rock mass is experiencing a progressive strength deterioration. The seismic events around the Esmeralda drawbell are few, and their energy was greater, while the Reservas Norte drawbell experienced many more events with less energy.
Critical zones
A comparison of the three drawbells showing the four critical zones described in previous sections is presented in Figure 19.
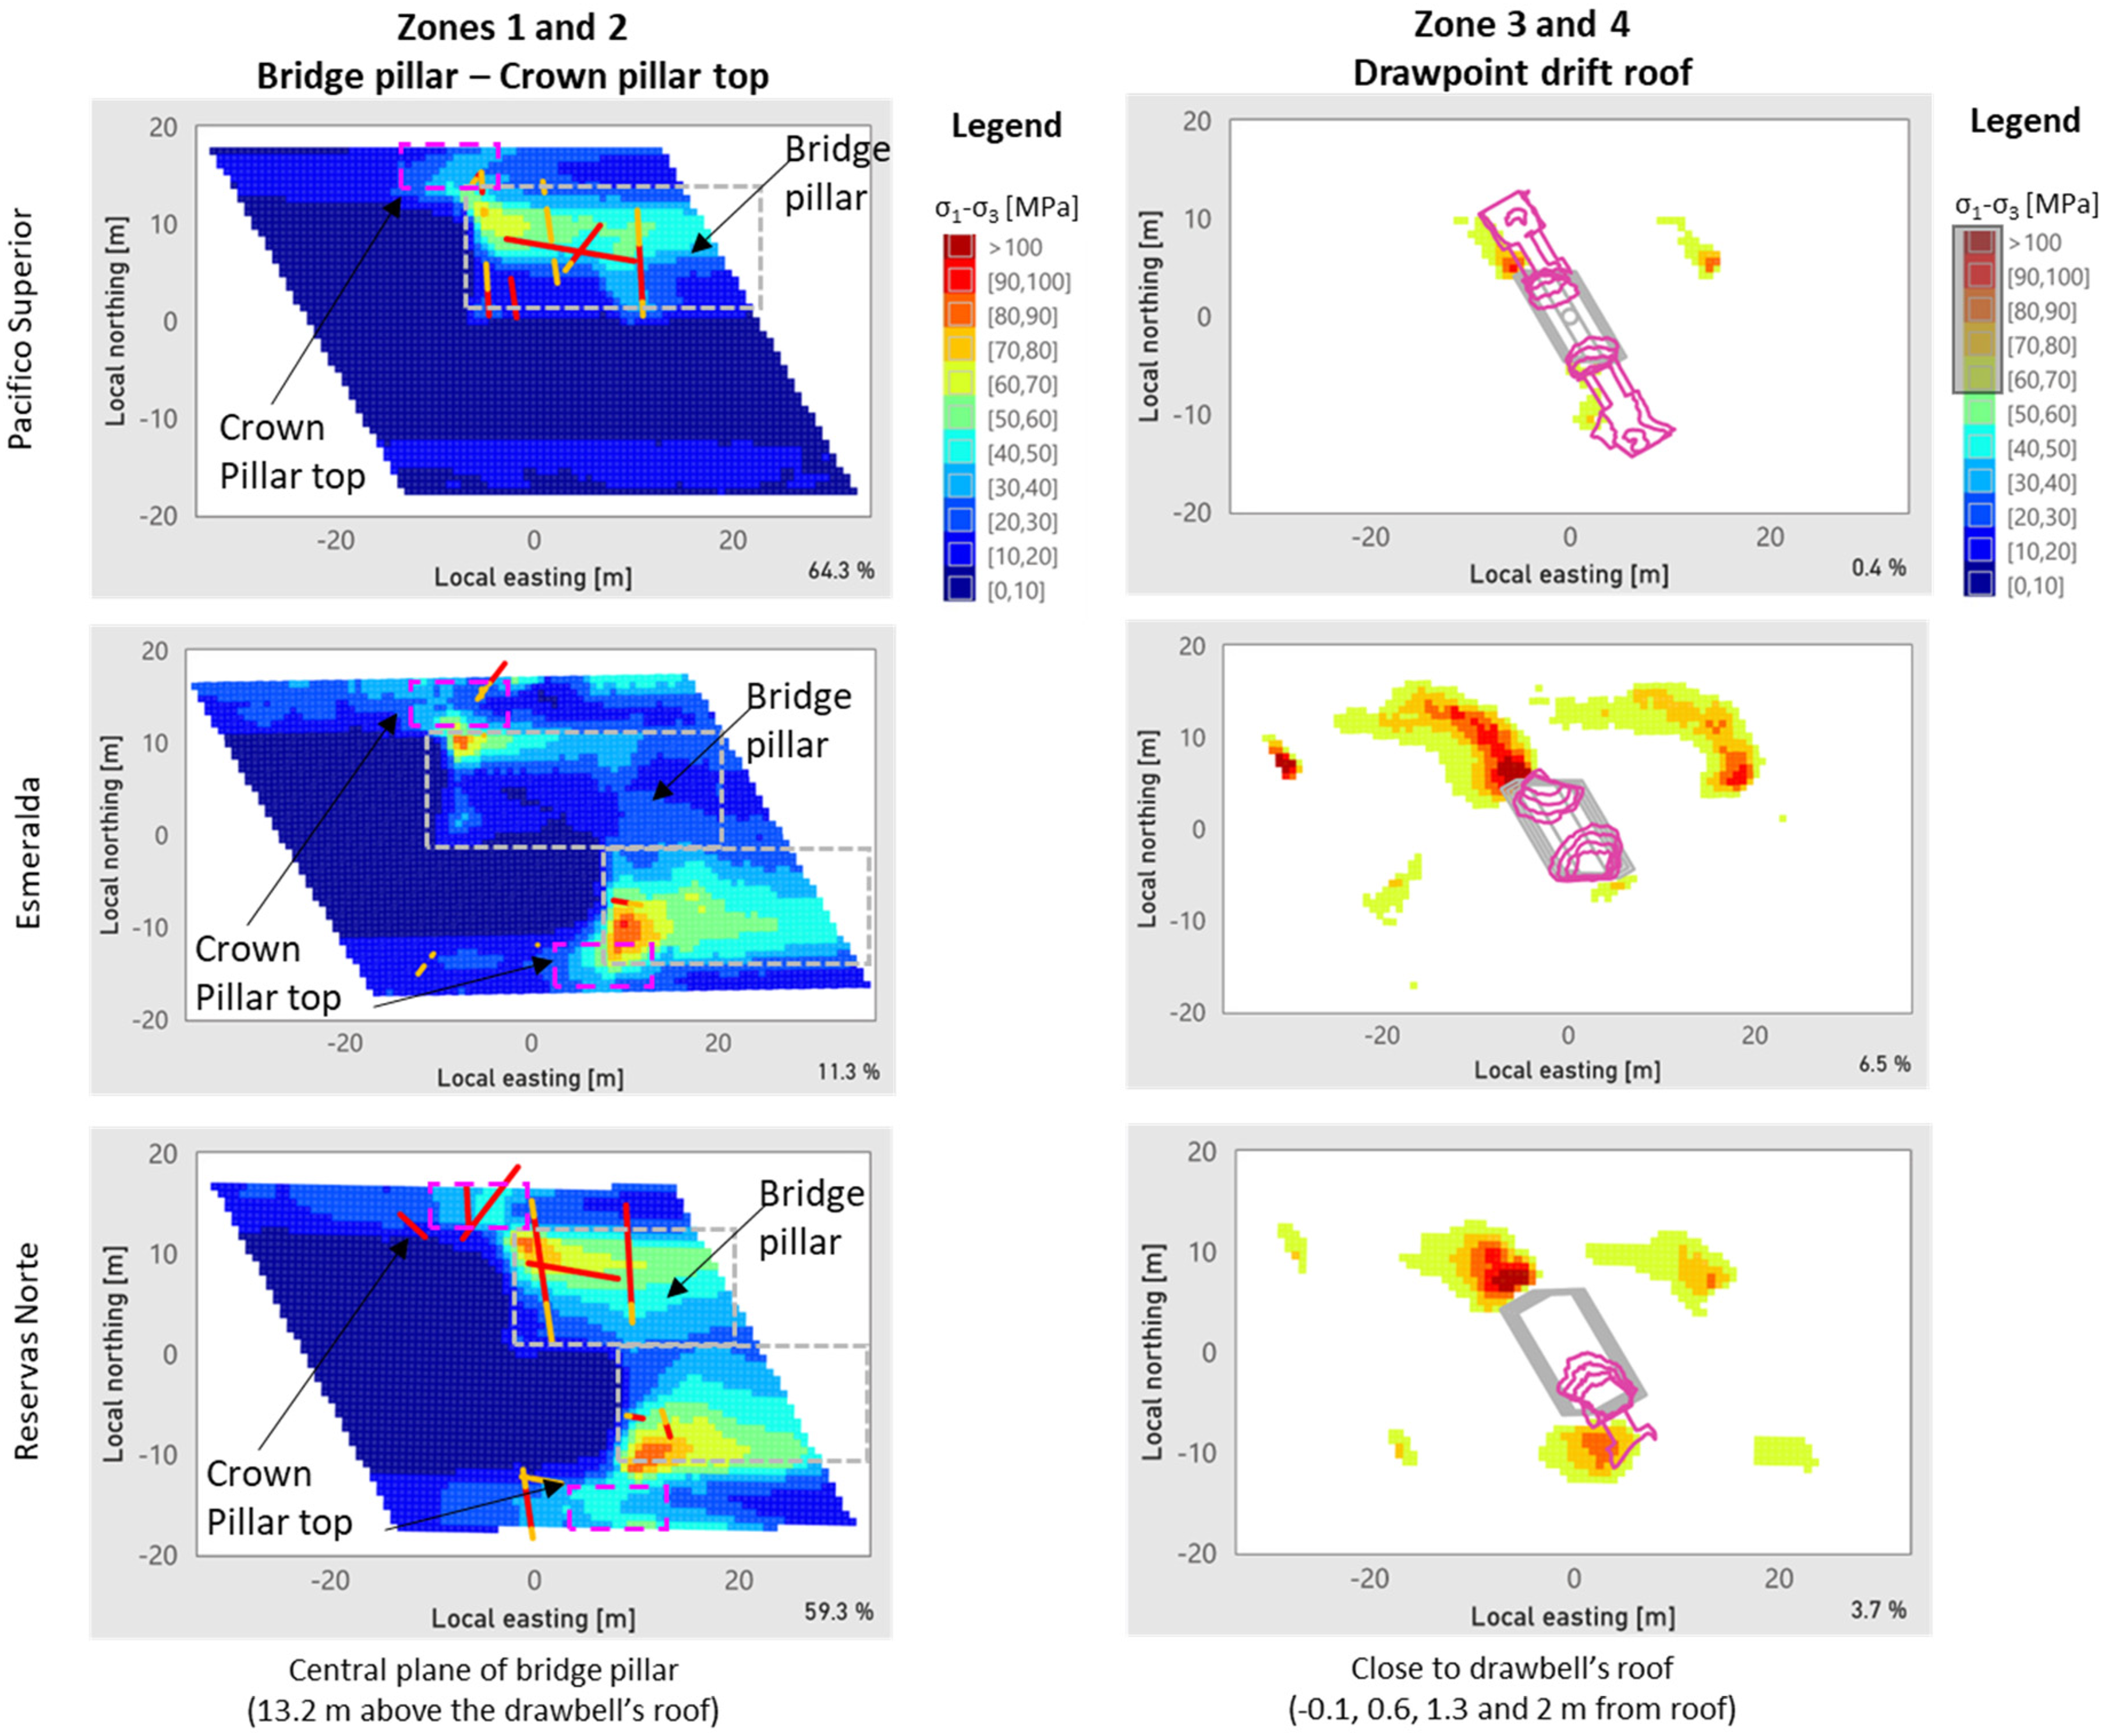
Instability at critical zones.
The bridge Pillar (Zone 1) and the top of the Crown Pillar (Zone 2) are shown on the left side of Figure 19. The structures showing Safety Factors lower than 1.3 are a total of 64%, 11% and 59% for Pacifico Superior, Esmeralda and Reservas Norte drawbells, respectively. The numbers are consistent with the seismic analysis indicating that Esmeralda is located in a more confined area and whose bridge pillar might experience dynamic failure. At Pacifico Superior and Reservas Norte bridge pillars, the stability of the drilled holes can be affected by the stress conditions.
The analysis for drawpoint drift, commonly named brows (Zones 3 and 4), is shown on the right side of Figure 19. The deviatoric stress greater than 60 MPa is displayed, and all the points that are above the Mohr–Coulomb envelope indicate failure. Those points were calculated using the last three modelled steps, representing 0.4%, 6.5% and 3.7% of damage for the Pacifico Superior, Esmeralda and Reservas Norte drawbells. These observations do not consider hangups over a drawpoint, which might locally overload Zones 3 and 4 when this phenomenon occurs. Also, this is more probable when the drawbell geometry is not correctly achieved, as previously studied in Bustos et al. (2023), due to blasting and drillhole deviation problems of typical drawbell shapes.
The unstable zone is defined at the drawpoint drift immediately ahead of the front cave. In this zone, induced damage from blasting must be avoided and considered during the drawpoint drift development and blasting of the drawbell.
The analysis of these four critical zones indicates that the schedule of mining activities requires the inclusion of the different variables analysed here. If within a particular location where a drawbell will be constructed, the geotechnical analysis predicts that structures are likely to fail progressively, then the blasting activities must be done quickly, so the cave front can rapidly advance through that zone. If the stress conditions indicate a high risk of dynamic failure, a suggested further work would be to analyse the need for preconditioning, which might be required before the blasting of the drawbell.
Conclusions and further work
A methodology that includes detailed sub-models at the scale of a drawbell has been thoroughly described, including the calibration process followed in a large mine scale model.
The comparison between in-situ stress measurements and modelled values indicated differences in the range of 10 MPa. The comparison with AE measurements revealed a smaller error. It is concluded that values showing more differences could be located closer to geological features not represented accurately in the model, or measurements could be taken under induced stress conditions not well represented in the model. Further work on calibration implied a larger number of geometrical steps to include more measurements in the calibration.
The subject of damage and monitored seismicity calibration is not new. This work presented here was based on more than a decade of model calibrations. One of the latest features in the mine scale model allowed the stress redistribution from Breccia Braden intrusion and secondary ore, which could provide an explanation for some large seismic events during tunnel access for the New Mine Level.
The sub-model results were studied using the IGD platform, allowing a quantitative analysis to compare all the variables influencing a drawbell performance. The analysis at the drawbell scales included seismicity, structures and plastic strain damage analysis. In general terms, it is observed that the minor principal stress (confinement) seems to control the nature of the seismic behaviour. More confinement indicates more energy released by seismic events, and low confinement indicates small events. The criteria of deviatoric stress and the factor of safety must be considered in conjunction.
The detailed numerical modelling exercises determined two critical locations in terms of stability. Those are located at the drawpoint drift and at the bridge pillar, defined as the rock mass existing between the undercut and the top of the drawbell. Bridge pillar instability might cause temporal difficulties during the subsequent undercutting process required to connect the drawbell with the undercutting level, but it also could lead to progressive failure at the production level.
A recommendation for further research is to implement a different shape of drawbell, which would need to be investigated using the same technology. Also, an IGD can be seen as a tool to schedule mining activities and help to evaluate the likelihood of progressive or dynamic failure and use the appropriate ground support technology (Villaescusa et al., 2023)
Footnotes
Acknowledgements
The authors acknowledge CODELCO – Division El Teniente for allowing the use and analysis of the data in this paper (Rivera, 2018).
Declaration of conflicting interests
The authors declared no potential conflicts of interest with respect to the research, authorship, and/or publication of this article.
Funding
The authors disclosed receipt of the following financial support for the research, authorship, and/or publication of this article: This work was supported by the National Agency for Research and Development (ANID)/Scholarship Program/DOCTORADO BECAS CHILE/2017 (grant number 72180287).