
Abstract
Drawbells allow disassembled ore to be extracted from the production levels in block cave mines. As part of the construction process, blast damage must be minimised, enabling the remaining rock mass surrounding the drawbell to sustain the induced stress during the different stages of a block-caving operation for a successful mine plan extraction and ore recovery.This paper proposes two approaches for the geotechnical evaluation of drawbell blast performance. Initially, the expected dynamic burden is calculated along the length of the blasthole and used to assess surveyed blast holes. Secondly, the design compliance is evaluated using the Radial Distance of Over/Underbreak concept, which compares designed and scanned shapes relative to height and radial orientation.The results have identified confined blast zones at the top and around the corners of drawbells. Excessive confinement may cause damage to the pillars and negatively impact the stability of the production level.
Keywords
Introduction
A correct blast design for drawbells must consider three major aspects: achieving the design shape, minimising blast damage, and achieving a correct fragmentation that allows the extraction of the blasted material (Brown 2007; Chitombo 2010). Research on geometry parameters focused on draw interaction has been analysed by others (Castro 2006; Halim et al. 2008; Pierce 2010; Dorador et al. 2021), and it is not the subject of this paper. The scope is focused on drawbells assuming that flow design conditions work well, when a particular design is implemented correctly. Therefore, the first two aspects, which are more related to geotechnical stability, are analysed in this paper (Bustos 2022).
Drawbells are large funnel-shaped voids, usually drilled using up-holes. These up-hole drilled shapes represent an operational challenge, as drillhole deviation is not uncommon. Large deviations can lead to poor blasting results, impacted by excessive confinement as a direct result of poor drilling or the lack of free face available due to poor design practices (Bustos et al. 2020).
Rock mass damage during drawbell construction must be kept as minimal as possible. This is even more important in the surrounding block caving infrastructure, which is long-lasting. This is particularly important in the current geotechnical environments, as block caves are getting deeper, and the induced stress approaches the inherent strength of the rock mass (Bustos 2022; Villaescusa et al. 2023).
Geometry description
Drawbell blasting in post-undercutting
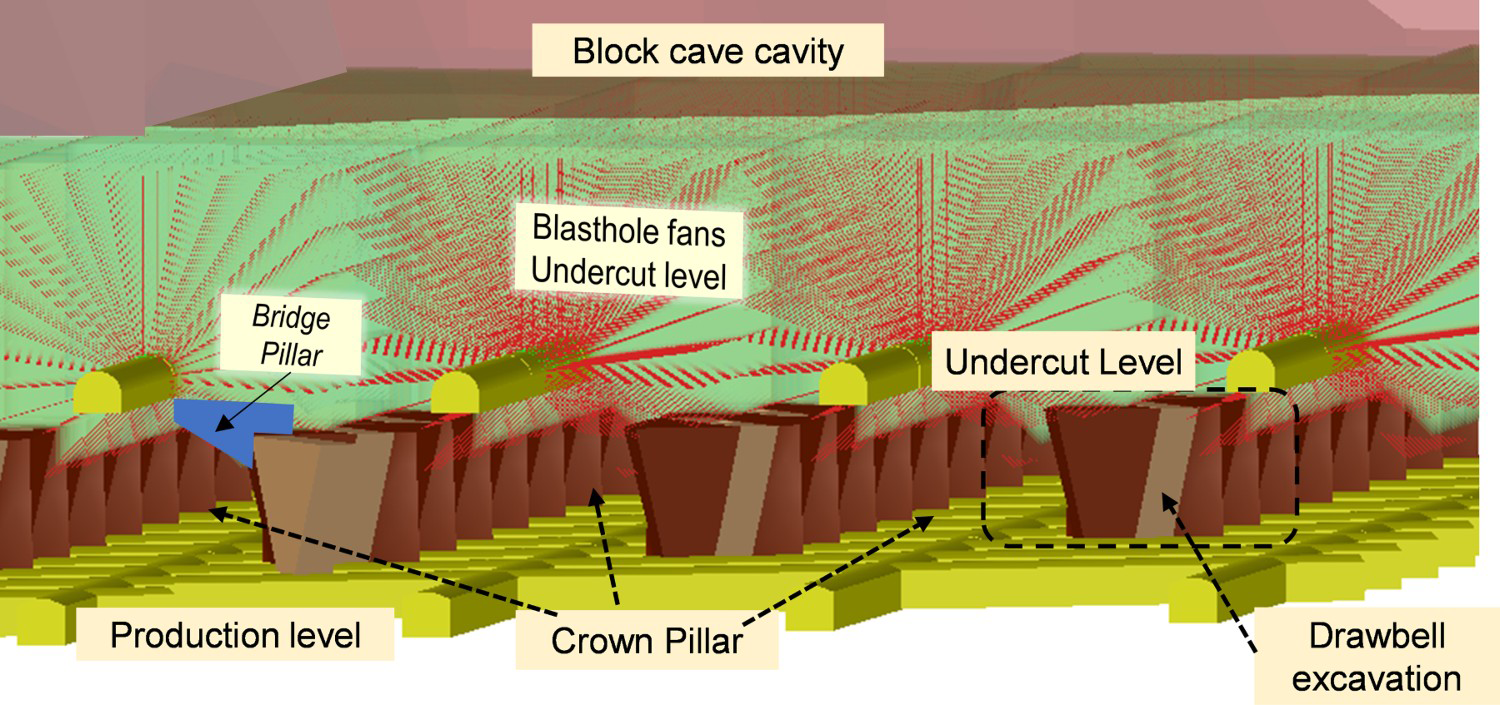
A drawbell is a funnel for broken rock that allows the extraction of the rock, connecting the undercut level, where the rock mass starts breaking, with the production level of block caving mines allowing the rock to flow within drawpoints (Bustos 2022). In a post-undercutting method (Rojas et al. 2000; Brown 2007), the final drawbell geometry is created from the undercut and production levels in two stages. The first part of the shape is called drawbell excavation within this paper (Figure 1). It is created as a funnel at the production level, using up-hole drilling and a blast sequence detonating around an initial slot (usually an up-hole raise). The final connection is created using drilling and blasting fans from the undercut level (Figure 2). After this connection, the final drawbell shape cannot be directly geometrically assessed; therefore, any analysis must be undertaken for the initial stages of a drawbell excavation. Additionally, the remaining rock closer to the production level (Figure 1) is more affected by the construction of this section of a drawbell, as it is adjacent to it.
Drawbell shape and rock mass surrounding the excavated rock mass. Isometric view of the El Teniente style layout, using a conventional (post-undercutting) strategy.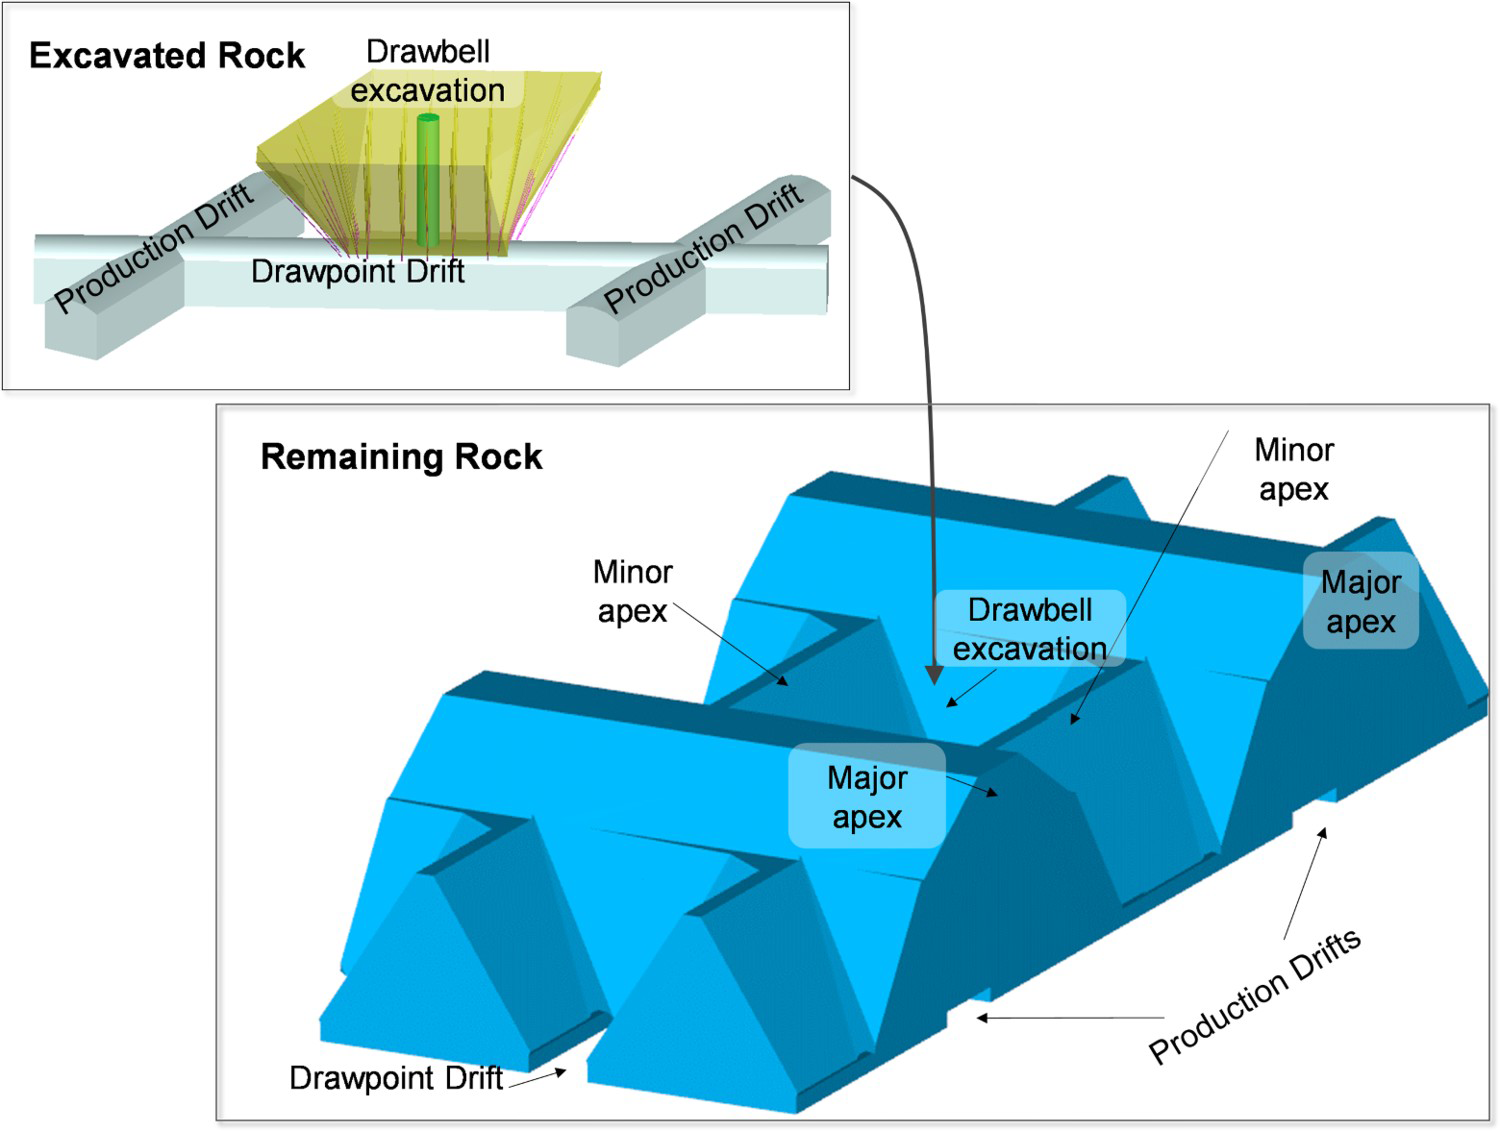
Blast assessment methodology
A successful drawbell blast design should ensure that all distributed explosive charges contribute to the breakage and fragmentation process. In this context, an adequate void formation that allows for the formation of new free faces is necessary to promote tensile reflections from primary waves and thus effectively contribute to the fracturing process. Central to this is the sequence of detonation, which defines the dynamic burden or the distance of a charge to a newly formed free face. Each blasthole requires connecting a previous scheme of blasted holes to achieve a certain shape and form a free face. Figure 3 shows a typical pattern used for drilling drawbells in the El Teniente post-undercutting layout. The design burden and spacing distances shown in Figure 3 are static geometric parameters generally used to report the separation between up-holes rings and the distance between holes within a ring. These geometric distances are not relevant if an evaluation of the detonation sequence is required. Hence, the concept of dynamic burden is more applicable and introduced in this paper to assess drawbell blasting. The concept, however, is not restricted to drawbell blasting as it could be applied to a range of underground uphole or downhole ring configurations, including long-hole winzes (LHW) and underground mass firings.
Drilling patterns in a typical drawbell used for El Teniente Layout. Modified from Bustos et al. (2020).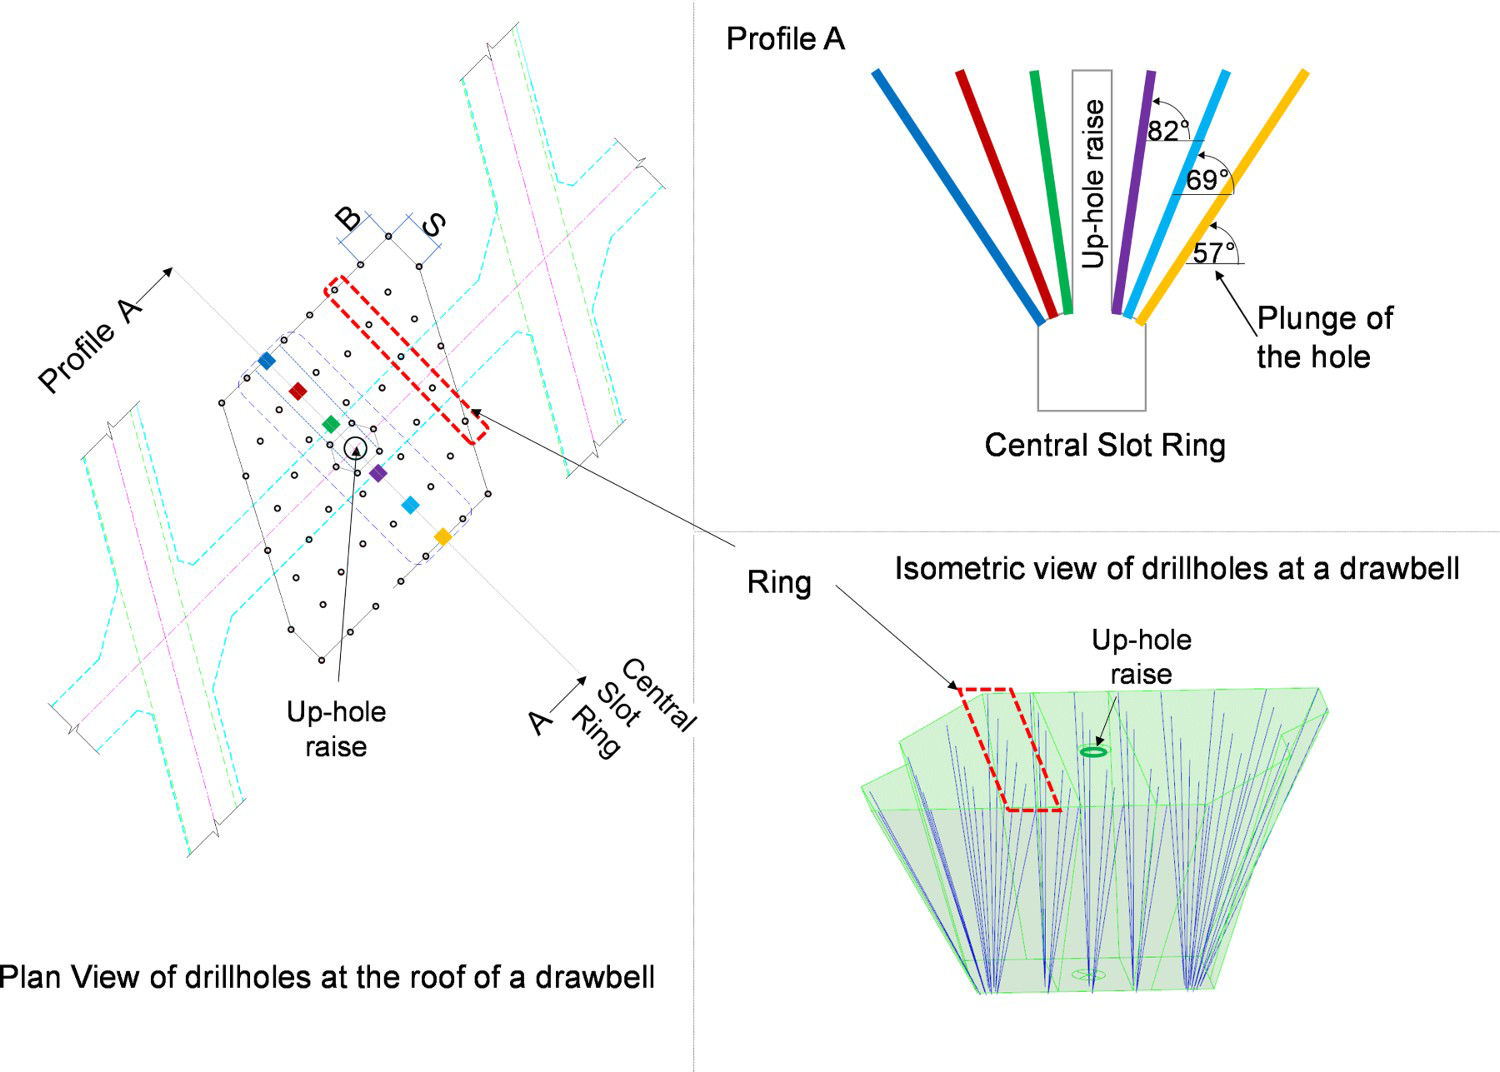
Dynamic burden concept
Dynamic burden corresponds to the minimal distance at a certain vertical height between the central point in a detonated blasthole and the closest free face. It is called dynamic because each burden calculation depends on the results of every one of the holes previously fired. The concept of dynamic burden has also been discussed by others, but there is limited information associated with how this burden distance can be estimated. A criterion to estimate dynamic burden calculation was previously proposed by Persson et al. (1994) to support the design of development blasting drillhole layouts.
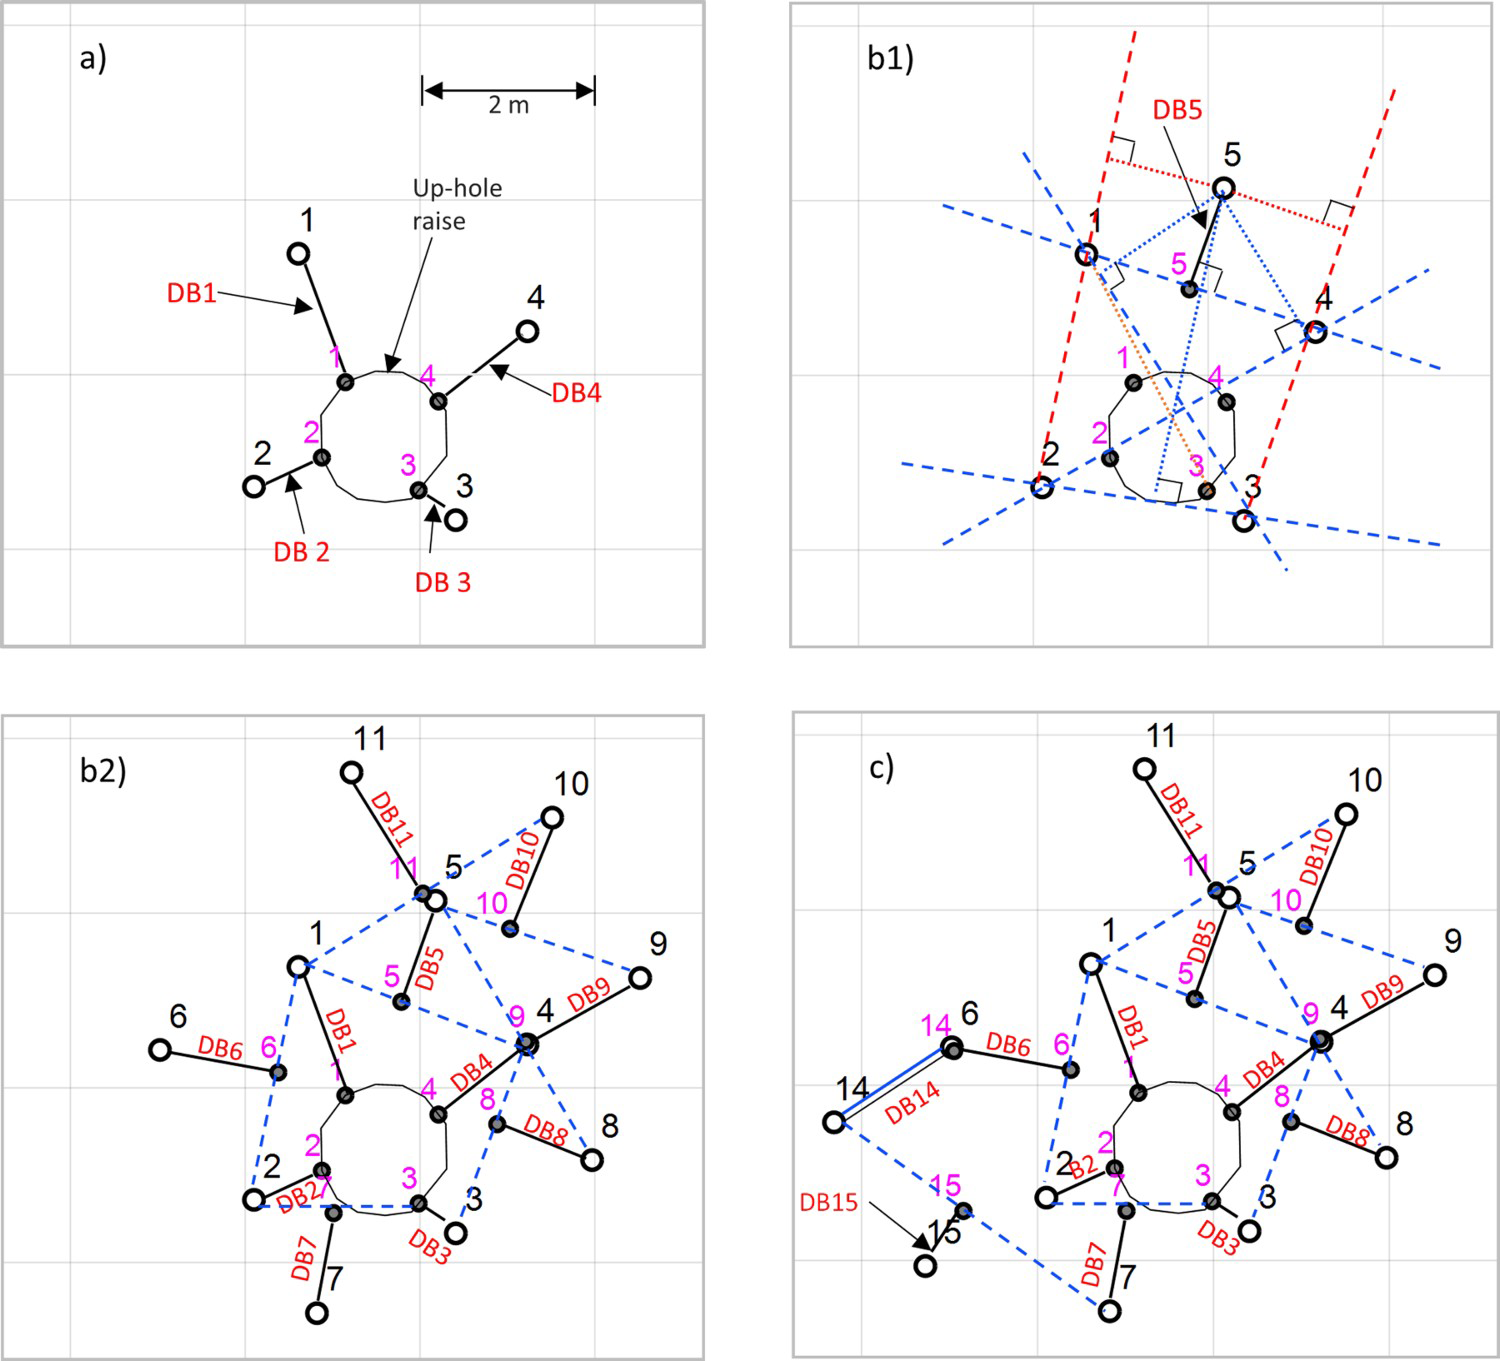
In this work, the dynamic burden is calculated as a horizontal distance from a drilled hole to a defined free face by a relative level (R.L.) starting upwards from the drawpoint roof. Each of the drilled holes was numbered according to its designed timing sequence. A Bn (n = hole number according to the timing) was calculated as the minimal distance between calculations a, b and c:
The perpendicular distance between each hole to the closest border of the up-hole raise (see Figure 4(a)). The closest perpendicular distance to a line connecting two previously detonated holes. Figure 4 b1 shows an example in detail for the calculation for hole 5. A scheme with a progressing result for holes 1–11 is shown in Figure 4(b2). Distance between all the holes: In some particular locations, the distance between the line formed for two holes previously blasted is larger than the direct distance between 2 holes. An example of it occurs in Hole 14 shown in Figure 4(c). Example of dynamic burden distances (DB) calculation for a drawbell blasted using a circular detonating pattern.
A MATLAB script was developed to automatically calculate the dynamic burden. The results from each dynamic burden can be classified as per planning or causing overbreak and underbreak according to the relative position they had with respect to the resulting shape, as it is shown in Figure 5. The figure shows three different elevations of hole location within the two blast stages, slot and surrounding drawbell shape. The lowest elevation analysed is located 8.3 m above the roof of the drawpoint drift, while the highest is the roof of the drawbell, 11.1 m. The underbreak areas increased with height and were located at the acute corners of the shape (Northeast and Southwest corners). Below the 8.3 m elevation, some overbreak measurements were registered at the borders of the slot shape, as shown in the isometric view.
Drillhole location at three different heights inside a drawbell.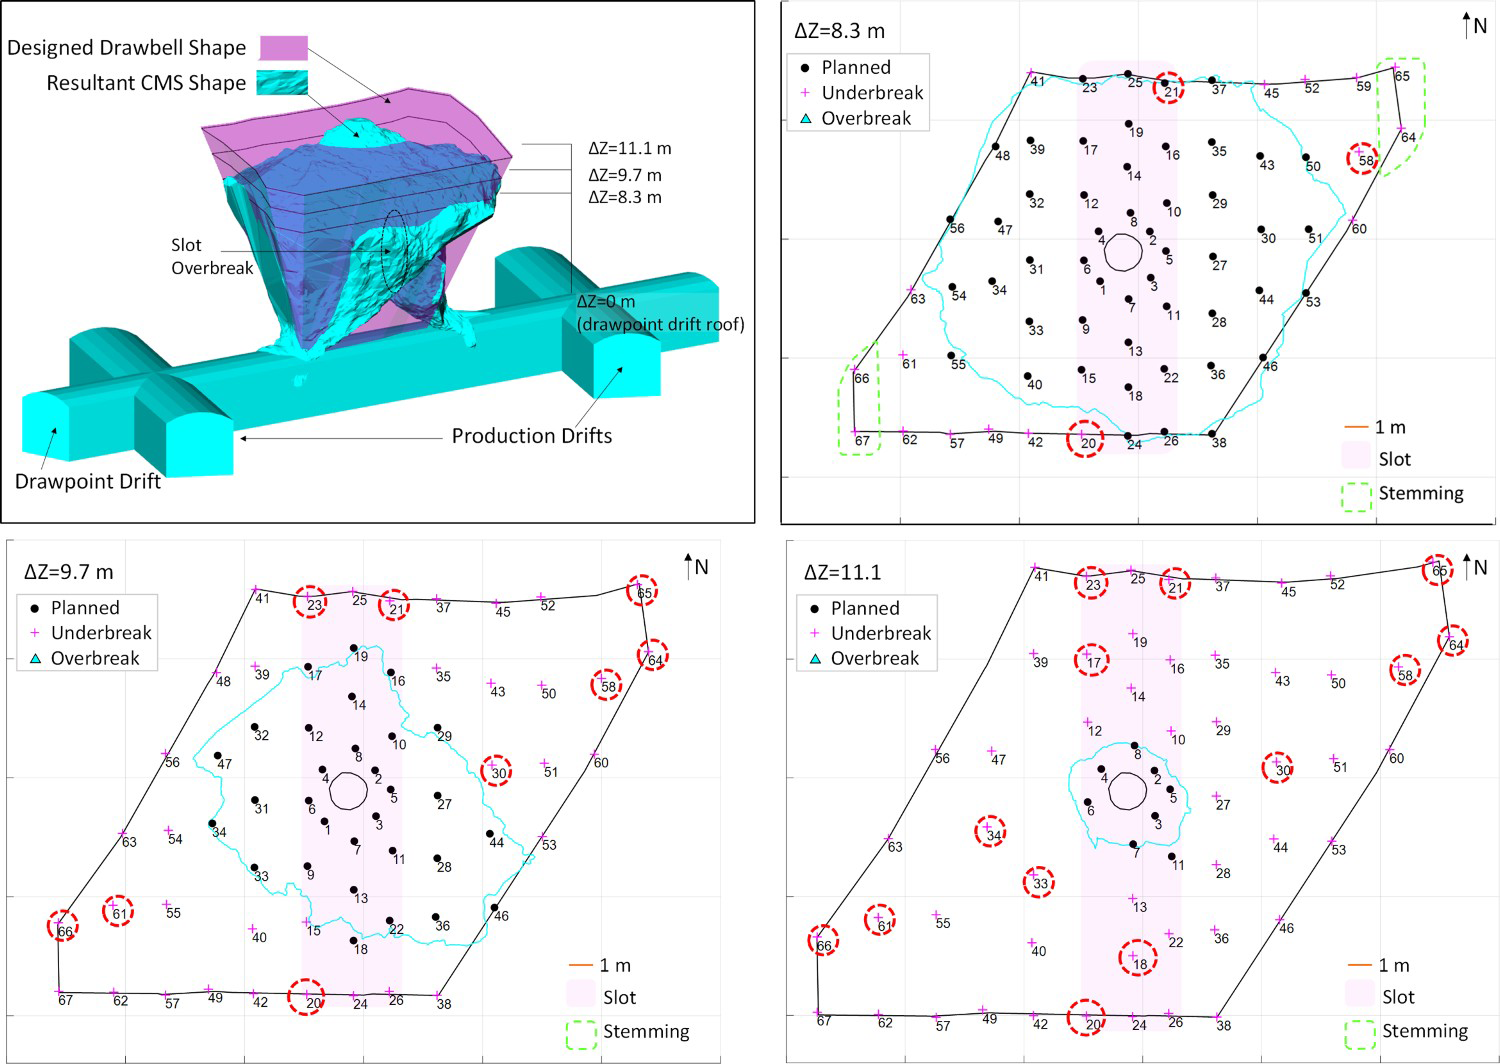
The total blasting sequence was composed of 67 holes. Holes 1–26 were blasted in a first firing to create the slot shape, and holes 27–67 were part of the final drawbell excavation before connection to the undercut. Each hole was identified according to its position relative to the design and the resulting shape. The planned holes (black holes in Figure 5) were located inside the design and the measured shapes (with a radial tolerance of 0.6 m). The holes outside the measured shape and inside the designed shape are the underbreak holes (magenta), and the last category is for the border holes whose resultant shape exceeds the design (with a tolerance of 0.6 m). The hole diameter was 76 mm drilled with a T-45 Rod arrangement.
The results of the dynamic burden for each hole number are displayed in Figure 6. The calculations were undertaken at 10 heights starting from 4.1 m above the roof of the drawpoint and every 0.7 m up to 11.1 m (the roof of the drawbell). At every hole detonation number, eleven points are displayed, representing a value at its plane of measurement and the colour indicating its result.
Dynamic Burden Calculation for the entire drawbell.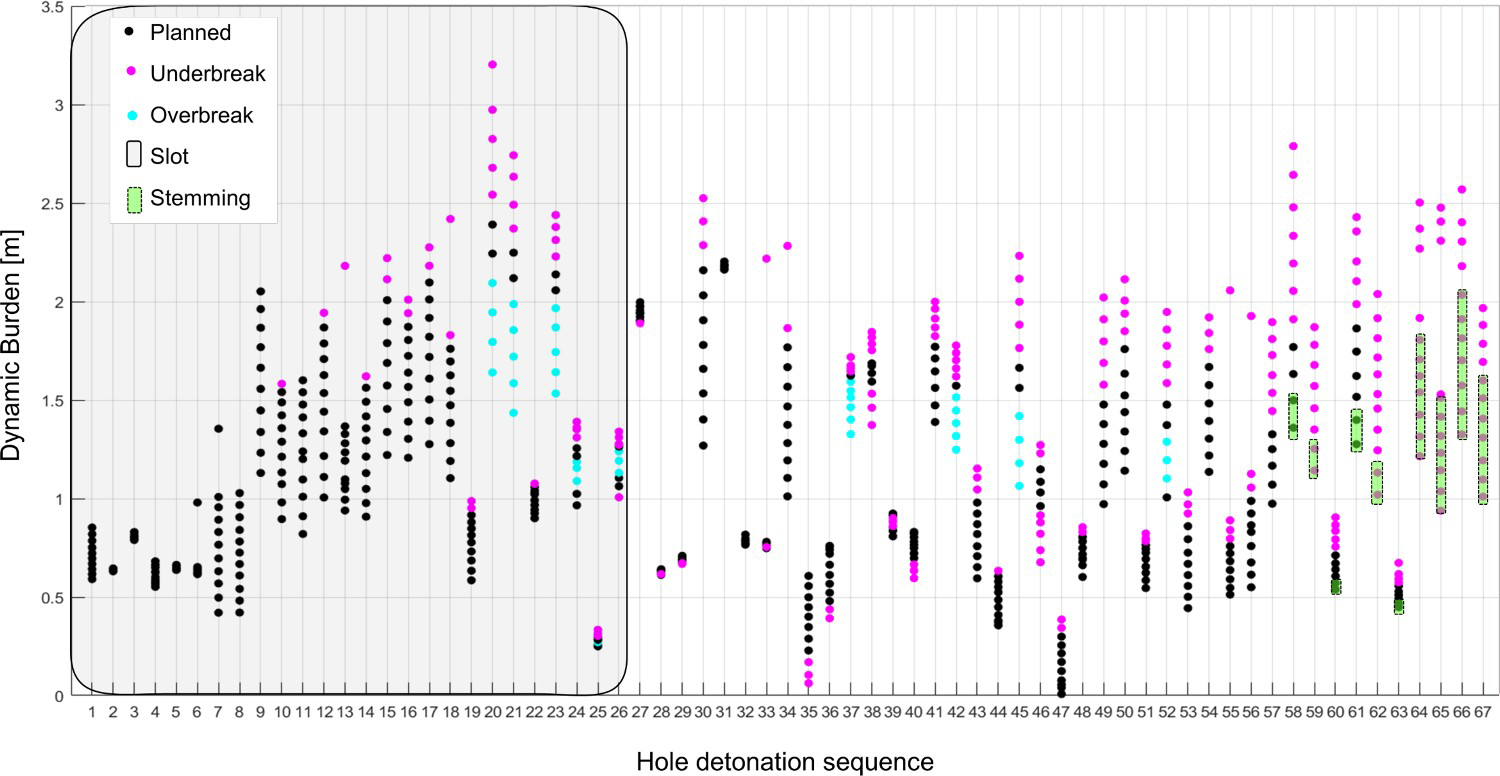
Statistics over the three categories of results for dynamic burden are shown in Figure 7. It can be seen that planed holes had, on average, a dynamic burden of less than 1 m. However, most of the data is between 0.5 and 1.5 m. In the case of holes resulting in underbreak, the average dynamic burden is 1.6 m, and the data ranges between 1 m to 2 m. The dynamic burden of holes resulting on overbreak was also, on average, larger than the planned holes, with an average of almost 1.5 m. The statistics indicate that holes showing a value exceeding 2.2 m (top whisker of planned holes) for dynamic burden can be considered a potential vulnerability inside the blasting design. Those holes were marked with a red circle in Figure 5.
Box plot statistics for the calculated dynamic burden.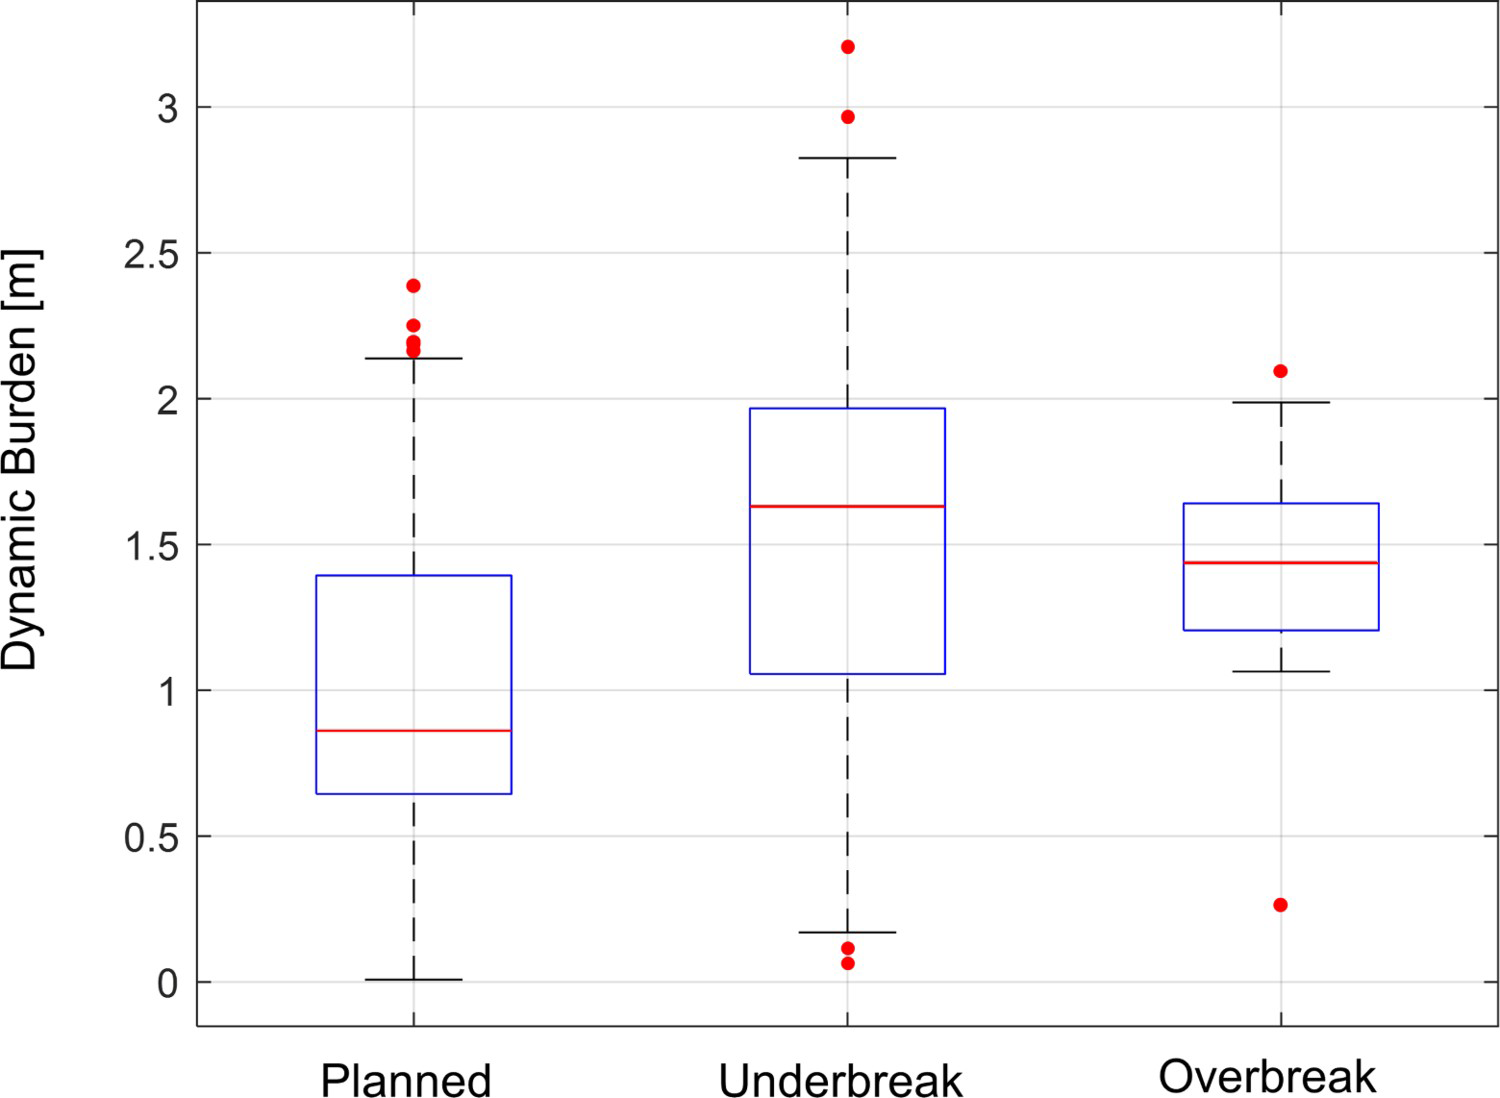
In Figure 6, the results from hole 20 show that, depending on the free face availability, a hole exceeding the burden requirement can cause overbreak (levels 4.1–6.1), and then the same excess of burden can cause an underbreak for the top of the drawbell. Importantly, the underbreak holes show two outlier values belonging to hole 20. The geotechnical implication of overbreak and underbreak are very similar and can directly affect the stability of the production level. Overbreak close to the drawpoint drift results in pillar reduction. Underbreak can result in blast damage due to the detonation of confined charges, likely to mobilise structures that can cause seismicity.
The data analysis indicates that large databases of surveyed holes and design/surveyed shape information can be statistically used to modify the stemming length of some holes or even re-drilling of any missing or critical holes. A change of design eliminating the acute corners would also be advisable, considering the excessive confinement identified towards the top of the drawbell.
Drawbell performance assessment based on cavity analysis
Cavity performance consists of comparing the resulting void from rock breakage versus the designed, planned volume. The conventional parameters used to assess stope mining performance quantify and minimise two parameters, dilution and ore loss (Cepuritis 2011; Villaescusa 2014). Dilution is a portion of the rock blasted within a design that has no economic benefit, and ore loss is a portion of the ore included in a particular design that did not break. Those two parameters are used in block caving to quantify the recovery ore from the planned extraction column and are subject to be analysed by the draw control (Laubscher 2000; Brown 2007). In order to avoid confusion, this paper uses the overbreak and underbreak words for assessing drawbell construction performance, taking into account the geotechnical stability point of view:
- Overbreak: over-excavation, which can lead to a loss of pillar volume (similar to dilution). - Underbreak: confined blasting which did not achieve geometry (similar to ore loss), which can lead to increased seismicity.
The design geometry (magenta shapes in Figure 8) is defined as a 3D volume of rock mass inside a border of drilled holes. The resultant geometry (cyan shapes in Figure 8) is obtained after the blast of a drawbell using a cavity monitoring system (CMS).
Designed and resultant CMS drawbell shape.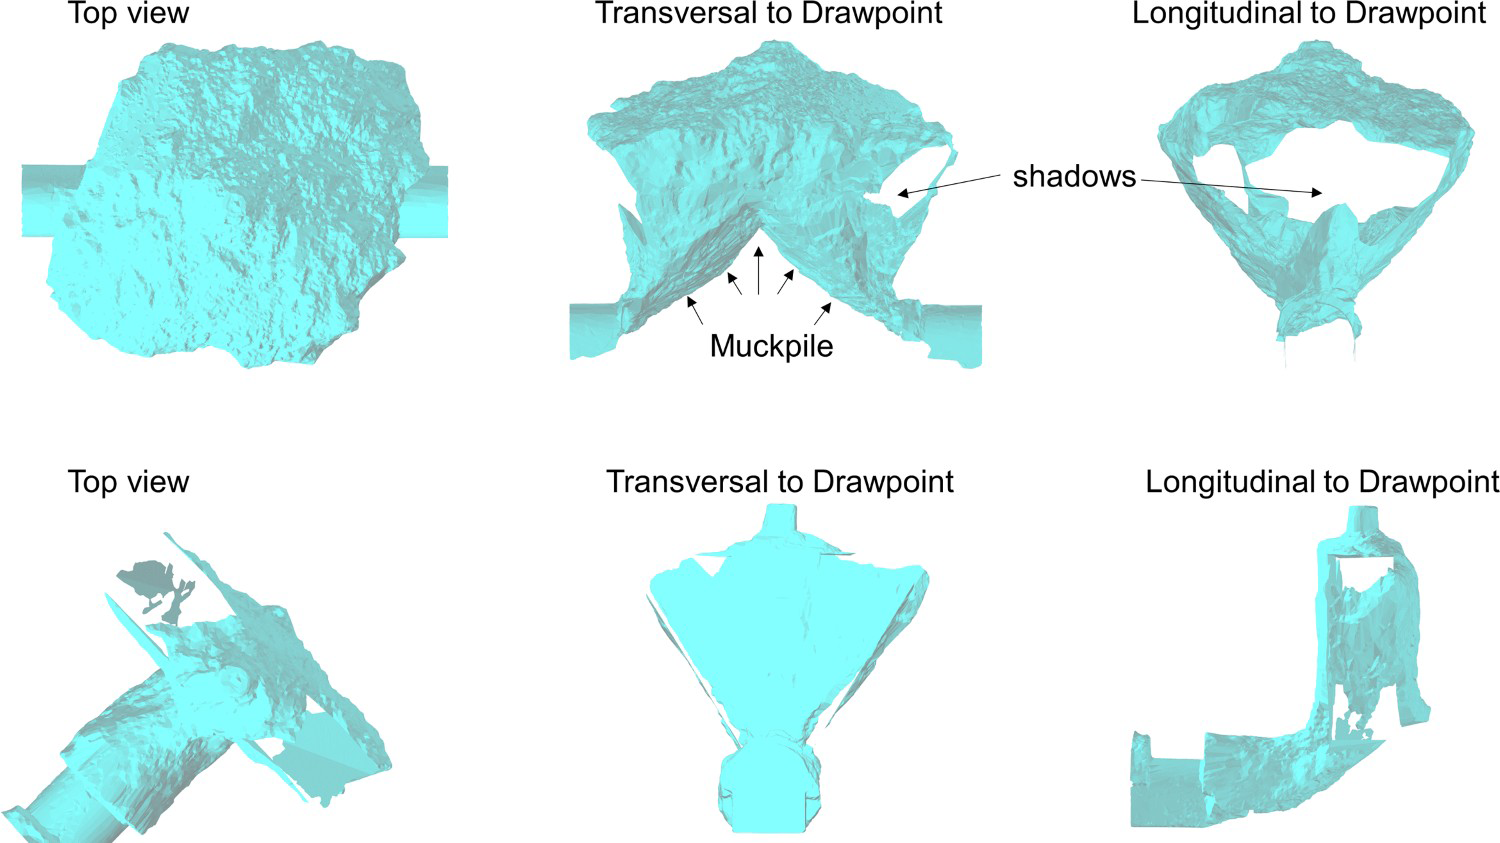
Some of the conventional performance calculations are usually undertaken to analyse excavation walls (Cepuritis 2011). However, for drawbells, this may be unsuitable due to the likely shadow effects and the muckpile zone conditions shown in Figure 8. Therefore, the analysis involves slicing the resulting shape following an approach similar to the calculation of dynamic burden. The parameters are calculated at ΔZ meters of height from the roof of the drawpoint drift. The areas of over/underbreak per designed surface perimeter are described in Figure 9.
Examples of Under and Over excavation for a particular height in a drawbell.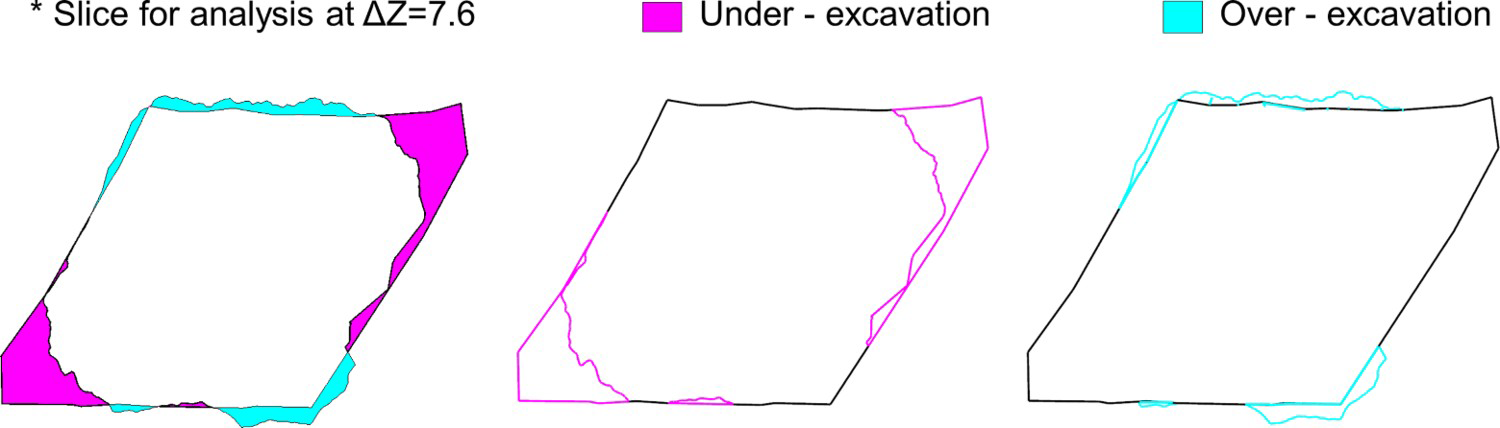
The measurements analysed here are from elevations greater than the maximum height of the muckpile (Figure 8), so the walls do not include material from the muckpile. This means that the slicing usually starts from 2 to 4 meters above the drawpoint drift roof.
The first parameter analysed was the hydraulic radius, defined as the ratio between the area and perimeter of a particular opening (Laubscher and Taylor 1976). Figure 10 shows the results per elevation inside the drawbell shape and compares the designed and resulting shapes. A good match was established for the first 8 m. However, above this elevation, the resulting performance was poor. This comparison allows an assessment of the blasting performance. However, it does not identify the drawbell sectors where the blasting malfunctioned or even if the problem is over or underbreak.
Examples of hydraulic radius measured at different ΔZ meters of height from the roof.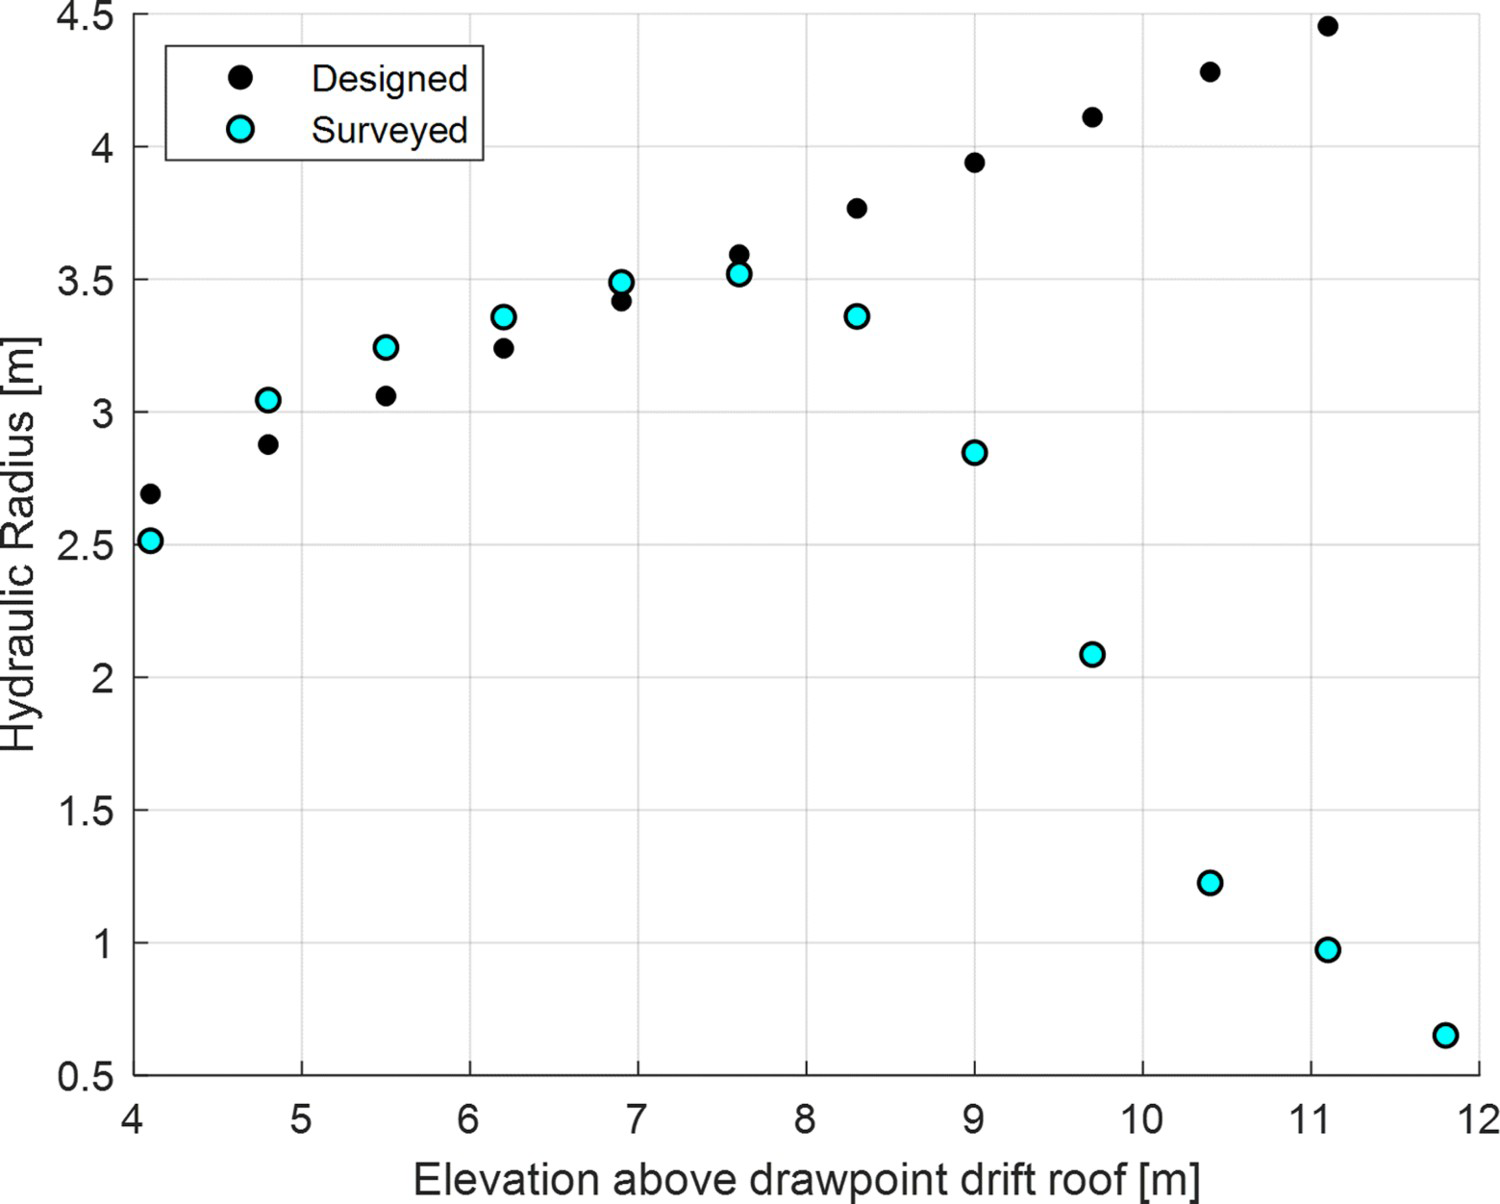
Clark and Pakalnis (1997) defined ELOS (equivalent linear overbreak/slough) and ELLO (equivalent linear lost ore). The expressions are defined as the coefficient between the overbreak volume and the designed surface area for ELOS and the same but using the underbreak volume for ELLO. These values, on average, represent the result of the over/underbreak of a particular wall. ELOS and ELLO parameters can be adapted to characterise a particular slice located in a particular elevation position (as shown in Figure 9). The area and perimeter are then values used for the calculations.
Figure 11 shows the ELOS and ELLO, and the maximum over/underbreaks values observed at different drawbell elevations. ELOS and ELLO numbers are smaller than 1 m and remain almost constant until 8 m. Above this elevation, there is a decrease in ELOS, finishing in 0 m and an increment in ELLO, up to 4 m. On the same graph, the maximum values are at least double of ELOS and ELLO values and can increase up to 3 times. This is because the ELOS and ELLO parameters assign the measures to the entire reference area, and therefore they cannot determine a localised failure. Whilst ELOS and ELLO values can show the average result for each slice; they can be misleading when analysing the shape singularities of a drawbell or a slot.
Equivalent linear under/over break (m), compared with the maximum over and underbreak (bottom), measured at different ΔZ meters of height from the roof.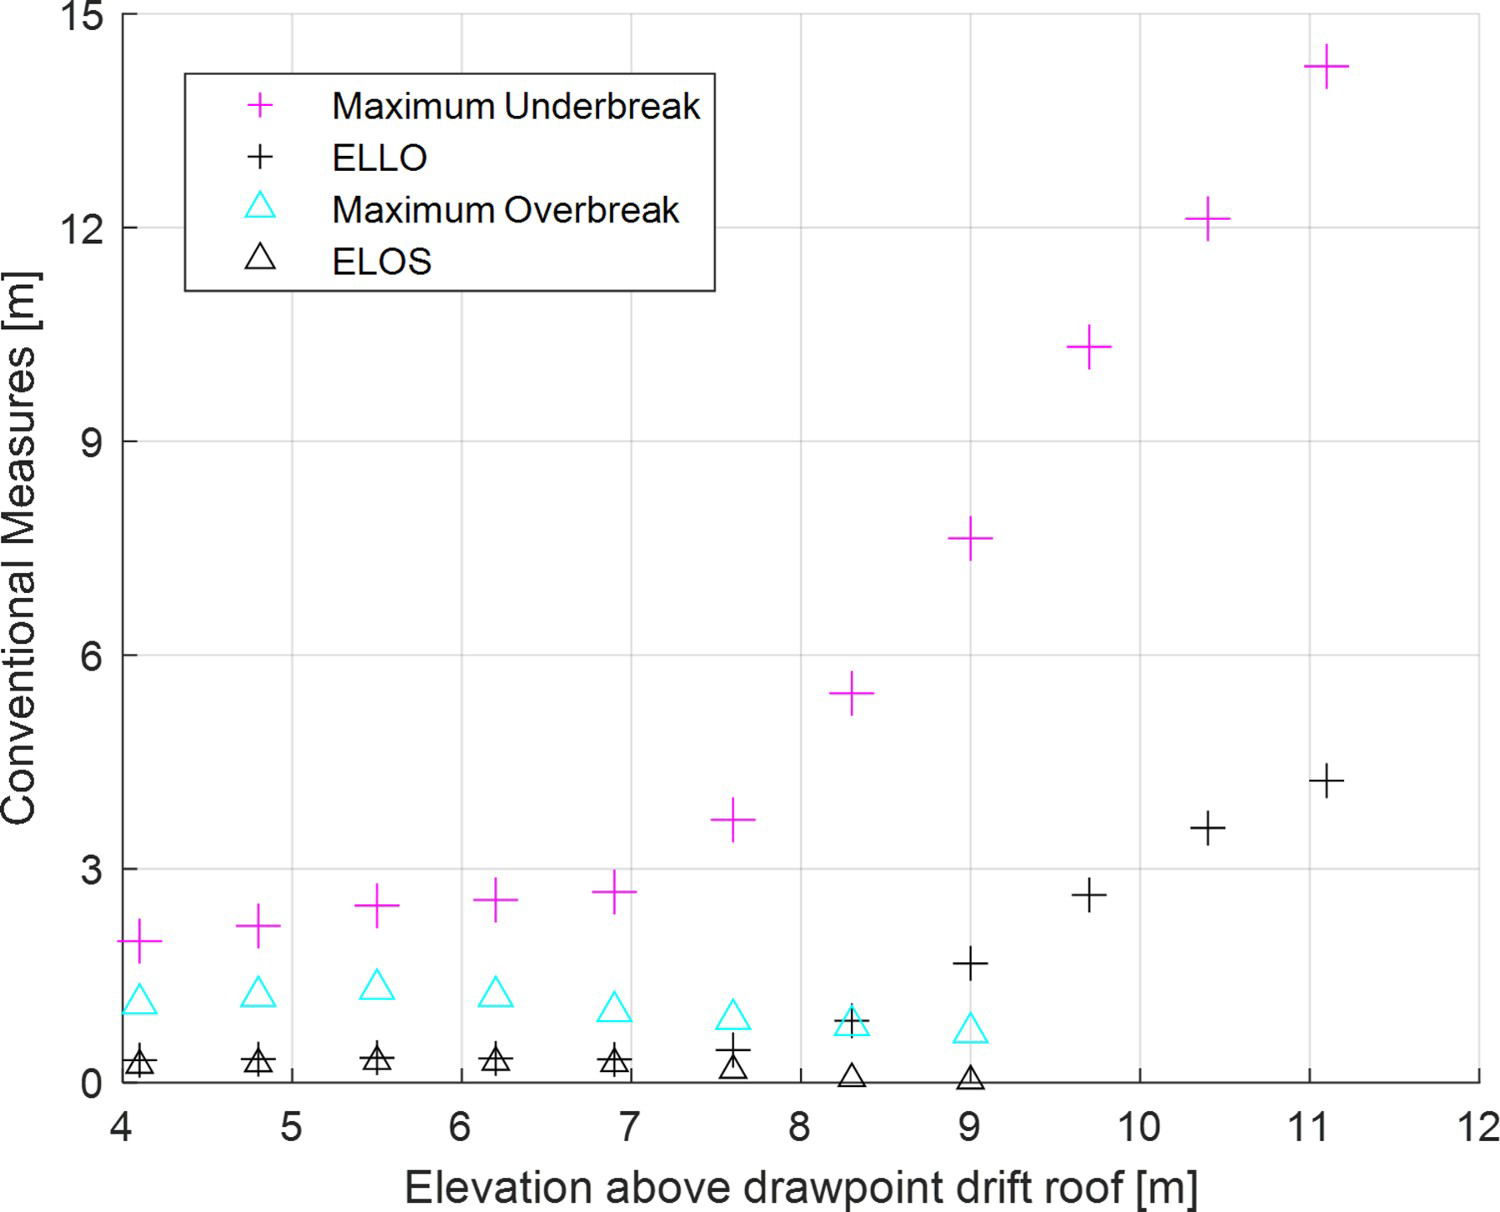
Radial distance of overbreak/underbreak
The geotechnical analysis requires detailed information similar to a depth of failure (or underbreak) parameter. The analysis needs to be comprehensive and able to determine localised instabilities. The methodology proposed here utilises slices where the performance is quantified radially from a reference axis. The newly proposed measures are called the radial distance of overbreak (RDO) and the radial distance of underbreak (RDU), as illustrated in Figure 12.
Definition of RDO / RDU calculation and concept.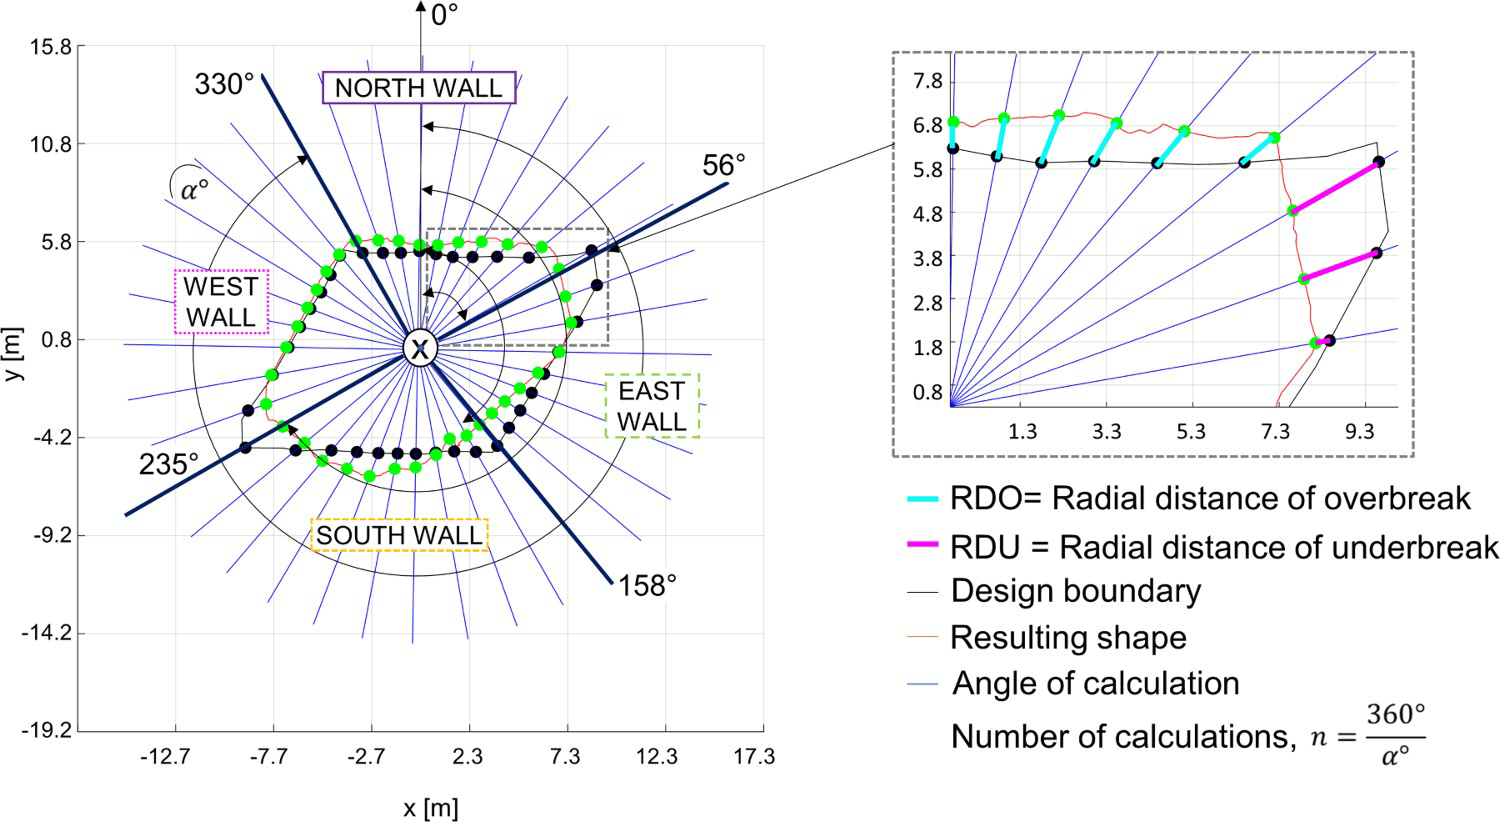
This methodology allows for a complete overview of the results for one drawbell in one graph. It calculates the depth of failure (or underbreak) at defined intervals of measurement (see Figure 12). Lines starting in the shape centroid and finishing to a particular x and y coordinates defined by a certain angle are used to calculate distances between the intersections with excavation design and resulting excavation shape. The calculations can be undertaken every 10°. They were defined from the cartesian North and belonged to a particular wall, as described in Figure 12. The calculations are done at several elevations previously defined, and all the results are summarised in a final RDO/RDU graph. Figure 12, on the top right side, shows a zoom of the plot, where the RDO is presented in cyan and RDU in magenta. This figure shows the calculation for a specific elevation profile.
An example of the radial distance of over/underbreak results is presented in Figure 13. The graph shows that there is practically no overbreak in the drawbell at any elevation (ΔZ [m]). Nevertheless, underbreak is experienced at all drawbell elevations. In particular large values can be established for elevations exceeding 7.8 m, including the drawbell roof (ΔZ = 11.1), where more than 14 m of underbreak was experienced. Also, the two peaks of underbreak occur in both acute corners, the northeast and southwest corner, which are readily identified by the analysis.
Example of radial distance of over/underbreak for a drawbell.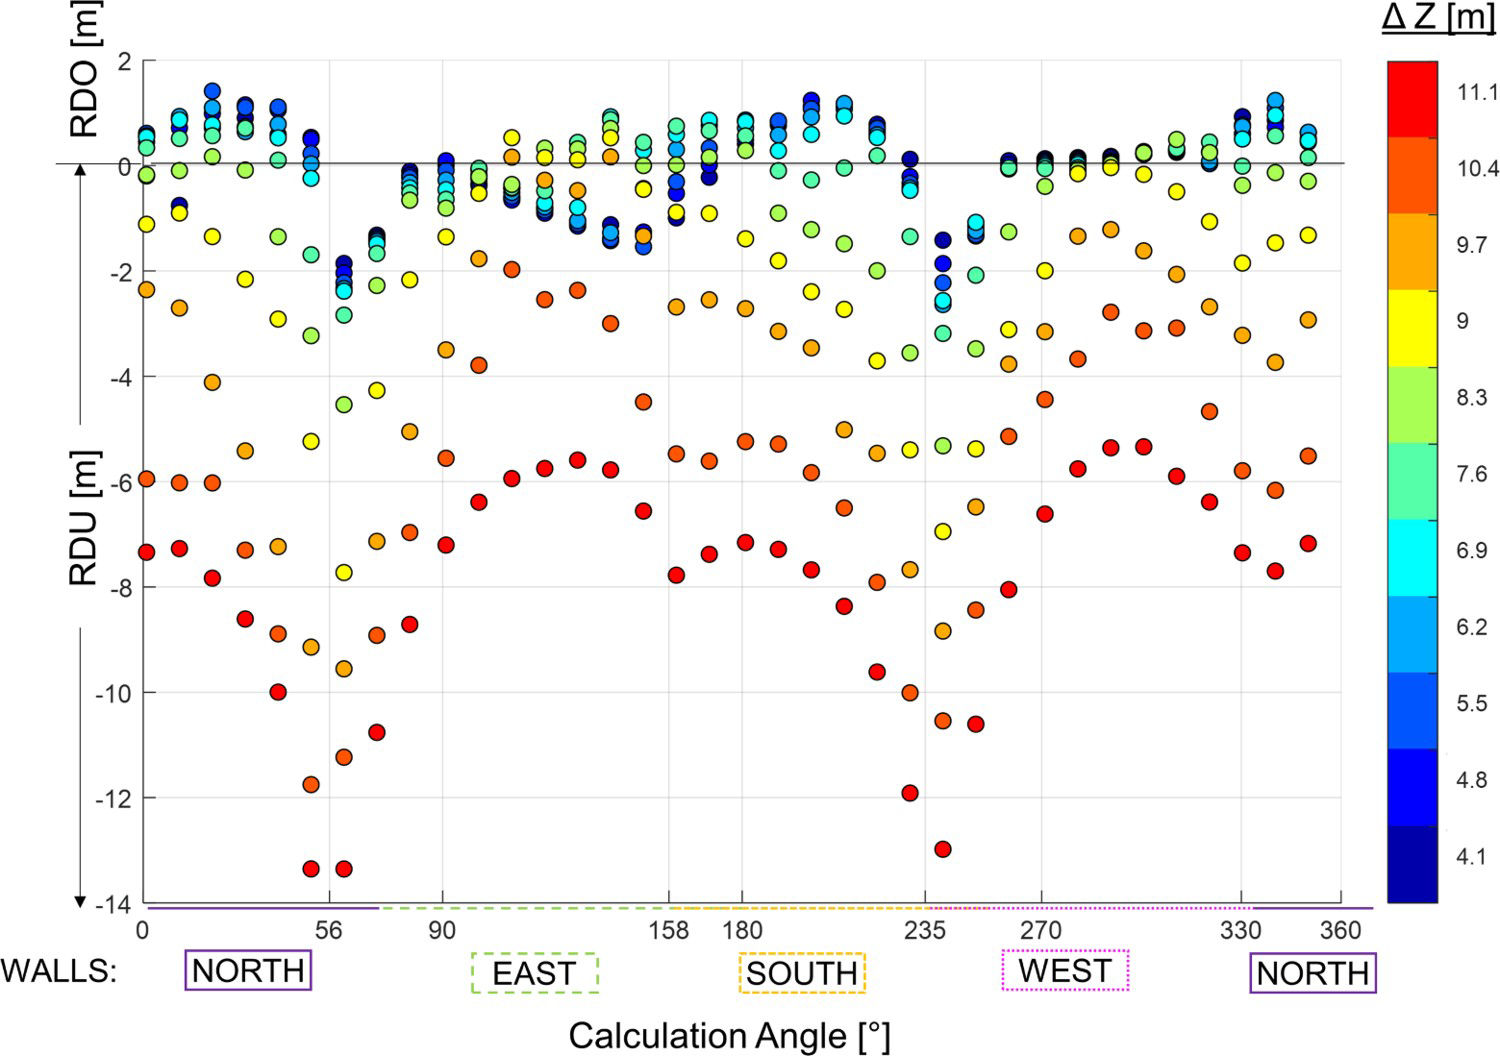
It must be noted that the acute corners are the zones designed with shallow holes, which are also the longest. These holes have been shown to present significantly more drillhole deviation (Bustos et al. 2020). The data indicates that the blasting of shallow plunging holes, especially the longest ones, do not achieve the geometry. The most geometrically confined shape appears to have more difficulty reaching the designed shape.
The radial distance of over/underbreak (RDU/RDO) is proposed to be a relevant quantitative descriptor of a resulting drawbell shape result. The concept can also be easily adapted to any concentrical shape (e.g. sublevel stoping voids).
Blast monitoring and confinement effects
Near-field vibration or acceleration monitoring has been used for many years to evaluate the detonation efficiency of multiple detonating charges in a wide range of blasting scenarios. As a diagnostic tool, it provides a clear picture of the contribution of individual charges to the breakage and fragmentation process, as well as identifying potential irregularities such as charge dislocations; sympathetic detonation and/or excessive confinement. In drawbell construction, monitoring is an important element of the continuous improvement of design and implementation practices. Figure 14 shows the results of a blast monitoring record collected during drawbell construction. The data shows a higher level of vibration towards the end of the detonation sequence. That is, when the holes near the boundary of the drawbell detonate. However, as described earlier, those holes fail to break the rock into the initial void.
An example of blast monitoring of a drawbell construction.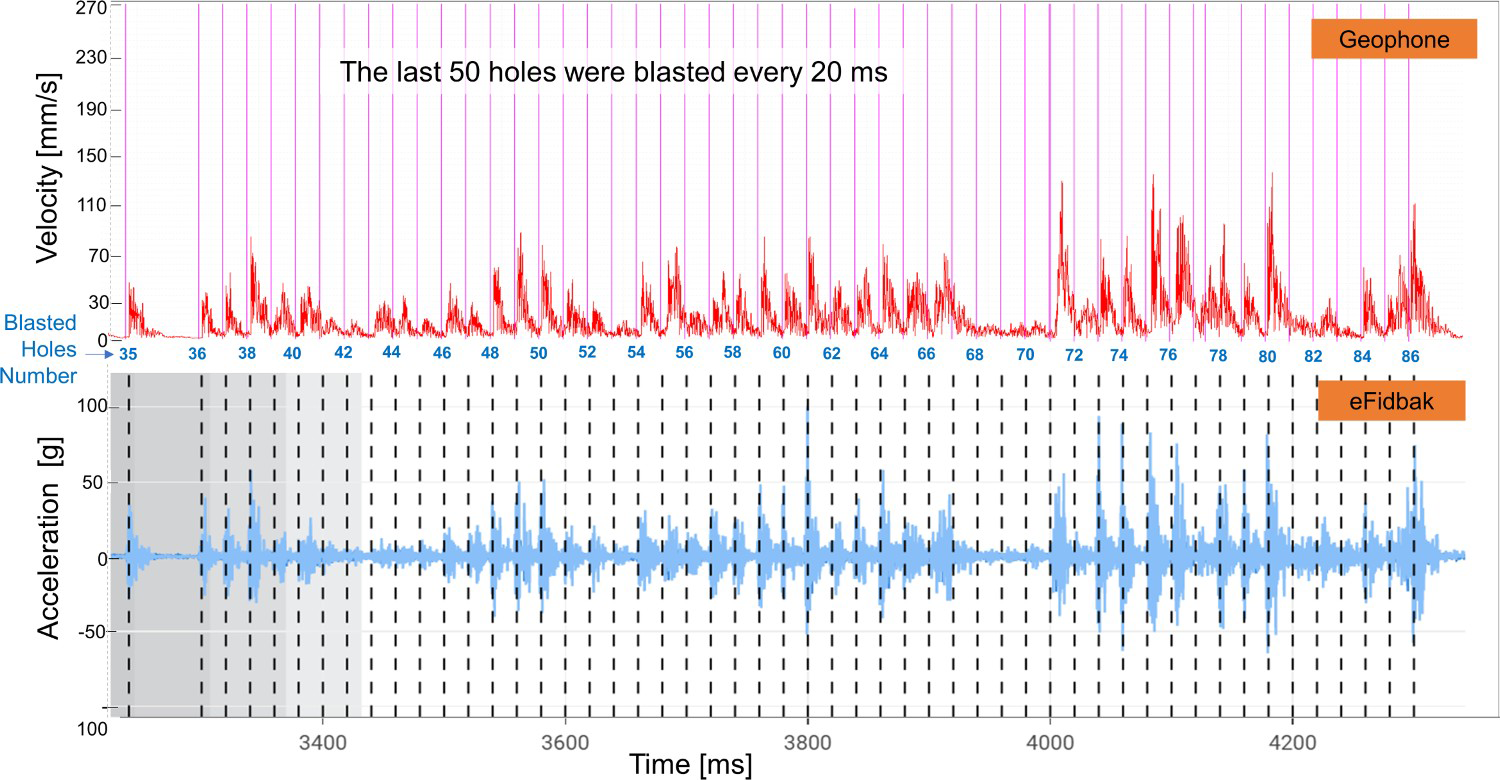
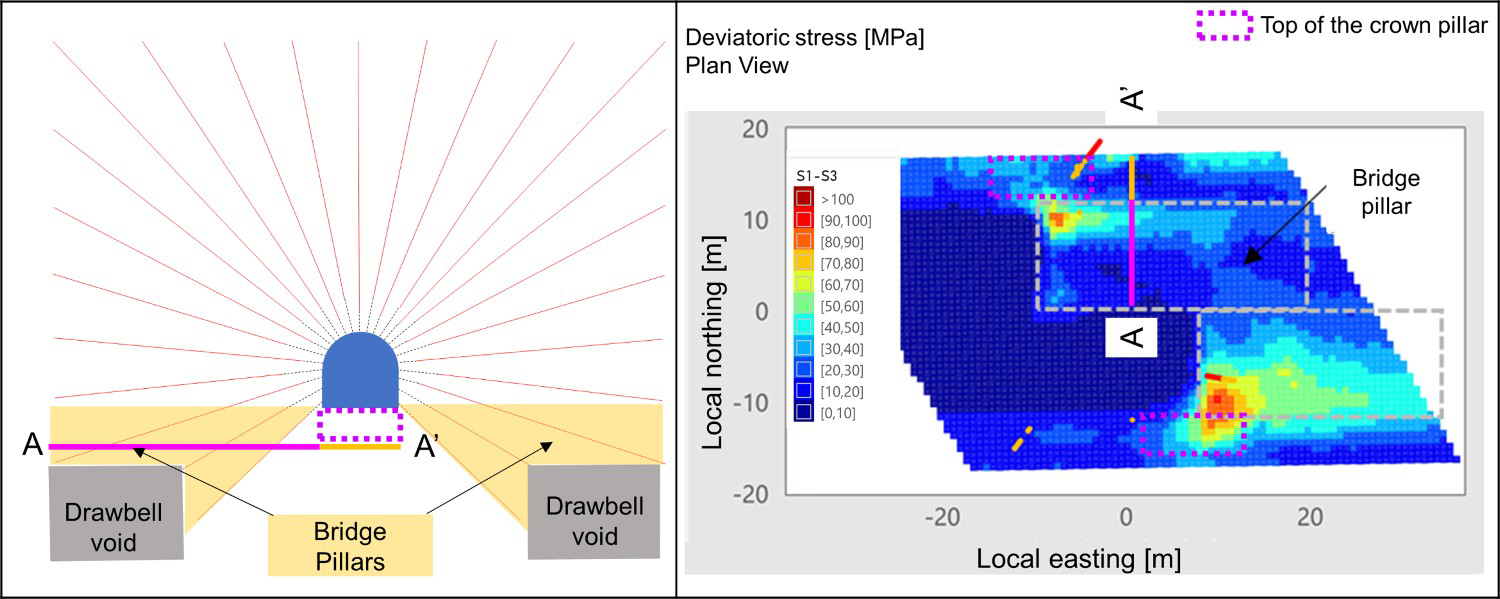
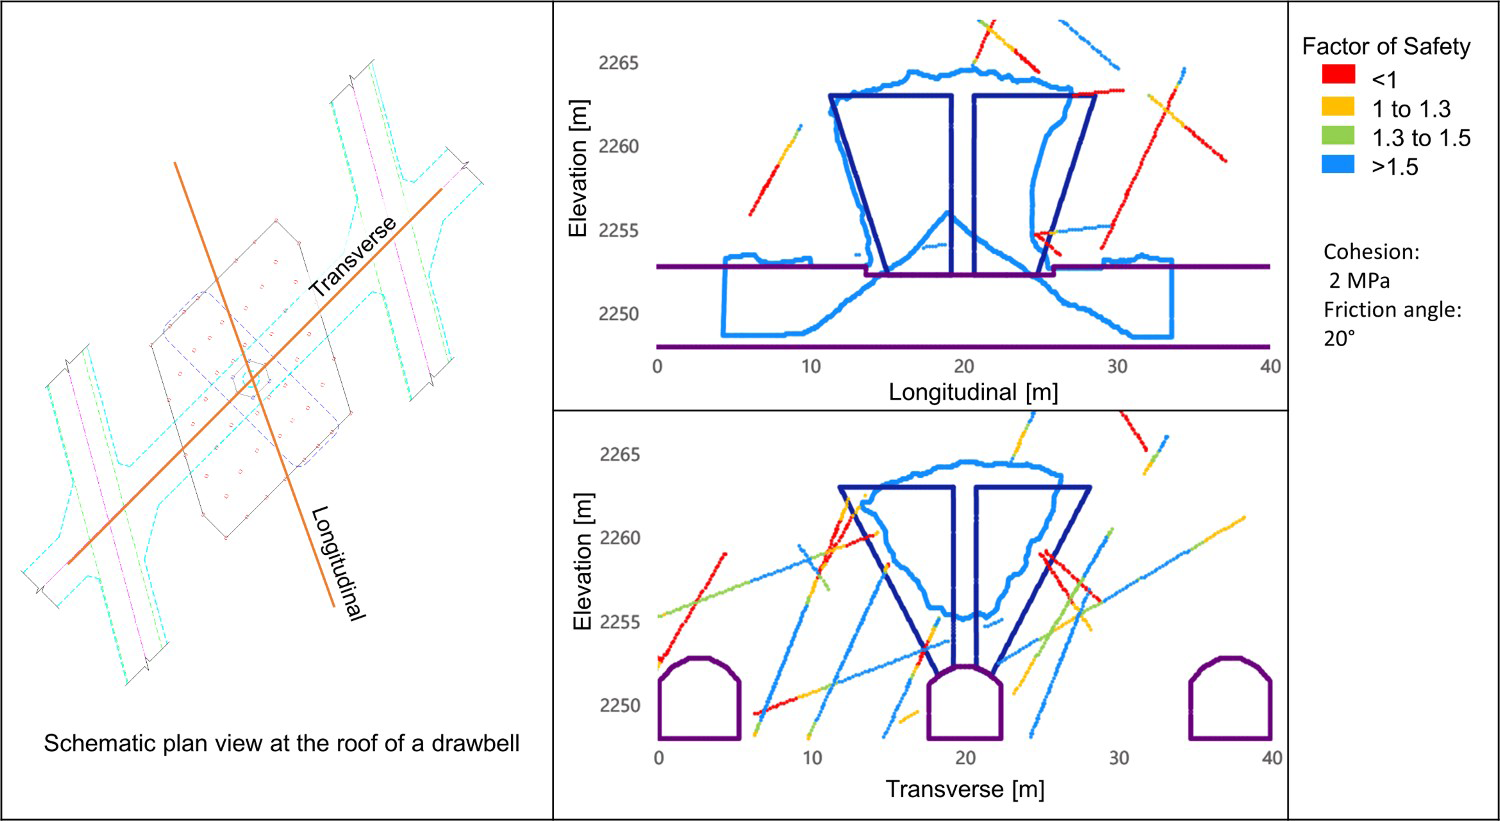
A number of practitioners have found a strong correlation between rock mass damage near the boundary of excavations and measured increases in vibration amplitudes (Holmberg and Persson 1980; Villaescusa et al. 2004; Fullelove et al. 2017). In the case analysed here, the higher vibration amplitudes are near the boundary of the drawbell and within the crown pillar. These regions are usually under very high induced stress (Figure 15). Even though the bridge pillars, and any remaining rock within the drawbell, are blasted from the undercut level to establish a connection with the production level (Figure 16), the remaining crown pillar may be weakened. This is particularly concerning when some geological structures intersect the blasting regions and the crown pillars where they can be mobilised in shear (Figure 17).
Cross section view showing highly stressed regions within the crown pillar. Bridge Pillar geometry and example of highly stressed crown pillar zones. Sections along one drawbell showing the mobilisation of geological structures within the crown pillar.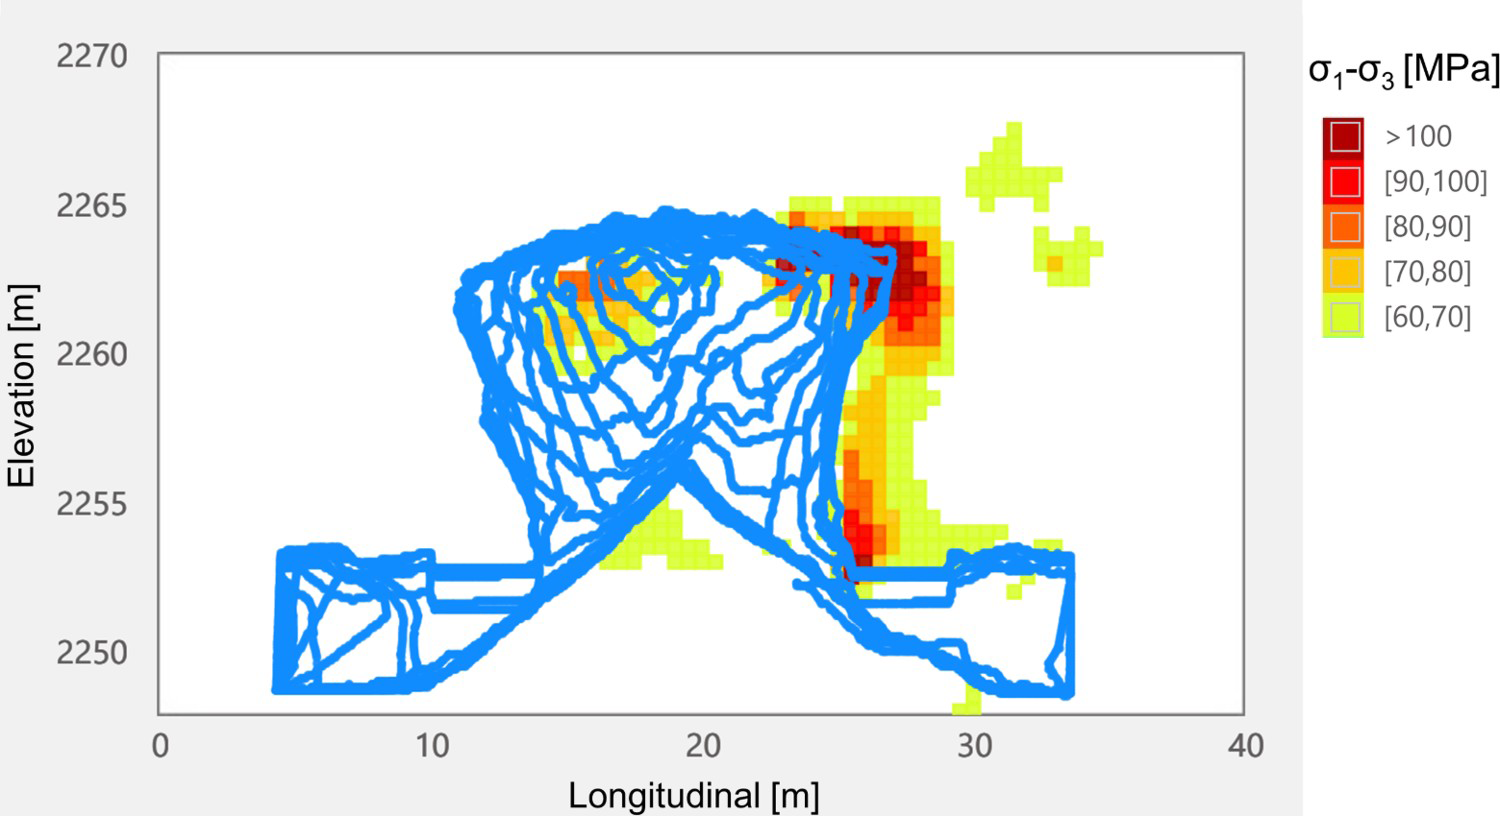
Conclusions
Both the dynamic burden calculations and the radial distance concept can be used to assess drawbell excavation performance.
The dynamic burden calculations clearly indicate the timing where the blastholes became confined within a detonation sequence. Blast monitoring has determined higher levels of vibration towards the top of the drawbell and near the edges adjacent to the crown and bridge pillars. These regions are usually under very high induced stress, having geological discontinuities which can be mobilised under shear.
The regions where heavy confinement occurs clearly coincide with regions in which the radial distance of underbreak increases. The newly developed concept of radial distance of over/underbreak (RDO/RDU) allows a complete and comprehensive quantitative shape analysis for drawbell void results. The information indicates that, within the drawbell, the corners, and especially the acute corners are the zones presenting more underbreak. The values indicate that the blasting of shallow plunging holes, especially the longest ones, may not always achieve a designed geometry. In terms of geometrical assessment, the hydraulic radius, ELOS'/ELLO’ and depth of failure (or underbreak) are not good indicators of the mechanics of drawbell performance.
Footnotes
Acknowledgement
The financial support of the National Agency for Research and Development (ANID) / Scholarship Program / DOCTORADO BECAS CHILE/2017 – 72180287 and the Western Australian School of Mines through Mining 3 is gratefully acknowledged.
Disclosure statement
No potential conflict of interest was reported by the author(s).