
Abstract
Background
Mild cognitive impairment (MCI) and Alzheimer's disease (AD) are progressive neurodegenerative disorders, and probiotics may offer therapeutic benefits by modulating gut microbiota and reducing inflammation.
Objective
This study systematically evaluated the impact of probiotics on cognitive function in MCI and AD through a meta-analysis of randomized controlled trials (RCTs).
Methods
A systematic review and meta-analysis were performed following PRISMA 2020 guidelines. PubMed, Embase, EBSCO, and Cochrane databases were searched for RCTs (January 2000–January 2024) on probiotic interventions lasting 8–24 weeks. Cognitive outcomes included Mini-Mental State Examination (MMSE), Montreal Cognitive Assessment (MoCA), language, naming, visual-spatial, memory, and attention. Data were analyzed using R with a random-effects model to calculate pooled standardized mean differences (SMDs) with 95% confidence intervals (CIs). Risk of bias was rigorously assessed.
Results
Out of 2000 articles, 500 full texts were screened, and 10 studies were included. The meta-analysis showed varied effect sizes: MMSE (SMD: 0.28, 95%CI −0.35–0.91, p = 0.38), MoCA (SMD: 0.51, 95%CI −0.49–1.52, p = 0.33), language (SMD: −0.12, 95% CI −0.54–0.29, p = 0.56), naming (SMD: 0.02, 95%CI −0.69–0.74, p = 0.95), visual-spatial (SMD: 0.38, 95%CI −0.13–0.88, p = 0.14), memory (SMD: 0.20, 95%CI −0.15–0.55, p = 0.26), and attention (SMD: −0.07, 95%CI −0.44–0.30, p = 0.71). Positive SMDs suggest cognitive improvement, while non-significant negative SMDs indicate trends toward decline, inclined by probiotic strains, duration, and participant characteristics.
Conclusions
Probiotics did not significantly improve cognitive function in MCI and AD patients, with variability in effects across cognitive domains, suggesting the need for tailored interventions and future studies.
Keywords
Introduction
Alzheimer's disease (AD) is a complex neurodegenerative disorder and an example of dementia, primarily affecting individuals over 60 years old. 1 The global prevalence of dementia rose from 20.3 million in 1990 to 43.8 million in 2016, a 116% increase. Between 1990 and 2019, AD and other dementias increased by 148% and 161%, respectively. By 2050, the number of dementia cases is projected to reach 150 million. The increasing prevalence of AD is expected to contribute to rapidly rising healthcare costs. 2 AD pathogenesis involves multiple risk factors, including age, genetics, and environmental influences, leading to the accumulation of amyloid-β (Aβ) plaques and neurofibrillary tangles, which contribute to neuronal death, memory impairment, and cognitive decline.3–5
A key aspect of AD is the neuroinflammatory theory, which suggests that microglial inflammation occurs early in the disease process, preceding and exacerbating the formation of Aβ plaques and tau tangles. This inflammation emphasizes a critical link between immune responses and AD progression.6,7 Aβ deposition outside neurons and tau tangles within neurons are closely associated with neuronal death and cognitive decline, underscoring the importance of addressing these pathological features in AD research. 8 The gut-brain axis has gained prominence in understanding AD, revealing a connection between gut microbiota and neurodegenerative diseases. The gut microbiota, a community of microorganisms in the gastrointestinal tract, plays a crucial role in regulating immune functions. As individuals age, significant changes in gut microbiota composition and functionality occur, which are associated with AD progression.9,10 This intricate relationship between the gut and the brain involves a network of neurotransmitters and the immune system, positioning the gut microbiota as a potential target for AD treatment.11,12 Probiotics, beneficial microorganisms that support gut health, have shown potential in modulating gut microbiota and enhancing brain function. 13 They can regulate body pH, preserve intestinal integrity, and influence neurotrophic factors. Probiotics may delay AD progression by restoring gut microbiota homeostasis and reducing neuroinflammation.14,15
The rationale for our study comes from the growing body of evidence suggesting that probiotics may improve cognitive function and modulate the gut-brain axis in mild cognitive impairment (MCI) and AD. Systematic reviews and meta-analyses have highlighted the cognitive benefits of probiotics in dementia but also emphasized the need for further comprehensive analyses to clarify these effects.16,17 Additionally, studies have demonstrated that therapies aimed at balancing intestinal flora, supported by probiotics, can significantly improve cognitive function and symptoms in AD patients, while other research has shown the effectiveness of probiotic supplements in individuals with cognitive impairment.18,19 Furthermore, the impact of dietary patterns and nutritional supplements on cognitive outcomes in MCI has underscored the relevance of probiotics. 20 The severity of AD may also influence the responsiveness to gut microbiota modification, indicating the importance of understanding the specific mechanisms involved. 21
Therefore, our study aims to address these gaps in knowledge by systematically reviewing and meta-analyzing randomized controlled trials (RCTs) to provide quantitative insights into the impact of probiotics on various cognitive functions involved in MCI and AD.
Methods
Design
The current systematic review and meta-analysis adhered to the Preferred Reporting Items for Systematic Review and MetaAnalyses (PRISMA) guidelines and followed a prior protocol. 22 The protocol for the current study was registered in PROSPERO, with the registration number CRD42023438735.
Search strategy
Two investigators (ST & MK) independently searched using Scopus, EMBASE, EBSCO, Cochrane, PubMed, Web of Science, and MEDLINE from January 2000 to January 2024, with no language restrictions. The keywords used for searching literature in above-mentioned databases were “RCT”, “Alzheimer's Disease”, “AD”, “Mild cognitive impairment”, “MCI” “Probiotics”, “Gut microbiota”, “MMSE”, “MoCA”, “Language”, “Naming”, “Visual-spatial”, “Memory”, “Attention,” or a combination of these terms. Additionally, studies published in languages other than English were included if their English translation was available. The authors of studies in languages other than English were contacted to provide their English translations.
Scores used in meta-analysis as effect sizes
MMSE: The Mini-Mental State Examination (MMSE) is frequently used as a screening tool for cognitive impairment clinically. It can also be an indicator of disease progression.
23
MoCA: The Montreal Cognitive Assessment (MoCA) is used as a common mild cognitive impairment screener. The screening tool MoCA is superior to MMSE and both tests were found to be accurate in the detection and identification of AD.
24
Language: A measurement of language includes the analysis of connected speech in MCI. Language impairments have been well described in AD, but language features of MCI are less well understood.
25
Naming: Naming deficits are an important symptom that appears in the initial phase of AD. The types of naming errors associated with the disease are still unclear.
26
Visual-spatial: Having problems in navigating one's place or space is one of the earliest signs of AD. Visual and spatial issues as well as memory impairment are common in AD.
27
Memory: Memory loss is among the first symptoms reported by patients suffering from AD and also by their caregivers.
28
Attention: Attention is also affected at the early onset in young and atypical syndromic individuals.
29
Inclusion criteria and exclusion criteria
The eligibility criteria for including the randomized controlled trial studies in the present meta-analysis were as follows: P (Population): RCTs conducted on MCI /AD patients; I (Intervention): Probiotics were used as a treatment for gut microbiota (GM) in patients with MCI/AD; C (Comparison): The MCI/AD patients received a placebo; O (Outcome): Various scales were used to assess the cognitive functions in patients with MCI/AD; T (Time period): The studies were conducted between 2000 and 2024.
Similarly, the studies were excluded for the following reasons: 1) They were not conducted in humans or used a non-placebo group; 2) All case-controls, cohort, observational and/ or animal studies; 3) Data were not provided in the study; and 4) The studies were not published in English and their translation was unavailable.
Study selection and data extraction
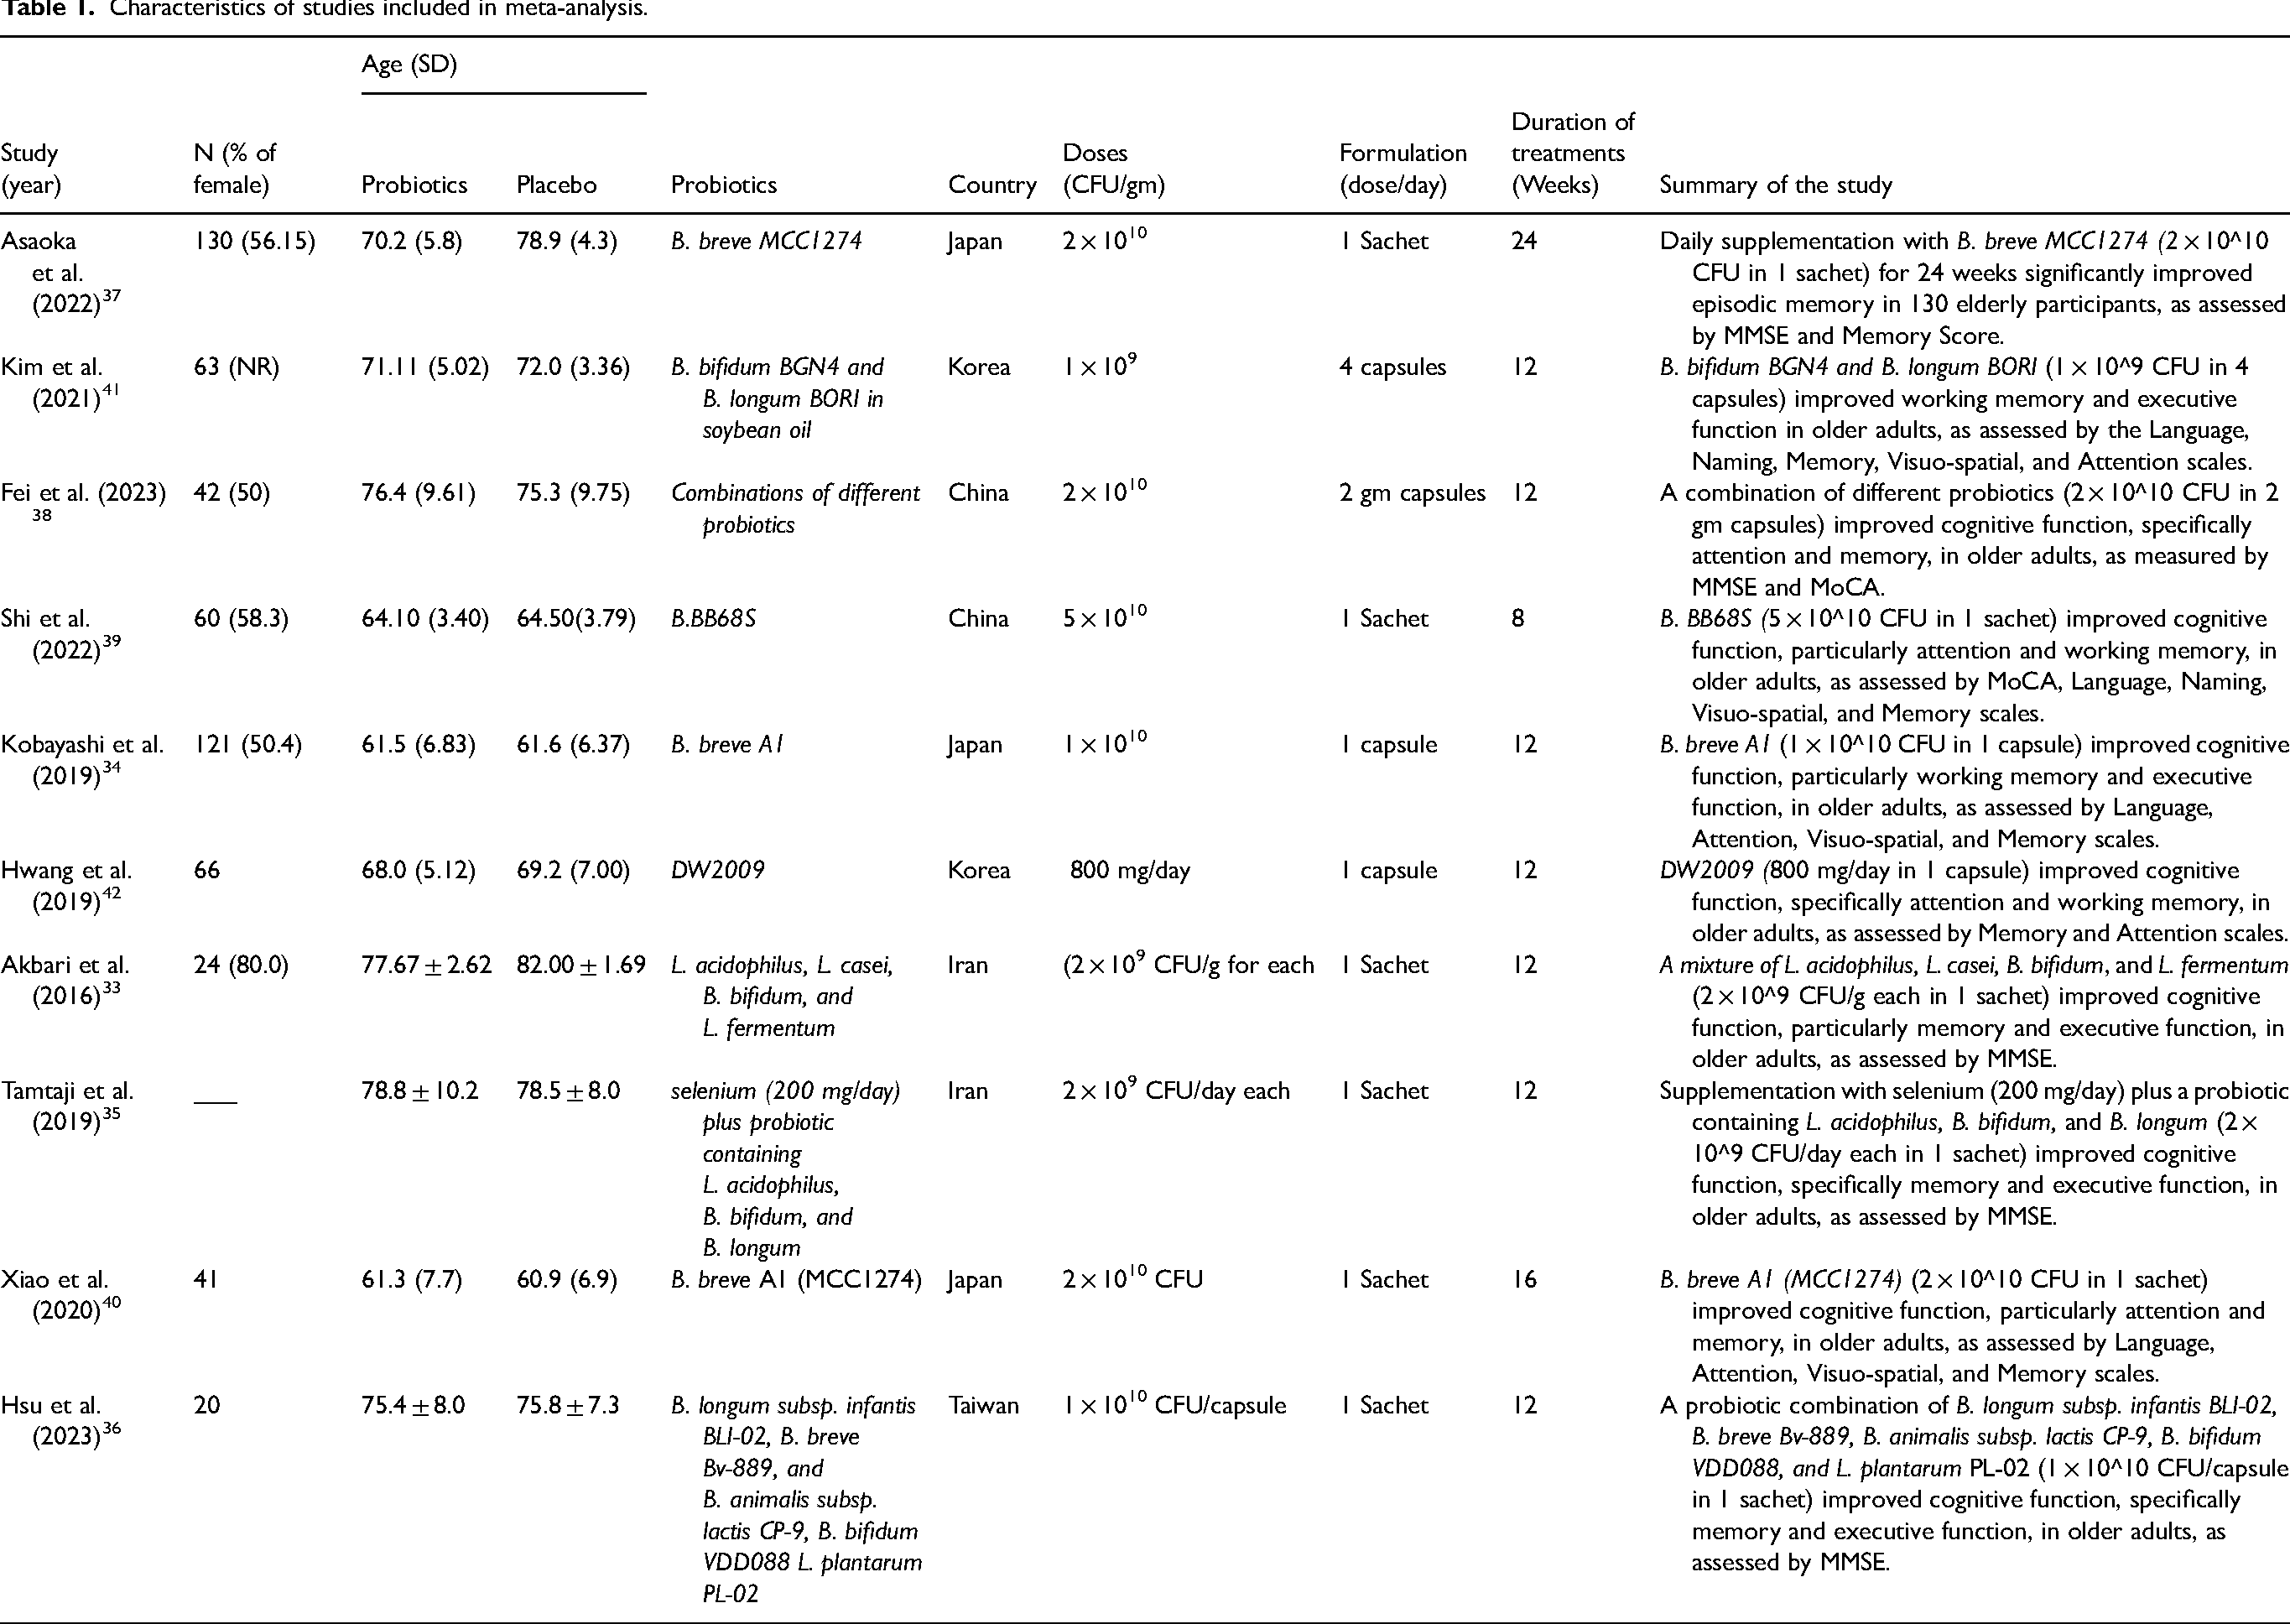
The literature management software (Endnote ×9) was used to screen and select the articles. The process of including articles, data extraction and risk of bias assessment was done by two authors (ST and MK) separately. Any disagreement was adjudicated by consulting the other authors (RD2, PT, MT, and RD1). The data collected from each paper are shown in Table 1 as follows: the study subject's characteristics (number of groups and number of participants in each group); the characteristics of the subjects (subject type, age, range); the experimental treatment (type of treatment, dose, frequency of dose and duration of treatment and summary of the study).
Characteristics of studies included in meta-analysis.
Statistical analysis
All analyses were performed using R (2023.03.0-daily + 82.pro2). The pooled standardized mean difference (SMD) between the scores of probiotics group and placebo group in MCI/AD patients was computed using the fixed effect model and random effects model. The SMD provides a consistent measure of effect size, enabling meaningful comparisons and aggregations across studies with varying measurement scales. The term “weight” refers to the relative importance assigned to each individual study when calculating the pooled effect size. This weight is typically based on the inverse of the variance, meaning that studies with larger sample sizes and more precise estimates are given more influence in the overall effect size calculation. The Q-statistic was used to examine the heterogeneity across studies and I2-statistic explained the degree of heterogeneity in effect size across all the studies. 30 Based on these two measures of heterogeneity (Q and I2), the appropriate model (fixed effect model and random effects model) was chosen to generate pooled effect size. If the degree of heterogeneity in effect size was significantly high (i.e., I2 > 30%), 31 the random effect model was used; otherwise, a fixed effect model was used to estimate SMD. A forest plot was made to display the result of individual included studies along with their 95% confidence interval (CI) and pooled effect size with its 95% CI was also displayed at the bottom of the graph. 30 To check the publication bias of studies, a graphical method (funnel plot) was used. 30 The quality of studies included in the meta-analysis was checked by the Jadad score (on five domains). 32
Results
Characteristics of study
A total of 900 studies were screened and only 500 studies with full text were available. Out of those, ten studies that fulfilled the eligibility criteria were included in the meta-analysis. The whole search strategy is explained in the PRISMA flow diagram (Figure 1). A total of 733 subjects were enrolled in five studies, with 366-subjects were enrolled in the treatment group and 367 subjects were enrolled in the placebo group. The detailed characteristics of the ten studies are shown in Table 1.
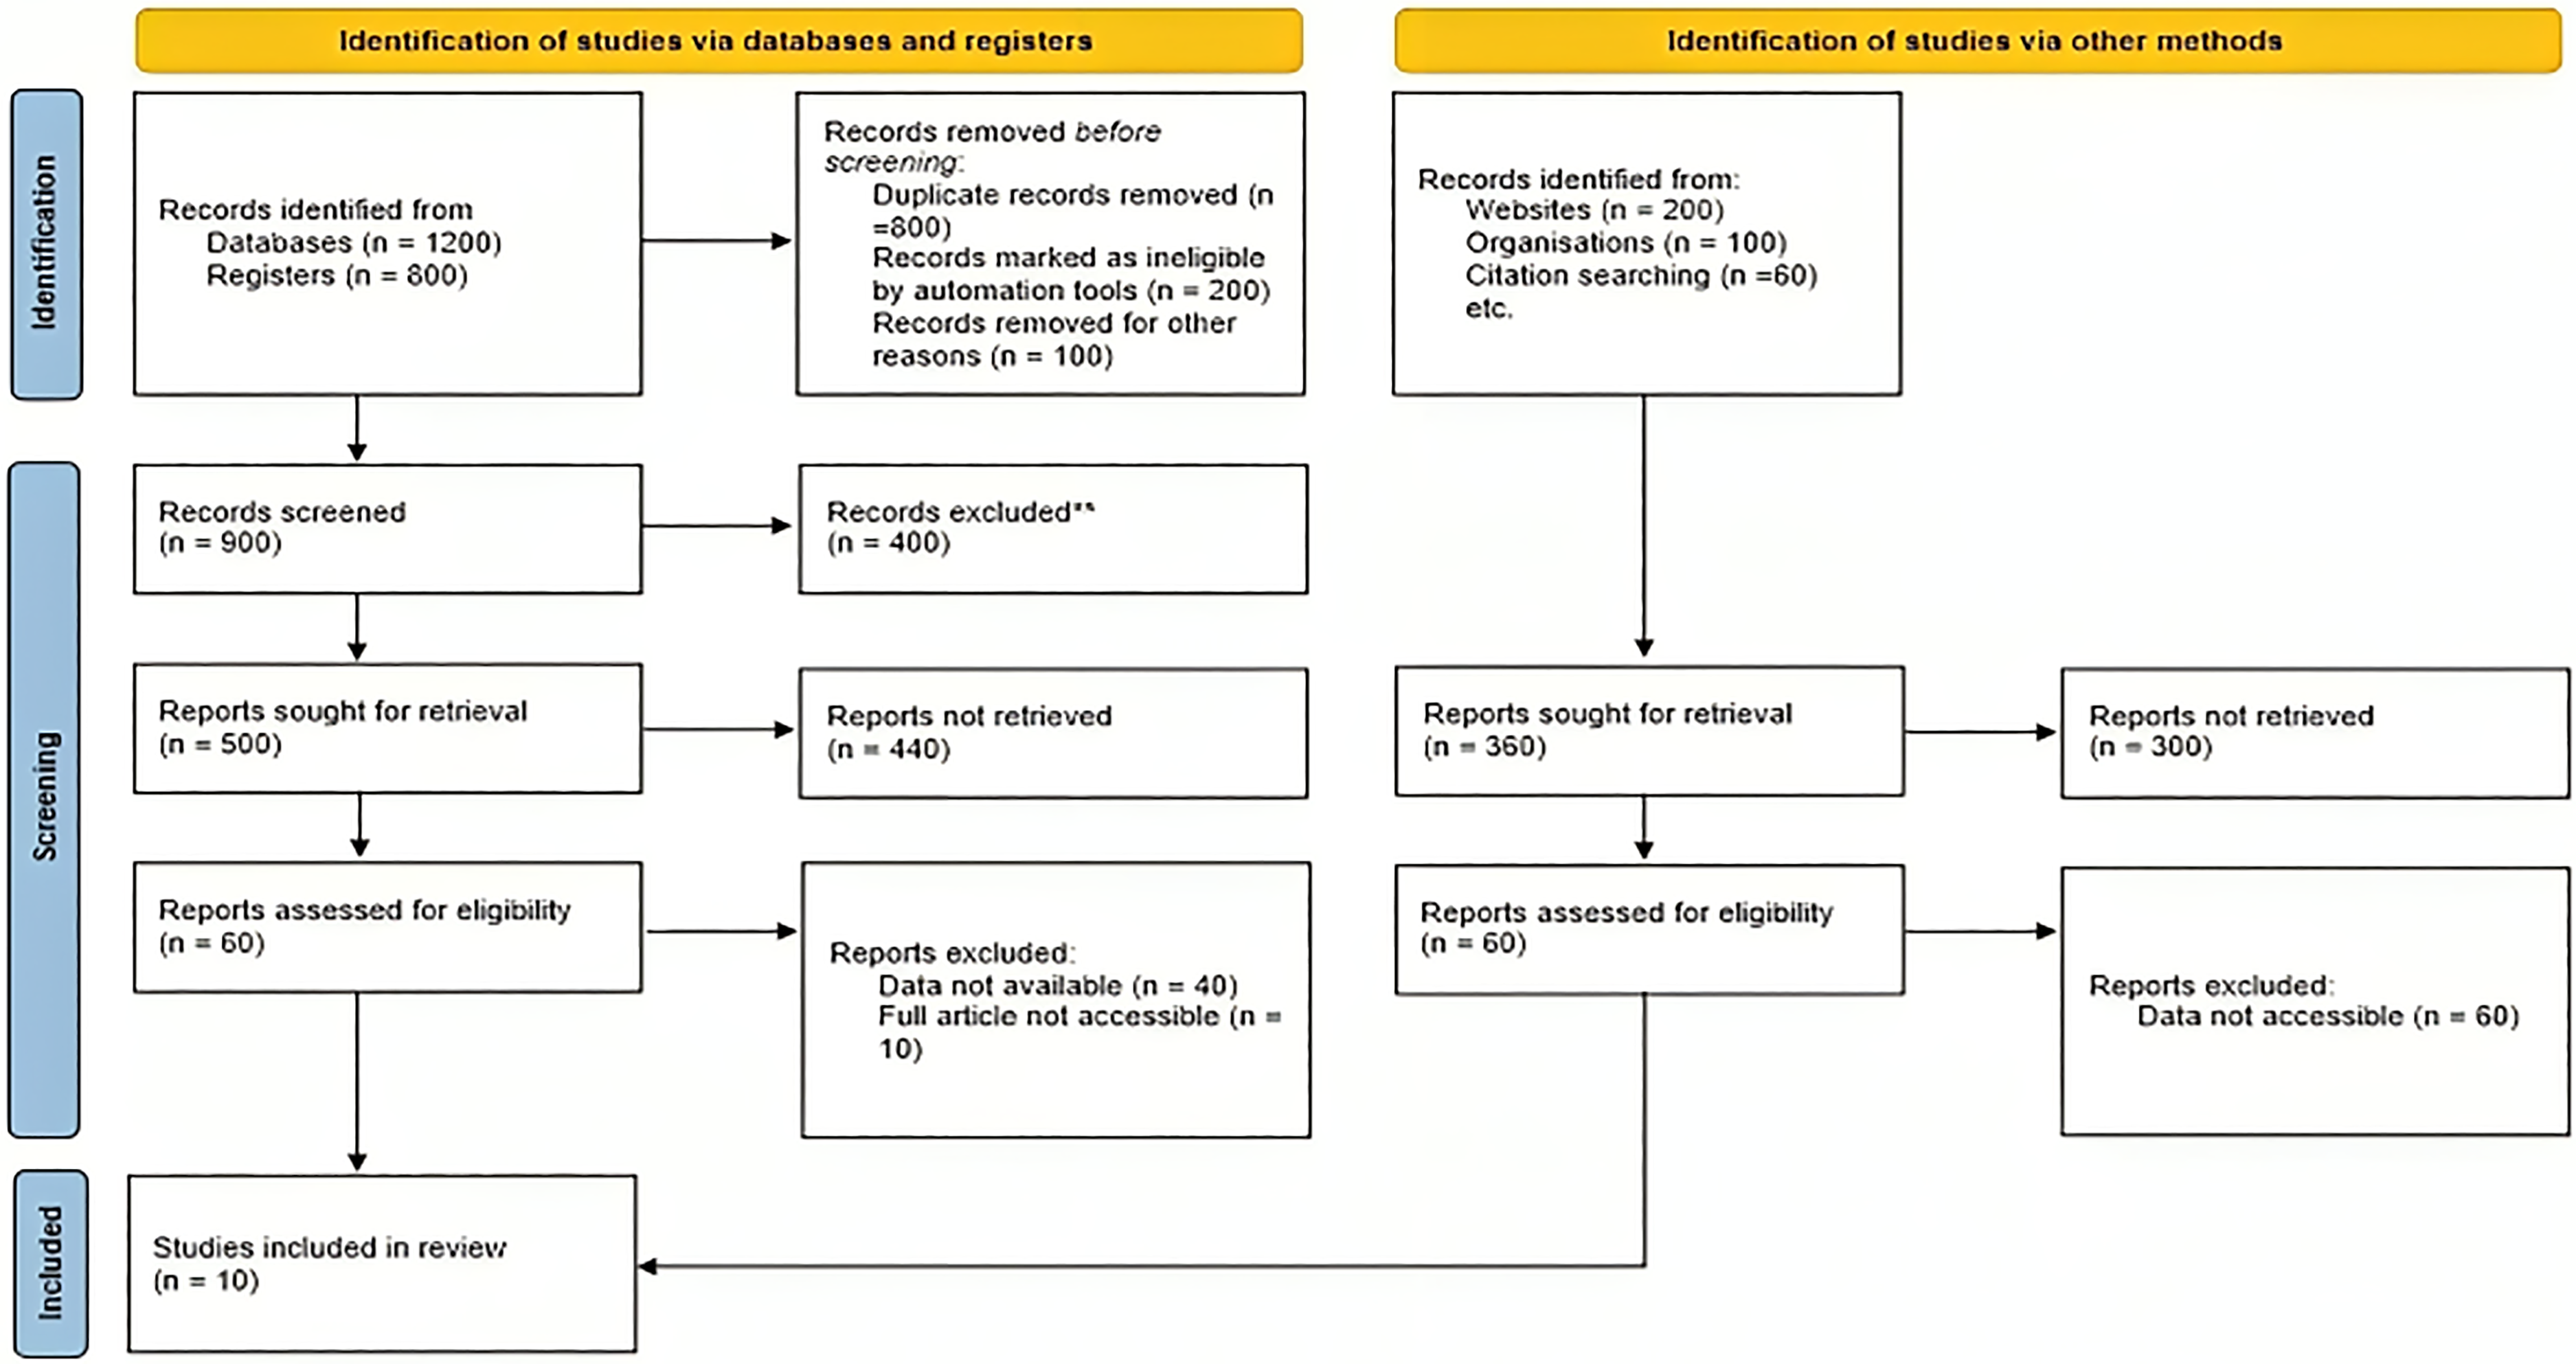
PRISMA chart for selection of studies in systematic review and meta-analysis. This flow diagram depicts the study selection process for the systematic review. From databases and registers, 2000 records were identified, with 1100 records removed before screening. After screening 900 records, 500 reports were sought for retrieval, but only 60 reports were assessed for eligibility, leading to 10 studies being included. Additionally, 360 records were identified through other methods, with none ultimately included due to inaccessible data. In total, 10 studies were included in the review after a comprehensive and rigorous selection process.
Based on the scores mentioned, a total of seven meta-analyses were conducted on each score as an effect size. First, a meta-analysis was conducted on the MMSE score with six studies.33–38 Similarly, a meta-analysis was conducted on the MoCA scale with two studies,38,39 the language score with four studies,34,39–41 the naming score with two studies,39,41 the visuo-spatial score with four studies,34,39–41 the memory score with six studies,34,37,39–42 and the attention score with five studies.34,39–42 The Figure 2 shows the layout of the current study, i.e., the scales used in the ten studies selected for meta-analysis. Table 2 provides the detailed results of the meta-analysis performed for all seven scales.
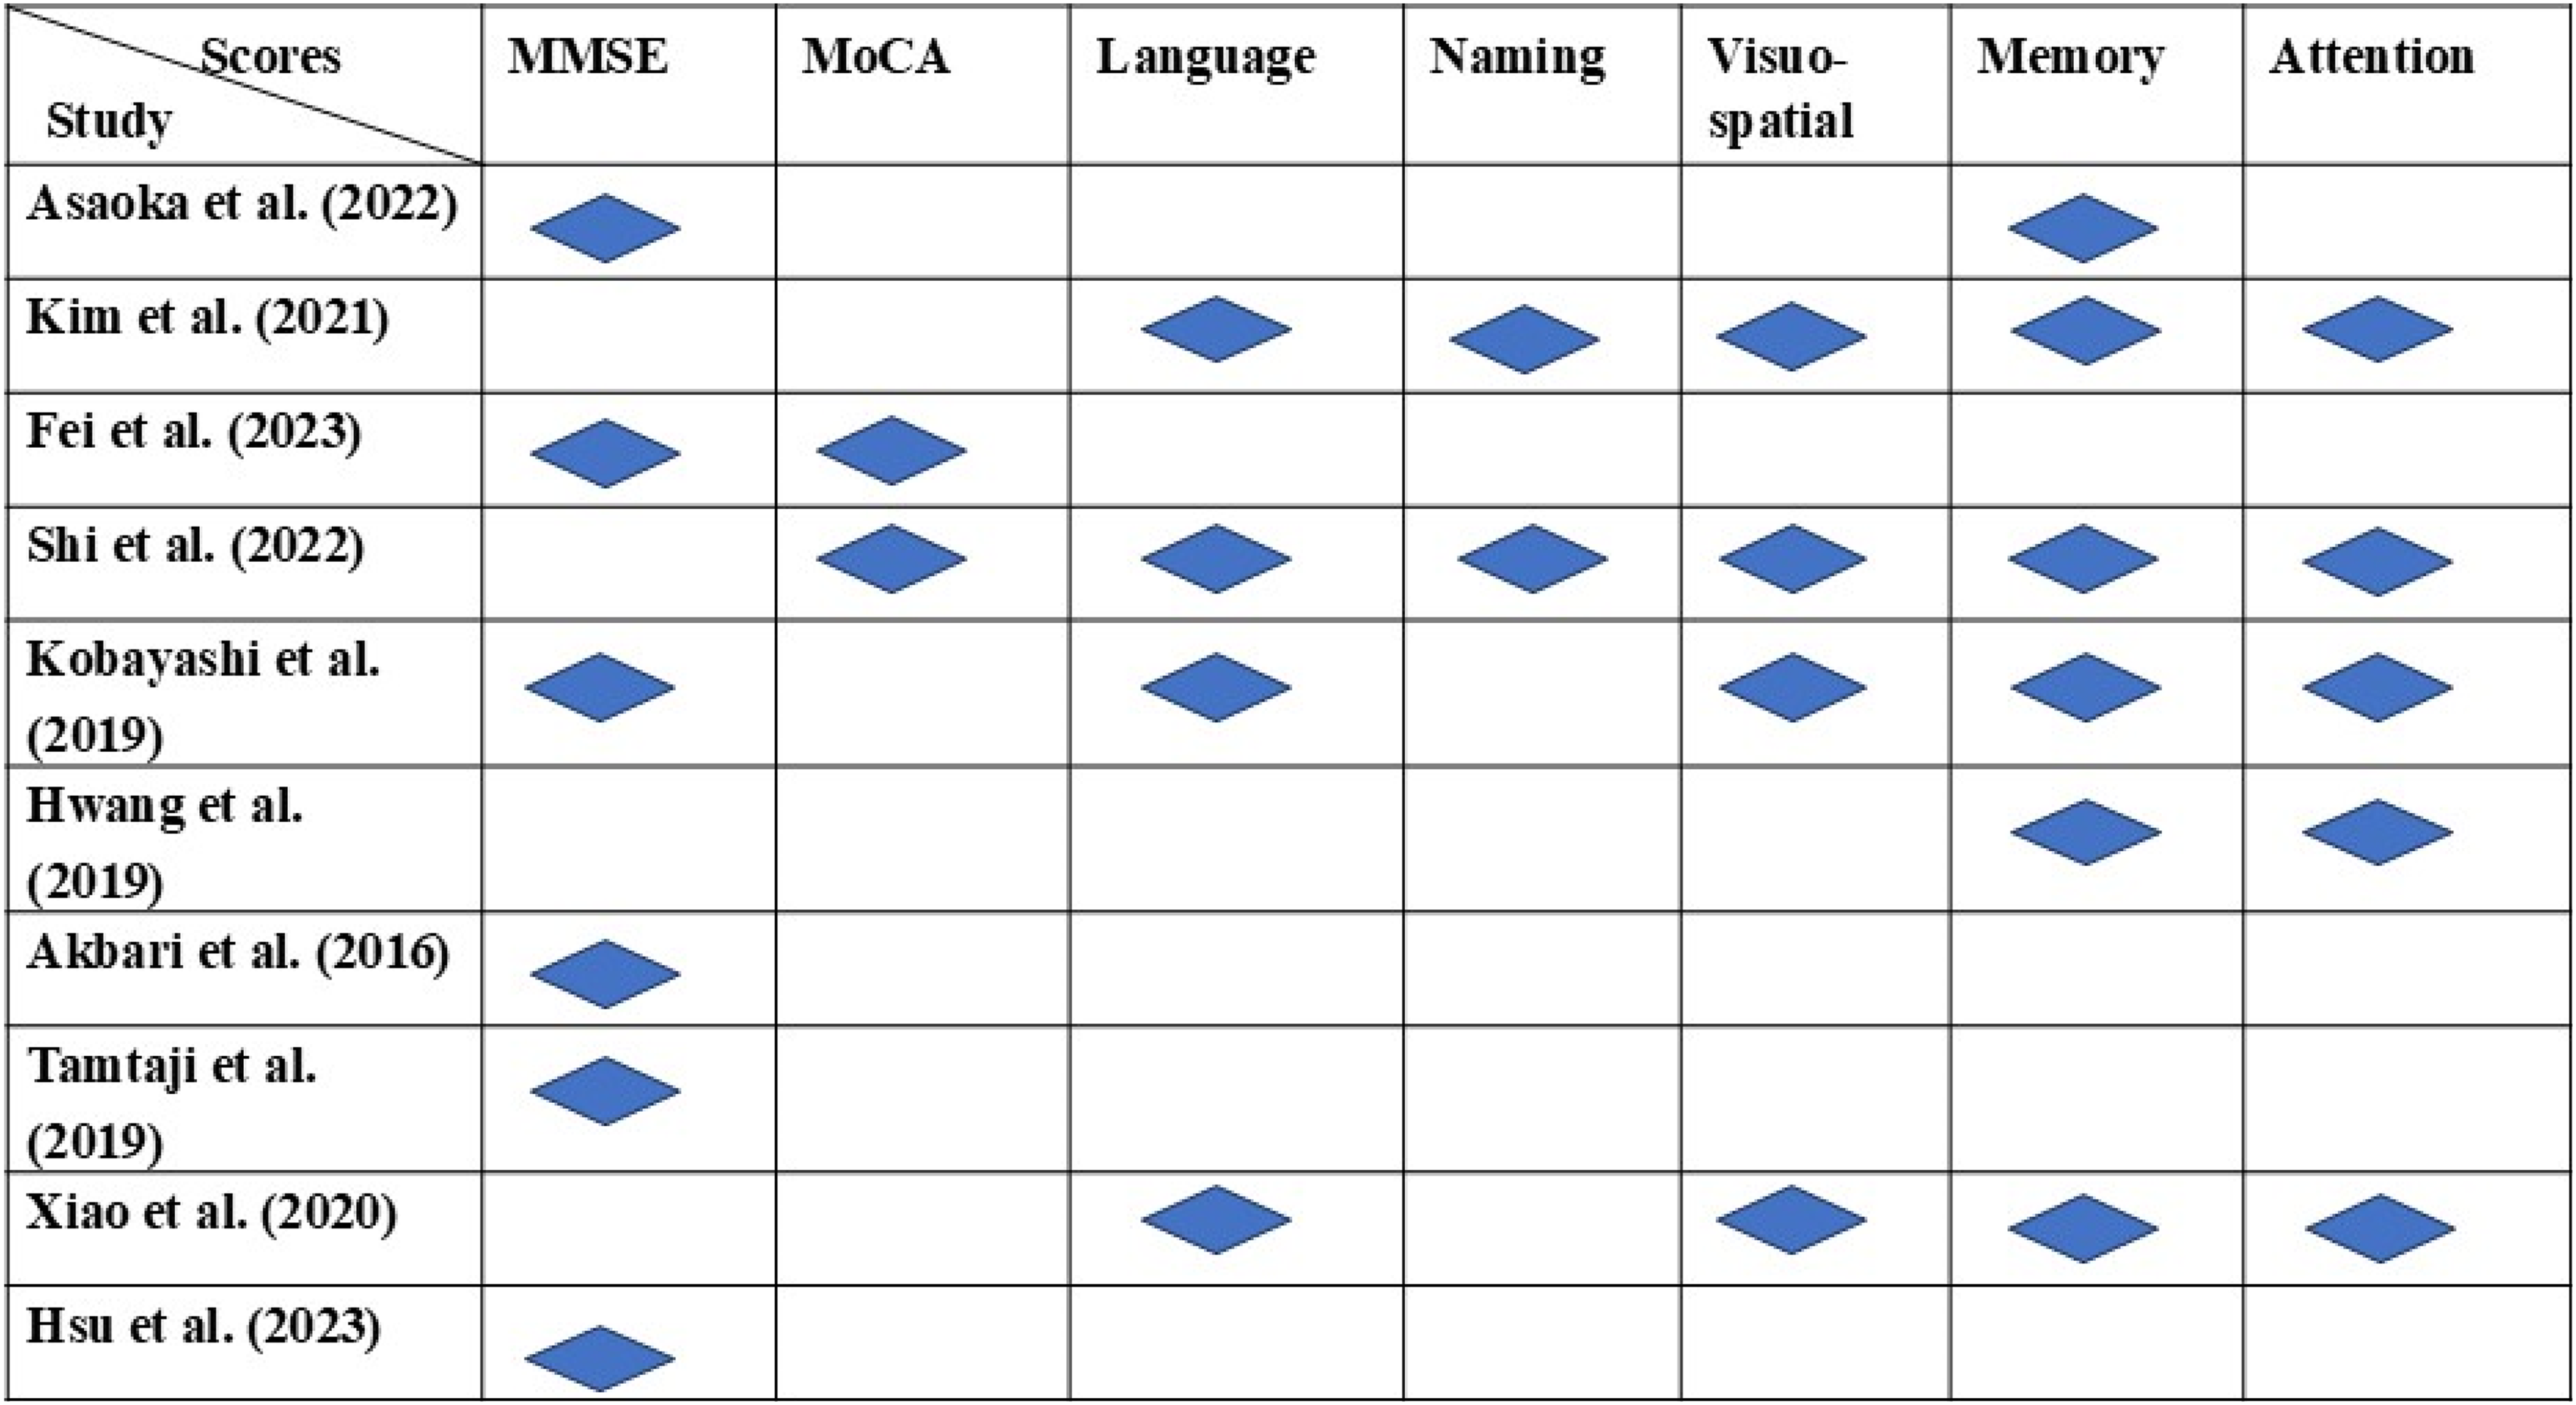
The scales utilized from different studies for meta-analysis. This figure highlights the cognitive domains evaluated in various studies included in the systematic review, covering MMSE, MoCA, language, naming, visuo-spatial, memory, and attention. Blue diamond's mark the domains assessed in each study. MSME was assessed by Asaoka et al. (2022), Fei et al. (2023), Kobayashi et al. (2019), Akbari et al. (2016), Tamtaij et al. (2018), and Hsu et al. (2023), while MoCA was assessed by Fei et al. (2023) and Shi et al. (2022). Language was assessed by Kim et al. (2021), Shi et al. (2022), Kobayashi et al. (2019), and Xiao et al. (2020). Naming was assessed by Kim et al. (2021) and Shi et al. (2022). Visuo-spatial was assessed by Kim et al. (2021), Shi et al. (2022), Kobayashi et al. (2019), and Xiao et al. (2020). Memory was assessed by Asaoka et al. (2022), Kim et al. (2021), Shi et al. (2022), Kobayashi et al. (2019), Hwang et al. (2019), and Xiao et al. (2020). Attention was assessed by Kim et al. (2021), Shi et al. (2022), Kobayashi et al. (2019), Hwang et al. (2019), and Xiao et al. (2020). All variabilities assessed across the studies, reflecting a diverse focus on different cognitive functions.
Result of meta-analysis on 7 scales, to assess the role of probiotics on ad.
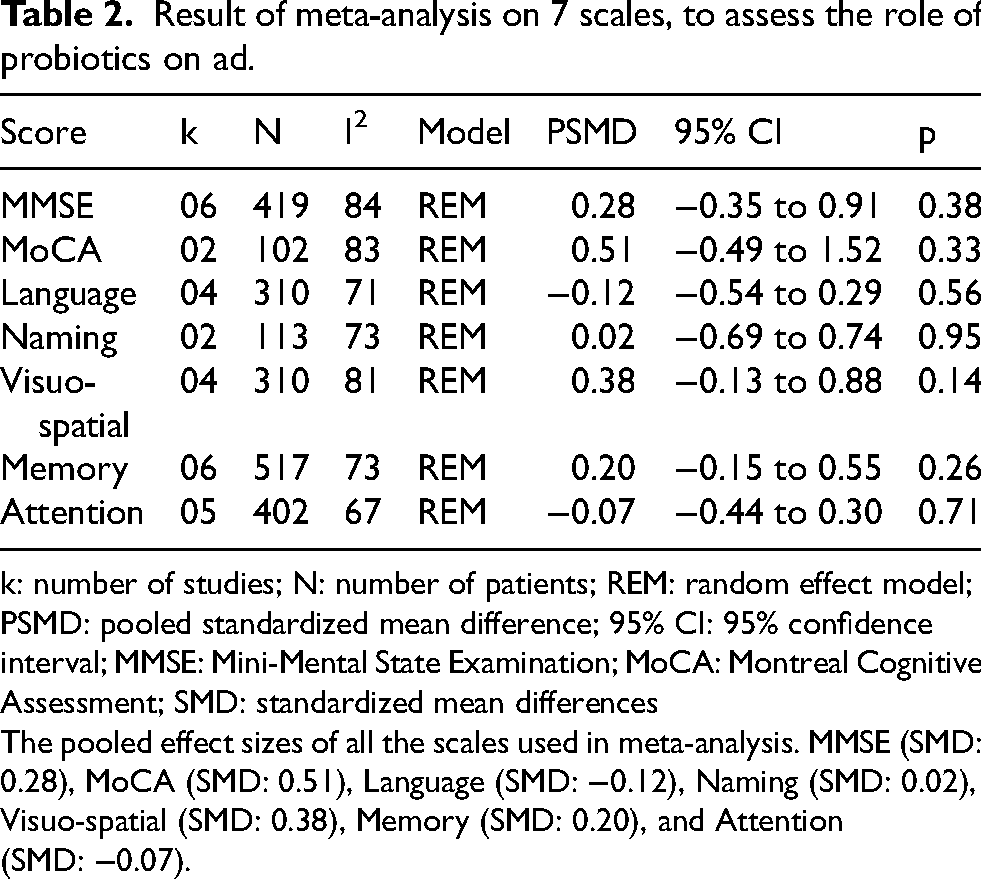
k: number of studies; N: number of patients; REM: random effect model; PSMD: pooled standardized mean difference; 95% CI: 95% confidence interval; MMSE: Mini-Mental State Examination; MoCA: Montreal Cognitive Assessment; SMD: standardized mean differences
The pooled effect sizes of all the scales used in meta-analysis. MMSE (SMD: 0.28), MoCA (SMD: 0.51), Language (SMD: −0.12), Naming (SMD: 0.02), Visuo-spatial (SMD: 0.38), Memory (SMD: 0.20), and Attention (SMD: −0.07).
Meta-analysis of MMSE score
The meta-analysis involved six studies with a total of 419 observations. The heterogeneity between these studies was statistically significant (p < 0.01). The I² was 84% with 95% of CI (66.5% to 92.3%), necessitating the use of a random-effects model to estimate the pooled effect size. The pooled effect size was a SMD of 0.28 (95% CI −0.35–0.91), which was statistically insignificant (p = 0.38). The SMDs for individual studies were as follows: Hsu et al. (2023) −0.53 (95% CI −1.24–0.18), Kobayashi et al. (2019) −0.21 (95% CI −0.57–0.15), Asaoka et al. (2022) −0.07 (95% CI −0.43–0.29), Akbari et al. (2016) 0.33 (95% CI −0.18–0.84), Tamtaji et al. (2019) 0.43 (95% CI −0.11–0.98), and Fei et al. (2023) 1.87 (95% CI 1.13–2.60). Asaoka et al. (2022) and Kobayashi et al. (2019) were assigned the highest weight (17.9% each), while the lowest weight (15.1%) was assigned to the study by Fei et al. (2023). The forest plots for this meta-analysis are illustrated in Figure 3a, and the publication bias is depicted in the inverted funnel plots shown in Figure 4a.
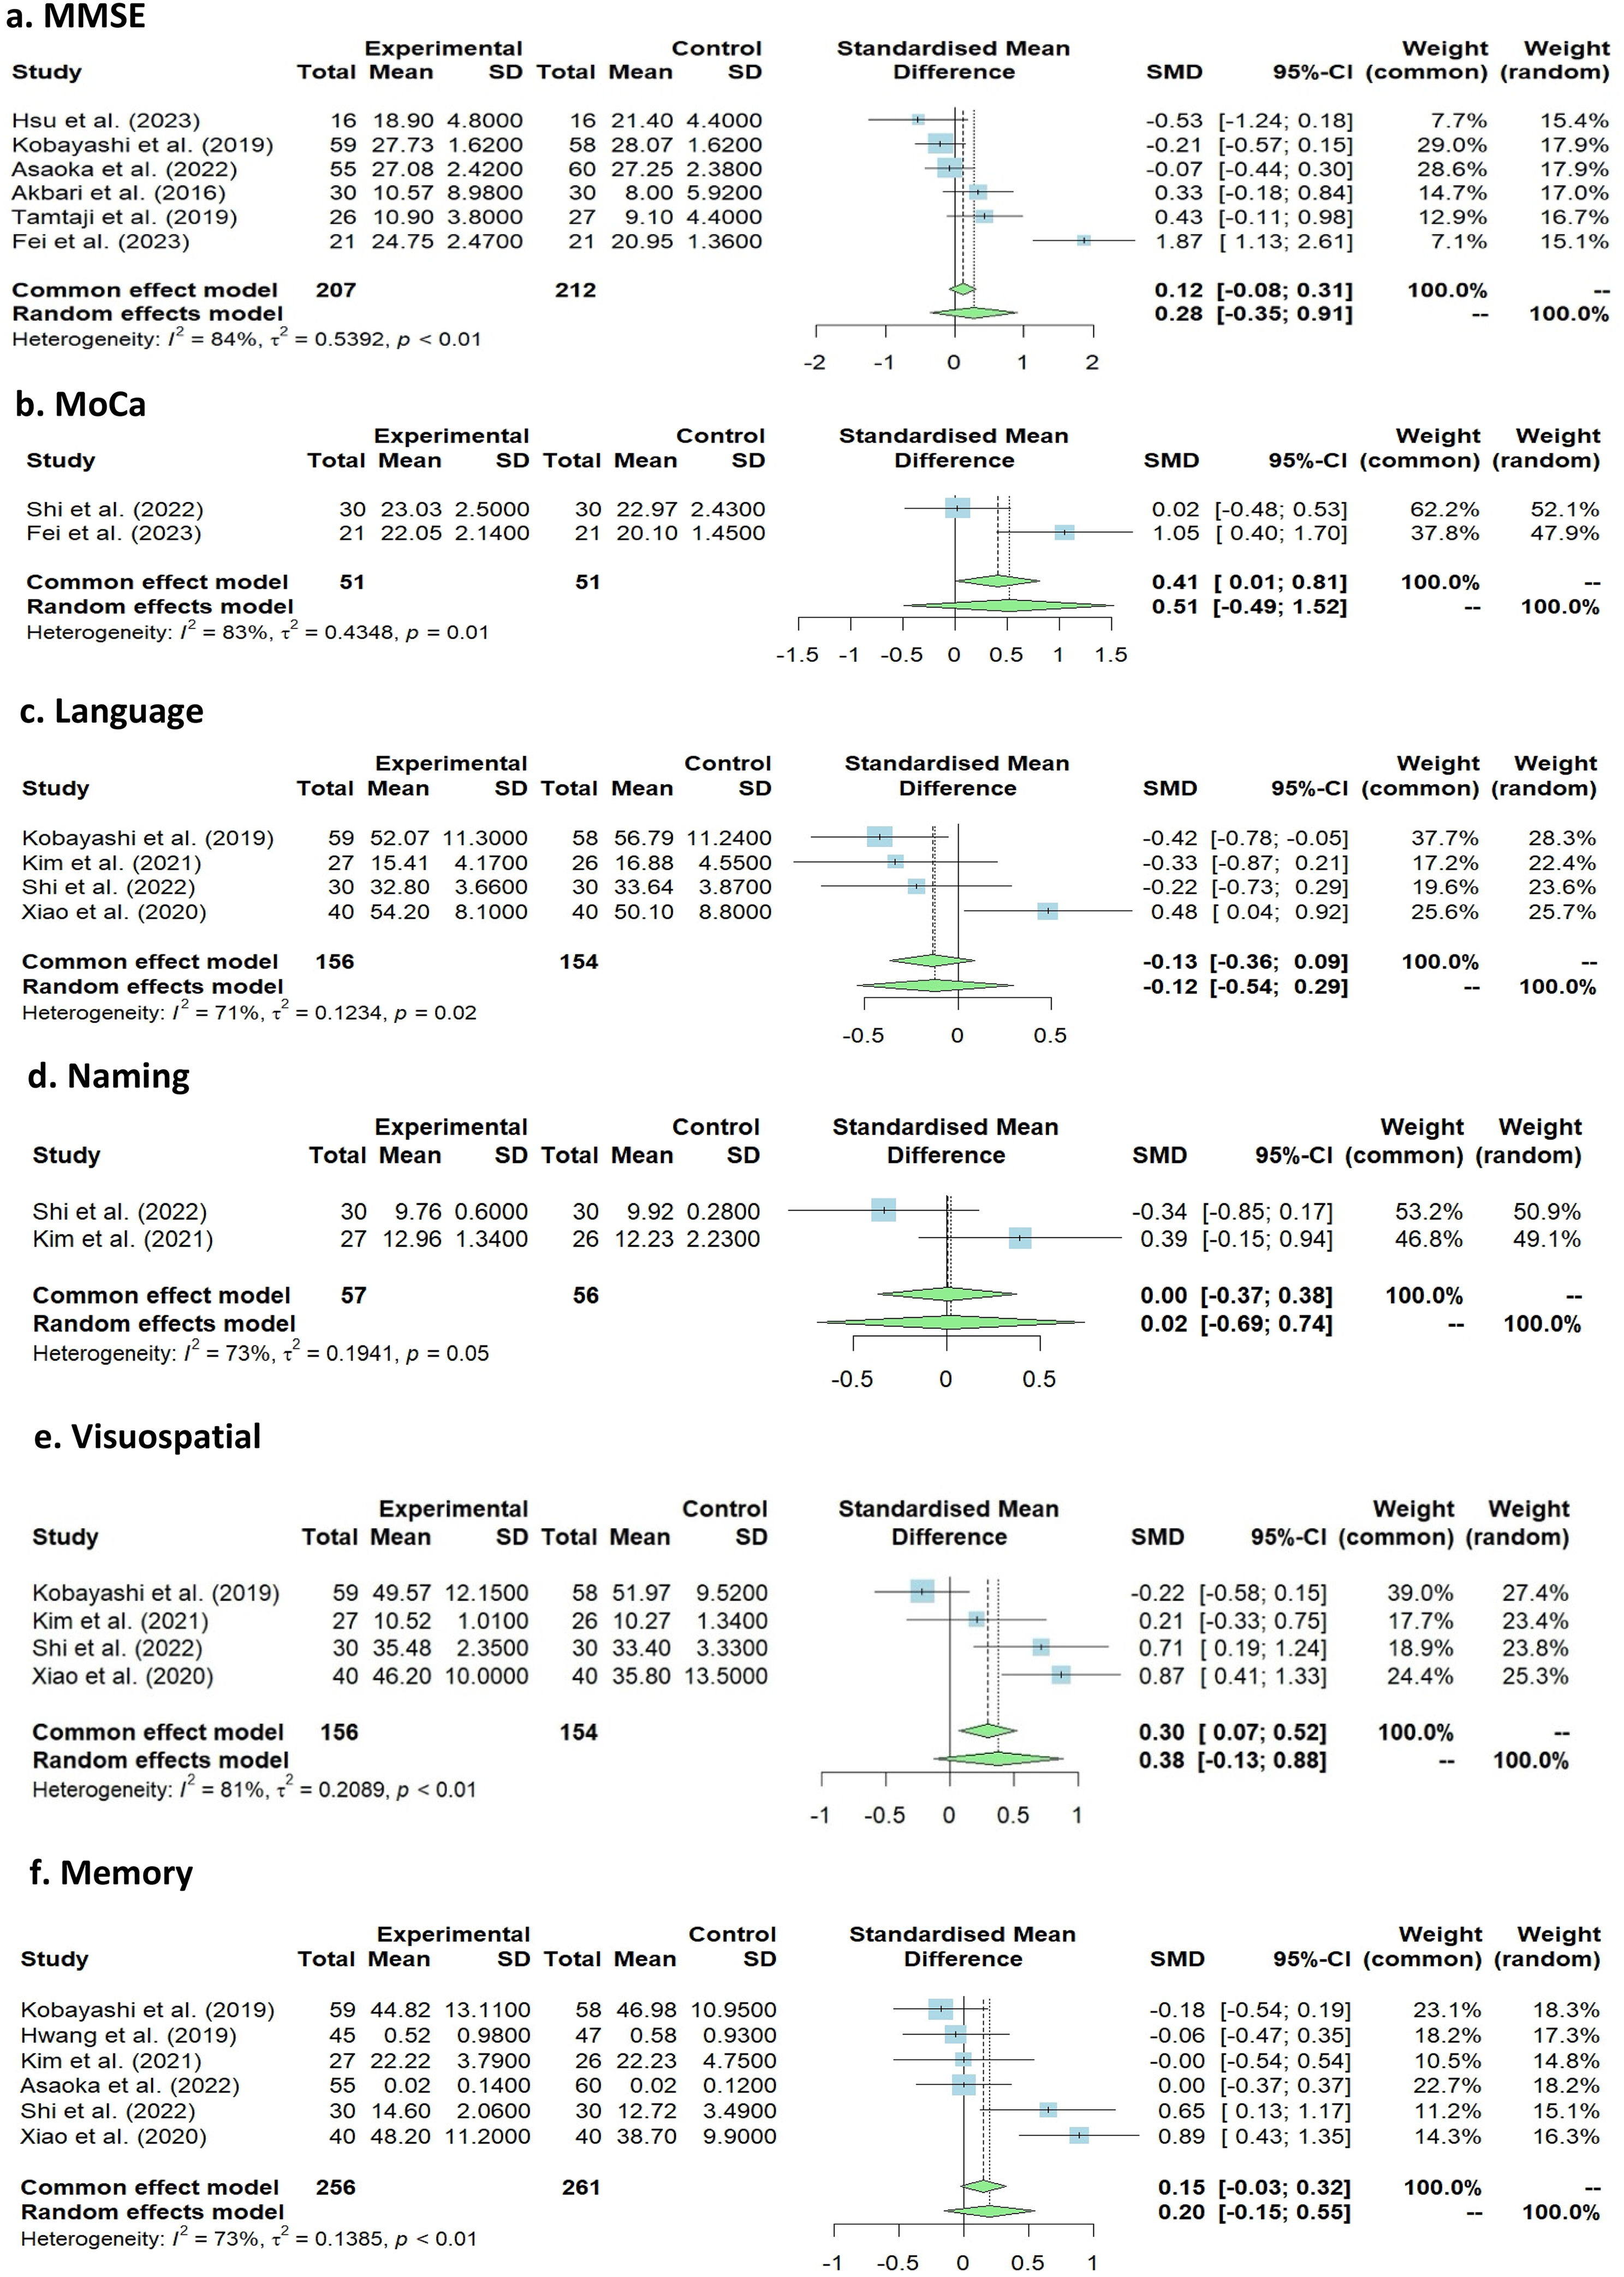
Forest plot with pooled effect size for each score as effect size in meta-analysis. This figure summarizes the meta-analysis results for MMSE, MoCA, language, naming, visuo-spatial, memory, and attention cognitive domains. The standardized mean differences (SMD) between experimental and control groups, along with 95% confidence intervals (CI), are presented for each domain. MMSE (Figure 3(a)) includes six studies with an SMD of 0.28 (95% CI: −0.35, 0.91) and moderate heterogeneity (I²=84%). MoCA (Figure 3(b)) includes two studies with an SMD of 0.51 (95% CI: −0.49, 1.52) and high heterogeneity (I²=83%). Language (Figure 3(c)) includes four studies with an SMD of −0.12 (95% CI: −0.54, 0.29) and substantial heterogeneity (I²=71%). Naming (Figure 3(d)) includes two studies with an SMD of 0.02 (95% CI: −0.69, 0.74) and high heterogeneity (I²=73%). Visuospatial (Figure 3(e)) includes four studies with an SMD of 0.38 (95% CI: −0.13, 0.88) and high heterogeneity (I²=81%). Memory (Figure 3(f)) includes six studies with an SMD of 0.07 (95% CI: −0.15, 0.55) and high heterogeneity (I²=73%). Attention (Figure 3 g) includes five studies with an SMD of −0.07 (95% CI: −0.44, 0.30) and high heterogeneity (I²=67%). The contributions of individual studies to the overall effect size are also indicated.
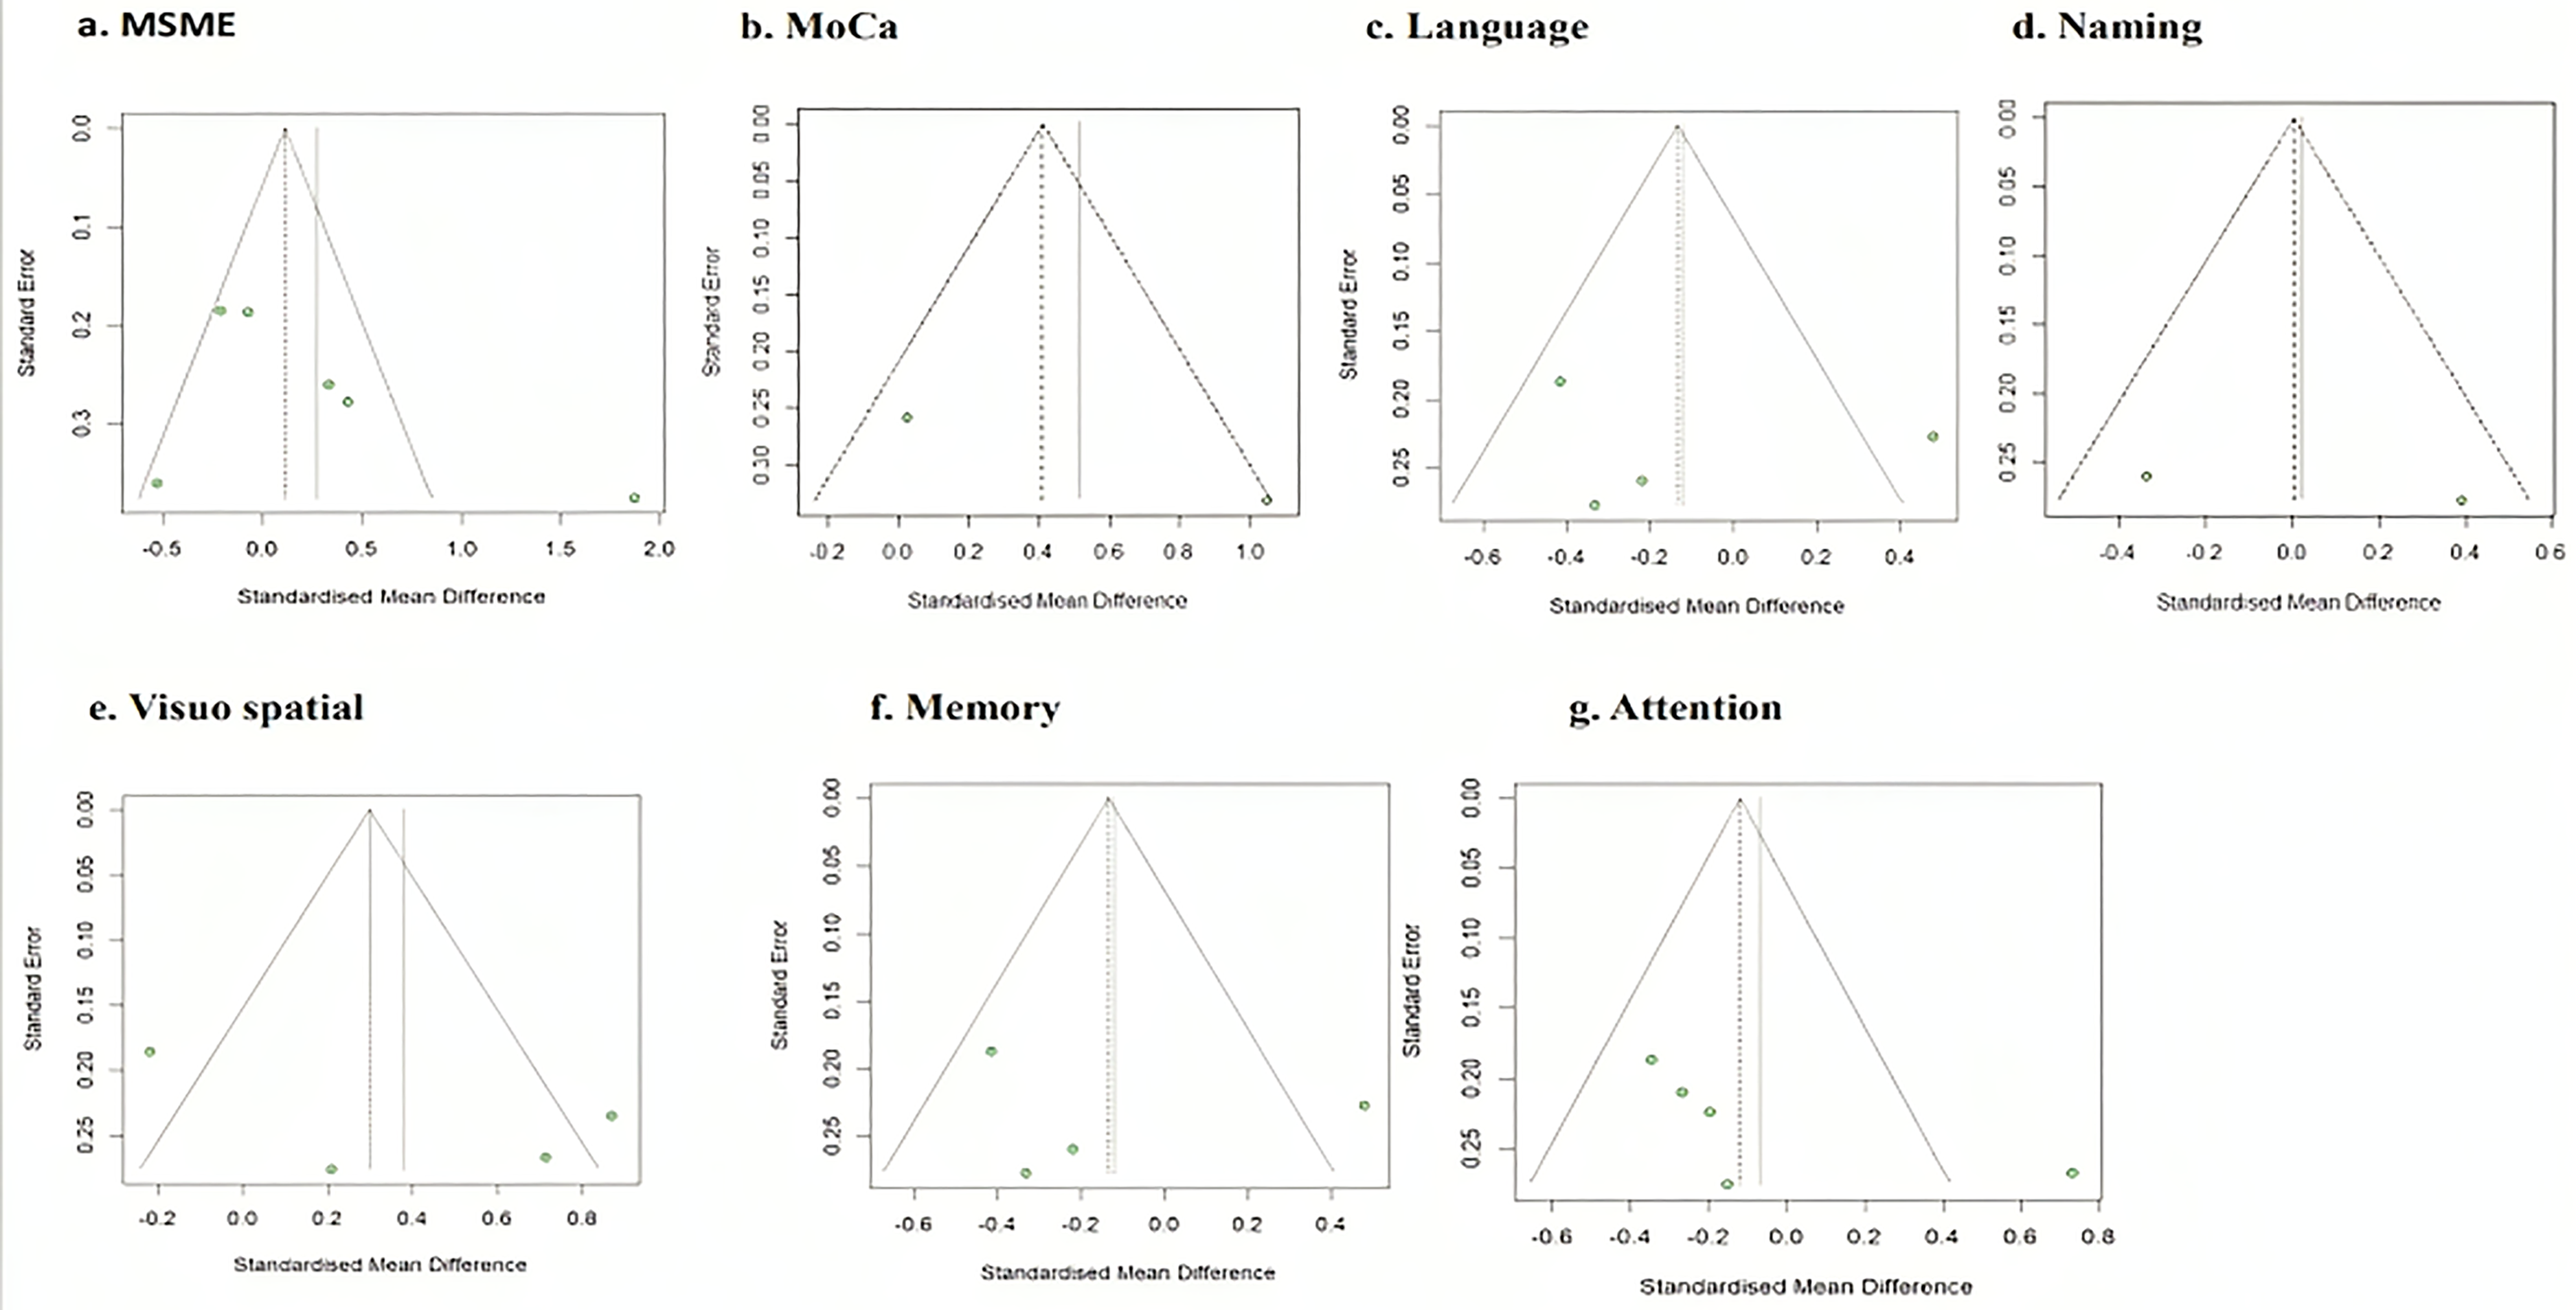
Funnel plots for each score as effect size. The funnel plots (Figure 4 (a to g) suggest publication bias when MMSE, MoCA, language, naming, visuo-spatial, memory and attention score were outcomes of interest, whereas, no publication bias was observed when MoCA score was outcome of interest.
Meta-analysis of MoCA score
The meta-analysis included two studies with a total of 102 observations. The heterogeneity between these studies was statistically significant (p = 0.01). The I² was 83% with 95% of CI (29.8% to 96.0%), necessitating the use of a random-effects model to estimate the pooled effect size. The pooled effect size was a SMD of 0.51 (95% CI −0.49–1.52), which was statistically insignificant (p = 0.33). The SMDs for the individual studies were as follows: Shi et al. (2022) −0.02 (95% CI −0.48–0.53) and Fei et al. (2023) −1.05 (95% CI 0.40–1.70). Shi et al. (2022) were assigned the highest weight (52.1%), while the lowest weight (47.9%) was assigned to the study by Fei et al. (2023). The forest plots for this meta-analysis are illustrated in Figure 3(b), and the publication bias is depicted in the inverted funnel plots shown in Figure 4(b).
Meta-analysis of language score
A total of four studies were involved in the meta-analysis with 310 observations. The heterogeneity between the studies was statistically significant (p = 0.02). The I2 was 71% with 95% of CI (16.0% to 89.7%), necessitating the use of a random-effects model to estimate the pooled effect size. The pooled effect size was a SMD of 0.12 (95% CI −0.54–-0.29), which was statistically insignificant (p = 0.56). The SMDs for individual studies were as follows: Kobayashi et al. (2019) −0.42 (−0.78–-0.05), Shi et al. (2022) −0.22 (−0.72–0.28), Kim et al. (2021) −0.33 (−0.87–0.21), and Xiao et al. (2020) −0.48 (0.04–0.92). Kobayashi et al. (2019) were assigned the highest weight (28.3%), while the lowest weight (22.4%) was assigned to the study by Kim et al. (2021). The forest plots for this meta-analysis are illustrated in Figure 3(c), and the publication bias is depicted in the inverted funnel plots shown in Figure 4(c).
Meta-analysis of naming score
Two studies were involved in the meta-analysis with 113 observations. The heterogeneity between the studies was statistically insignificant (p = 0.05). The I2 was 73% with 95% of CI (0.0% to 93.9%), necessitating the use of a random-effects model to estimate the pooled effect size. The pooled effect size was a SMD of 0.02 (95% CI −0.69–0.74), which was statistically insignificant (p = 0.95). The SMDs for individual studies were as follows: Shi et al. (2022) −0.33 (−0.84–0.17) and Kim et al. (2021) −0.39 (−0.15–0.94). Shi et al. (2022) were assigned the highest weight (50.9%), while the lowest (49.1%) weight was assigned to the study by Kim et al. (2021) The forest plots for this meta-analysis are illustrated in Figure 3(d), and the publication bias is depicted in the inverted funnel plots shown in Figure 4(d).
Meta-analysis of visuo-spatial score
A total of three studies were involved in the meta-analysis with 310 observations. The heterogeneity between the studies was statistically significant (p < 0.01). The I2 was 81% with 95% of CI (51.7% to 92.9%), necessitating the use of a random-effects model to estimate the pooled effect size. The pooled effect size was a SMD of 0.38 (95% CI −0.13–0.88), which was statistically insignificant (p = 0.14). The SMDs for individual studies were as follows: Kobayashi et al. (2019) −0.22 (−0.58–0.15), Shi et al. (2022) −0.71 (1.18–1.23), Kim et al. (2021) −0.20 (−0.33–0.74), and Xiao et al. (2020) −0.87 (0.41–1.33). Kobayashi et al. (2019) were assigned the highest weight (27.4%), while the lowest weight (23.4%) was assigned to the study by Kim et al. (2021). The forest plots for this meta-analysis are illustrated in Figure 3(e), and the publication bias is depicted in the inverted funnel plots shown in Figure 4(e).
Meta-analysis of memory score
A total of six studies were involved in the meta-analysis with 517 observations. The heterogeneity between the studies was statistically significant (p < 0.01). The I2 was 73% with 95% of CI (38.1% to 88.3%), necessitating the use of a random-effects model to estimate the pooled effect size. The pooled effect size was a SMD of 0.20 (95% CI −0.15–0.55), which was statistically insignificant (p = 0.26). The SMDs for individual studies were as follows: Kobayaschi et al. (2019) −0.18 (−0.54–0.54), Hwang et al. (2019) −0.06 (−0.47–0.35), Asaoka et al. (2022)- 0.00 (−0.36–0.36), Shi et al. (2022)- 0.64 (0.12–1.16), Kim et al. (2021) −0.00 (−0.54–0.53), and Xiao et al. (2020)—0.89 (0.43–1.35). Kobayashi et al. (2019) were assigned the highest weight (18.3%), while the lowest weight (14.8%) was assigned to the study by Kim et al. (2021). The forest plots for this meta-analysis are illustrated in Figure 3(f), and the publication bias is depicted in the inverted funnel plots shown in Figure 4(f).
Meta-analysis of attention score
A total of five studies were involved in the meta-analysis with 402 observations. The heterogeneity between the studies was statistically significant (p = 0.02). The I2 was 67% with 95% of CI (15.8% to 87.4%), necessitating the use of a random-effects model to estimate the pooled effect size. The pooled effect size was a SMD of −0.07 (95% CI −0.44–0.30), which was statistically insignificant (p = 0.71). The SMDs for individual studies were as follows: Kobayashi et al. (2019) −0.35 (−0.71–0.02), Hwang et al. (2019) −0.27 (−0.68–0.14), Xiao et al. (2020) −0.20 (−0.64–0.24), Shi et al. (2022) 0.73 (0.21–1.26), and Kim et al. (2021) −0.15 (−0.69–0.39). Kobayashi et al. (2022) were assigned the highest weight (22.5%), while the lowest weight (17.8%) was assigned to the study by Kim et al. (2021) The forest plots for this meta-analysis are illustrated in Figure 3 g, and the publication bias is depicted in the inverted funnel plots shown in Figure 4 g.
Quality of life studies
All the ten studies involved in systematic review were under high domain quality with Jadad score more than three. The results of individual domains with the Jadad score are displayed in the Table 3. Hwang et al. (2019), Tamtaji et al. (2019), Xiao et al. (2020), Kobayashi et al. (2022), Kim et al. (2021), and Shi et al. (2022) were given five scores as all the descriptions were clearly given in this study. Asaoka et al. (2022), Akbari et al. (2016), and Hsu et al. (2023) was given four score as it has not given the descriptions of withdrawal and dropouts. Fei et al. (2023) was given three score as there was no blinding performed in this study.
Jadad score calculation based on 3 domains for RCTs included in meta-analysis.
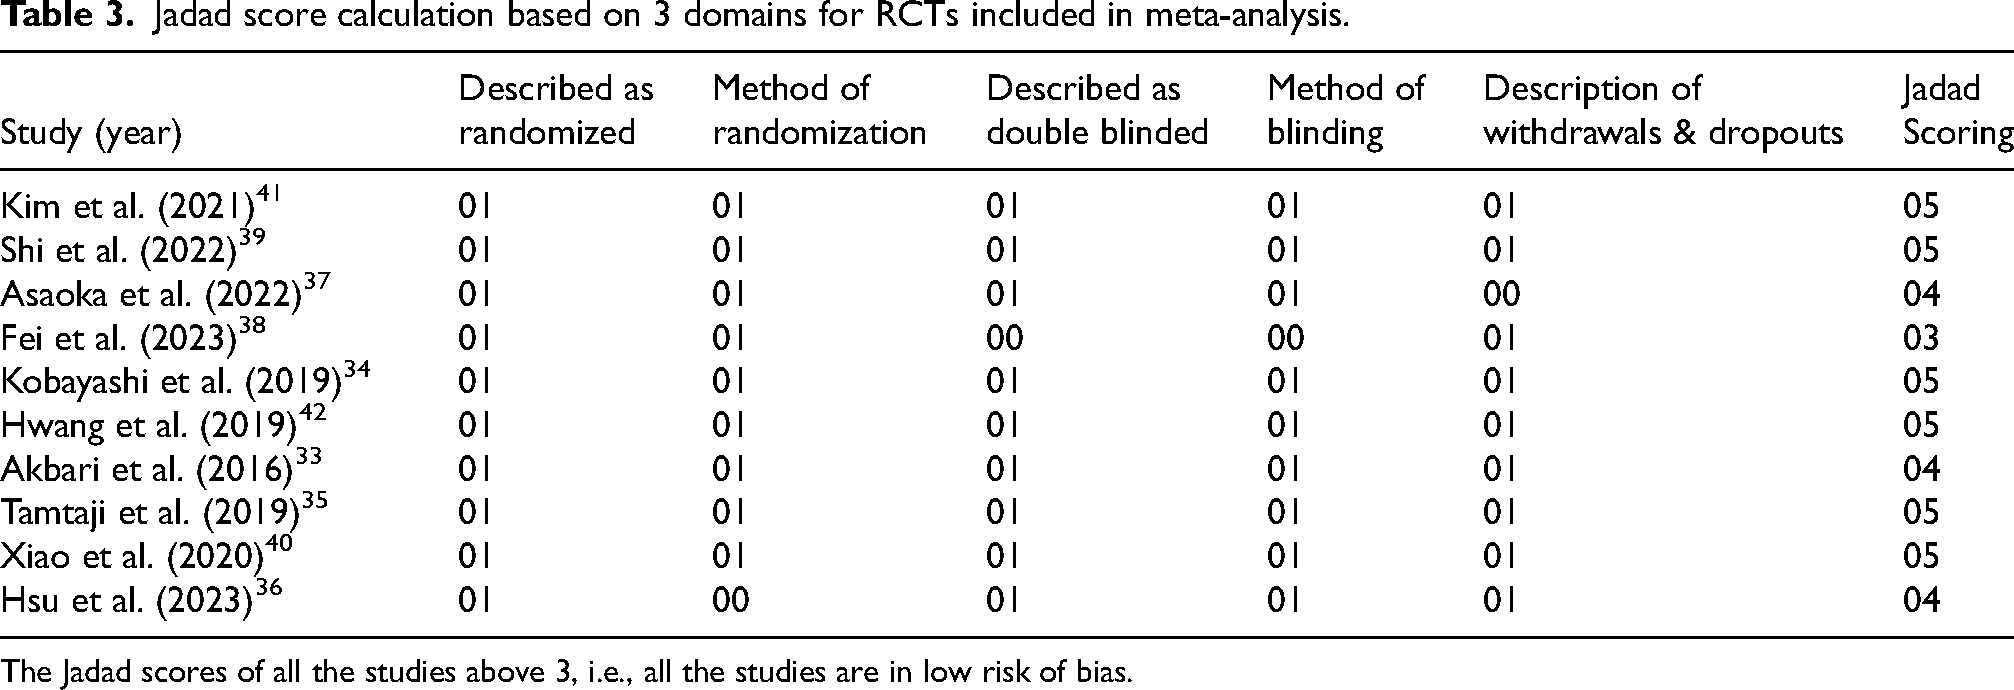
The Jadad scores of all the studies above 3, i.e., all the studies are in low risk of bias.
Discussion
AD is a neurodegenerative disease characterized by the accumulation of Aβ plaques and tau binding to neurofibrillary tangles. 43 Chronic neuroinflammation is also a feature of AD. Recent research suggests that dysbiosis in the gut microbiome may exacerbate neuroinflammation by increasing intestinal permeability, allowing harmful microbial metabolites to enter the bloodstream and trigger inflammatory responses in the brain, potentially affecting microglial activation. 44 This disruption in gut microbiota, including a decrease in beneficial bacteria such as Bifidobacterium and an increase in harmful bacteria like Escherichia/Shigella, is observed in both MCI and AD. 45 These microbiota alterations provide insights into the pathogenic mechanisms linking gut health to neuroinflammation and AD progression. Probiotics, including strains like Lactobacilli, Streptococci, Pediococcus, Enterococcus, Bifidobacteria, and Saccharomyces boulardii, are used to modulate gut microbiota and potentially affect brain health. 45 Emerging evidence indicates that probiotics may enhance cognitive function in MCI and AD by reducing oxidative stress and inflammation. Probiotics can restore gut balance by increasing beneficial bacteria and decreasing harmful ones, thereby reducing oxidative stress and inflammation associated with cognitive decline. 15 For instance, the SLB51 probiotic formulation was shown to modify gut microbiome composition and plasma metabolite levels, resulting in reduced Aβ plaque accumulation in early AD mouse models and a partial recovery of neuronal autophagy pathways.46,47 Other probiotics, such as Lactobacillus johnsonii, Bifidobacterium infantis, and Bifidobacterium breve A1, have been associated with anti-inflammatory effects, the restoration of proteasome function, and a reduction in Aβ load. 48 Additionally, clinical trials have demonstrated that probiotic mixtures can improve cognitive performance in AD patients by influencing insulin resistance, oxidative stress, and inflammatory markers. 35
Our meta-analysis of ten studies revealed inconsistent effects of probiotics on cognitive function in MCI and AD patients. The analysis of MMSE and MoCA scores yielded non-significant overall effects (SMDs of 0.28 and 0.51) with high heterogeneity (I² = 84% and 83%). Language, Naming, and Visuo-spatial scores showed no significant benefits (SMDs of −0.12, 0.02, and 0.38) with substantial variability (I² = 71% to 81%). Similarly, Memory and Attention scores showed no significant impact (SMDs of 0.20 and −0.07) with moderate to high heterogeneity (I² = 67% to 73%). These variations may be attributed to differences in probiotic strains, dosages, and study designs. This underscores the need for larger, more standardized trials to validate the efficacy of probiotics for cognitive improvement in these patient population. Despite these findings, the literature consistently supports the link between gut health and cognition, with gut dysbiosis associated with neurodegenerative conditions like AD. 53 Probiotics contribute to the production of short-chain fatty acids like butyrate, which have anti-inflammatory properties that may help mitigate neuroinflammation in AD. The beneficial effects of probiotic-derived butyrate are due to its production in a healthy, balanced gut microbiota which maintains gut barrier integrity and reduces systemic inflammation more effectively than butyrate produced by pathogenic bacteria associated with dysbiosis. 49 Furthermore, probiotics can influence neurotransmitter production, including mood-regulating neurotransmitters like serotonin and GABA. While there is limited evidence on probiotics’ direct role in enhancing acetylcholine production, they may support neurotransmitter balance and brain health indirectly by promoting a healthy gut microbiota and reducing inflammation. 50 Probiotics may also enhance the integrity of the blood-brain barrier, preventing harmful substances from entering the brain. 51 This complex interaction highlights the potential of probiotics in addressing multiple aspects of AD through microbial modulation, anti-inflammation, neurotransmitter regulation, and barrier integrity. 52
Our study did not find significant effects of probiotics on any of the seven cognitive scales. This may be due to the specific mechanisms of probiotic action, or limitations in sample size and study design. Despite these findings, the literature consistently supports a link between gut health and cognition, with gut dysbiosis associated with neurodegenerative conditions like AD. Our study examined diverse cognitive domains, including memory, attention, and visuospatial abilities, but observed no significant impact on MCI and AD patients.45,53 Literature evidence suggests that administering single probiotic strains for over 12 weeks at doses exceeding 1 × 10^9 CFU/g is more effective in improving cognition. This improvement likely results from sustained gut colonization, modulation of the gut-brain axis, and enhanced production of short-chain fatty acids like butyrate, which have anti-inflammatory and neuroprotective properties. Higher doses of probiotics also improve gut barrier integrity and reduce systemic inflammation, contributing to better cognitive outcomes. 19 While probiotics may offer cognitive benefits, current evidence remains inconclusive due to variability in individual responses and the lack of long-term data. Future research should involve larger sample sizes, consistent study designs, and extended intervention periods to clarify the potential role of probiotics in supporting cognitive health in MCI and AD patients. Additionally, addressing the observed publication bias in various cognitive scales, such as MMSE, MoCA, etc., and the variability in study methods is essential to understanding the exact impact of probiotics on diverse cognitive domains.
Conclusions
Our meta-analysis found no significant evidence supporting the beneficial effects of probiotics on cognitive function, memory, or daily life abilities in MCI and AD patients, contrary to some literature. This discrepancy arises from variations in probiotic strains, dosages, and study methodologies, which contributed to high heterogeneity in our results. The lack of significant effects may also reflect limitations in sample sizes and intervention durations. While literature suggests that probiotics could positively influence cognitive health by maintaining a balanced intestinal microbiome, this study contributes to the field by highlighting the need for more rigorous, standardized trials to validate the role of probiotics in cognitive health, thus addressing gaps and inconsistencies in the current evidence base.
Footnotes
Acknowledgments
Authors acknowledge the help and access to research publications provided by the All-India Institute of Medical Sciences (AIIMS), New Delhi, India. We also acknowledge AIIMS, New Delhi, for providing the intramural grant (AC-55) to support the pilot study.
Author contributions
Shashank Tripathi (Investigation; Methodology; Validation; Visualization; Writing—original draft; Writing – review & editing); Meenakshi Kaushik (Investigation; Methodology; Visualization; Writing – original draft; Writing – review & editing); Rekha Dwivedi (Investigation; Methodology; Writing – original draft; Writing – review & editing); Prabhakar Tiwari (Conceptualization; Data curation; Formal analysis; Supervision; Visualization; Writing – original draft; Writing – review & editing); Manjari Tripathi (Supervision; Writing – original draft; Writing – review & editing); Rima Dada (Supervision; Visualization; Writing – original draft; Writing – review & editing).
Funding
This research was part of the AIIMS, New Delhi intramural research grant (AC-55).
Declaration of conflicting interests
The authors declared no potential conflicts of interest with respect to the research, authorship, and/or publication of this article.
Data availability
Data sharing is not applicable to this article as no datasets were generated or analyzed during this study.