
Abstract
Background:
Minimally invasive diagnostic biomarkers of neurodegenerative diseases such as Alzheimer’s disease (AD) facilitate patient selection and cognitive progressive decline monitoring. However, the diagnostic value of circulating microRNAs (miRNAs) for early cognitive impairment and progression to dementia is currently under debate. Thus, this study aimed to assess the diagnostic performance of circulating, cerebrospinal fluid (CSF) and exosomal miRNAs in the detection of clinical cognitive impairment in mild cognitive impairment (MCI), AD, and MCI-AD.
Methods:
We searched PubMed, Embase, Web of Science, China National Knowledge Infrastructure (CNKI), VIP Chinese Science and Technology Journals Database (CQVIP), and Chinese Medicine Premier (Wanfang) to identify potentially eligible studies related to noncoding RNAs and cognitive dysfunction biomarkers published before November 2018. The quality assessment of the studies was performed according to the Quality Assessment of Diagnostic Accuracy Studies (QUADAS-2) checklist. Meta-analysis of the literature data was performed using Stata/MP 14.0 software. The corresponding effects models were selected to calculate the summary sensitivity, specificity, positive and negative likelihood ratios (PLR and NLR), and diagnostic odds ratio (DOR) and to plot the summary receiver operating characteristic curves (SROCs) and calculate the areas under the curves (AUCs).
Results:
A total of 18 studies involving 729 patients with AD, 283 patients with MCI, and 15 patients with MCI-AD were pooled. The results revealed that the sensitivity and specificity of miRNAs in the diagnosis of AD were 0.78 and 0.79, respectively, and the area under the summary receiver operating characteristic curve (AUSROC) was 0.90. The sensitivity and specificity of miRNAs in the diagnosis of MCI were 0.89 and 0.85, respectively, and the AUSROC was 0.94. The sensitivity and specificity of microRNAs in the diagnosis of MCI-AD were 0.87 and 0.84, respectively, and the AUSROC was 0.92.
Conclusion:
Our study found that miRNAs have certain diagnostic value for cognitive impairment, with high sensitivity and specificity, especially in diagnostics with multiple miRNAs and serum-based miRNA assays.
Introduction
A large number of clinical neurodevelopmental disorders (such as attention-deficit/hyperactivity disorder (ADHD) and autism spectrum disorder (ASD)), neurodegenerative diseases (such as Alzheimer’s disease (AD), multiple sclerosis (MLS), and Parkinson’s disease (PD)), or cerebrovascular diseases (such as stroke) can lead to significant cognitive impairment or even dementia. 1 -3 These patients cannot carry out their daily activities independently, which poses heavy burdens on families, society and the economy. Mild cognitive impairment (MCI) is a transitional state between normal aging and senile dementia, which mainly manifests as memory or cognitive impairment, and has no significant effect on the ability of daily living. 4 Studies have shown that approximately 10%-15% of MCI cases progress to dementia each year, 5 especially in AD, wherein 2/3 of cases are transformed from MCI. 6 With the advent of the aging population, the prevalence of dementia is increasing year by year. At present, 40 million to 50 million people suffer from dementia, with AD accountings for the majority. 7 -9 Therefore, early and effective diagnosis and intervention of MCI is of great significance for delaying the progression of dementia.
MicroRNAs (miRNAs) are endogenous short noncoding single-stranded RNA molecules of approximately 21-23 nucleotides in length that widely exist in eukaryotes. The first miRNA (lin-4) was discovered in C. elegans in 1993. MiRNAs play an important role in cell differentiation, proliferation, and survival. miRNAs bind to the 3’ untranslated region (3’UTR) of the target gene mRNA by base complementary pairing, participate in the transcription and expression of the gene, and regulate the function of various proteins, which is also an important cause of many diseases. 10,11 In recent years, as cost-effective and noninvasive biomarkers for the diagnosis of various diseases, miRNAs have marked sensitivity and specificity and are widely used in clinical practice. 12 -16 Multiple miRNAs have been found to participate in the learning and memory process by regulating synaptic local protein synthesis and the morphology of dendritic spines. 17 Upregulation or downregulation of miRNAs can be observed in the brain and serum. 18 A systematic review 19 showed that the expression of miRNAs in peripheral circulation and tissues is closely related to the occurrence and development of human cognitive impairment and can be used as a clinically specific diagnostic biomarker of cognitive impairment. However, due to differences in research backgrounds and object selection, the results of different studies are also different. In the present study, a systematic review and meta-analysis were carried out by assessing the published literature. We systematically analyzed the sensitivity and specificity of miRNAs as a diagnostic marker of clinical cognitive impairment and provided a powerful evidence-based basis for the diagnosis of cognitive impairment.
Methods
Inclusion Criteria
i) The diagnostic studies published nationally and internationally involve the level of miRNA expression in the peripheral circulation, cerebrospinal fluid (CSF) and tissues of patients with cognitive impairment. ii) The studies provide complete data, with the sensitivity and specificity of miRNA detection either directly provided or able to be calculated by the data provided in the article. iii) The diagnosis of MCI was established using the Petersen criteria 4 or referenced the diagnostic criteria for cognitive disorders in The Diagnostic and Statistical Manual of Mental Disorders, Fourth Edition Revised Edition (DSM-IV) of the American Psychiatric Association, including elderly patients aged ≥ 60 years with a Mini-Mental State Exam (MMSE) score between 24 and 27 points, 20 in accordance with the AD (probable AD) diagnostic criteria established by the National Institute of Neurological and Communicative Diseases and Stroke/Alzheimer’s Disease and Related Disorders Association (NINCDS-ADRDA): an MMSE score <24 points, 21 or a Montreal Cognitive Assessment (MoCA) score <26 points. 22 iv) The control group included healthy elderly subjects with no cognitive impairment or abnormal mental symptoms.
Exclusion Criteria
i) Incorrect or incomplete literature data that could not be included in the statistical analysis. ii) Duplicate publications and types of studies including reviews, conference summaries, case reports, and animal experiments. iii) Studies on pathogenesis and therapeutic effects.
Literature Search
We searched the English language databases PubMed, Embase, and Web of Science as well as the Chinese language databases China National Knowledge Infrastructure (CNKI), VIP Chinese Science and Technology Journals Database (CQVIP), and Chinese Medicine Premier (Wanfang). The following keywords were used for literature retrieval: “microRNAs,” “microRNA,” “miRNA,” “miR”; “cognitive defect,” “mild cognitive impairment,” “mild neurocognitive disorder,” “cognition disorders,” and “dementia.” All searches used combinations of key words and free words and appropriate adjustments were made according to the corresponding database.
Data Extraction
Two researchers independently completed the literature search, obtained the full texts, evaluated the quality of the literature and extracted the data according to the inclusion and exclusion criteria; they cross-checked each other to ensure the quality of data extraction. Any differences were resolved through discussion or through a third arbitrator, and in the event that the usable data were not completely presented, we contacted the first author directly to request further information. The data extracted included the following: first author, year of publication, country of publication, sample type, disease, detection method, study sample size, and neuropsychological scale score according to the specificity and sensitivity of noncoding RNAs in the diagnosis of cognitive impairment. Additionally, 2 × 2 tables were drawn to calculate the true positive (TP), false-negative (FN), true-negative (TN) and false-positive (FP) rates.
Quality Assessment
The quality assessment of the studies included in the present study was independently performed by two researchers using the Quality Assessment of Diagnostic Accuracy Studies (QUADAS-2) 23 checklist in Rev Man 5.3 software, and any disagreements were resolved through third-party discussions. This scale was divided into four domains: case selection, index test, reference standard, and participant flow and timing. All components were assessed in terms of the risk of bias based on the answers (“yes,” “no” or “uncertain”) to the relevant iconic questions included in each part. Each study’s risk of bias can be determined to be “low,” “high” or “uncertain.” If the answers to all iconic questions in a range are “yes,” then the study can be assessed as having a low risk of bias; however, if one of the answers to all information-based questions is “no,” then bias is possible. The first three domains were also evaluated in terms of clinical applicability but do not include iconic questions.
Literature Analysis and Data Processing
To evaluate the diagnostic accuracy of miRNAs in detecting cognitive impairment, the sensitivity and specificity parameters were extracted from each study, and the number of patients with TP, FP, TN and FN results in each article were extracted or calculated. Based on the 2 × 2 tables, meta-analyses were performed with Meta-Disk 1.4 software (http://www.hrc.es/investigacion/Meta-discen.htm) and STATA 14.0 software (Stata Corporation, College Station, TX, USA) to evaluate the pooled statistics (95% confidence interval (CI)) of sensitivity, specificity, positive and negative likelihood ratios (PLR and NLR) [PLR = sensitivity/(1-specificity); NLR = (1-sensitivity)/specificity], diagnostic odds ratio (DOR), and area under the summary receiver operating characteristic curve (AUSROC), with standard errors (SEs) and the Q index with SEs for the test’s performance using miRNAs for cognitive impairment detection. If the available information was insufficient, we recalculated these values based on the sensitivity and specificity provided. Spearman’s correlation coefficient and the P-value were used to analyze the diagnostic threshold effect. If no significant threshold effect was observed, a hybrid statistical method was used to evaluate the diagnostic accuracy; otherwise, the diagnostic accuracy was evaluated by only the AUSROC and Q indices instead of the sensitivities, specificities, PLR, NLR, and DOR.
The PLR and NLR describe the differential characteristics of positive and negative test results, respectively. Likelihood ratios indicate how many times more likely a patient with a disease has a specific test result than a patient without a disease. 24 PLRs greater than 10 and NLRs less than 0.1 have been considered to provide convincing diagnostic evidence. AUSROC values of 0.5-0.7, 0.7-0.9 and 0.9-1.0 were applied to indicate low, medium and high diagnostic accuracy, respectively. A smaller Q index indicates lower diagnostic accuracy.
Cochran’s Q statistics and I2 statistics based on the chi-square test were used to determine heterogeneity. I2 values of 0-40%, 40-70%, and 70-100% indicate low, medium, and high variance, respectively. 25 If moderate heterogeneity existed or different clinical features were noted, the DerSimonian and Laird random-effects model was used. When I2 > 50% and/or P < 0.05, 26,27 greater heterogeneity should be considered.
Based on the meta-regression analysis of possible characteristics, the source of heterogeneity was discussed, and then subgroup analysis was carried out to determine the potential covariables.
In addition, subgroup and meta-regression analyses 25 were performed to detect the degree of heterogeneity between studies. Deeks’ funnel plot analysis was used to assess the publication bias. Meta-Disk and STATA 14.0 software were used for statistical calculations.
Results
For the literature search, Figure 1 presents a flowchart detailing the selection of the included articles. After searching PubMed, Embase, the Cochrane Library, and Web of Science and scanning the titles and abstracts, 2130 publications were included. Next, we intensively read the remaining studies, and then 1851 of these publications were excluded for irrelevant content, 44 articles were eliminated because they were unrelated to clinical cognitive impairment, and 104 studies were not considered because they were review letters and meta-analyses. After a more detailed evaluation, 49 studies were excluded because they did not have the full text available or had insufficient data for extraction. Finally, the selection process revealed 18 studies that were eligible for diagnostic analysis. A total of 12 studies included AD patients, 3 studies included MCI patients, 2 studies included AD and MCI patients, and 1 study included AD and MCI-AD patients. These studies involved 729 AD patients, 283 MCI patients, 15 MCI-AD patients, and 792 healthy subjects. The basic information and related data are shown in Table 1.

Process of literature screening.
Descriptive Characteristics of the Eligible Studies.

a miR-let-7f-5p, miR-1285-5p, miR-107, miR-103a-3p, miR-26b-5p, miR-26a-5p, miR-532-5p, miRlet-7d-3p, miR-112, miR-5010-3p, miR-151a-3p, miR-161.
bmiR-128, miR-132, miR-874, miR-134, miR323-3p, miR-382.
cmiRlet-7d-5p, miR-191-5p, miR-98-5p, miR-885-5p, miR-483-3p, miR-342-3p.
dmiR-15b-5p, miR-545-3p, miR-191-5p, miR-142-3p, miR let-7g-5p.
emiR-582-5p, miR-143-3p, miR-335-5p, miR-361-5p, miR-424-5p, miR-30e-5p miR,-101-3p, miR-15a-5p, miR-20a-5p, miR-93-5p, miR-106b-5p,-18b-5p, miR-106a-5p, miR-1306-5p, miR-342-3p, miR-15b-3p.
fmiR-26b-3p, miR-28-3p, miR-30c-5p, miR-30d-5p, miR-148b-5p, miR-151a-3p, miR-186-5p, miR-425-5p, miR-550a-5p,-miR1468, miR-4781-3p, miR-5001-3p, miR-6513-3p, miRlet-7a-5p, miRlet-7e-5p, miRlet-7f-5p, miRlet-7g-5p-15a-5p, miR-17-3p, miR-29b-3p, miR-98-5p, miR-144-5p, miR-148a-3p, miR-502-3p, miR-660-5p miR,-1294, miR-3200-3p.
g hsa-miR-769-5p miR,-219-2-3p, miR-425-5p, miR-132-3p, miR-128, miR-129, miR-363-3p, miR-27a-3p, miR-370, miR-127-3p, miR-329, miR-487b, miRlet-7f-5p, miR-223-3p, miR-433, miR-195-5p, miR-138-5p, miR-495-3p, miR-409-5p, miR-487a, miR-410, miR-543, miR-136-5p, miR-129-2-3p, miR-124-3p, miR-142-3p, miR-150-5p, miRlet-7i-5p, miR-362-3p, miR-92b-3p, miR-199a-3p, miR-199b-3p, miR-200a-3p, miR-23a-3p, miR-455-5p.
hmiR-34a-5p, miR-545-3p, miR-15b-5p, miR-142-3p,
imiR-30b-5p, miR-486-5p, miR-483-5p, miR-502-3p, miR-142-3p, miR-200a-3p
* MoCA scores
MCI: Mild cognitive impairment, AD: Alzheimer’s disease, RT-qPCR: Real-time fluorescence quantitative PCR
NGS: High-throughput sequencing technique
miRNA-Seq: Transcriptome sequencing technique.
Evaluation of Study Quality
The quality of the eligible studies, which were assessed based on the QUADAS-2 criteria, was independently appraised by the reviewers and is reported in Figure 2A and B. A higher risk of bias was observed for the case selection and gold diagnostic criteria. The 18 articles included were all case-control studies, and whether the cases were continuous or random was unclear. One study diagnosed dementia with pathology in the hippocampus, and two studies diagnosed dementia by the pathology of Aβ-42, t-tau and p-tau. Other diagnostic criteria were mainly based on the Petersen diagnostic criteria for MCI, the NINCDS-ADRDA 46 for the diagnosis of AD, or the MMSE scale. The MMSE or the MoCA score was used to evaluate overall cognitive function. However, some reliability and validity problems arose. The included studies control groups consisted of healthy elderly subjects without cognitive impairment or abnormal mental symptoms, and the clinical applicability of case selection was good.

Assessment of the quality of the included studies using (A) a methodological quality graph and (B) the QUADAS-2 standards.
Meta-Analysis
The diagnostic accuracy of circulating miRNAs in clinical cognitive impairment was assessed. First, Meta-disc software version 1.4 was used to analyze the data. The heterogeneity test showed that the Q test and I2 values of the DOR were 93.74 and 49.9%, respectively (P = 0.0000) (Figure 3A). Next, we generated forest plots of sensitivity and specificity, neither of which displayed a straight line distribution, and the Cochran-Q values were 416.93 and 301.99 (Figure 3B and C), respectively, which reflected substantial heterogeneity (88.7% and 84.4%, respectively) among these studies. A random-effects model was then selected to reanalyze the data, and the diagnostic threshold was analyzed. Spearman’s correlation coefficient was 0.471 (P = 0.001), illustrating that the significant heterogeneity was partially caused by the diagnostic threshold. In addition, the heterogeneity may be due to the degree of cognitive impairment, specimen type, miRNA profiling, and age (mean age). Therefore, because of the high heterogeneity of the statistical results, we cannot ignore different factors in calculating the statistical results indirectly. These data cannot simply be aggregated and are suitable for only subgroup analysis to illustrate heterogeneity.

(A)The sensitivity and (B) specificity of circulating miRNAs for diagnosing cognitive impairment. (C) The pooled diagnostic odds ratio (DOR) of circulating miRNAs in the diagnosis of cognitive impairment. Forest plots and meta-analyses of studies show the pooled results.
As shown in Table 2 and Figure 4, in the covariate and subgroup analyses, stratification was performed according to four pre-specified covariates including the degree of cognitive impairment (MCI vs. MCI-AD vs. AD), miRNA profiling (single miRNA vs. multiple miRNAs), specimen type (plasma vs. serum vs. blood vs. olfactory mucosa vs. hippocampus vs. CSF), and age (<65 vs. 65 ≤ 70 vs. 70 ≤ 75 vs. 75 ≤ 80 vs. 80 ≤ 85).
Summary Estimates of Diagnostic Criteria and their 95% Confidence Intervals.

SEN, sensitivity; SPE, specificity; NLR, negative likelihood ratio; PLR, positive likelihood ratio; DOR, odds ratio; CI, confidence interval; AUC, the area under the working characteristic curve of the subjects,
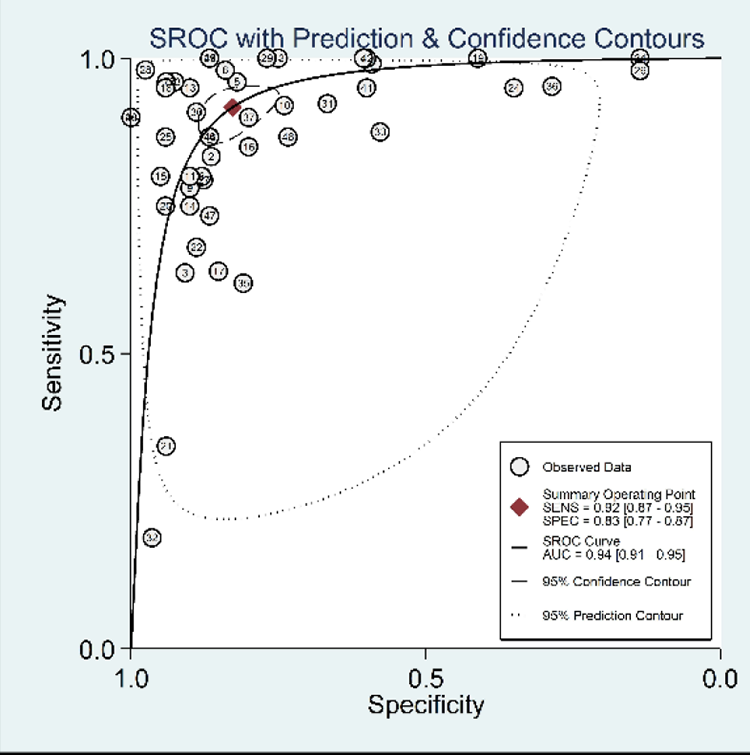
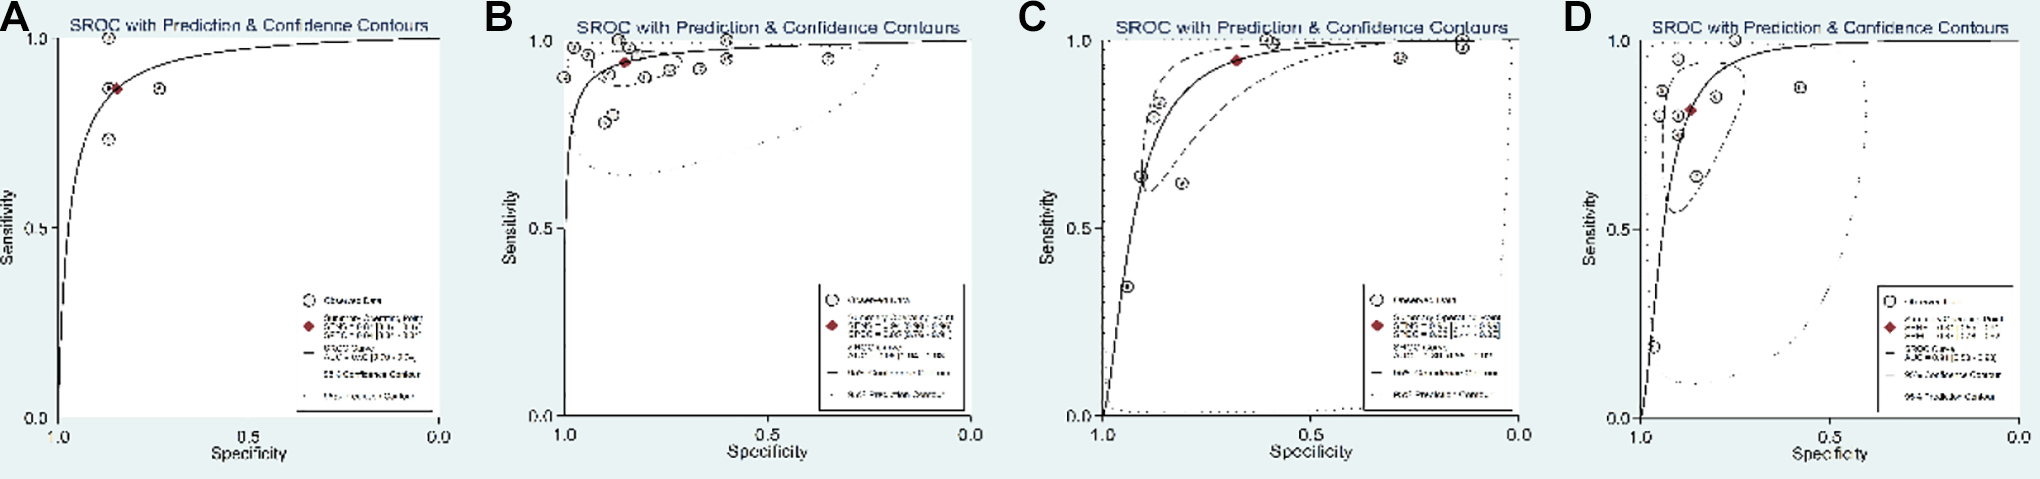
In the comparison of patients with different types of cognitive impairment and altered expression levels of circulating miRNAs, as shown in Table 2 and Figure 5, the results revealed that the diagnostic accuracy of miRNAs in the detection of AD patients (sensitivity = 0.78; specificity = 0.79; PLR = 3.69; NLR = 0.19; DOR = 25.17; AUC = 0.90) was lower than that of MCI patients (sensitivity = 0.92; specificity = 0.87; PLR = 6.90; NLR = 0.09; DOR = 60.47; AUC = 0.94) and MCI-AD patients (sensitivity = 0.87; specificity = 0.87; PLR = 5.60; NLR = 0.16; DOR = 32.66; AUC = 0.92). These results suggest that these biomarkers can distinguish different degrees of cognitive impairment according to the diagnostic performance. Among them, the diagnosis of MCI was the most accurate.

In the miRNA expression profiling subgroup analysis results revealed in Table 2 and Figure 6, the diagnostic sensitivity of single miRNAs was 0.91, with a specificity of 0.83, a pooled DOR of 35.14 and an AUC of 0.93. The sensitivity and specificity of multiple miRNAs were 0.96 and 0.77, respectively, with a summary DOR of 65.39 and an AUC of 0.97. The results showed that the diagnostic value of testing multiple miRNAs for cognitive impairment was higher than that of testing single miRNAs. As shown in Table 2 and Figure 7, the diagnostic sensitivity of miRNAs extracted from serum-based studies was 0.93, with a specificity of 0.78, a pooled DOR of 15.55 and an AUC of 0.90. The sensitivity and specificity of plasma-based miRNAs were 0.90 and 0.86, respectively, with a pooled DOR of 44.67 and an AUC of 0.94, indicating that plasma-based miRNA detection had higher diagnostic value for cognitive impairment than serum-based assays.


In the subgroup analysis of age, as shown in Table 2 and Figure 8, the sensitivity of miRNAs extracted from patients with a mean age <65years was 0.87, with a specificity of 0.84, a pooled DOR of 32.66 and an AUC of 0.92. The sensitivity and specificity of miRNAs from patients with a mean age between 65 and 70years were 0.934 and 0.85, respectively, with a pooled DOR of 74.67 and an AUC of 0.96. The sensitivity and specificity of miRNAs extracted from patients with a mean age between 70 and 75 years was 0.95 and 0.68, respectively, with a pooled DOR of 17.33 and an AUC of 0.89. The sensitivity and specificity of miRNAs extracted from patients with a mean age between 75 and 80 years were 0.81 and 0.87, respectively, with a pooled DOR of 25.13 and an AUC of 0.91. These results indicate that miRNA detection has diagnostic value in patients with cognitive impairment and a mean age between 65 and 70 years, and the diagnostic value is higher in this group of patients than in the other three groups.
Meta-Regression Analysis
Based on the characteristics of the included studies, covariates, including classification of cognitive impairment, miRNA profiling, specimen types, and age, were applied to investigate interstudy heterogeneity using a meta-regression model, as shown in Tables 3 -7. In the meta-regression analysis, the sources of significant heterogeneity indicated that the classification of cognitive impairment contributed significantly (P = 0.0582), while the heterogeneity of the results was not significantly influenced by the remaining covariates. In accordance with the above results, the study sample type could be considered a source of heterogeneity for cognitive impairment detection in the meta-regression.
Four Covariates.

Tau-squared estimate = 0.3744 (convergence is achieved after 6 iterations). Restricted Maximum Likelihood estimation (REML). No. studies = 44 containing 77 miRNAs. Filter OFF. Add 1/2 to all cells of the studies with zero. Cte, constant coefficient; S, statistic; RDOR, relative diagnostic odds ratio.
Three Covariates.

Tau-squared estimate = 0.4480 (convergence is achieved after 6 iterations). Restricted Maximum Likelihood estimation (REML). No. studies = 44 containing 77 miRNAs. Filter OFF. Add 1/2 to all cells of the studies with zero. Cte, constant coefficient; S, statistic; RDOR, relative diagnostic odds ratio.
Two Covariates.
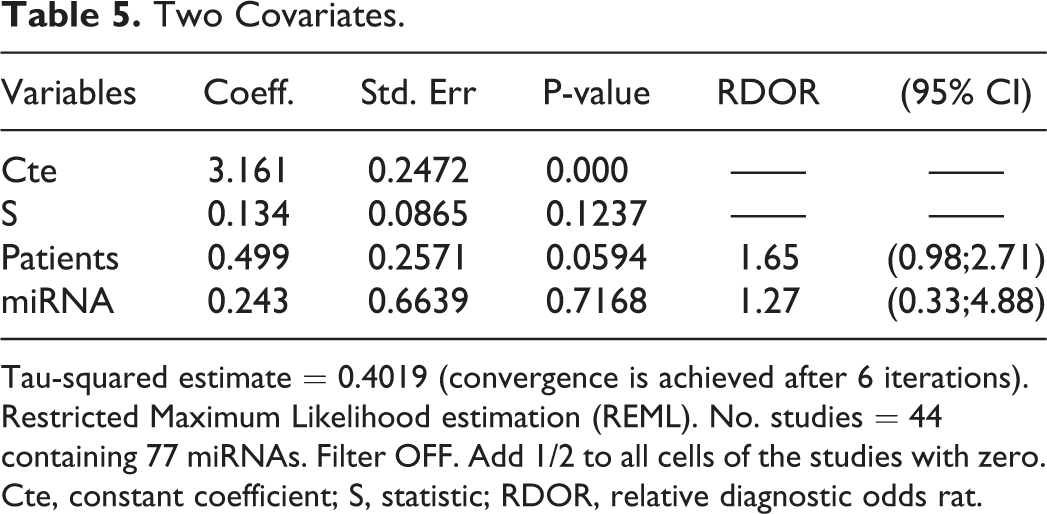
Tau-squared estimate = 0.4019 (convergence is achieved after 6 iterations). Restricted Maximum Likelihood estimation (REML). No. studies = 44 containing 77 miRNAs. Filter OFF. Add 1/2 to all cells of the studies with zero. Cte, constant coefficient; S, statistic; RDOR, relative diagnostic odds rat.
One Covariate.

Tau-squared estimate = 0.3716 (convergence is achieved after 6 iterations). Restricted Maximum Likelihood estimation (REML). No. studies = 44 containing 77 miRNAs. Filter OFF. Add 1/2 to all cells of the studies with zero. Cte, constant coefficient; S, Statistic; RDOR, relative diagnostic odds ratio.
Test(s) of Heterogeneity.

** I-squared: the variation in RR attributable to heterogeneity
Note: between-group heterogeneity was not calculated, which is only valid with the inverse variance method.
Publication Bias
Deeks’ funnel plot asymmetry test was applied to explore the publication bias of the meta-analysis for diagnostic accuracy. 25 The slope coefficient was associated with a P-value of 0.65 for cognitive impairment detection (Figure 9), suggesting a low likelihood of publication bias in our meta-analysis.

Deek’s funnel plots were used to estimate publication bias for discrimination of miRNAs in patients with cognitive impairment. No evidence of publication bias was identified.
Discussion
The search for more effective biomarkers for cognitive impairment is currently an active research field. Many recently published studies have explored the use of circulating miRNAs as potential biomarkers for MCI and AD. Meta-analysis indicated that miRNAs can distinguish AD or MCI patients from healthy controls with moderate to high accuracy. We included 18 studies involving miRNA expression profiling to systematically and comprehensively evaluate the potential value of circulating miRNAs as diagnostic markers for cognitive impairment. We considered different perspectives while avoiding statistical outcomes with high heterogeneity. The pooled sensitivity, specificity, and AUC were 0.83, 0.82, and 0.94, respectively, with the random-effects model, and the DOR of circulating miRNAs for the detection of cognitive impairment was 37.62, reflecting higher diagnostic performance as a combination parameter of sensitivity and specificity. However, by pooling the data in this manner, the diagnostic value would be inaccurate due to the significant heterogeneity and diagnostic threshold. Thus, we could not interpret the statistical outcomes blindly while neglecting high heterogeneity, and subgroup and regression analyses were therefore explored.
The results showed that for the detection of cognitive impairment, the sensitivity and specificity of most combined miRNAs and single miRNAs were greater than 0.75. In contrast, the sensitivity and specificity of PET, 47 CSF A42 and TAU 48 in the diagnosis of AD were 83% and ≤100%, 93.5% and 46%, and ≤88% and 82.7%, respectively. Although these tests show good diagnostic and prognostic accuracy, the high cost of PET and the invasive nature of CSF detection hinder their application in clinical practice. At present, most CSF biomarkers are based on individuals diagnosed with MCI, and the risk of misdiagnosis may be very high; thus analyzing their non-amnesia and other atypical cognitive disorders is difficult. 49,50 Therefore, the detection of miRNAs in peripheral blood may become an economical and minimally invasive biomarker strategy for cognitive impairment. A 2016 systematic review 19 confirmed the diagnostic performance of miRNAs in peripheral blood as a biomarker; however, the following shortcomings remain. First, studies have shown that miRNAs can distinguish AD/MCI patients from cognitively normal controls with moderate accuracy, but not all studies provide detailed sensitivity and specificity values for miRNA diagnostics. Second, this systematic review did not carry out subgroup analyses for age, the degree of cognitive impairment and specimen type to explore the impact of these three factors on the diagnostic performance of miRNAs. Finally, the issue of miRNA normalization is not mentioned in detail in the article.
MiRNA normalization is an important step for analyzing circulating miRNAs as potential biomarkers. Different approaches are used in practice in general and in referred papers in particular: (i) spiked non-human or synthetic miRNAs 51 ; (ii) ubiquitous miRNAs, whose concentration is stable in the plasma/serum of subjects with the pathology of interest 52 ; (iii) averages for numerous miRNAs 53 (miRNA arrays, or sequencing); (iv) specific miRNA pairs formed by miRNAs from organs affected and not affected by the pathology, or miRNAs changes in opposite directions. 54 RT-qPCR is the most widely used method to quantify the expression of miRNA, and given its high sensitivity, specificity and repeatability, this method should be the preferred technique. 55 Several normalization methods have been used to normalize circulating miRNAs. The most common strategies for standardizing RT-qPCR data are based on exogenous synthetic oligonucleotides, the geometric mean of all expressed miRNAs and endogenous miRNAs. 56
All clinical trials included in this study not only used RT-qPCR to detect miRNAs, but also used different methods to normalize the results. Reference genes are generally synthesized by oligonucleotides (such as miRNA cel-miR-39 57 ), which belong to non-human sequences, and can be used as a single reference gene and for normalized miRNA. This gene can be used as a single reference gene for miRNA normalization. Xie, Tan, Bhatnagar, Hara and Cosín-Tomás all used miRNA cel-miR-39 as the reference gene for normalized miRNA, while Sheinerman, Kumar and Wang used miR-491-5p and miR-370, HSA-miR-106a-5p and ath-159a, and miRNA-423-5p and normalized miRNAs respectively.
Some stable mathematical models have been developed to identify the most stable endogenous miRNA for normalization under specific experimental conditions. such as geNorm, 58 BestKeeper, 59 and compare DCT. 60 In this study, Sheinerman, Müller, Moon, Zirnheld, Hara, Cosín-Tomás all used the comparative DCT method to normalize the cyclic miRNAs data, while Cheng and Satoh used the GENorm method and the DESeq algorithm (Bioconductor) to normalize the target gene.
At the same time, the standardization of endogenous reference genes is very important for miRNA quantitative analysis, and many studies on circulating miRNAs have adopted standardization strategies based on multiple reference genes for miRNA. In this study, Nagaraj used stable endogenous reference genes selected in the experiment, such as hsa-miR-185-5p, has-miR-185-5p, has-miR-128-3p, has-miR-130-3p, and has-miR-15a-5p, to normalize the target genes.
Leidinge and Lau do not specify how to normalize the circulating miRNAs. In a word, most of the experiments in this study normalized the miRNAs, the data are more rigorous and real, and the test results are reliable. However, the experiments involved in this study adopted several common methods of miRNAs in different normalized cycles, and the samples were collected from different tissues, which are causes of the heterogeneity.
From the subgroup analysis, our results indicated that the multiple miRNA assay manifested a relatively higher diagnostic value and accuracy for cognitive impairment than the single miRNA assay.
The results of the subgroup analysis showed that the diagnostic value and accuracy of multiple miRNAs for cognitive impairment were higher than those of single miRNAs. However, for changes in multiple miRNAs, the association of coupled signal networks with complex molecular mechanisms, such as an altered miRNA-mRNA coupled signaling network in AD, may be valuable for cognitive impairment detection. Therefore, studying single specific miRNAs is usually unsatisfactory. Another finding was that miRNAs had the highest diagnostic value in MCI, followed by MCI-AD and AD. These results indicated that the combination of multiple miRNAs may yield better performance for the diagnosis of cognitive impairment, and different classifications of cognitive impairment can be distinguished according to the diagnostic value. Among them, the diagnosis of MCI was the most accurate.
Lau found that the sensitivity and specificity of 35 miRNAs, including miR-142-3p, in the diagnosis of AD were 100% and 77%, respectively. Lau detected a combination of miRNAs in the hippocampus. Kumar, Cosín-Tomás and Nagaraj detected a single miRNA; in their studies, the diagnostic sensitivities of miR-142-3p for AD were 100%, 68% and 95%, and the specificities was 41%, 60% and 76%, respectively. The sensitivity and specificity for MCI-AD were 73% and 87%, respectively.
The above experiments confirmed that miR-142-3p expression in plasma or the hippocampus was significantly upregulated in patients with AD and AD-MCI and may be used as a potential biomarker of AD and AD-MCI. At the same time, these findings also show that changes in miRNA expression levels may be related to the occurrence and development of cognitive impairment, which requiresfurther verification in the future.
Although circulating miRNAs are a potential biomarkers of cognitive impairment, the most urgent need in clinic al practice is early detection of potential diseases, especially detection of early AD in patients with MCI. In this study, as shown in Figures 3A and B, Leidinger found that the sensitivities of 12 miRNAs in diagnosing AD and MCI was 99% and 83%, respectively, and the specificities were 59% and 86%. The sensitivities of miR-107 in diagnosing AD and MCI were 79% and 98%, respectively, and the specificities were 88% and 98%. Moon found that the sensitivities of miR-206 in diagnosing AD and MCI were 91% and 92%, respectively, and the specificities were 89% and 67%, respectively. Nagaraj found that the sensitivities of the five miRNAs in diagnosing AD and MCI were 73% and 60% respectively, and the specificity was 60%. In particular, the sensitivity of miR-483-5p in the diagnosis of MCI-AD (early AD) and AD reached 100%. Clearly, the same miRNAs in the same trial have high diagnostic value for MCI and AD, and some miRNAs have similar diagnostic value for MCI-AD (early AD) and AD. These findings of miRNAs also indicate that miRNAs can be used as a basis for the diagnosis of early AD in patients with MCI, which requires further verification in the future.
A mean age between 65 and 70 years and plasma-based and whole blood-based diagnostic tests yielded better outcomes than an average age of <65 years, between 70 and 75 years, and between 75 and 80 years and serum-based cognitive impairment tests. However, the root causes of differences related to origin and age remain unclear. Many complex factors must be considered, such as the lower homogeneity of the included studies and the limited number of samples. Therefore, large-scale investigations and multiple center trials should be undertaken in the future to uncover the underlying mechanism of the aberrant expression of miRNAs and to determine whether source-related and age discrepancies truly exist.
After excluding studies that did not include age (Kumar and Lau), regression analysis was performed on 16 studies involving circulating miRNA expression, and the results suggested that for the covariates (including the classification of cognitive impairment, expression profiling, specimen type, and age), the P-value of the classification of cognitive impairment was 0.0582, which was the closest to 0.05; however, the heterogeneity of the results was not significantly affected by the other covariables. According to the above results, the classification of cognitive impairment was analyzed in subgroups, and the heterogeneities of AD and MCI were54.3% and 70.2%, respectively, which are both >50%, suggesting that the degree of cognitive impairment may be the source of the heterogeneity.
The present study has some limitations that must be addressed. Methodologies for precise, uniform quantification of miRNAs lack consistent criteria, limiting comparisons between studies conducted by different laboratories with their own study designs and the use of different miRNA chips. Nevertheless, multiple miRNAs and serum-based miRNA assays may present better performance for the diagnosis of cognitive impairment. However, many unclear molecular mechanisms have hindered the discovery of clear cognitive impairment detection biomarkers. Therefore, the results should be interpreted cautiously given the uncertainty of the results. Further large-scale prospective studies are needed to validate the potential applicability in human cancer diagnosis.
Conclusion
Our study found that miRNAs have certain diagnostic value for cognitive impairment, and satisfactory sensitivity and specificity, especially in diagnostics with multiple miRNAs and serum-based miRNA assays. However, due to the quality and quantity of the literature, the above conclusions still need to be verified by large samples and high-quality studies.
Footnotes
Authors' Note
No humans or animal models were used in our research.
Declaration of Conflicting Interests
The author(s) declared no potential conflicts of interest with respect to the research, authorship, and/or publication of this article.
Funding
The author(s) disclosed receipt of the following financial support for the research, authorship, and/or publication of this article: This study was jointly supported by the National Natural Science Foundation of China (81774424, 81873353).