
Abstract
Introduction:
Visual manifestations are the most prominent non-painful features of migraine. During the last decades, visual area V3a has gathered attention of headache scientists because of its apparent implication on aura initiation, photophobia and cortical hyper-responsiveness related to visual motion perception. In this hypothesis-generating study, we performed an in silico analysis of gene expression in left V3a and the cerebral gyrus that harbours it (left superior occipital gyrus (lSOG)) searching for transcriptomic patterns that could be linked with migraine’s pathophysiology.
Materials and methods:
Neurotransmitter receptor gene expression levels in left V3a were extracted from validated brain mRNA expression models using a probabilistic volumetric mask of this region. The primary visual cortex and other sensory cortices (auditory, olfactory and somatosensory) were used as comparators. Genome-wide transcriptomic differences between the gyrus harbouring left V3a (lSOG) and the rest of the cerebral cortex were assessed using the Allen Brain Institute Human RNA micro array atlas/database.
Results:
Adrenergic receptor β1, dopaminergic receptor D3 and serotoninergic receptors 1B, 1F and 2A, which have been previously implicated in migraine’s pathophysiology and/or treatment, showed significantly higher expression levels on left V3a. Transcriptomic differences between the lSOG harbouring V3a and the rest of the cortex comprise genes whose products are involved in neuronal excitability (SLC17A6, KCNS1, KCNG1 and GABRQ), activation of multiple signal transduction pathways (MET) and cell metabolism (SPHKAP via its interaction with cAMP-dependent protein kinase).
Conclusions:
Focal gene expression analysis of V3a suggests some clues about its implication in migraine. Further studies are warranted.
Introduction
Migraine is a complex neurological disorder with various clinical features other than pain. Among these, visual manifestations are the most prominent. Photophobia, or light hypersensitivity, is the commonest non-painful symptom experienced by migraine patients during an attack. 1 Interestingly, evidence shows that light-induced discomfort is also frequent in-between the crisis. 2 Another remarkable non-painful feature of migraine experimented by one in every four patients is visual aura. Visual auras are slowly expanding alterations of the visual field that commonly precede headache attacks. 3 They are believed to represent the clinical correlate of cortical spreading depression, a wave of neurono-glial brief depolarization followed by neuronal inhibition that slowly propagates through the cerebral cortex. Of note, inter-ictal photosensitivity is more pronounced in migraine with aura. 4
Taken together, these clinical observations have led researchers to search for structural and functional alterations in the occipital cortex of migraine patients for many years. There is now convincing evidence that the visual cortex exhibits numerous electrophysiological, biochemical, structural, functional and metabolic abnormalities in migraine, and that some of them are more pronounced in secondary and tertiary visual areas. 5 In particular, one extra-striate visual area, namely left V3a, has focalized attention of headache scientists during the last decades. V3a is a cortical region physiologically involved in higher-order visual processes related with motion perception. 6 In migraine patients, this area might be implicated in aura initiation, 7 photophobia 8 and cortical hyper-responsiveness in relation to visual motion perception. 9,10 Moreover, magnetic resonance imaging (MRI) brain morphometry studies revealed an increased thickness of grey matter in this region in migraine patients compared to controls, 11,12 and a recent large-scale connectivity analysis pinpointed left V3a as the hub of a brain network common to migraineurs. 13 Thus, it seems possible that certain intrinsic properties of V3a result in an increased propensity to migraine initiation in susceptible individuals.
The purpose of our hypothesis-generating analysis was to retrieve neurotransmitter receptor gene expression levels in V3a using high-resolution cerebral gene expression models and to search for differences in gene expression patterns between the left superior occipital gyrus (lSOG) that harbours left V3a and the rest of the cerebral cortex mining genome-wide brain microarray data. The findings are discussed in the light of their possible relevance for migraine pathophysiology.
Materials and methods
In order to assess gene expression levels in V3a and other sensory areas, neurotransmitter receptor gene expression data were extracted from 48 different mRNA expression maps. These gene expression maps (available at github.com/rudyvdbrink/) represent modelled distributions of noradrenergic, dopaminergic, cholinergic (muscarinic and nicotinic), serotoninergic and histaminergic receptor genes across the human brain. According to the original publications, these models were initially constructed using data from the Allen Brain Atlas and were subsequently validated in positron emission tomography experiments. 14,15 For our analysis, voxels corresponding to extra-cortical structures (brainstem, cerebellum and basal ganglia) were removed, and the mean and standard deviation of gene expression values in the remaining cortical voxels were calculated. Voxel values were normalized (Z-transformed) by subtracting the neurotransmitter’s cortical expression mean out of each voxel in the map and dividing the result by the standard deviation. Therefore, positive/negative values imply expression levels above/below the cortical mean in multiples of the standard deviation units. Analyses were focused on three regions of interest (ROIs): left V3a, the primary visual cortex (bilateral) and a conjugate of other primary sensory areas (somatosensory + olfactory + auditory). The V3a mask we employed was obtained from www.princeton.edu/∼napl/vtpm.htm. It was constructed using a standard functional magnetic resonance imaging visual paradigm in a sample of 53 subjects and quantifying the likelihood for each voxel to be classified as part of a given region (Figure 1). 16 Other ROIs masks were generated using the Wake Forest University Pickatlas Tool – Automated Anatomical Labelling Atlas Data. They corresponded to the bilateral peri-calcarine cortex (primary visual cortex), and a comprehensive mask including the postcentral gyri (somatosensory), Heschl’s gyri (auditory) and primary olfactory regions from both hemispheres. A correction factor was applied to non-probabilistic masks to balance values in the three ROIs. For each neurotransmitter gene, a one-way analysis of variance (ANOVA) was performed in order to compare voxel values in the different areas. Based on the Bonferroni correction (i.e. α = 0.05/n, where n = number of tests), the a priori significance level of α was set to α = 0.001. In addition, a Benjamini–Hochberg correction for multiple comparisons was applied to the results.
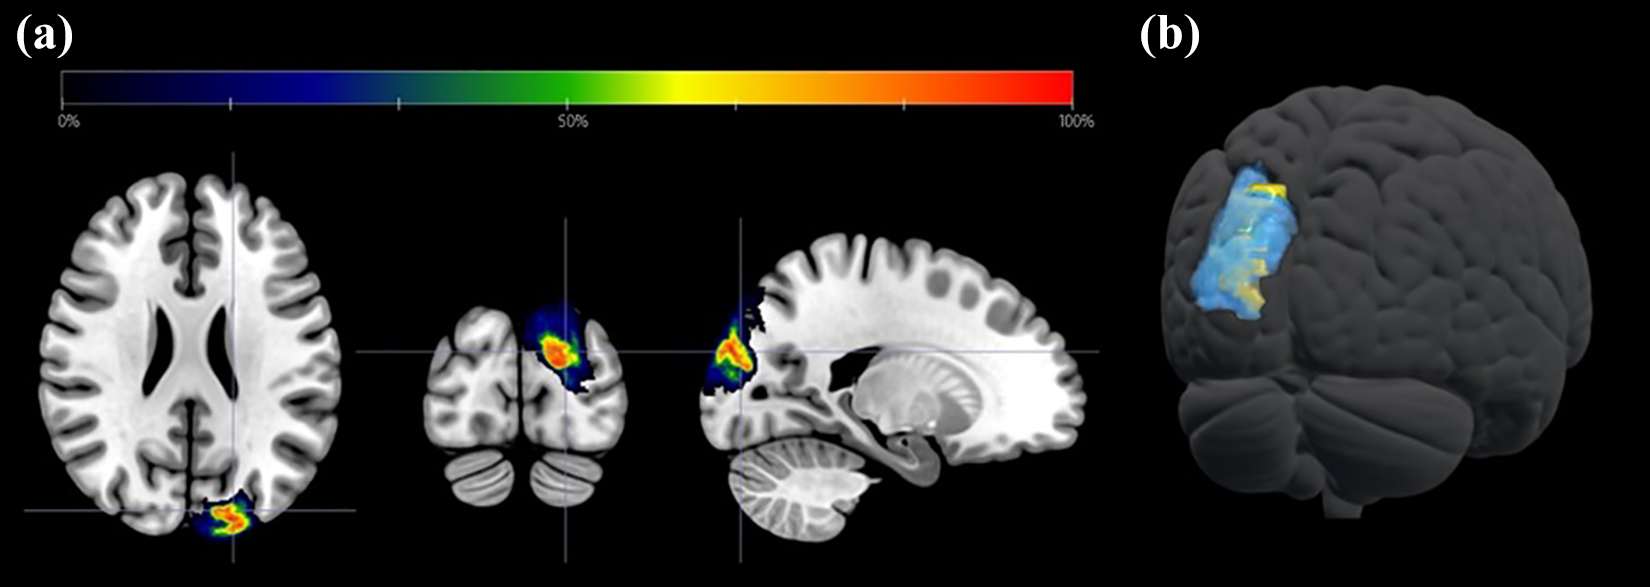
(a) Full probability map of V3a used as mask for neurotransmitter receptor genes expression analysis plotted over the axial (left), coronal (middle) and sagittal (right) planes of a T1-weighted brain MRI template (radiologically oriented). Probability values (colour coded) represent the likelihood for any voxel to be classified as part of left V3a. (b) Semi-transparent three-dimensional representation of the same mask (blue) together with a left superior occipital gyrus volumetric mask (Wake Forest University Pickatlas Tool – Automated Anatomical Labelling Atlas, yellow) overlaid on a brain render. MRI: magnetic resonance imaging.
For genome-wide differences of gene expression between the lSOG and the rest of the cerebral cortex, we mined the Allen Brain Institute Human RNA micro array atlas/database (© 2020 Allen Institute for Brain Science. Allen Human Brain Atlas. Available from: human.brain-map.org). This database includes 500 samples per hemisphere extracted from the brain of six different donors with no known history of neurologic or neuropsychiatric disorders. For each sample, >62,000 gene probes were tested. 17 Differential search finds gene probes exhibiting the greatest differences between the target and contrast structures. For each probe, a two-sample t-test (being the null hypothesis that the average expression level in the contrast structure is less than the average expression level in the target structure) followed by Benjamini and Hochberg false discovery rate correction is performed. Resulting p values are sorted in an ascending order. Only differences in expression of gene-coding probes (higher or lower with respect to the rest of the cortex) with a p ≤ 1 × 10⁻¹⁰ significance threshold are herein reported. The contralateral superior occipital gyrus (rSOG) was included for comparison.
Neurotransmitters’ gene receptor analyses were performed in Matlab (MATLAB (R2017b). Natick, Massachusetts: The MathWorks Inc.) and GraphPad Prism (version 6.00 for Windows, GraphPad Software, La Jolla California USA).
Results
According to the ANOVAs, all neurotransmitter receptor gene expression differences between ROIs observed were statistically significant. Adrenergic receptor β1, nicotinic acetylcholine receptor A10, dopaminergic receptor D3, histamine receptor 2 and serotoninergic receptors 1B, 1F, 2A and 6 showed significantly higher expression levels in left V3a. Expression of almost every other nicotinic acetylcholine receptor, as well as of DRD2, were significantly reduced in the same region (Figure 2).

Neurotransmitter receptor gene expression levels (Z-scores and standard deviation) in left V3a (blue bars), the bilateral calcarine cortices (red bars) and the bilateral auditory, olfactory and somatosensory cortices (green bars). Rendered images of the ROIs with the corresponding colours are shown on the right. ROIs: regions of interest.
Differential mRNA levels between lSOG and the remaining cerebral cortex are displayed in Table 1. In the lSOG, expression of MET (member of the receptor tyrosine kinase family), SLC17A6 (vesicular glutamate transporter) and KCNS1 (potassium voltage-gated channel modifier subfamily S Member 1) genes was increased in comparison with the rest of the cerebral cortex. Conversely, SPHKAP (sphingosine kinase type 1 interacting protein), GABRQ (GABA receptor type A, theta subunit) and KCNG1 (potassium voltage-gated channel modifier subfamily G Member 1) gene expression levels were reduced. For all these genes, fold changes were in the order of ≈2. Conversely, in the rSOG, no genes exhibited higher levels of expression with respect to the cortex beyond the pre-specified statistical threshold, and the average differences of the three genes that showed a significantly reduced expression (SLC12A3, CYYR1 and C9orf3) was around 1.2 fold. Furthermore, in contrast with the lSOG, probe convergence (≥2 different probes for the same gene with statistically significant results) was not observed.
Gene expression comparison between the left and right superior occipital gyri and the rest of the cerebral cortex.a

a Repeated gene symbols correspond to different DNA probes for the same gene and are ordered from lowest to highest p values.
Discussion
Results from this hypothesis-generating analysis open interesting new research paths for migraine studies. Regarding neurotransmitter receptor genes in V3a, expression of the serotoninergic receptors 1B and 1F, key targets of acute migraine treatment, 18,19 appears to be dominant in this region. These receptors’ expression is closely followed by another serotoninergic receptor, HTR2A, whose T102C polymorphism may be associated with the clinical presence of aura. 20 Another remarkable finding of our study was the high β1/low β2 adrenergic receptors’ expression levels that we observed. This pattern, although less pronounced, was also seen in the primary visual cortex (Figure 3). Several selective and non-selective β-blockers have proven to be effective for migraine prophylaxis. When activated, β1-receptors produce an increase of intracellular cAMP via Gs protein activation. Therefore, their blockage, similar to the effect of serotoninergic receptor 1B/1D or 1F agonists, will finally lead to a reduction of cAMP concentration. In addition, we also observed a high DRD3/low DRD2 expression pattern in left V3a. Dopamine (DA) neurotransmission has presumably been involved in the pathophysiology of migraine before. Patients with migraine are hypersensitive to DA agonists, and it is well accepted that some migraine accompanying symptoms are at least partially driven by dopaminergic systems. 21 Previous studies have suggested a transient dopaminergic reduction and D2/D3 imbalance during migraine attacks 22 and, more recently, a longitudinal resting state fMRI study has also pointed out that connectivity changes in dopaminergic centres plays an important role in attack generation and sustainment. 23 Concerning the expression of cholinergic receptors, the nicotinic acetylcholine receptor A10 was highly expressed in V3a and, in contrast, expression of almost every other nicotinic acetylcholine receptor was reduced. Alterations in cholinergic mediated transmission at subcortico-cortical level has been widely described in migraineurs with the help of neurophysiology. 24,25 If the abovementioned receptors are in fact particularly involved in the dysfunction that leads to thalamo-cortical dysrhythmia (a comprehensive functional syndrome to which migraine might belong 26 ) in patients merits further analysis.

Rendered images of noradrenergic receptor β1, serotonin receptor 1F and serotonin receptor 1B genes expression in the cerebral cortex (Z-scores, colour coded).
Transcriptomic differences between the lSOG harbouring V3a and the rest of the cortex concern genes whose products are involved in neuronal excitability (SLC17A6, KCNS1, KCNG1 and GABRQ), activation of multiple signal transduction pathways (MET) and cell metabolism (SPHKAP via its interaction with cAMP-dependent protein kinase). In line with these findings, increased neuronal excitability as well as metabolic factors interact to increase susceptibility to cortical spreading depression in animal models, which suggests their involvement in the pathophysiology of migraine with aura. 27 Moreover, the fact that the migraine brain exhibits alterations in neuronal responsivity resulting in abnormal sensory processing is well stablished, 28 and we have recently shown that a mismatch between energetic supply and energetic demands in the visual cortex of migraine without aura patients covers an area comprising V3a. 29
Thus, it is possible that focal gene expression in V3a reveals some clues about its implication in migraine as shown by the data we present. It must be kept in mind, however, that reliable deductions for migraine pathophysiology cannot be established before it has been determined whether the differential neurotransmitter receptor gene profiles in left V3a and superior occipital gyrus are associated in patients with gain- or loss-of-function of these genes due to genetic or epigenetic modifications. Therefore, the results we present here should only be considered conjectural and thought-provoking; the more that our study has some methodological limitations. For instance, the fact that all ANOVAs performed yielded significant results despite the stringent statistical threshold that we employed is probably due to the large sample size (which is determined by the number of voxels in each ROI). Because of that, some of the differences that can be observed in Figure 2, although significant from a statistical perspective, might entail no physiological or clinical relevance. In addition, given that the spatial resolution in the Allen Brain Atlas is limited to the gyrus level, for genome-wide differential assessments, we contrasted gene expression in the lSOG with respect to the rest of the cortex, rather than in a specific V3a mask. We consider our findings nonetheless as reliable because of the large degree of overlap between the lSOG and left V3a (see Figure 1), and because studies suggesting an implication of V3a in migraine often disclose clusters extending beyond this area into other parts of the occipital lobe.
Key findings
- Expression of the serotoninergic receptors 1B, 1F and 2A appears to be dominant in V3a.
- Transcriptomic differences between the left superior occipital gyrus harbouring V3a and the rest of the cortex comprise genes whose products are involved in neuronal excitability, activation of multiple signal transduction pathways and cell metabolism.
- Focal gene expression analysis in V3a suggests some clues about its implication in migraine.
Footnotes
Authors’ note
Jean Schoenen and Diego Conci Magris contributed equally in the supervision of this study.
Acknowledgements
The authors wish to acknowledge Ruud L Van Den Brink, PhD, for his valuable contributions to this study and for making neurotransmitter receptor gene maps available.
Declaration of conflicting interests
The author(s) declared no potential conflicts of interest with respect to the research, authorship, and/or publication of this article.
Funding
The author(s) received no financial support for the research, authorship, and/or publication of this article.