
Abstract
Background:
Migraine is a highly prevalent disorder that is typically episodic in nature. Social network data reflecting personal commentary on everyday life patterns, including those interrupted by migraine, represent a unique window into the real-life experience of those willing to share them. The experience of a migraine attack might be captured by twitter text data, and this information might be used to complement our current knowledge of activity in the general population and even lead to enhanced prediction.
Objective:
To characterize tweets reporting migraine activity and to explore their social-behavior features as foundation for further investigations.
Methods:
A longitudinal cohort study utilizing 1 month of Twitter data from November to December 2014 was conducted. Tweets containing the word “migraine” were extracted, preprocessed, and managed using natural language processing (NLP) techniques. User behavior profiles including tweeting frequencies, high-frequency words, and sentimental presentations were reported and analyzed.
Results:
During the observation period, 98,622 tweets were captured from 77,335 different users. The overall sentiment of tweets was slightly negative for expressive tweets but neutral for informative tweets. Among posted negative expressive tweets, we found a strong tendency that high-frequent expressions were those with the extreme sentiment, and profanity was common.
Conclusions:
Twitter users with migraine showed distinct sentimental patterns while suffering from disease onsets exemplified by posting tweets with extreme negative sentiments.
Introduction
Real-world evidence research is an emerging field in public health and the medical field. Its role in medicine has been increasingly appreciated by researchers and practitioners for complementing the current knowledge of diseases gained from traditional clinical trials. 1 Social media (SM) data as a unique type of real-world data can provide timely and private, internal information about disease experience and health dynamics in populations globally. 2,3 The amount of this new digital source of data is enormous and the increase of its availability is unprecedented, which forms a new area of research introduced as digital epidemiology. 4
This unprecedented explosion of data in SM certainly created bioethics, data management, and computational challenges and barriers for researchers to utilize this information. 5,6 In addition, the quality of SM data is often questioned because of the large variance of data format, expression, and encoding systems in SM data. 7 However, SM data are certainly valuable for researchers to understand the burden of disease in patients’ everyday life because it emerges as a platform for patients to voluntarily share about their private, internal disease experiences, which adds a psychosocial dimension to our current physiopathological understanding of disease. 7,8 Specifically speaking, utilizing SM data for medical research provides the ability to account for the social determinants and behavioral factors, which are rarely collected by Electronic Health Record (EHR). While acknowledging that the quality of tweet text metadata cannot be enhanced after being collected, modern machine learning technologies can provide new opportunities in guiding users to dynamically label tweets during the data curation phase (e.g. improved interface or user interaction to guide users to provide clear and high-fidelity data). 9 It is expected that the information from SM can be cross-validated from multiple sources such as personal, home, and wearable devices. In addition, when SM sites start to design their user interface with consideration for data mining, the data collected will be much standardized and properly labeled for clinical and research use.
In this study, we decided to focus on Twitter data because of the high volume and relatively standardized structure of data for a pilot study. 10 –12 Migraine is associated with substantial physical and psychological suffering, and one would speculate that salient migraine experiences would be reflected by analyzing their social network behaviors (e.g. tweets about migraine activity). 7,8,13,14 Such behavioral characteristics and their sentimental profiles could in return help guide clinical researchers making clinical decisions or improving the quality of care at the population level. A previous study showed that migraine patients actively shared their experience via Twitter and that it was a powerful data source for research. 15 Our research was conducted on a larger scale and intended to start down a path to discover tweeting behaviors of migraine patients for future prediction and social-level influence assessments. In this study, we focused on the sentimental profiles of migraine tweets, and we hypothesized that migraine-related messages posted on Twitter were more likely to represent negative rather than positive sentiments suggested by clinical and life experiences. We are also interested to explore the potential different clusters of topics or any self-reported events from tweet text data in an unsupervised data-driven approach.
Methods
Inclusion and exclusion criteria
Those included in the study were Twitter users who (1) tweeted about a migraine headache using the exact word “migraine” in their tweets, (2) possessed a public Twitter account, and (3) posted at least one tweet within the data collection time range. Exclusion criteria included (1) the word “migraine” used in a way that did not refer to migraine headache (e.g. a famous cocktail name, nickname of a famous sportsman, and a name of a song); (2) tweets not in English; and (3) organization tweets (e.g. academic society, promotional tweets, and campaign-related).
Data collection
Eligible 1-month Twitter data between November 6, 2014 to December 7, 2014 (1-month data) were collected. Data including number, time, date, and text content of tweets were collected. Twitter user profiles data including username, account creation date, and self-described geographic location information (country and state or province) were also collected. Collected user social profile data included the number of followers, friends, lists, and favorites. Data were collected through official Twitter Application Program Interface (API) and then imported into R 3.3.2 and Python 3.6 for data management and analyses.
Missing data
Our Twitter data were collected through the official Twitter API. 16 There were around 15% of the tweets that only included emojis or web-links and, therefore, were excluded from our text analyses. A list-wise deletion method was applied. We also collected the geographic information of tweets for exploratory purposes to guide a follow-up study, and we found the missing rate of geographical global positioning system data was high (more than 75%).
User privacy
All users’ personal identifying information was strictly protected according to Twitter.Inc’s user privacy terms, 17 and all user identity-related text content from user tweets was not presented in any tables or graphics.
Statistical analysis and unsupervised machine learning
User characteristics such as tweeting frequencies and user internet social activity (e.g. followers and favorites) were summarized using frequencies and percentages and median and quartiles (Q1 and Q3). User internet social activity by tweeting frequency groups was analyzed using multivariate analysis of variance (MANOVA) followed by post hoc pairwise comparisons. Bonferroni correction was applied to account for multiplicity.
We explored the patterns and characteristics of words, topics, and sentiment in a data-driven approach utilizing natural language processing (NLP), 18 an unsupervised learning technique that focuses on the interactions between human language and computers. NLP sits at the intersection of computer science, artificial intelligence, and computational linguistics. It aims to allow machines to conduct tasks to analyze, understand, and derive meaning from human language. The key assumption is the hierarchical structure of language: several words make a phrase, several phrases make a sentence, and, ultimately, sentences convey ideas. In our study, we conducted a quantitative summary on word frequencies (percentages) by tweet type (e.g. negative/positive and informative/expressive). In addition, we conducted an n-gram analysis to find a meaningful combination of words (e.g. two-word combination as 2 g) to improve interpretation of our word summary results.
NLP is a mature but limited technique because machines are not yet advanced enough to deduce like human beings. 19 However, when it comes to a large population scale, it is reasonable to assume that the most important language patterns will reveal themselves by word probability distributions and word–word interactions. 20 Hence, some of the “nature language” questions can be classified into some relatively standard forms and answered. NLP has been widely used in grammar correction, voice recognition, machine assistant (Google, Siri, and Alexa). Deep learning has made some progress recently in training machines to understand text data without prelabeling the data, 21 and it is expected that, in near future, the machine will be able to fully comprehend and process text information. 22,23
Power analysis
The observation period length was determined based on an intuition of the amount of data required for NLP methods. There was no a priori statistical power calculation.
Sentiment analysis
Texts of all tweets were first tokenized (a process demarcating and classifying stem words from input tweet texts in their standardized formats) and then we performed text cleaning, spell-correction, lemmatization using the “Hunspell,” “corpus,” and “textstem” packages in R. The dictionary used and detailed procedures descriptions are reported in Online Supplemental Content.
Sentiment analyses were conducted by calculating a sentence-level sentiment score for each tweet based on using “sentimentr” package in R. 24 This performed algorithm takes into account valence shifters (i.e. negators, amplifiers (intensifiers), deamplifiers (downtoners), and adversative conjunctions) while conducting sentiment score estimation by looking up a sentiment dictionary created by Matthew L. Jockers. Scores greater than 1 or less than −1 were considered to be “extreme sentiment” scores, which equates to the sentiment of words of “very good” and “fuck.”
A boxplot of the distribution of sentiment scoring of tweets by tweet types (e.g. expressive and informative) is reported. Sentimental scores were compared between negative and positive sentiment tweets using a two-independent sample two-tailed Wilcoxon test. Further text mining to summarize the total word frequency rankings and the word characteristics in both positive and negative sentiment tweets using absolute frequencies, bar charts, and word-cloud plots was conducted using the “ggplot2” and “wordcloud2” packages in R.
Topic modeling
We applied the latent Dirichlet allocation (LDA) method to generate our topic models using the “topicmodels” package in R. 25 LDA is a generative statistical method which is usually represented as a graphical model. It represents word documents (tweets in our case) as mixtures of topics that produce words with certain probabilities. 26 Therefore, each tweet in our data set can be decomposed into a fixed number K topics (e.g. 20% A and 30% B), and within each topic, we can rank the word by their probability distributions (e.g. “president” and “congress” might be the most common words in a “politics” topic). The optimal topic number was identified combining the clinical theory and methods developed by Cao and Deveaud and then introduced to the LDA modeling. 27,28 Word-clouds were created to visualize the data for all modeled topic clusters.
Statistical analyses, text mining, and data visualizations were conducted using the statistical computing software R V3.3.2 (R Foundation, Vienna, Austria) and Rstudio V1.0 (Rstudio Inc, Boston, Massachusetts, USA). Statistical tests were all two-tailed and α was set to 0.05.
Results
User features
There were 98,622 tweets from 77,335 different users that met inclusion criteria. Of these users, 85.1% (n = 65,871) only tweeted once in the observed 1-month period. More than 90% of users (98.1%, n = 75,863) tweeted less than four times per month. Conversely, only 0.1% (n = 70) posted tweets more than 15 times per month (more than once every 2 days). We found that certain twitter users tend to attach one or more web-links in their tweets. We, therefore, hypothesized that these users would present different behavior patterns compared with normal users because they chose to post tweets in a way that was more likely to be “informative” instead of “expressive.” We have observed the quantitative difference of tweet types among different tweeting frequency groups, and users who tweeted very frequently (>15 times per month) were more likely to tweet with web-links (χ 2 test, p < 0.001). We also observed numerically greater internet social activity levels (e.g. represented by higher number of friends, number of lists, and number of followers) among users who posted more than four tweets per month, especially for those who tweeted more than 15 times per month (MANOVA test, adjusted p values <0.05). Details of user characteristics and internet social activity levels are presented in Tables 1 and 2 and Figure 1.

Number of users by tweeting frequency group and type.
User characteristics.

a We categorized twitter users into two types: the first type of users never tweet any web-links (expressive tweeter type), whereas the other type of users at least tweeted web-links once (informative tweeter type).
b For informative users, they can tweet a mixed collection of informative tweets and expressive tweets.
Pairwise comparisons of internet social activity by tweet type and tweeting frequencies.

MANOVA: multivariate analysis of variance.
a We categorized twitter users into two types: the first type of users never tweet any web-links once (expressive tweeter type), whereas the other type of users at least tweeted web-links once (informative tweeter type).
b Estimated comprehensive internet social activity level based on number of followers, friends, lists favorites, and status data in MANOVA modeling.
c Bonferroni corrected p-values for pairwise comparison, number of comparisons = 3.
d For informative users, they can tweet a mixed collection of informative tweets and expressive tweets.
Case summary
We conducted case reviews for those 70 high frequent twitters regarding the content of their posts. The most frequent twitter was a promotional account about Indian massage coupons and offers. The second most frequent posting twitter account was the American Headache Society (AHS), which posted 231 tweets within that month and discussed various educational topics regarding migraine. The majority of high-frequent accounts were educational and were created by health-care professionals and associations (e.g. pain specialists, researchers, nurses, and Association of Migraine Disorders). Some of them cited contents and talks from the AHS conference. A small proportion of high-frequent twitter accounts were business promotional accounts and a lot of them marketed themselves as health-care professionals to recommend some suspicious “natural” and “instant relief” products. In addition, there was one kind of patient behavior pattern that was in particular interest. This behavior was featured by posting highly frequent, extreme sentiment tweets complaining about their migraine experience to celebrities (e.g. pop singers and rock stars).
Text mining and sentiment analysis
The top 50 most frequent words (except “migraine” which by definition was included in every tweet) are reported in Figure 2. For informative tweets, the word “headache” was the most frequent term (1868, first). The most frequent words included several words discussing symptoms, treatment, and new drug for pain relief such as “relief” (1189, second), “pain” (768, third), “head” (659, fourth), “Avanir” (491, eighth), and “massage” (491, ninth). The overall impression of these words in this informative tweeting category was neutral and educational, qualitatively speaking. For expressive tweets, the most frequent words included several words expressing negative feelings about migraine such as “bad” (8579, 3rd), “fuck” (3720, 11th), “feel” (4978, 6th), and “wake” (3967, 6th), and desires to get away from the disease such as “get” (11348, 1st), “go” (9884, 2nd), “now” (5755, 5th), and “away” (3556, 13th). The overall impression of these words in this expressive tweeting category was negative and emotional.

(a) Word frequency: informative tweets and (b) expressive tweets.
Sentiment analysis was performed on tweets at the sentence level, and we estimated a sentiment score for each tweet based on a sentiment dictionary created by Matthew L. Jockers embed in the R “sentimentr” package. A histogram of tweet sentiment scores is presented in Figure 3(a). The overall sentiment of tweets for expressive tweets was negative. There were 41,264 (46.8%) tweets with negative sentiment scores, 24,709 (28.0%) with neutral sentiment scores, and 22,172 (25.2%) tweets with positive sentiment scores. The negative sentiment tweets had a median score of −0.28 (Q1–Q3: −0.42 to −0.16), and positive sentiment tweets had a median score of 0.20 (Q1–Q3: 0.11–0.32). The magnitude of negative sentiment feelings (absolute value of sentiment scores) was statistically stronger than positive sentiments (Wilcox test, p < 0.001). The overall sentiment of tweets for informative tweets was neutral slightly toward positive. There were 4408 (42.1%) tweets with negative sentiment scores, 1345 (12.8%) with neutral sentiment scores, and 4724 (45.1%) tweets with positive sentiment scores. The negative sentiment tweets had a median score of −0.22 (Q1–Q3: −0.35 to −0.12), and positive sentiment tweets had a median score of 0.24 (Q1–Q3: 0.13–0.41). The magnitude of negative sentiment feelings (absolute value of sentiment scores) was statistically weaker than positive sentiments (Wilcox test, p < 0.001). A boxplot of the descriptive summary of the magnitude of sentiment is shown in Figure 3(b).

(a) Number of users by tweeting frequency group and type. (b) Sentimental score value by sentimental type.
Positive and negative sentiment tweets were further extracted and tokenized into word sets. Word frequencies were summarized and translated into bar chart and word-cloud visualizations in Figure 4(a) and (b). For expressive tweets, the most frequent words in positive expressive tweets were “good” (2781), “like” (2187), “right” (1544), “work” (1486), and “please” (1123). The most frequent words in negative expressive tweets were “bad” (7350), “fuck” (3448), “headache” (2514), “kill” (1702), and “pain” (1513). We observed a strong tendency that high-frequency expressions were those with the extreme sentiment, and many of them were profane (e.g. fuck, shit, damn, suck, ass, and bitch). For informative tweets, the most frequent words in positive expressive tweets were “relief” (1046), “massage” (489), “good” (401), “new” (367), and “natural” (263). The most frequent words in negative expressive tweets were “headache” (921), “pain” (468), “stop” (453), “instantly” (364), and “chronic” (282). We observed a strong tendency that high-frequent expressions were those about disease symptoms (e.g. pain, headache, attack, sick, trigger, nerve, and fever).
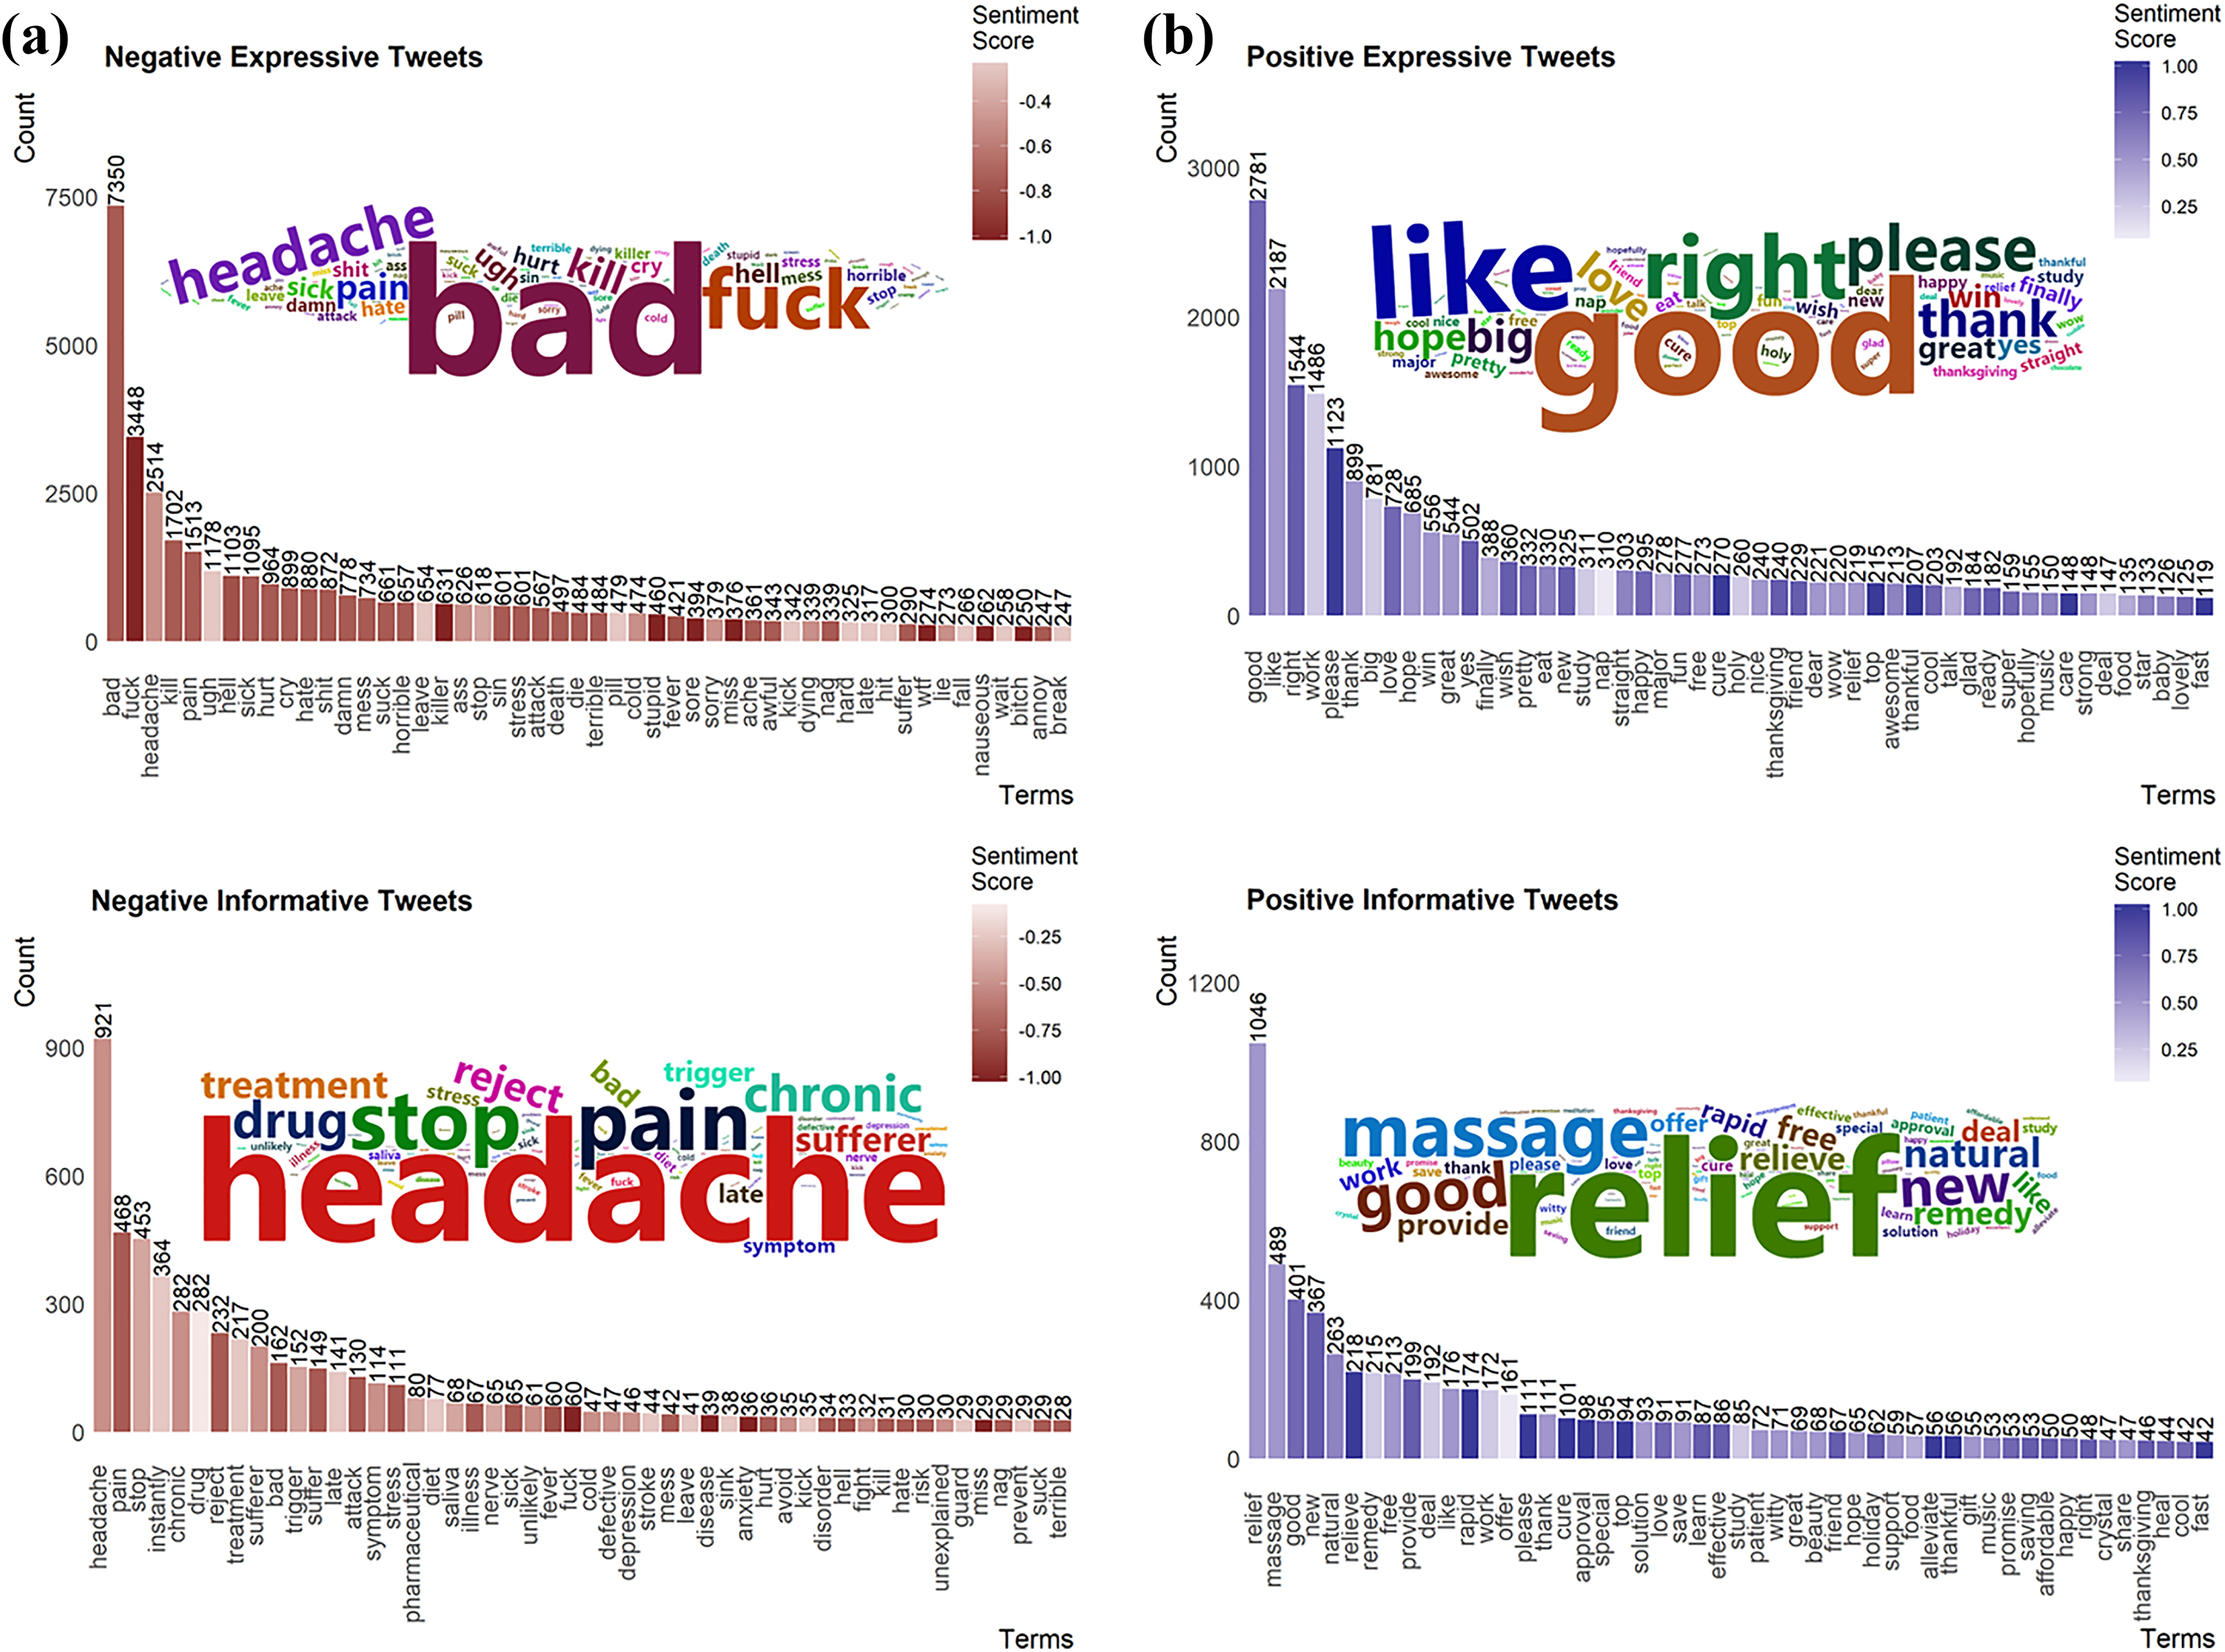
(a) Text mining of negative tweets and (b) positive tweets.
We manually examined the n-gram analysis results (e.g. 2, 3, 4, and 5 g) to search for meaningful word combinations for improving texting mining results interpretation. Frequent meaningful word combinations of these n-grams included “migraine go away” (739), “bad/worst migraine ever,” “give me a migraine” (1632), “wake up with a migraine” (1559), “i have the bad/worst migraine” (1144), “this migraine is killing me” (566), and “give me a fucking migraine” (310). To help audiences to better understand the context of these individual words and n-gram word combinations, we selectively report some highly frequent complete tweet sentences for demonstration purposes (Online Supplemental Content).
Topic modeling
To examine if the individuals’ tweets could be categorized into similar subtypes, we conducted topic modeling analyses. We applied LDA fitted by variational expectation maximization algorithm to explore word distributions into several different topics. We expected to see these data-driven clustered topics show dissimilarity from each other and reveal potential topic logic patterns (e.g. treatment vs. symptoms vs. sales vs. cursing). Unfortunately, we failed to find well-centralized and separated topics among these clusters, which might be caused by the miscellaneous nature of text data. Supervised learning guided by clinical theories or questions may be a better alternative approach for further analyses.
Discussion
In our study of 98,622 migraine-related tweets from 77,335 users, we classified two distinct types of tweets based on whether they contain the web-link: informative and expressive tweets. These two types of tweets showed different sentimental patterns. For expressive tweets, negative migraine tweets were posted more frequently than positive migraine tweets. The magnitude of sentiment between positive and negative tweets also differed. Negative tweets commonly included profane words and words expressing extreme feelings, while positive tweets were featured by functional adjustment and appreciation of help. For informative tweets, negative migraine tweets and positive migraine tweets were posted at comparable proportions. The magnitude of sentiment in positive tweets was stronger than negative tweets. Negative tweets were mostly discussing symptoms of migraine disease, while positive tweets featured relieving headache symptoms.
The value of machine intelligence in medicine has been increasingly appreciated, and its use has progressed rapidly in recent years. Our team intended to begin a program of research to investigate migraine patients’ passive interested behavior patterns via twitter reporting. This study was planned as a first pilot step to explore different factors and facets (e.g. sentiment, topics, and geographic location) that could be used to guide the direction of further investigation regarding migraine activity reported in the social network. In that regard, the findings on migraine tweet sentiment will help to improve topic modeling (e.g. developing a more targeted hypothesis or anchors of words for locating the “center of a topic”) for future studies. If we can glean enough information in post hoc analyses regarding twitter reported migraine onset (i.e. current migraine report through n-grams such as “having a migraine now”), we will be able to explore how to further link tweet report of migraine to psychosocial risk factors.
While our study has many strengths, there are some limitations. Our Twitter data were collected in a limited time period of only 1 month in November 2014. We intend to address this issue in future studies by expanding the data collection period to a whole year or longer. Misclassification was another issue. The overall sentiment of a sentence in our study was estimated by using an accredited dictionary and this approach was advanced compared with the traditional sentimental score generating process. It was designed to handle two major misclassification sources in our study: sarcastic expressions and valence shifters. However, misclassification still inevitably existed but was luckily more likely to bias the conclusion toward the null (resulting in more sentences scoring in the neutral category and, therefore, no difference between positive and negative average sentiment scores). With consideration of this buffering effect, the true difference between negative and positive sentiment tweets was most likely underestimated in expressive tweets; therefore, our conclusion would hold. The final issue with social network data was the noisy nature in Twitter text data. Our topic modeling method did not show distinct separated topics. It might be the exact mixed nature of the tweeted topics of migraine. We learned that supervised learning driven by specific clinical questions might be a more promising approach for our future studies.
Our analysis adds to the understanding of the psychosocial aspect of migraine. Our study provides a different method for clinicians and therapists to better understand their patients’ emotional experiences, concerns, and expectations. The spontaneously emitted feelings and emotional responses recorded by tweets around the onset of a migraine attack could assist clinicians in determining what types of triggers and conditions produce worse or better outcomes for patients. Information about a patient’s emotional responses or expressive patterns related to migraine onset could potentially become an effective assessment in predicting adjustment to the migraine burden. Properly designed personalized prevention, preparation, and management techniques could be used in conjunction with this assessment technique to improve a patient’s future treatment. For example, close examination of information in the studied tweets often resembles catastrophic cognitions (e.g. “I cannot tolerate this pain”) that are themselves associated with amplifying disease burden. During the study, we also learned that a clinical knowledge directed supervised learning approach might be superior to unsupervised methods given the noise of SM data is inherently substantial. We also learned that further studies using Twitter data shall be studied only on a national level and limited to mobile APP users because most of the missing geographic data were generated by international and web users. In future studies, we plan to evaluate psychiatric comorbidity data and match them to corresponding tweeting behaviors to explore migraine patients’ longitudinal sentimental and behavior patterns.
Conclusions
Twitter users with migraine showed distinct sentimental patterns while suffering from disease onsets exemplified by posting tweets with extreme negative sentiments. Our study successfully pictured the sentimental profiles of patients reporting migraine experience and established a foundation for further investigation on this topic.
Supplemental material
Supplement_Content_DT_edits_-_clean - Sentiment analysis of real-world migraine tweets for population research
Supplement_Content_DT_edits_-_clean for Sentiment analysis of real-world migraine tweets for population research by Hao Deng, Qiushi Wang, Dana P Turner, Katherine E Sexton, Sara M Burns, Matthias Eikermann, Dianbo Liu, Dan Cheng and Timothy T Houle in Cephalalgia Reports
Footnotes
Acknowledgements
We want to thank Ruitong Huang andYuxi Li for advising on machine learning and topic modeling analysis.
Author contributions
HD and QW contributed equally to the manuscript. HD, TTH, and QW helped in conceptualization; DL and HD helped in data curation; TTH helped in funding acquisition; QW and HD helped in search strategy; DL, DC, HD, TTH, DC; DPT, KES, SMB, and ME helped in methodology; QW, HD, and DC helped in writing the original draft; TTH, HD, DC, QW, and DPT helped in writing, review, and editing; HD and TTH involved in supervision and project administration; and resources
Declaration of conflicting interests
The author(s) declared no potential conflicts of interest with respect to the research, authorship, and/or publication of this article.
Data availability
Ethics approval and consent to participate
We collected and analyzed public Twitter data for this study; therefore, the ethical approval is not applicable.
Funding
The author(s) disclosed receipt of the following financial support for the research, authorship, and/or publication of this article: Research reported in this publication was supported by the National Institute of Neurological Disorders and Stroke of the National Institutes of Health under award number R01NS065257.
Supplemental material
Supplemental material for this article is available online.
References
Supplementary Material
Please find the following supplemental material available below.
For Open Access articles published under a Creative Commons License, all supplemental material carries the same license as the article it is associated with.
For non-Open Access articles published, all supplemental material carries a non-exclusive license, and permission requests for re-use of supplemental material or any part of supplemental material shall be sent directly to the copyright owner as specified in the copyright notice associated with the article.