
Abstract
Background
Polycystic Ovarian Syndrome (PCOS) is an endocrine disorder associated with increased risk of kidney and liver damage. Current treatments have shown contradictory outcomes, and their long-term use causes unwanted side effects. G. tournefortii could serve as a complementary medicine to current PCOS treatments.
Purpose
This study evaluates the effect of G. tournefortii in alleviating liver and kidney damage induced by PCOS via the regulation of oxidative stress pathways.
Study Design
PCOS was induced in female Balb/c mice using dehydroepiandrosterone over 21 days. They included a Sham group, a Vehicle group, a group treated with the extract only, and an untreated PCOS mice group. Positive Controls were treated with Metformin. The other PCOS groups were either co-treated while inducing PCOS or treated with the extract post-disease induction.
Methods
Histological analysis was performed. Serum liver and kidney biochemical markers, levels of oxidative stress, and two pro-inflammatory markers were measured. NLRP3 and its associated genes (caspase-1 and ASC) gene expression was assessed.
Results
The extract restored normal kidney and liver histology post-PCOS induction. It decreased ALT and AST levels by 50% and the oxidant marker malondialdehyde (MDA) by 65% (P < .05). Superoxide dismutase (SOD)/catalase (CAT) activities were normalized in PCOS treated group. IL-1β/TNF-α significantly decreased (80% and 68%, respectively, P < .05) in the post-treated group. NLRP3 genes decreased in kidney tissues post-treatment with G. tournefortii extract.
Conclusion
G. tournefortii reduced oxidative stress by modifying the ASC/caspase-1/IL-1β signaling pathway, thus protecting livers and kidneys highlighting the herb as a potential preventative and complementary agent in mitigating PCOS associated damage.
Introduction
Polycystic ovarian syndrome (PCOS) affects about 8%-21% of women worldwide and is considered the most common endocrine disorder among premenopausal women. 1 The pathogenesis of PCOS may start at puberty and may last post-menopause, making it a lifetime physical and psychological burden. The diagnostic features of PCOS include infrequent or absence of a menstrual cycle, increased serum levels of androgens, and polycystic ovary morphology. 2 Various metabolic disorders are associated with PCOS, such as insulin resistance, metabolic syndrome, dyslipidemia, hyperinsulinemia, hypertension, and hyperandrogenism.3,4 These metabolic complications can lead to the development of non-alcoholic fatty liver disease (NAFLD) and chronic kidney disease (CKD).5,6 Furthermore, the detrimental effects of PCOS on liver and kidney health have mainly contributed to the chronic inflammation and oxidative stress associated with the syndrome. 7 Various signaling pathways are key players in increasing oxidative stress in PCOS patients, including the PI3K/AKT/NF-κB pathway and androgen receptor (AR)-nicotinamide adenine dinucleotide phosphate oxidase 4 (NOX4) signaling pathways.8,9 Unfortunately, there is no pharmaceutical option approved by the Food and Drug Administration (FDA) that targets PCOS-associated kidney and liver co-morbidities, with current medications managing PCOS symptoms, such as oral contraceptives and Metformin, have shown to have controversial outcomes.10,11 The main aim to treat PCOS is to enhance fertility. The current treatment includes Clomiphene citrate (CC), Letrozole, Gonadotrophins, and Metformin that have been proven to induce ovulation and improve fertility rates. However, it is notable that studies have shown that Metformin can lessen pressure on the kidneys. On the other hand, certain existing health conditions, such as renal impairment, liver disease, and heart failure, can increase the risk of developing lactic acidosis with metformin use. On the other hand, studies have shown that herbal medicine can effectively reduce inflammation and protect the kidney and liver in women with PCOS,12,13 highlighting them as better alternatives for managing PCOS and the health complications linked with the syndrome.
Gundelia tournefortii, also known as Akkoub, is a thistle-like perennial plant belonging to the Asteraceae family. It is characterized by its spiny leaves and distinctive globular flower heads. The plant is widely distributed across the Middle East, especially in arid and rocky habitats. G. tournefortii has been traditionally used in folk medicine for its diuretic, anti-inflammatory, antimicrobial, and antioxidant properties as has been shown to have potential hepatoprotective and nephroprotective effects.14,15 Previous studies have shown the herb's role in lessening oxidative stress. For instance, limited research has been conducted on the effects of G. tournefortii on PCOS-induced metabolic disturbances. This study aims to fill this gap and provide an understanding of the ability of G. tournefortii aqueous extract to prevent and reduce disturbances induced by PCOS in the liver and kidney of PCOS female mice and, shed some light on the mechanism behind this effect.
Methods
Plant Extract Collection and Preparation
Naturally grown G. tournefortii plants were collected from the Chouf district in North Lebanon and identified according to characteristics described by Hind 16 and authenticated by our taxonomist. The plant was washed and cleaned thoroughly. Fresh edible parts (stem and underdeveloped flower buds) of this plant were used in this study. A 1% aqueous extract of Akkoub (G. tournefortii) was prepared by boiling 5 g of the plant in 500 ml of distilled water for 30 min. The mixture was filtered through several layers of gauze. The collected flow-through was then re-filtered using Whatman filter paper. The filtrate was aliquoted and stored at −20 °C for use.
Establishment of PCOS Model and Herbal Treatment
Mice were randomly divided into seven groups of 9 mice each, as represented in Table 1. Control group received nothing but water and pellet. Vehicle group received subcutaneous (SC) injections of 1% sesame oil (0.1 ml per 100 g body weight). PCOS group representing PCOS model mice were SC injected with DHEA (Sigma-Aldrich, USA) dissolved in sesame oil at 6 mg per 100 g body weight daily. 17 G. tournefortii group received the extract by gavage at 60 mg/kg of body weight over a period of 21 days following a previous study. 18 Preco group received SC injection of DHEA along with G. tournefortii extract orally for 21 days. Treatment group received 21 days of SC injection of DHEA followed by 21 days of oral administration of G. tournefortii extract. Metformin (Sigma-Aldrich, USA) group received 21 days of SC injection of DHEA followed by a single daily intraperitoneal injection of Metformin at 500 mg/100 g of body weight for 21 days. Respective control groups received water. Mice were sacrificed after treatment. Blood samples were withdrawn through cardiac puncture and stored in Vacurate® Vacuum blood collection tubes, which were then sent for analysis at PHD Laboratories in Lebanon for hormonal and biochemical analysis. Kidneys and Livers were removed for histological and molecular analysis.
Experimental Groups.

Biochemical Analysis
Serum concentrations of ALT (alanine aminotransferase) and AST (aspartate aminotransferase), creatinine, and blood urea nitrogen (BUN) were measured in “Professional Health Care Diagnostic” laboratory in Beirut, Lebanon.
Histology
After sacrificing the mice, kidneys and liver were preserved in 10% formalin and sent to “The INP Institute National de Pathologie” in Beirut, Lebanon, for histological analysis. Samples were dehydrated in 70%-90% graded alcohol, then cleared in xylene and fixed on paraffin. Sections were obtained by longitudinal cutting of 5 to 6 mm using a microtome. Slides were stained with hematoxylin and eosin (HE). All slides were observed under a light microscope and images were recorded using a visualization software under optimum brightness and contrast settings at 10 x or 40x magnification.
Tissue Homogenization
Part of the liver and kidney were homogenized at a ratio of 1 g per 5 ml of phosphate buffer saline (PBS), pH 7.4, containing 1 mM of the protease inhibitor Phenylmethylsulfonylfluoride (PMSF). The homogenization was done manually for 15 min on ice. Samples were centrifuged at 10,000 rpm for 15 min at 4 °C, and supernatants were collected and stored at −80 °C for later use.
Protein Quantification
Protein concentrations from tissue homogenates were quantified following the Bradford assay using Bovine serum albumin (BSA) as standard. 11 Protein concentrations were calculated from a BSA standard curve of concentrations 0, 2, 4, 8, and 10 µg/ml. For the reaction setup, the homogenates (50 µl) were incubated with 1X Bradford reagent (200 µl) at room temperature in dark, for 30 min. Absorbance of samples were read at 595 nm against a blank consisting of PBS and 1X Bradford reagent using an Evolution™ 60S UV-Visible Spectrophotometer (Thermofisher).
Quantification of IL-1β and TNF-α
Enzyme-linked immunosorbent assay Kits to quantify IL-1β (cat # E-EL-M0037) and TNF-α (cat # E-EL-M3063) were purchased from Elabscience (USA). In brief, the homogenates and standards were added to the wells of the 96-well plate and incubated overnight. The wells were then washed extensively, and a detection antibody was added, followed by incubation. After washing, Avidin-HRP is added, followed by TMB substrate to develop the color read at 450 nm. The concentration of IL-1β and TNF-α were determined from standard graphs.
Determination of the Oxidative Stress Indicators
Tissue levels of glutathione (GSH), malondialdehyde content (MDA), catalase (CAT), and superoxide dismutase (SOD) were determined according to Buege & Aust. 19
Q-Real Time Polymerase Chain Reaction
RNA Extraction
Total RNA was purified from colon tissue homogenate using RNeasy Plus Mini Kit from QIAGEN®, USA according to the manufacturer protocol (catalog # 74134). RNA was eluted in 60 µl of RNase free water supplied with the kit and stored at −80 °C for later use.
The integrity of the isolated RNA was checked by agarose gel electrophoresis stained with ethidium bromide showed two sharp bands, the 28S rRNA and 18 S rRNA were visualized by the ChemiDoc MP Imaging System. The extracted RNA was quantified spectrophotometrically. Absorbance was read at 260 nm and 280 nm against a blank of dH2O using a UV Spectrophotometer (Thermo Fischer Scientific, Evolution 60). RNA concentration was calculated according to this formula:
Concentration (µg/ml) = (A260 reading) × dilution factor × 40 µg/ml
RNA purity was determined based on the ratio: A260/A280.
cDNA Synthesis
Reverse transcription was done using QuantiTect® Reverse Transcription Kit obtained from QIAGEN®, USA and used according to manufacturer's protocol (catalog # 205311). The RNA samples were reverse transcribed using a master mix prepared from Quantiscript Reverse Transcriptase (1 µl), Quantiscript renal tubules (RT) Buffer (4 µl), and RT Primer Mix (1 µl from 10 M stock solution) in a final volume of 20 µl. The reaction was incubated at 42 °C for 25 min and the enzyme was then inactivated at 95 °C for 43 min. Finally, the cDNA prepared were stored at −80 °C for later use.
Primers
Primers
Primers designs were obtained from previous report, and were synthesized and ordered from Macrogen, Korea. The sequences are listed in Table 2 below.
Primers Sequence for the Investigated Genes.

RT-PCR
mRNA expression level was quantified by quantitative two-step real time polymerase chain reaction using QuantiFast® SYBR® Green PCR. The reaction consisted of 1 µl template cDNA forward and reverse primers (1 µl each, for a final concentration of 1 μM), 5 µl 2X PCR buffer (for a final concentration of 1X), and 2 µl RNAse free water, in a 10 µl total volume.
RT-PCR reactions were carried out in a QIAGEN Rotor-Gene® cycler, under the following real time cycler conditions: PCR activation step at 95 °C for 5 min, 45-50 cycles of denaturation step at 95 °C for 10 s and annealing at Tm optimized for each primer set for 30 s, and finally one cycle of extension at 72 °C for 32 s.
No template controls were used as negative control for the reaction, while GAPDH reference gene was used for CT normalization.
Relative gene expression was calculated using the 2−ΔΔCt gene dosage ratio formula (GDR) where:
ΔΔCt = (mCt gene of interest − mCt GAPDH) test sample − (mCt gene of interest − mCt GAPDH) control sample.
Statistical Analysis
Non-parametric statistical analyses were applied. The Mann–Whitney U-test was used to determine relationships between the various variables. Computations were carried out using SPSS v.11 (SPSS Inc. Headquarters, Chicago, IL, USA). A two-sided P < .05 was considered statistically significant. All data were expressed as mean ± standard deviation.
Results
Gundelia tournefortii Mitigates PCOS Induced Liver Damage
Histopathological Analysis of the Liver
Histological analysis of livers of mice from Control, Oil, and G. tournefortii groups showed normal liver morphology, while the liver of DHEA-induced model group showed signs of live injury indicated by degenerated and swollen hepatocytes (Figure 1D). However, groups Preco treated, and Post treated with G. tournefortii showed marked improvement of the liver injury indications induced by DHEA.
Biochemical Analysis
The AST and ALT serum levels were measured in experimental groups. The level of AST was significantly higher (61% with P < .05) in PCOS group when compared to control groups (Figure 2A). Furthermore, Preco and Post treatment with G. tournefortii extract was able to significantly reverse that elevation by almost 50% (P < .05). However, treatment with Metformin significantly exacerbated the elevation of serum AST levels by 61% when compared to PCOS group (P < .05). Similarly, level of ALT significantly increased by 81% in the PCOS group when compared to control groups (P < .05) as shown in Figure 2B. Preco and post treatment with the herbal extract significantly decreased those levels by 65%, and 50% respectively (P < .05). On the other hand, treatment with Metformin significantly elevated the levels of ALT additionally by 42% compared to PCOS group (P < .05).

Hematoxylin and eosin-stained section of livers from all the groups. The livers from control (A), Vehicle (B), and G. tournefortti (C), PCOS (D), Preco (E), Post (F), and Metformin (G) were examined under light microscope (10x) and compared to PCOS mice. Black triangles in “D” point to degenerated and swollen hepatocytes.

Effect of G. tournefortii on AST and ALT serum levels. Serum levels of (A) AST and (B) ALT. Data are expressed as the mean ± SD (n = 3). aP < .05 versus the Vehicle group and bP < .05 versus the PCOS group.
Evaluation of Oxidative Stress Markers in Liver
Oxidative stress (OS) in the liver was assessed by measuring the levels of GSH and MDA, as well as the activity of SOD and CAT in all groups.
As depicted in Figure 3A, the level of GSH exhibited a significant decrease in PCOS mice (reduction by 50%, P-value < .05) when compared to Vehicle group, with no apparent change observed in the pre-co treatment group. However, post-treatment with the extract resulted in a 60% significant increase (P < .05) in GSH levels when compared to the POCS group, surpassing the increment shown in the Metformin group (20%, P < .05).

Effects of G. tournefortii on oxidative stress in livers of PCOS mice GSH level (A), MDA levels (B) SOD activity (C), and CAT activity (D), and were measured in liver tissues. The data are presented as the means ± SD. aP < .05 versus the Vehicle group and bP < .05 versus the PCOS group.
MDA levels for all groups are depicted in Figure 3B. MDA exhibited a significant elevation in PCOS mice (65%, P < .05) when compared to Vehicle group. This increase was evidently mitigated in mice post-treated with the herbal extract, and Metformin-treated groups (reduction by 70%, and 65% respectively, P-value < .05).
For SOD activity, Figure 3C, a significant 60% decrease in SOD activity (P-value < .05) was observed in PCOS mice compared to the Vehicle group. Pretreatment with the herb failed to induce any change in SOD activity. However, Post-treated and Metformin-treated groups showed significant increases in SOD activities with the herbal extract PCOS-treated group showing better improvement (50% and 33%, P-value < .05).
Finally, the capability of the herb to restore normal CAT activity was investigated. CAT activity was significantly reduced in the PCOS group (∼50%, P-value < .05) compared to the Vehicle (Figure 3D). Pre-co treatment with the herbal extract showed no significant increase in CAT activity. Notably, Post-treatment with G. tournefortii showed a significant increase in that activity (60%, P-value < .05), comparable to CAT activity of Vehicle group, while Metformin treated mice significantly increased CAT activity by 12% (P < .05).
Evaluation of Pro-Inflammatory Markers IL-1β and TNF-α in Liver
To further asses the capability of G. tournefortii to reverse the hepatic damage induced by PCOS

Effects of G. tournefortii on the pro inflammatory markers in liver of PCOS mice. Levels of IL-1β (A) and TNF-α (B) were measured in liver homogenates. The data are presented as the means ± SD (n = 3 per group). aP < .05 versus the Vehicle group and bP < .05 versus the PCOS group.
Effect of G. tournefortii Extract on NLRP3 Expression and Expression of NLRP3- Associated Genes in Livers of PCOS Mice
The effect of G. tournefortii extract on the activation of NLRP3 inflammasome and its associated genes ASC and caspase-1was evaluated. As shown in Figure 5A, significant increase in NLRP3 expression was detected in PCOS mice (58%, P < .05) when compared to Vehicle group. Although this increase was lessened significantly with Post treatment with the extract as well as with Metformin, it was more prominent in the Post treatment group using the herbal extract (63% and 30% respectively, P < .05).
Effect of G. tournefortii extract on NLRP3 expression and expression of NLRP3- associated genes in liver of PCOS mice. (A), (B), and (C) show mRNA fold change for NLRP3, capsase-1, and ASC respectively. Data are mean ± SEM of 3 mice per group. aP < .05 versus the Vehicle group and bP < .05 versus the PCOS group.

Hematoxylin and eosin-stained section of kidneys from all the groups. The kidneys from control (A), Vehicle (B), and G. tournefortti (C) PCOS(D), Preco (E), Post (F), and Metformin (G) were examined under light microscope (40x) and compared to PCOS mice. Blue arrow: interstitial lymphocyte infiltration; thick arrow: casts and shedding cell in tubules; star: areas of dilated tubules and tubular necrosis. Normal glomeruli (G) and normal renal tubules (RT).
Looking at Figure 5B, the expression of caspase-1 showed a significant increase in PCOS group compared to Vehicle (99%, P < .05). Preco treatment, Post treatment, and Metformin groups all showed similar significant decrease when compared to PCOS (98%, 98.5% and 99% respectively, P < .05).
As for ASC expression, it was significantly elevated in PCOS mice when compared to control (99.2% folds, P < .05) as depicted in Figure 5C. Preco treatment, Post treatment, and Metformin groups all showed similar significant decrease when compared to PCOS (97%, 99.5% and 95% respectively, P < .05).
Gundelia tournefortii Improves PCOS Induced Kidney Damage
Histopathological Analysis of the Kidney
The examination of H&E-stained kidney sections from PCOS-induced mice revealed marked deformity of renal features including tubular necrosis with casts, shedding cells and large areas of dilated tubules compared to control group as shown in Figure 6A to D. The Pre and Post treatment groups of PCOS-induced mice with G. tournefortti extract produced marked recovery of normal renal histological architecture (Figure 6E and F). Although treatment of PCOS-induced mice with Metformin showed restoration of most features of the kidney, there was still some dilation of renal tubes as well as marked interstitial lymphocyte infiltration (Figure 6G).
Biochemical Analysis
Looking at Urea and BUN serum levels, their concentrations in the PCOS-induced mice did not differ significantly from Vehicle group (Figure 7A and B).

Effect of G. tournefortii on urea and BUN serum levels. Serum levels of (A) urea and (B) BUN. Data are expressed as the mean ± SD (n = 3). aP < .05 versus the Vehicle group and bP < .05 versus the PCOS group.
Evaluation of Oxidative Stress Markers in Kidney
PCOS mice demonstrated a significant decrease in GSH levels as compared to Vehicle group (71% with P ≤ .05) as shown in Figure 8A. Only post treatment with G. tournefortii extract significantly increased the GSH levels (73%, P < .05) while Metformin treatment resulted in a non-significant increase of 38%.
In addition, MDA levels were significantly elevated (82%, P < .05) in PCOS mice compared to Vehicle group (Figure 8B). A significant decline was apparent in both Preco and Post treated group with the herbal extract (47% and 70% respectively, P < .05), while treatment with Metformin failed to significantly decrease MDA levels in kidney tissues.
As for SOD activity, it significantly decreased in PCOS group compared to Vehicle group (41.82%, P < .05) and was only restored in the Post treatment group with the extract (50% significant increase compared to PCOS group, P < .05) as shown in Figure 8C.
Finally, a significant 50% decrease in CAT activity in PCOS mice was observed when compared to Vehicle group (Figure 8D). Post treatment with the extract significantly increased CAT activity by 51% (P < .05), while Metformin treatment significantly increased CAT activity in kidney of PCOS mice by only 19% (P < .05).
Evaluation of Pro-Inflammatory Cytokine IL-1β and TNF-α in Kidney
To further asses the capability of G. tournefortii to reverse the kidney damage induced by PCOS
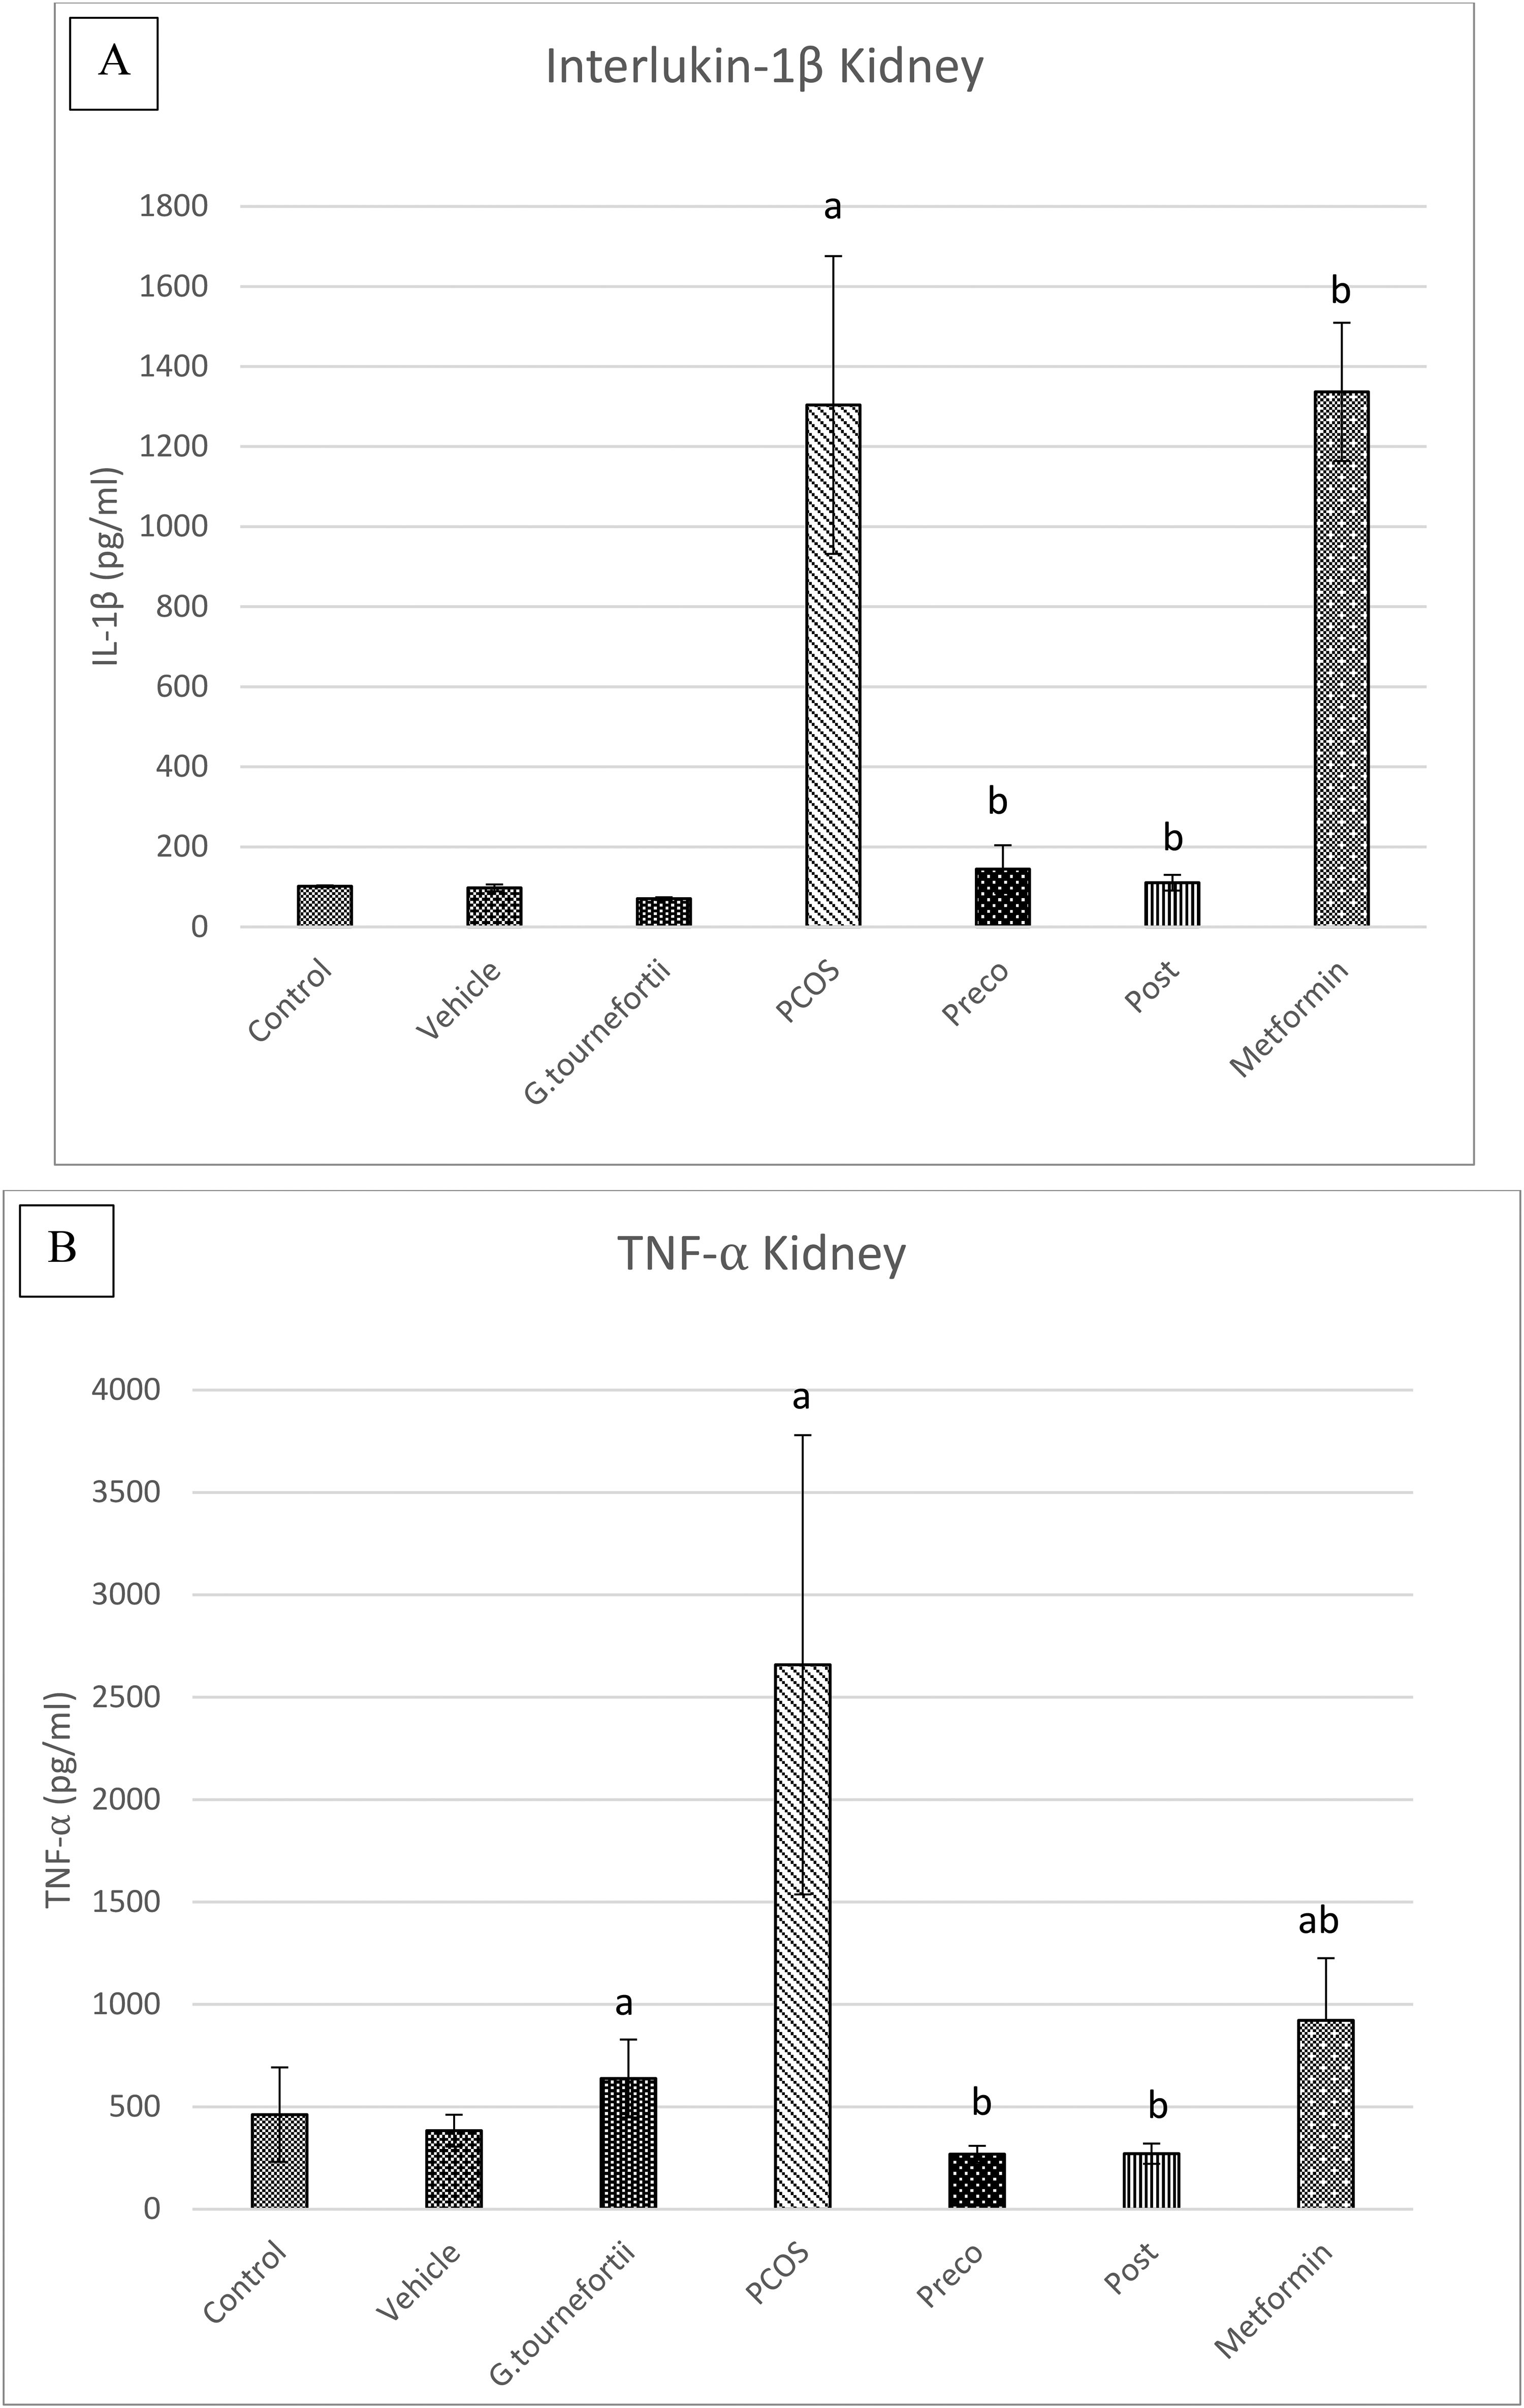
Effects of G. tournefortii on the pro inflammatory markers in kidney of PCOS mice. Levels of TNF-α (A) and IL-1β (B) were measured in kidney homogenates. The data are presented as the means ± SD (n = 3 per group). aP < .05 versus the Vehicle group and bP < .05 versus the PCOS group.
Effect of G. tournefortii Extract on NLRP3 Expression and its Associated Genes in Kidneys of all Groups
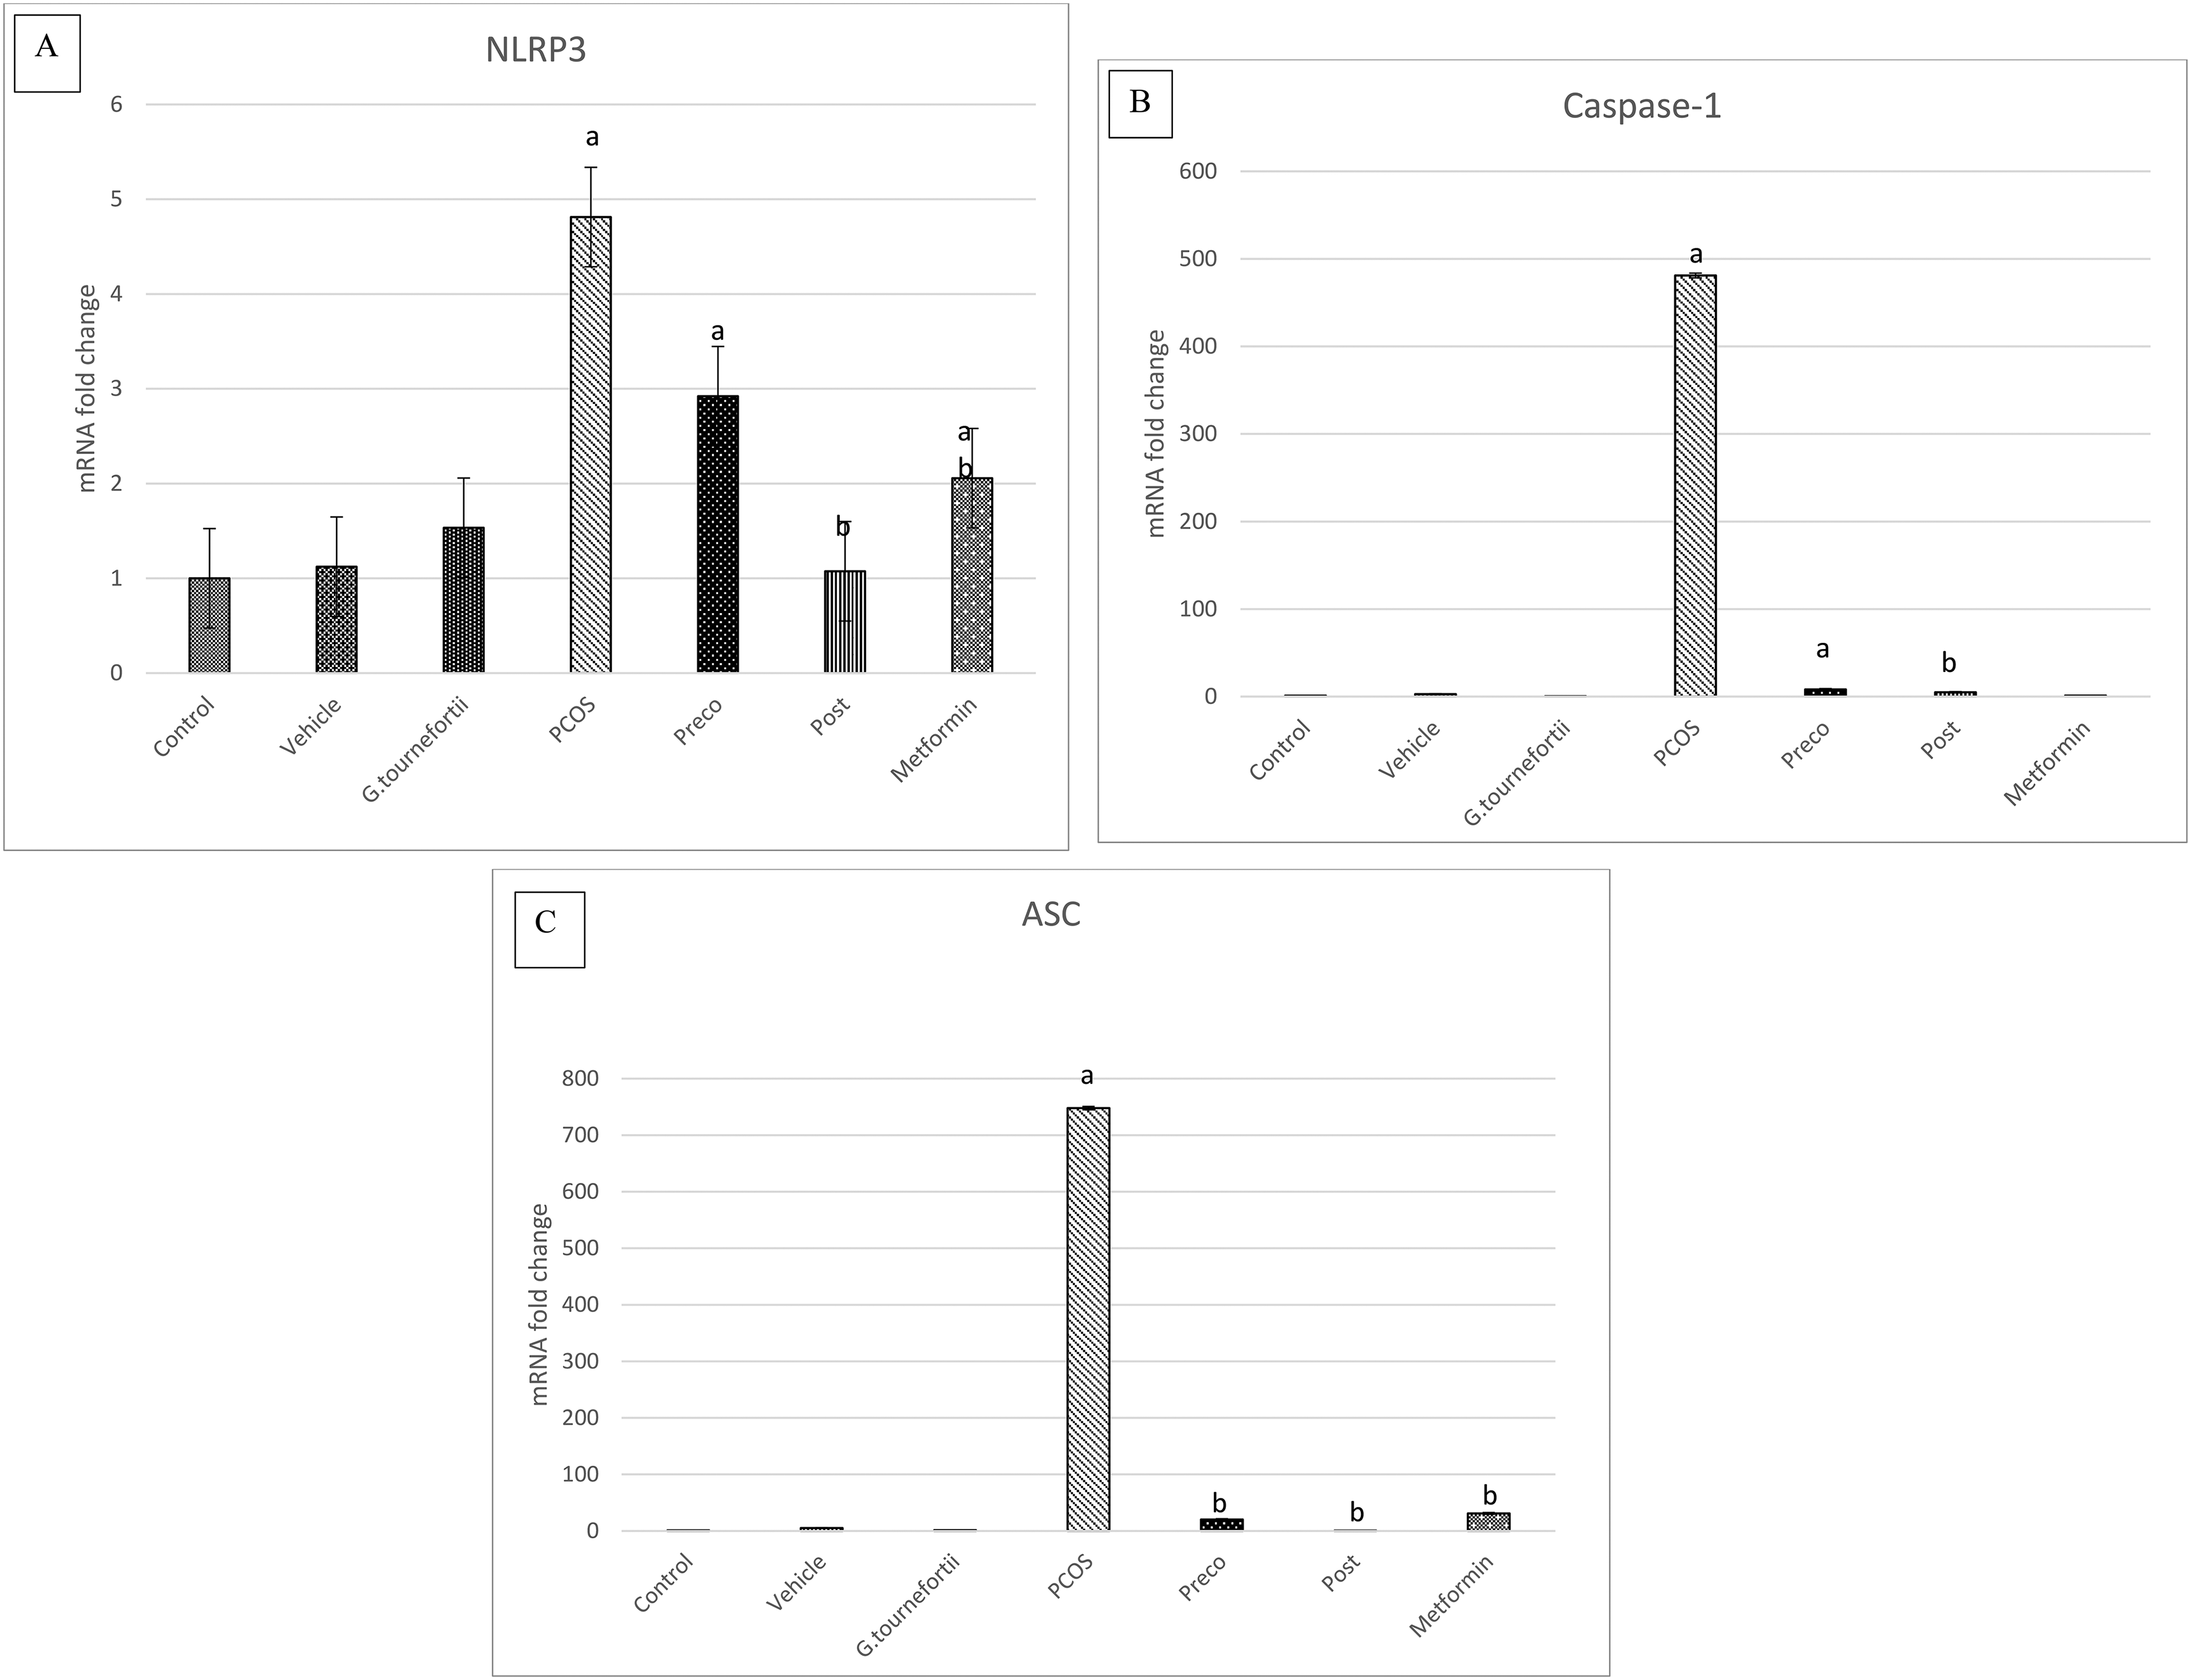
As shown in Figure 10A, a significant increase in NLRP3 expression was detected in PCOS mice (81%, P < .05) when compared to Vehicle group. This increase was lessened significantly with Post treatment with G. tournefortii extract as well as with Metformin (95% and 89% respectively, P < .05).

Effect of G. tournefortii extract on NLRP3 expression and its associated genes in kidneys of all groups. (A), (B), and (C) show mRNA fold change for NLRP3, capsase-1, and ASC respectively. Data are mean ± SEM of 3 mice per group. aP < .05 versus the Vehicle group and bP < .05 versus the PCOS group.
The expression of caspase-1 showed no difference in PCOS, Preco, and Post treatment groups when compared to Vehicle (Figure 10B). However, Metformin group showed a significant increase in caspase-1 expression when compared to PCOS group (57%, P < .05). Moreover, administration of G. tournefortii extract alone significantly inhibited the expression of caspase-1 when compared to Vehicle group (38%, P < .05).
As for the expression of ASC, it was significantly elevated in PCOS mice when compared to control (95%, P < .05) as depicted in Figure 10C. Only Post treatment with the herbal extract was successful in significantly decreasing ASC expression in PCOS induced mice (96%, P < .05), while Metformin further augmented the elevation of ASC expression by 43%, P < .05.
Discussion
PCOS is a complex disorder that could lead to severe complications beyond the reproductive system. Several studies showed that women with PCOS are significantly at greater risk of developing chronic kidney disease as well as liver diseases.20,21 Metformin is a drug commonly used to treat type 2 diabetes and has been prescribed for years for women with PCOS. However, despite its widespread use, Metformin has been associated with several side effects, and in rare cases; has been associated with liver and kidney damage.22,23 Our previous study and others have shown that Gundelia tournefortii was able to restore all negative parameters induced in PCOS parameters.24–26 Since many studies showed that G. tournefortii possesses antioxidant capabilities with nephro- and hepatoprotective effects, we aimed to evaluate its capability on relieving that in PCOS model.
Looking at the histological analysis of kidney and liver tissues, PCOS mice had marked injury in both liver and kidney tissues which can be associated with oxidative stress and low-grade chronic inflammation induced by PCOS. Indeed, our study has shown that PCOS mice had elevated level of OS markers as well as increased pro-inflammatory markers TNF-α and IL-1β (Figures 3,4,8 and 9) which was also shown in previous studies.27,28

Effects of G. tournefortii on oxidative stress in kidneys of PCOS mice. GSH level (A), MDA levels (B) SOD activity (C), and CAT activity (D), and were measured in Kidney tissues. The data are presented as the means ± SD. aP < .05 versus the Vehicle group and bP < .05 versus the PCOS group.
Oxidative stress occurs when there is an imbalance between the production of free radicals and the body's ability to eliminate them with antioxidants. A study found that the aqueous extract of G. tournefortii restored antioxidant levels (GSH, SOD, CAT, GSH) in the serum and liver of hepatocellular carcinoma (HCC) mouse model by enhancing the activity of antioxidant enzymes resulting in alleviating liver cancer and counteracting hepatotoxicity. 29 This agreed with our study, where post-treatment with the herbal extract showed significantly higher antioxidant activities of liver homogenates.
Furthermore, low-grade chronic inflammation has been strongly associated with PCOS pathogenesis.30,31 In our study, Preco and Post-treatment with G. tournefortii extract was able to significantly lower levels of pro-inflammatory markers IL-1β and TNF-α in both liver and kidney tissues.
To understand more about the mechanism by which the extract can alleviate inflammation in the kidney and liver, NLRP3, and its associated genes (caspase-1 and ASC) expression were examined in both tissues. The prime function of the inflammasome is to control the activation of caspase 1 and control the maturation of proIL-1β and proIL-18, in addition to mediating pyro-ptosis. 18 Moreover, TNF-α has been shown to increase the expression of caspase-1.32,33 In our study, PCOS mice showed increased expression of NLRP3 and its associated genes agreeing with a previous study. 29 Post-treatment with G. tournefortii extract was able to normalize the expression of those genes in both liver and kidney tissues. Hence, G. tournefortti could be mitigating the IL-1B/ROS activation through inhibition of caspase-1/ASC inflammasomes by lowering TNF-α levels.
Interestingly, treatment with Metformin did alleviate inflammation in the liver of PCOS mice but failed to do so in their kidneys. Moreover, the over-expression of caspase-1 and ASC in the kidneys due to PCOS induction was further augmented upon treatment with Metformin. Studies have previously shown that taking Metformin could pose a risk of nephrotoxicity, especially in people with impaired kidney function.34,35
Notably, our study showed a changing correlation between ROS levels and liver damage. This was the case in the liver of the Preco group Increase of serum ROS levels were like the PCOS groups, but liver damage was not apparent histological analysis of the liver (Figure 1E), nor in the ALT levels (Figure 2A). Moreover, pro-inflammatory markers and NLRP3-associated genes were similar to the control levels (Figure 4 and 5). Many studies have shown that disruption of the levels of oxidative stress markers are indication of liver damage in different studies.36–38 However, oxidative stress is not the only player in inducing injury in organs such as the liver and kidney. A prolonged activation and unregulated inflammatory process can also lead to liver injury, and this activation could be independent of ROS.39,40 Hence, more research is warranted to fully understand the process behind inflammation is PCOS, and the protective mechanism of the active components of G. tournefortii extract.
Conclusion
In conclusion, Gundelia tournefortii has shown promising results in alleviating liver and kidney injuries induced by PCOS by modifying the ASC/caspase-1/IL-1β signaling pathway. It could serve as a potential preventative complementary medicine for currently prescribed medication to maintain liver and kidney health. Further studies are needed to fully understand the mechanisms of action of Gundelia tournefortii and its potential benefits.
Footnotes
Acknowledgements
None
Authors’ Contributions
Declaration of Conflicting Interests
The authors declared no potential conflicts of interest with respect to the research, authorship, and/or publication of this article.
Funding
The authors received no financial support for the research, authorship, and/or publication of this article.
Ethics Approval and Consent to Participate
All animal housing and experiments were conducted in strict accordance with the institutional Guidelines for Care and Use of Laboratory Animals at Beirut Arab University, Lebanon. This study received the approval of the Institutional Review Board (IRB) committee at Beirut Arab University, code number: 2023-A-0059-S-M-0563.
Consent for Publication
All authors consented to publish this research.