
Abstract
Background
Pulse width, which can reflect qi, blood excess, and deficiency, has been used for diagnosing diseases and determining the prognosis in traditional Chinese medicine (TCM). This study aimed to devise an objective method to measure the pulse width based on an array pulse diagram for objective diagnosis.
Methods
The channel 6, the region wherein the pulse wave signal is the strongest, is located in the middle of the pulse sensor array and at the guan position of cunkou during data collection. Therefore, the main wave (h1) time of the pulse wave was collected from the channel 6 through calculation. The left h1 time was collected from the remaining 11 channels. The amplitudes at these time points were extracted as the h1 amplitudes for each channel. However, the pulse width could not be calculated accurately at 12 points. Consequently, a bioharmonic spline interpolation algorithm was used to interpolate the h1 amplitude data obtained from the horizontal and vertical points, yielding 651 (31 × 21) h1 amplitude data. The 651 data points were converted into a heat map to intuitively calculate the pulse width. The pulse width was calculated by multiplying the number of grids on the vertical axis with the unit length of the grid. The pulse width was determined by TCM doctors to verify the pulse width measurement accuracy. Meanwhile, a color Doppler ultrasound examination of the volunteers’ radial arteries was performed and the intravascular meridian widths of the radial artery compared with the calculated pulse widths to determine the reliability.
Results
The pulse width determined using the maximal h1 amplitude method was comparable with the radial artery intravascular meridian widths measured using color Doppler ultrasound. The h1 amplitude was higher in the high blood pressure group and the pulse width was greater.
Conclusions
The pulse width determined using the maximal h1 amplitude was objective and accurate. Comparison between the pulse widths of the normal and high blood pressure groups verified the reliability of the method.
Keywords
Introduction
Pulse width reflects physiological and pathological information regarding the human body. However, the objective evaluation and concretization of pulse width information remain difficult, which limit the diagnosis and treatment of clinical diseases. Pulse diagrams have been used to objectively present the pulse period. Sphygmograms contain information regarding cardiac ejection, pulse propagation, and transport along the blood vessels. 1 Pulse diagrams comprise three peaks. The first and highest wave among them is the main wave, and it is represented by h1.
Pulse shape is one of the four essential elements characterizing the pulse condition (脉象) in traditional Chinese medicine (TCM). Pulse conditions within this element include wide pulse, thready pulse, long pulse, and short pulse. A wide pulse may be observed in healthy and morbid states. A wide pulse in healthy individuals is characterized by largeness, mildness, and calmness, suggesting physical fitness. However, a wide pulse in individuals with some diseases indicates aggravation of the disease. A thready pulse indicates deficiency syndrome. The blood vessels cannot be filled in patients with blood deficiency, whereas blood flow cannot be facilitated in patients with qi deficiency, resulting in a small weak pulse. Cold, dampness, and pain lead to contraction of the blood vessel, resulting in a thready pulse. 2 The use of a single-pulse wave sensor has limited the digitization of pulse shape. A sensor array can remedy the defects in pulse wave information acquired using a single-pulse wave sensor. Moreover, it can acquire multipoint pulse wave signals. Thus, it plays an important role in pulse-shape digitization.
The pulse width is defined as the radial range of pulsation, that is, the breadth of the pulse path perceived by the pulp of the finger; however, the pulse width is not equivalent to the width of the blood vessel. These measures are related to the filling of qi and blood. The pulse width of a healthy individual is approximately 2.7 mm. 3 The pulse length is defined as the axial range of pulsation at cunkou (寸口). The pulse width and length reflect the pulse wave strength. Consequently, a single-pulse wave sensor cannot be used to objectively evaluate the pulse shape.
Finger pressure, which is divided into light, medium, and heavy, is defined as the pressure exerted by the finger pulp at the cunkou while taking the pulse. Finger sensation refers to the strength of the pulse, that is, the magnitude of the arterial pulse strength perceived by the pulp of the finger. Finger sensation can be categorized as weak, medium, and strong. A constant increase in finger pressure does not lead to a continuous enhancement of finger sensation. Each finger sensation has an optimal pulse pressure, and the finger sensation is reduced when the pulse pressure exceeds the optimal value. 3 Notably, the finger sensation threshold varies among physicians in clinical practice. The h1 amplitude is the highest in one pulsation cycle, whereas the finger sensation is the strongest. Thus, defining the range of finger sensation thresholds using h1 is of practical significance and it can be used as a reference value.
The sensor array, a novel pulse wave acquisition device, is a wearable microelectromechanical pressure sensor array that has enabled the portable acquisition of pulse waves, monitoring of cardiovascular diseases, and customization. 4 Previous studies have explored methods to make sensor arrays appropriate for direct usage on the skin. Zhu et al 5 developed a sensor array with high electrical conductivity, excellent mechanical properties, and ultrahigh sensitivity using skin-like pressure sensors. This sensor array could be attached directly to the skin to monitor the wrist pulse. A sensor array developed using liquid metal that includes a three-dimensional printed microbump array is capable of sensitive and precise measurements with tight skin contact.6,7 The stretchability and foldability of the sensor arrays were demonstrated in these studies. Compared with traditional single-pulse wave sensors, sensor arrays are softer, do not cause discomfort, and facilitate easier acquisition of information. Thus, sensor arrays truly simulate the pulse-taking technique.8,9 Sensor arrays have also promoted the further development of pulse-taking quantification in TCM. 10 A three-dimensional pulse diagram can reflect the overall state of an organism. The pulse width can be calculated by analyzing the pulse wave signals of each channel. 8
A multichannel automatic pressurization intelligent pulse device was developed in a previous study. 11 Seven h1 amplitudes of the radial artery can be obtained using the seven negative sensors. The number of h1 values exceeding the established width discrimination threshold (0.58) among these seven h1 values is defined as the width coefficient. The width coefficient has been used to determine the pulse width. 11 However, this method can only distinguish relatively wide and thready pulses, and the specific width range of the pulse cannot be defined. The number of effective channels in flexible pressure sensor dense arrays was used to calculate the pulse width in another study; however, an amplitude of 50% of the maximum channel had to be achieved to facilitate the calculation. 12 Moreover, the precision of this method was not sufficiently high.
A high correlation has been observed between the pulse width measured using infrared imaging and the pulse width in a two-dimensional image mapped using a three-dimensional pulse map; thus, the actual pulse width can be calculated using two parameters and a three-dimensional pulse algorithm. 13 However, the correlation coefficient between the two parameters is only 0.8. Wang et al 14 reported that changes in physiological parameters influenced the characteristics of the pulse based on the pulse width model of finite element analysis and extracted the associated parameters of the pulse width prediction model. However, this study focused on the pulse width model, and the reliability of this model lacks data support. Therefore, the present study aimed to devise an objective method to measure the pulse width based on an array pulse diagram for objective diagnosis. Information regarding pulse waves based on the pulse width, a basic connotation in TCM, was obtained using a sensor array via the application of biharmonic spline interpolation to compensate for the missing information and objectively present the pulse wave amplitude at a given moment. This study obtained the pulse width by determining the distance between h1 by counting the number of h1. The inner diameter of the blood vessel obtained via color Doppler ultrasound and the pulse-taking results of the TCM doctors were used as relatively objective and subjective reference values, respectively, to verify the reliability of the measured pulse width value. In addition, preliminary verification was conducted, and this measurement method was applied to a population with high blood pressure.
Devices and Methods
Devices
A PPS sensor array manufactured by the American PPS Sensor Company that can convert the measured pressure into an electrical output using capacitive sensing components was used in this study. The PPS sensor array has low output energy, high dynamic response, good natural effects, and good environmental adaptation. A circular metal film or gold-plated film is used as the electrode in the capacitor in this kind of sensor. Pressure deformation of the film results in changes in the capacitance generated between the film and the fixed electrode, leading to the measuring circuit generating an electrical signal correlated with the voltage. A diagnostic ultrasound scanner (LOGIQ e20; GE, USA) was used to determine the diameter of the radial artery at the guan position of the left hand.
Methods
Sensor Array Channel Distribution and Array Pulse Wave Acquisition
The sensor array used in this study was 10 mm × 7.5 mm in size, comprising 12 sensing elements of 2.5 mm × 2.5 mm evenly arranged in an array pattern of 4 × 3. Separate capacitances were present at the intersections of the 4 × 3 rows and horizontal columns under the empty face in the middle of a bipolar plate. The 12 sensor arrays were designated as 12 channels, and the PPS sensor array was positioned perpendicular to the radial artery to facilitate optimal pulse wave acquisition.
The array pulse wave acquisition process has been described in detail in our previous study. 15 In brief, the array pulse was acquired at the guan position on the left hand. The participants were instructed to place the pulse-taking pillow under their left wrist to ensure a stable and controllable hand posture. The upper arm was relaxed, the forearm was naturally extended, and the elbow was flexed to 120°. The participants were then instructed to breathe slowly. The sensor array was placed at the guan position of the left hand to measure the array pulse waves. The finger pressure was light, medium, or heavy, and minor adjustments were made to facilitate the acquisition of an optimal pulse wave. The optimal pulse wave had a stable baseline and intact pulse shape. The finger pressure was maintained for 30 s for array pulse wave acquisition (Figure 1).
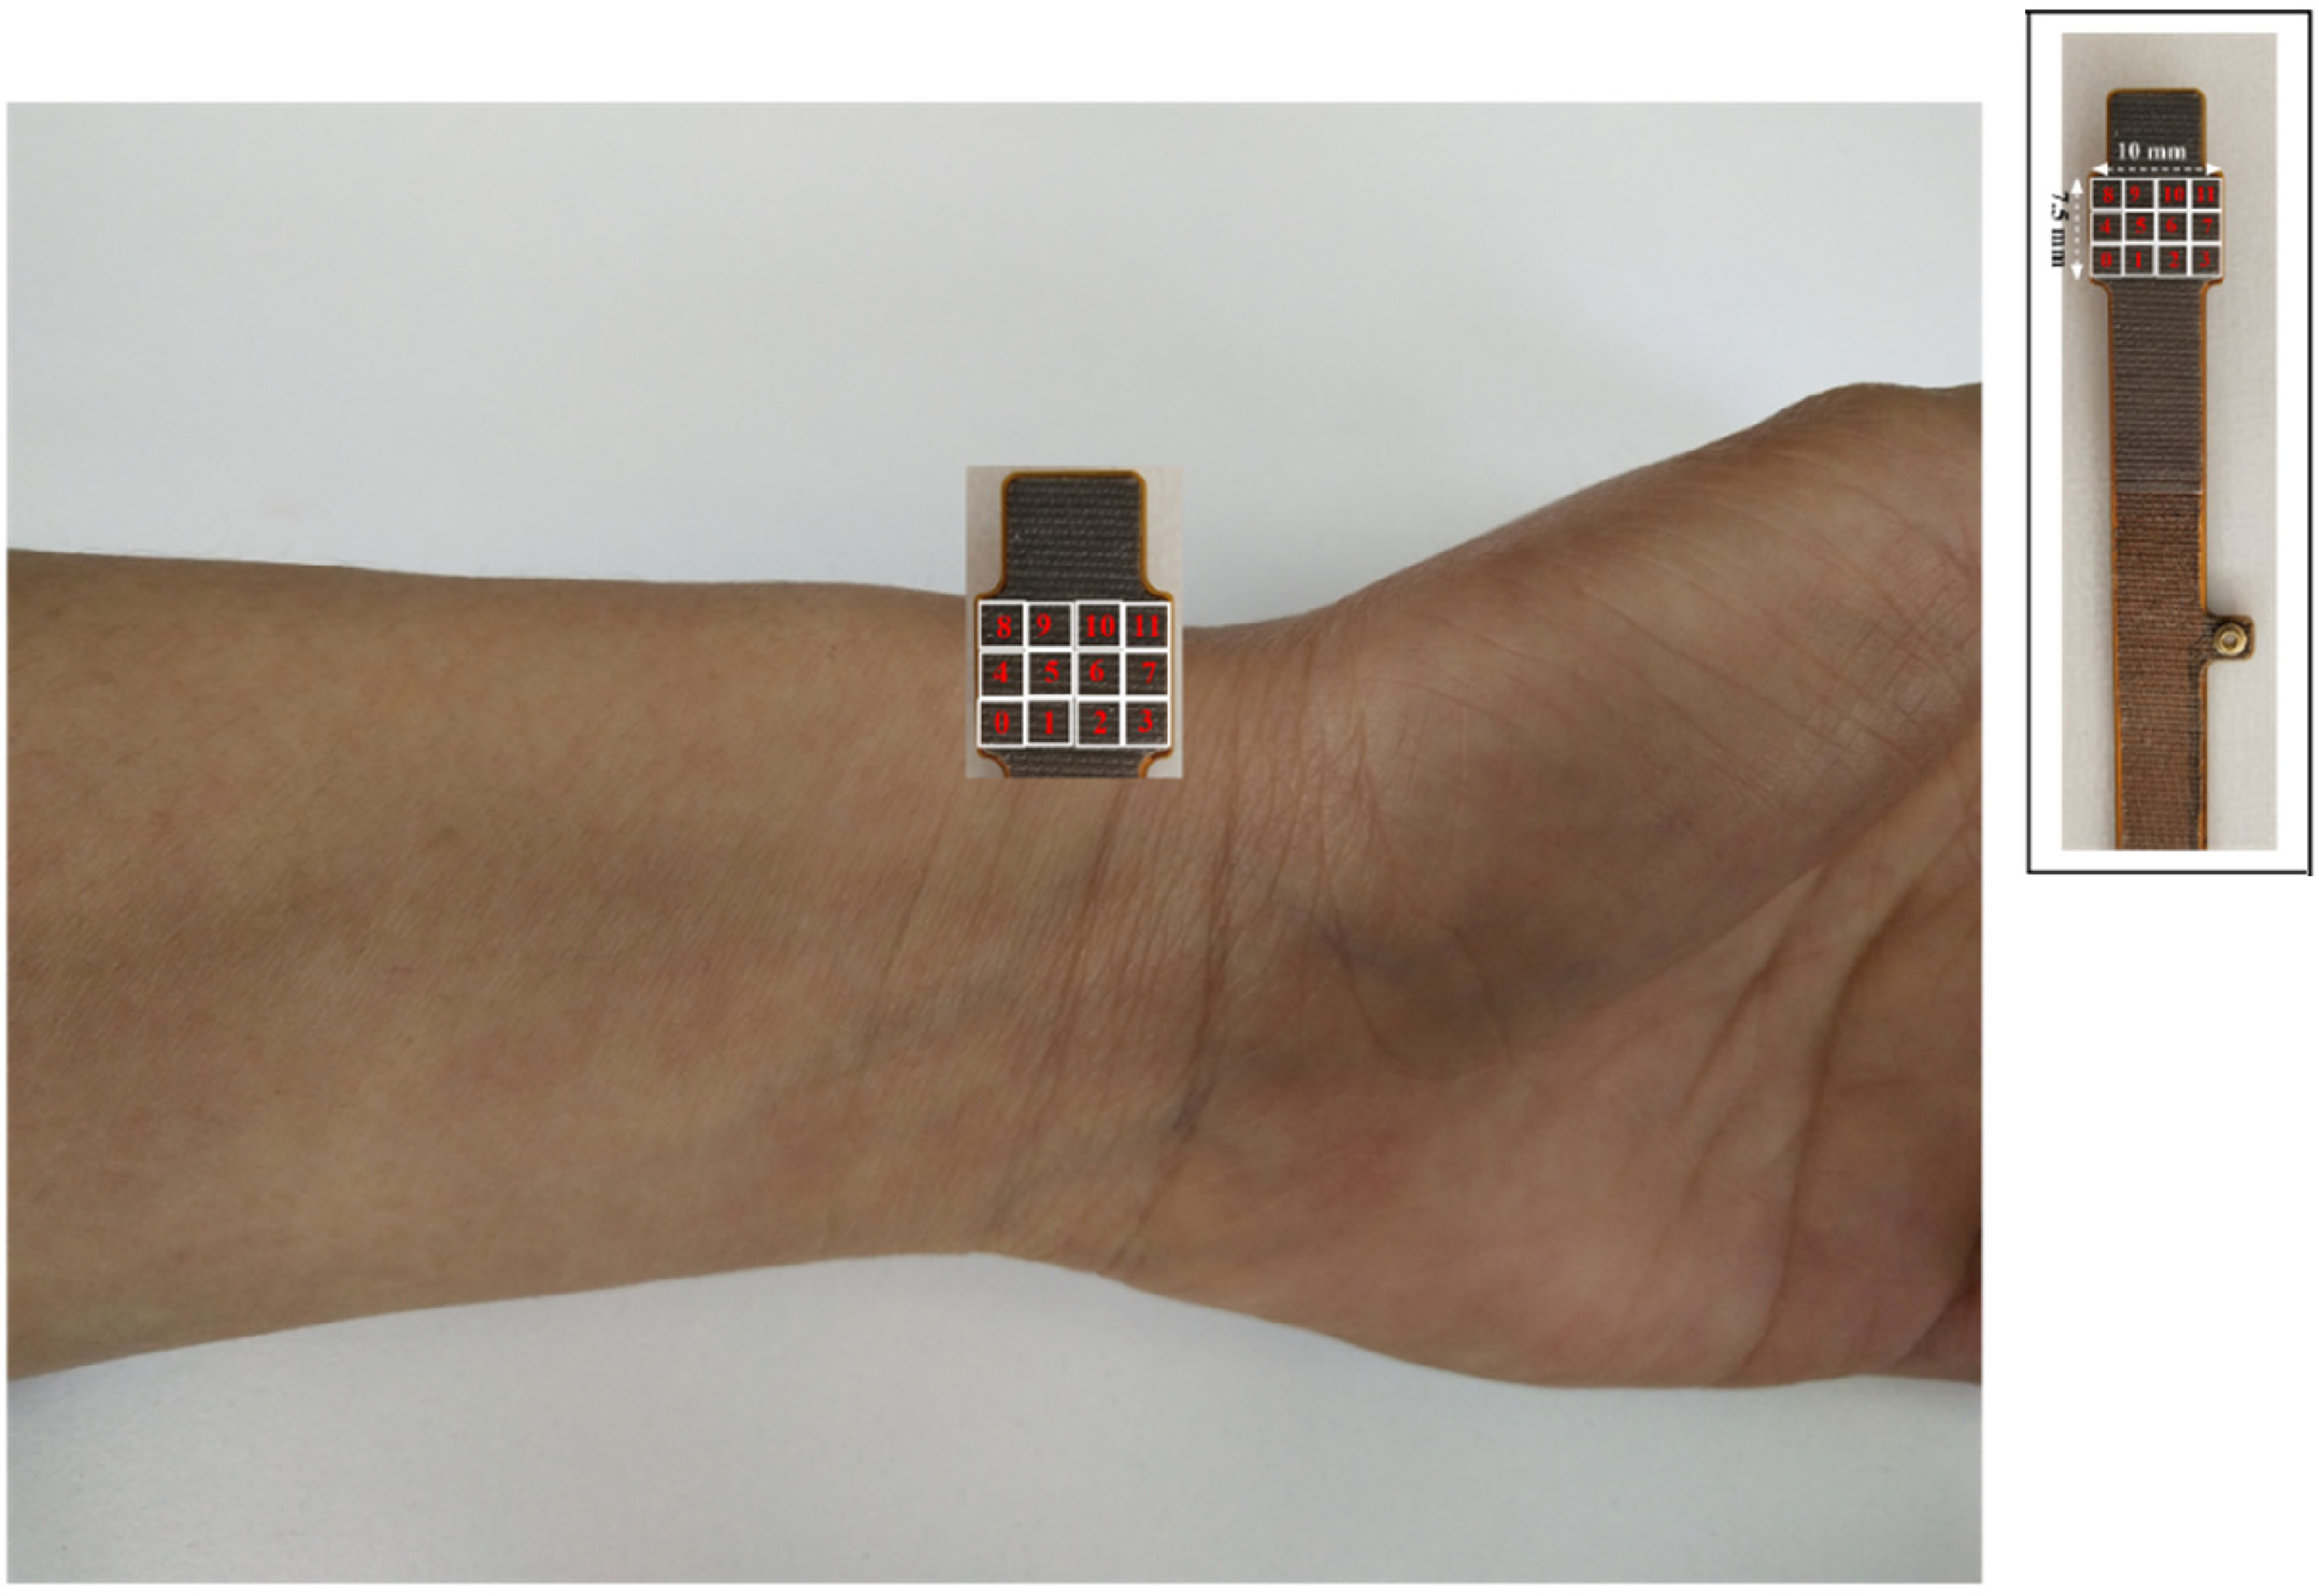
Array sensor channel distribution and the site of pulse wave acquisition.
Color Ultrasound Doppler
The diameter of the radial artery at the guan position was detected as described below. The participants were instructed to assume the supine position and the location of the guan position for ultrasonic measurement was determined by the TCM doctors via pulse-taking and marked with a marker. Conventional two-dimensional probes were used for color ultrasound. The probe was placed perpendicular to the radial artery; the probe frequency ranged from 2–9 MHz. The probe was placed over the radial artery with moderate strength such that the blood vessel was filled to a certain degree to ensure blood return. The diameter of the radial artery was determined using the marker. The internal diameters of the blood vessels were measured in the transverse section. The internal diameter of the radial artery was first determined on a computer screen and another point was fixed subsequently. The two points were connected perpendicular to the radial artery, and the distance between them was considered the radial artery diameter.
Setting of the Pulse Wave Amplitude
The h1 amplitude is the peak in a pulsatile cycle produced by the displacement of the wall caused by the increase in the pressure in the aorta owing to the left ventricle ejecting blood into the aorta, which mainly reflects the function of the left ventricle and compliance of the large arteries. The h1 amplitude was the highest at this point. Moreover, the finger sensation (perception and resolution) was also the strongest at this point. The pulse width measured during pulse acquisition reflects the strength of the pulse wave and is not equivalent to the vessel width. In TCM, the pulse width refers to the transverse range of the radial artery perceived by the pulp of the finger, which is the dynamic embodiment of the visceral functions of the whole body, qi-blood, and yin-yang. The inner diameter of the radial artery, measured using color ultrasonic Doppler, is a static measurement. It does not reflect the changes in qi, blood, and yin-yang. However, the imaging results and the finger sensation results reported by experienced physicians were used as a reference to comprehensively analyze the reliability of this detection method owing to the lack of objective indicators of pulse width. Consequently, the h1 range was used as the basis for pulse-width digitization to ensure that the measurements were relatively objective and that the measurements provided a reference value and were of practical significance (Figure 2). The h1 amplitude of each channel was determined and the pulse width range was indirectly calculated according to the known h1 amplitude in the pulse-width data analysis.

Diagram depicting the full pulsation cycle and amplitude of each peak and valley.
Main Wave (h1) Extraction
The pulse waveform shows small but regular changes during the acquisition of pulse waves owing to the influence of respiratory motion and the changes in the arterial vessels. The normal respiratory rate is 16–18 times/min, with 4–5 pulsations in one respiratory cycle. 16 Therefore, five consecutive pulsation cycles with a stable baseline, complete waveform, clear h1, and the highest amplitude of the original pulse waveform within 30 s were selected. Channels 5 and 6 are located in the middle of the sensor array (Figure 1). The h1 time of channel 6 was determined and the h1 amplitudes of five consecutive pulsation cycles were extracted. The area of the pressure sensing point (10 mm × 7.5 mm) in the sensor array was extremely small, and the pulse passing through this point was synchronous. Thus, the h1 time of channel 6 can be considered equivalent to those of the remaining 11 channels. This ensured the synchronization of the pulse waves collected by the 12 channels. Consequently, the h1 amplitudes of the remaining 11 channels were extracted according to the h1 time of channel 6. The amplitudes of the collected pulse waves varied owing to the different positions of each channel relative to the radial artery. The three-dimensional pulse diagram was fitted with the h1 amplitude, and a heat map was drawn.
Biharmonic Spline Interpolation
The h1 amplitude of the 12 channels did not accurately reflect the pulse width range; therefore, the obtained data were interpolated. Biharmonic spline interpolation was used in this study to interpolate the data as it can effectively utilize known data and eliminate the uncertainty associated with single data points. This method is commonly used in the fields of mathematics and computer images as the predicted data are more accurate. The surface of the array pulse was also better fitted using this method in the present study, which is in line with the characteristics of pulse waves. The interpolation formula was as follows17,18:


Three-Dimensional Pulse Diagram Mapping
Five consecutive optimal pulse waves were screened in 30 seconds; however, baseline drift and signal interference were observed in the unfiled data. The optimal pulse wave was filtered using the following filtering formula
19
to better represent the effect of the three-dimensional pulse diagram:

The characteristic points of each channel pulse wave were clearer after filtering, and the occurrence of other frequency interference waves was suppressed. The filtered pulse waves were standardized. These operations aided in building a three-dimensional pulse diagram and reflecting the pulse-beating effect of the pulse tube simultaneously to better reflect the features of the pulse.
Statistical Analysis
The normality and homogeneity of variance of the two groups were compared using two independent sample t-test or the Mann–Whitney U test. The data are presented as the mean ± SD. P-values of ≤ .05 were considered statistically significant. Figure 3 illustrates the workflow of this study.
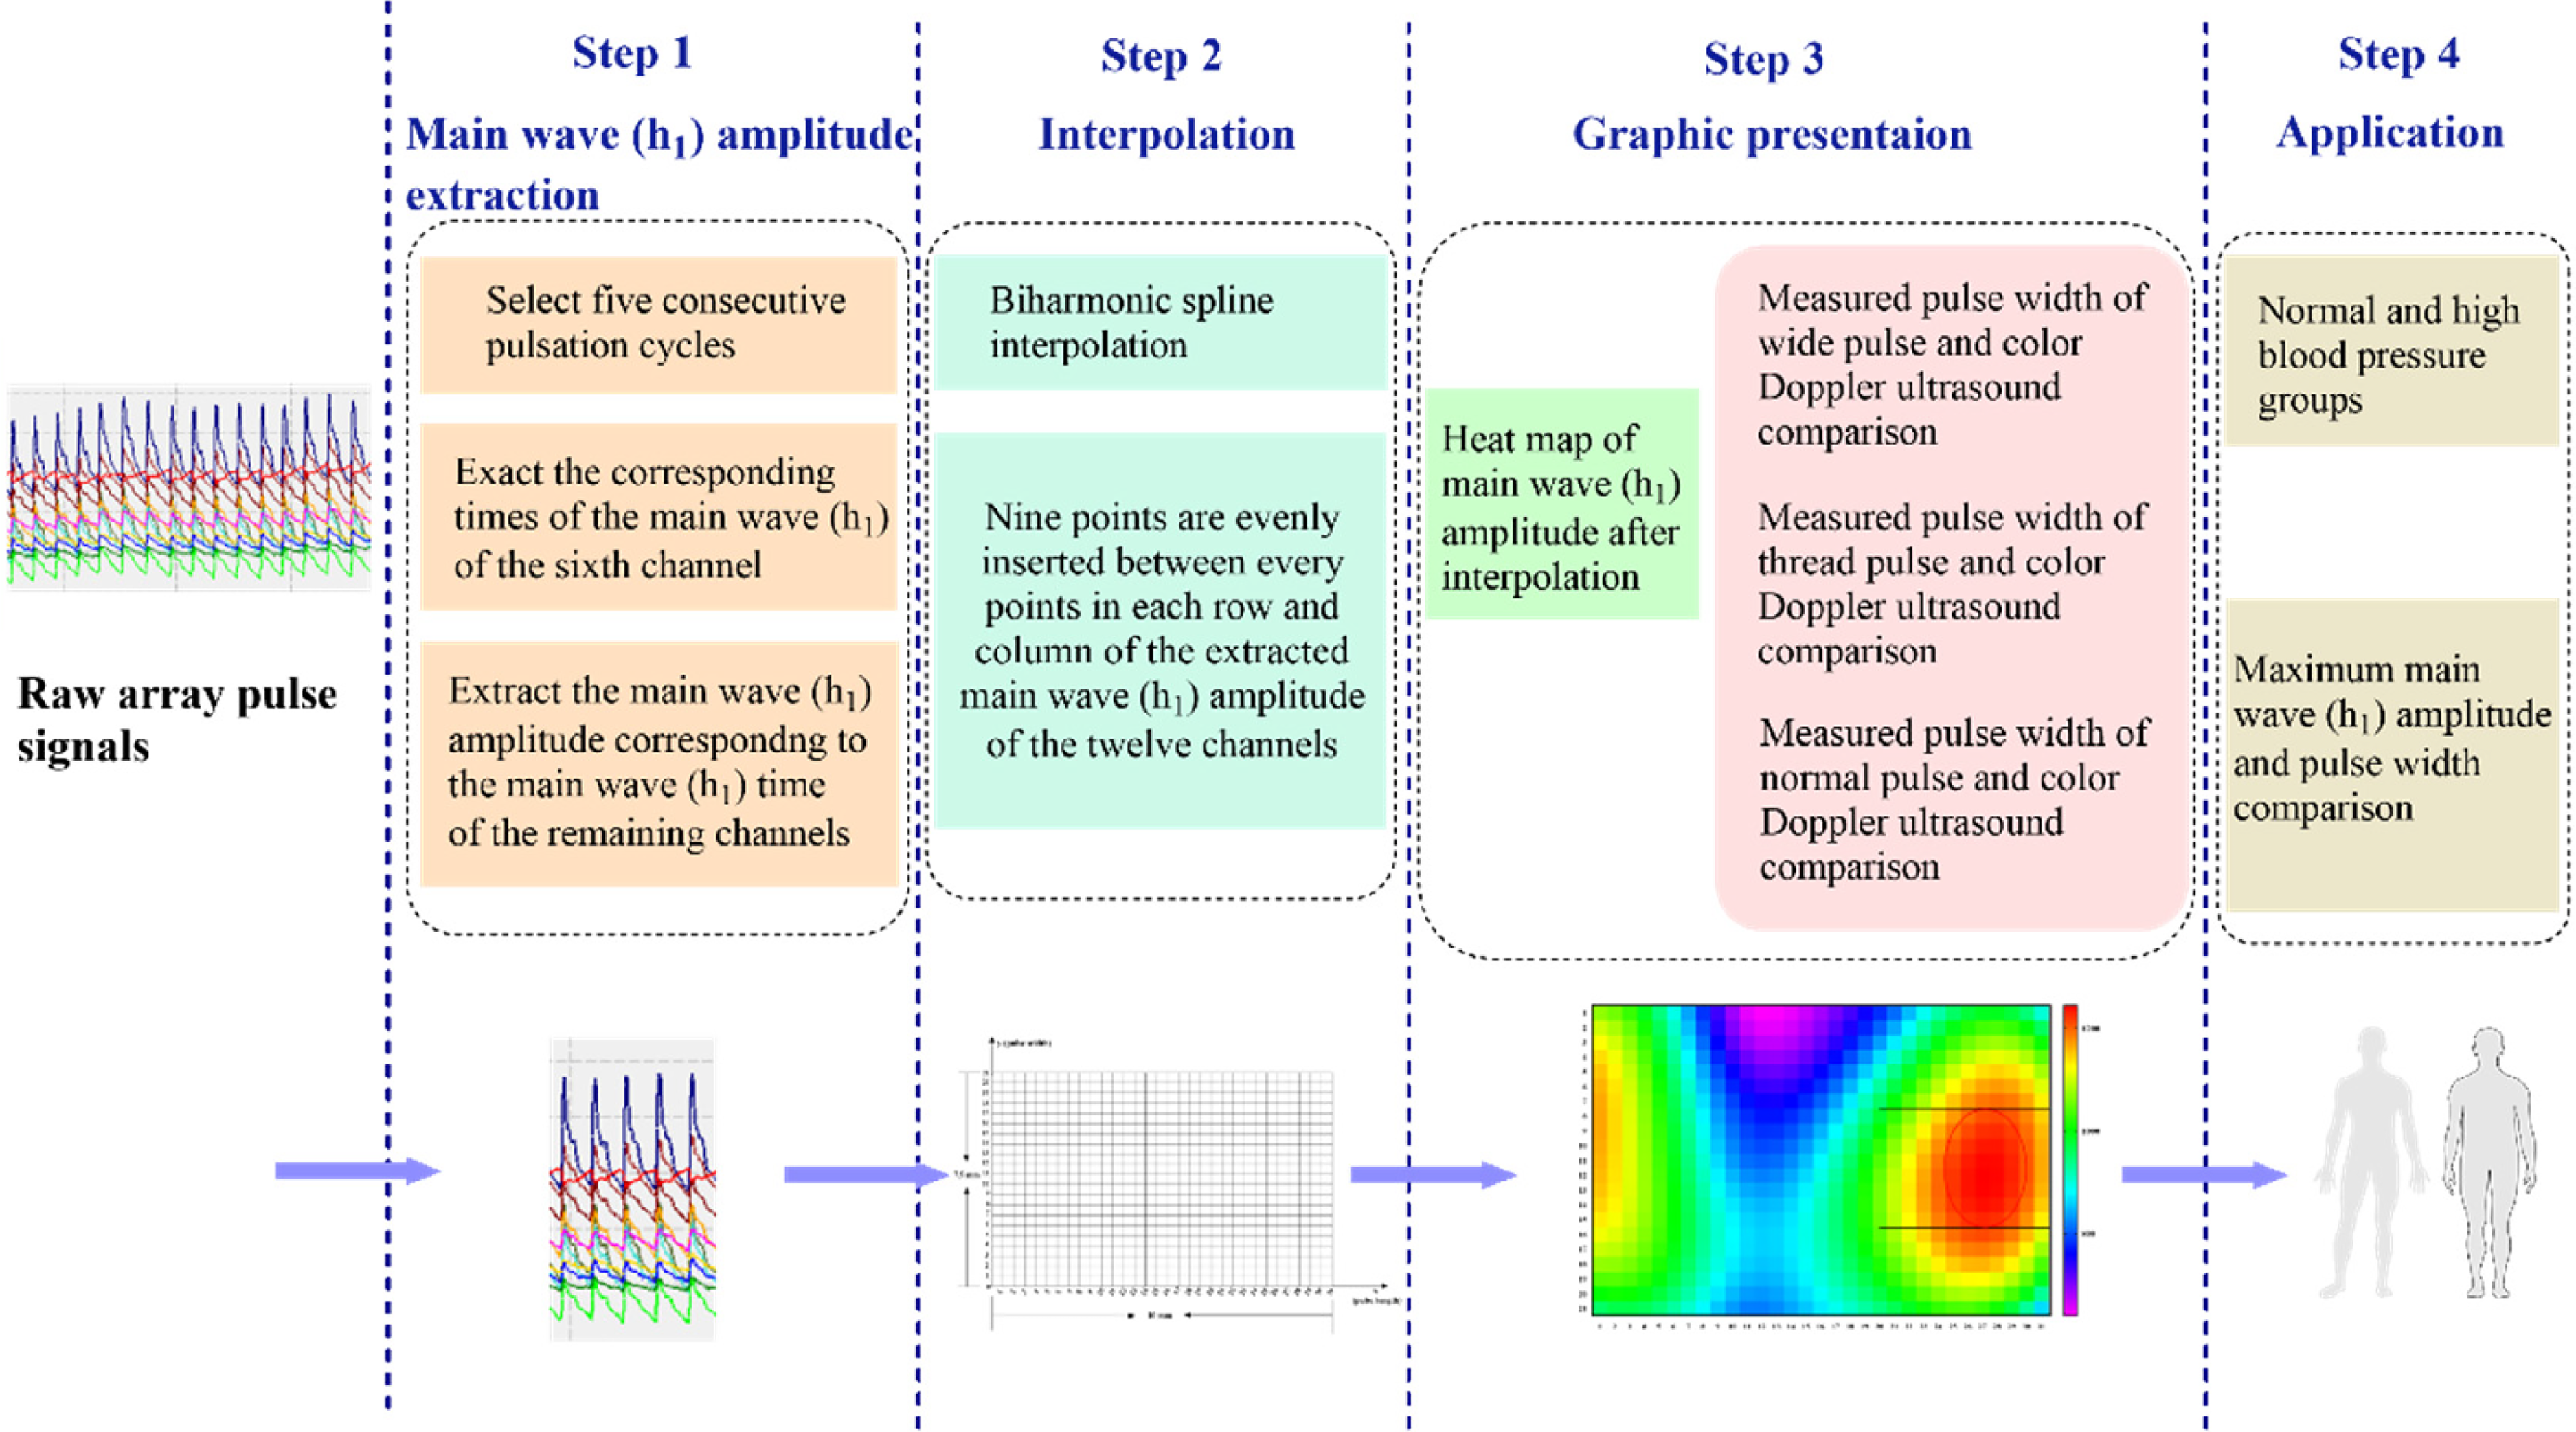
Flow chart of this study. The study comprised of four steps: the first step is the extraction of h1, the second step is the interpolation of h1, the third step is creating the heatmap presentation of h1, and the fourth step is application of this method to the normal and high blood pressure groups.
Results
Extracting the Main Waves (h1) of the 12 Channels
A schematic diagram of the pulsation period of the 12 channels was simulated. Figure 4 presents a complete pulsatile periodogram of the 12 channels, where the x-, y-, and z-axes represent the pulse length, pulse width, and h1 value, respectively. Each number represents a corresponding sensing channel. The specific value of the pulse width, that is, the distribution range of the maximum h1 values on the y-axis, can be determined by extracting the h1 of each channel and determining the distribution range of the maximum h1 values. The red dashed line in Figure 4 represents the h1 to be extracted.

Schematic diagram of the pulsation cycle of the 12 channels and extraction diagram of the h1 amplitude.
Main Wave (h1) Interpolation
The h1 data obtained from the original 4 × 3 array were interpolated to present the h1 pulsation characteristics of the pulse wave more meticulously as 12 points are not sufficient to accurately reflect the distribution range of the h1 values in the entire sensing area.
The specific interpolation process involved evenly dispersing nine points between each row and column of two consecutive sensing elements for the original 12 points. Each row contained 31 points along the four points in the direction of the radial artery (x-axis) after interpolation, whereas each column contained 21 points along the three points perpendicular to the radial artery vascular direction (y-axis). A total of 651 points were interpolated. The actual width of the sensor array perpendicular to the vascular axis was 7.5 mm. The distance between two consecutive points was 7.5 mm/20 = 0.375 mm (Figure 5).
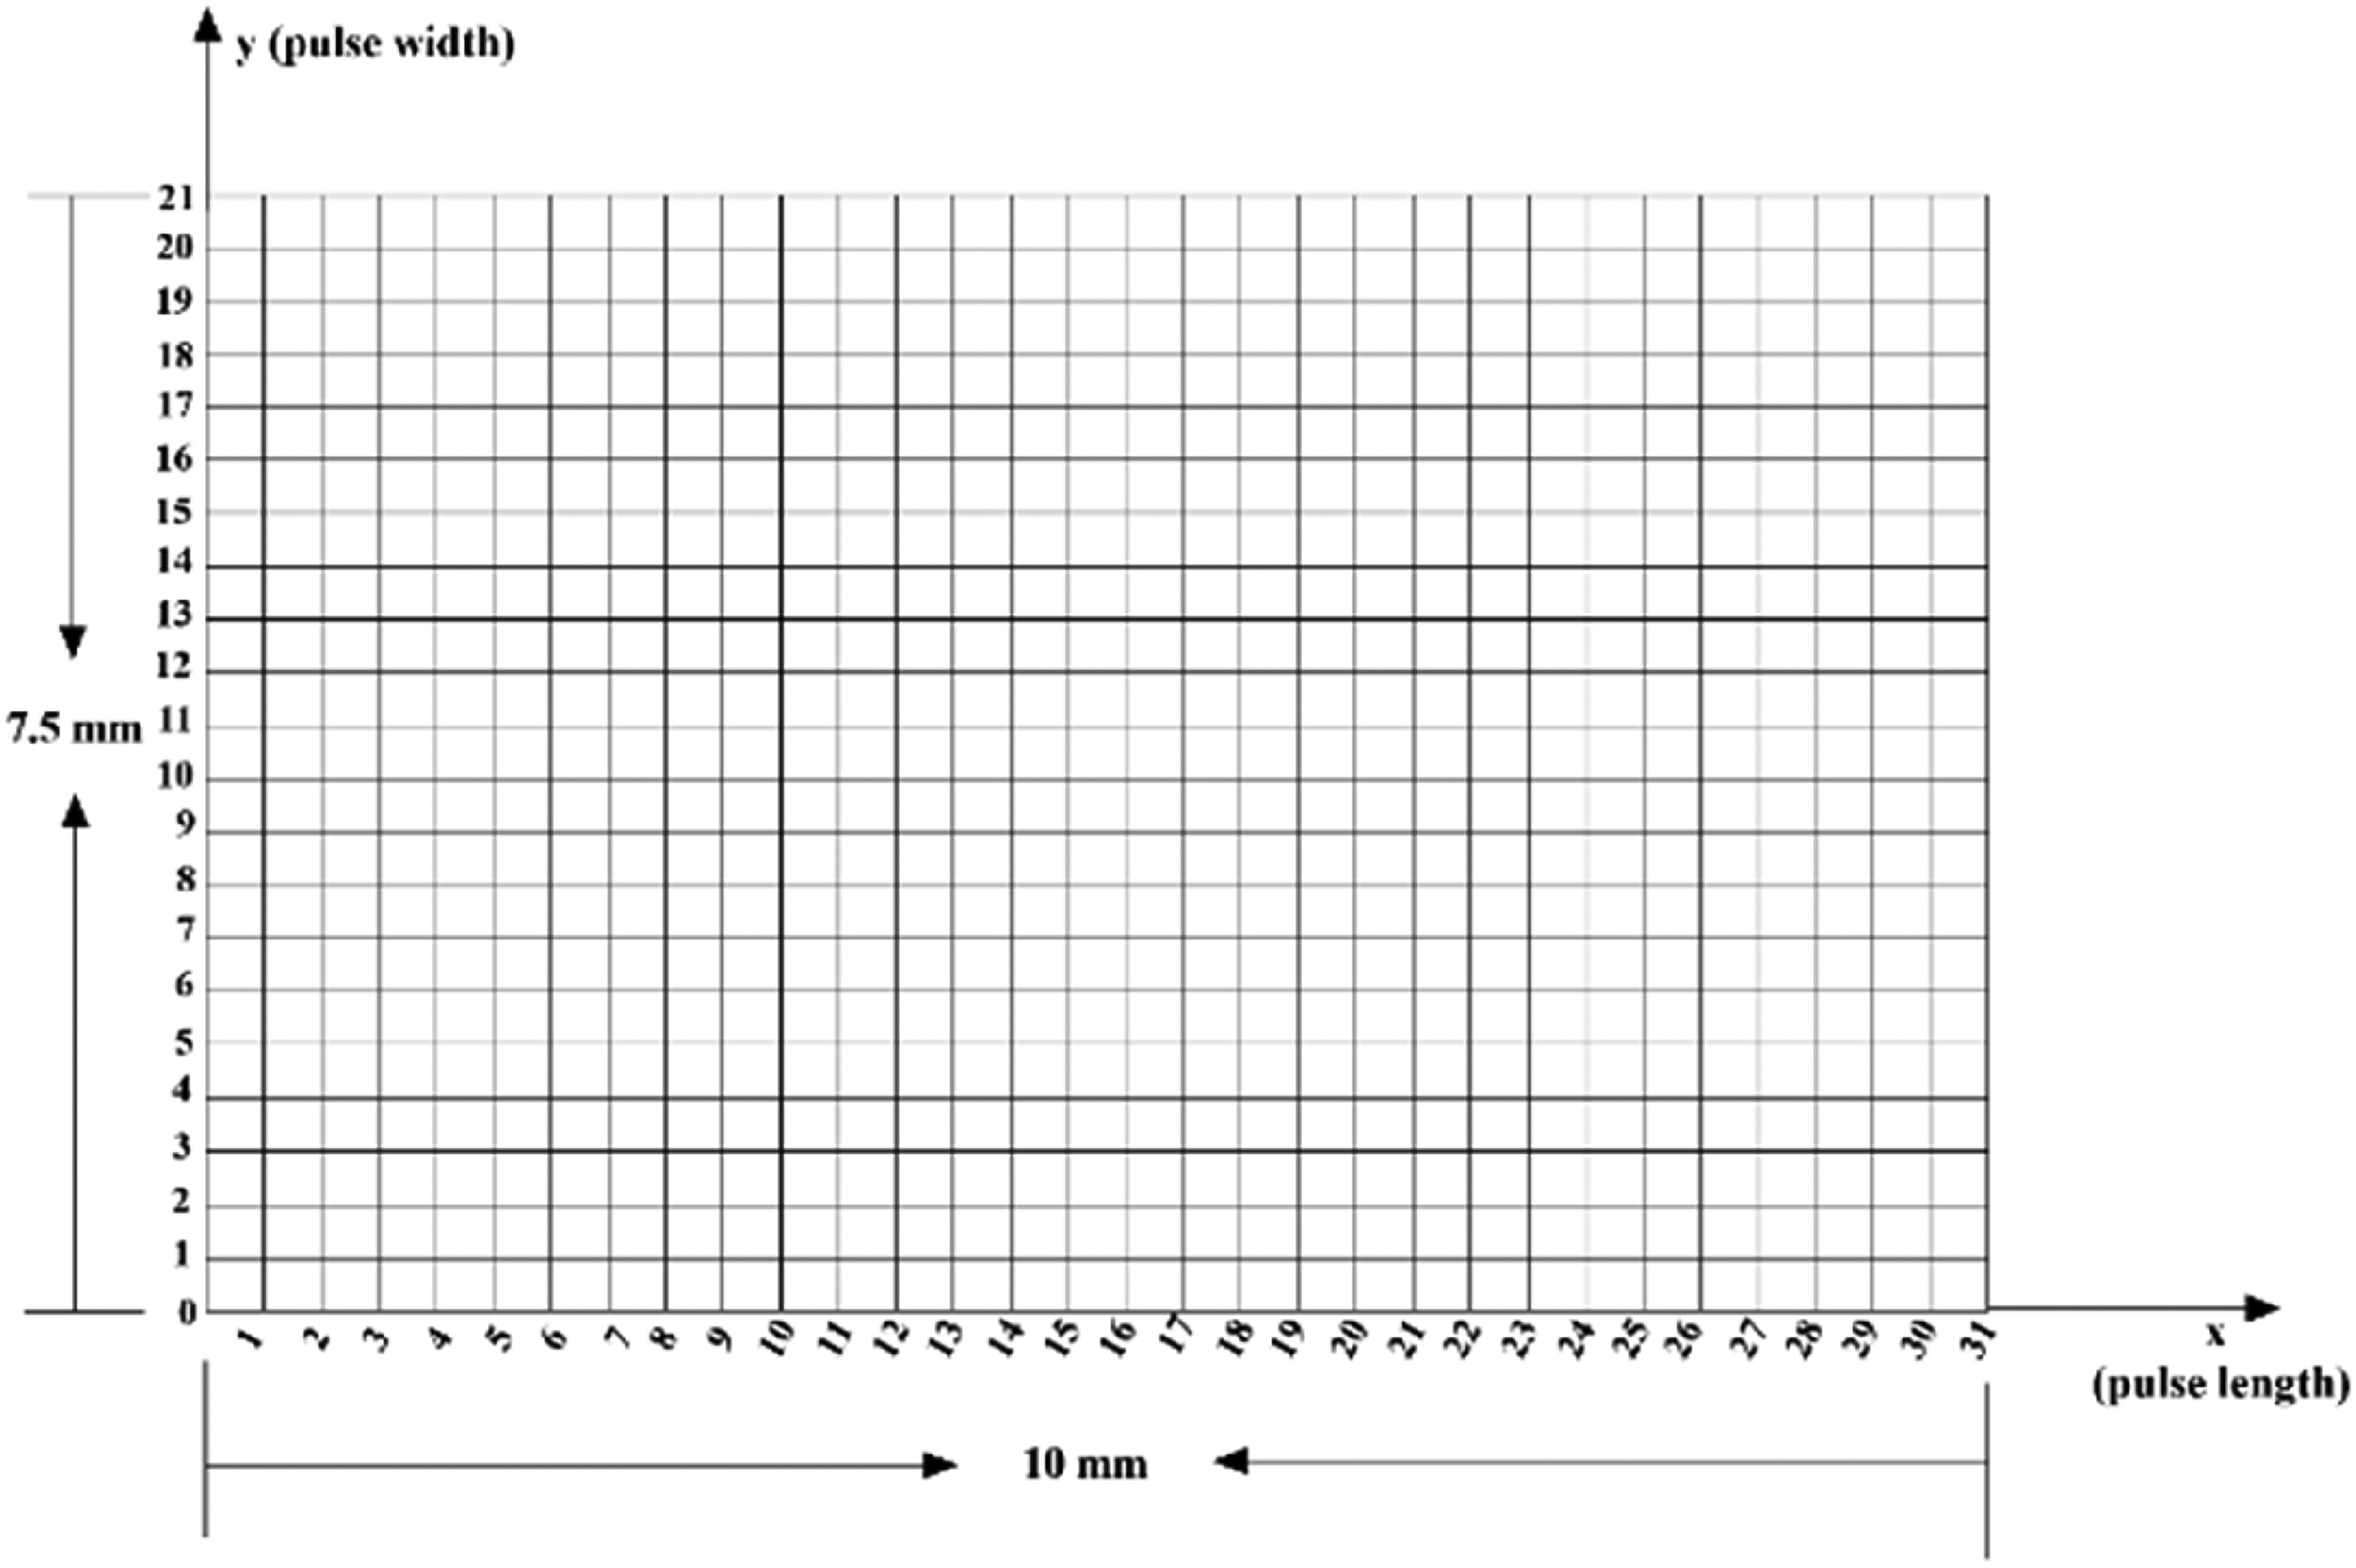
Matrix of the h1 of the 12 channels after interpolation.
Pulse Width Calculation
Each point in the two-dimensional matrix corresponded to an h1 value after interpolation. Figure 6A shows a heatmap of the distribution of the h1 values after interpolation, wherein different colors represent different h1 values. The colors of the higher h1 values were closer to red, whereas the colors of lower h1 values were closer to magenta. The maximum h1 area represented the strongest pulse strength, and the specific pulse width was obtained by calculating the number of sites along the longitudinal axis (y-axis) of the maximum h1 area. The maximum h1 exceeds 1400 in Figure 6A, and eight sites (seven squares) are present along the longitudinal axis (y-axis) in the area. The calculated pulse width is 0.375 mm × 7 = 2.625 mm. Figure 6B depicts a three-dimensional pulse diagram fitted with the principal h1 values, with the area in blue to yellow indicating increasing principal h1.

(A) The h1 heatmap after interpolation. (B) The three-dimensional pulse diagram of h1 amplitude values after preprocessing and interpolation.
Calculations for Wide Pulse, Thready Pulse, and Normal Pulse
A relatively objective reference standard has not been established for pulse width. Pulse sensation perceived by physicians and radial artery color Doppler ultrasound results in the guan position were used as reference standards in this study. The data in Figure 7A-C were obtained from a healthy male volunteer aged 50 years with a body mass index (BMI) of 24.800 and blood pressure of 120/80 mm Hg. We first perceived a wide pulse using pulse-taking. The heatmap results show that the maximum h1 was >1400. The maximum h1 area (red area) accounted for 12 sites along the longitudinal axis (y-axis), with a spacing of 11. The calculated pulse width was 0.375 × 11 = 4.125 mm. The three-dimensional pulse diagram results showed that h1 was higher overall and the pulse strength was stronger. Color Doppler ultrasonography at the guan position of the cunkou site of the radial artery revealed that the vessel diameter was 2.800 mm (Figure 7C).
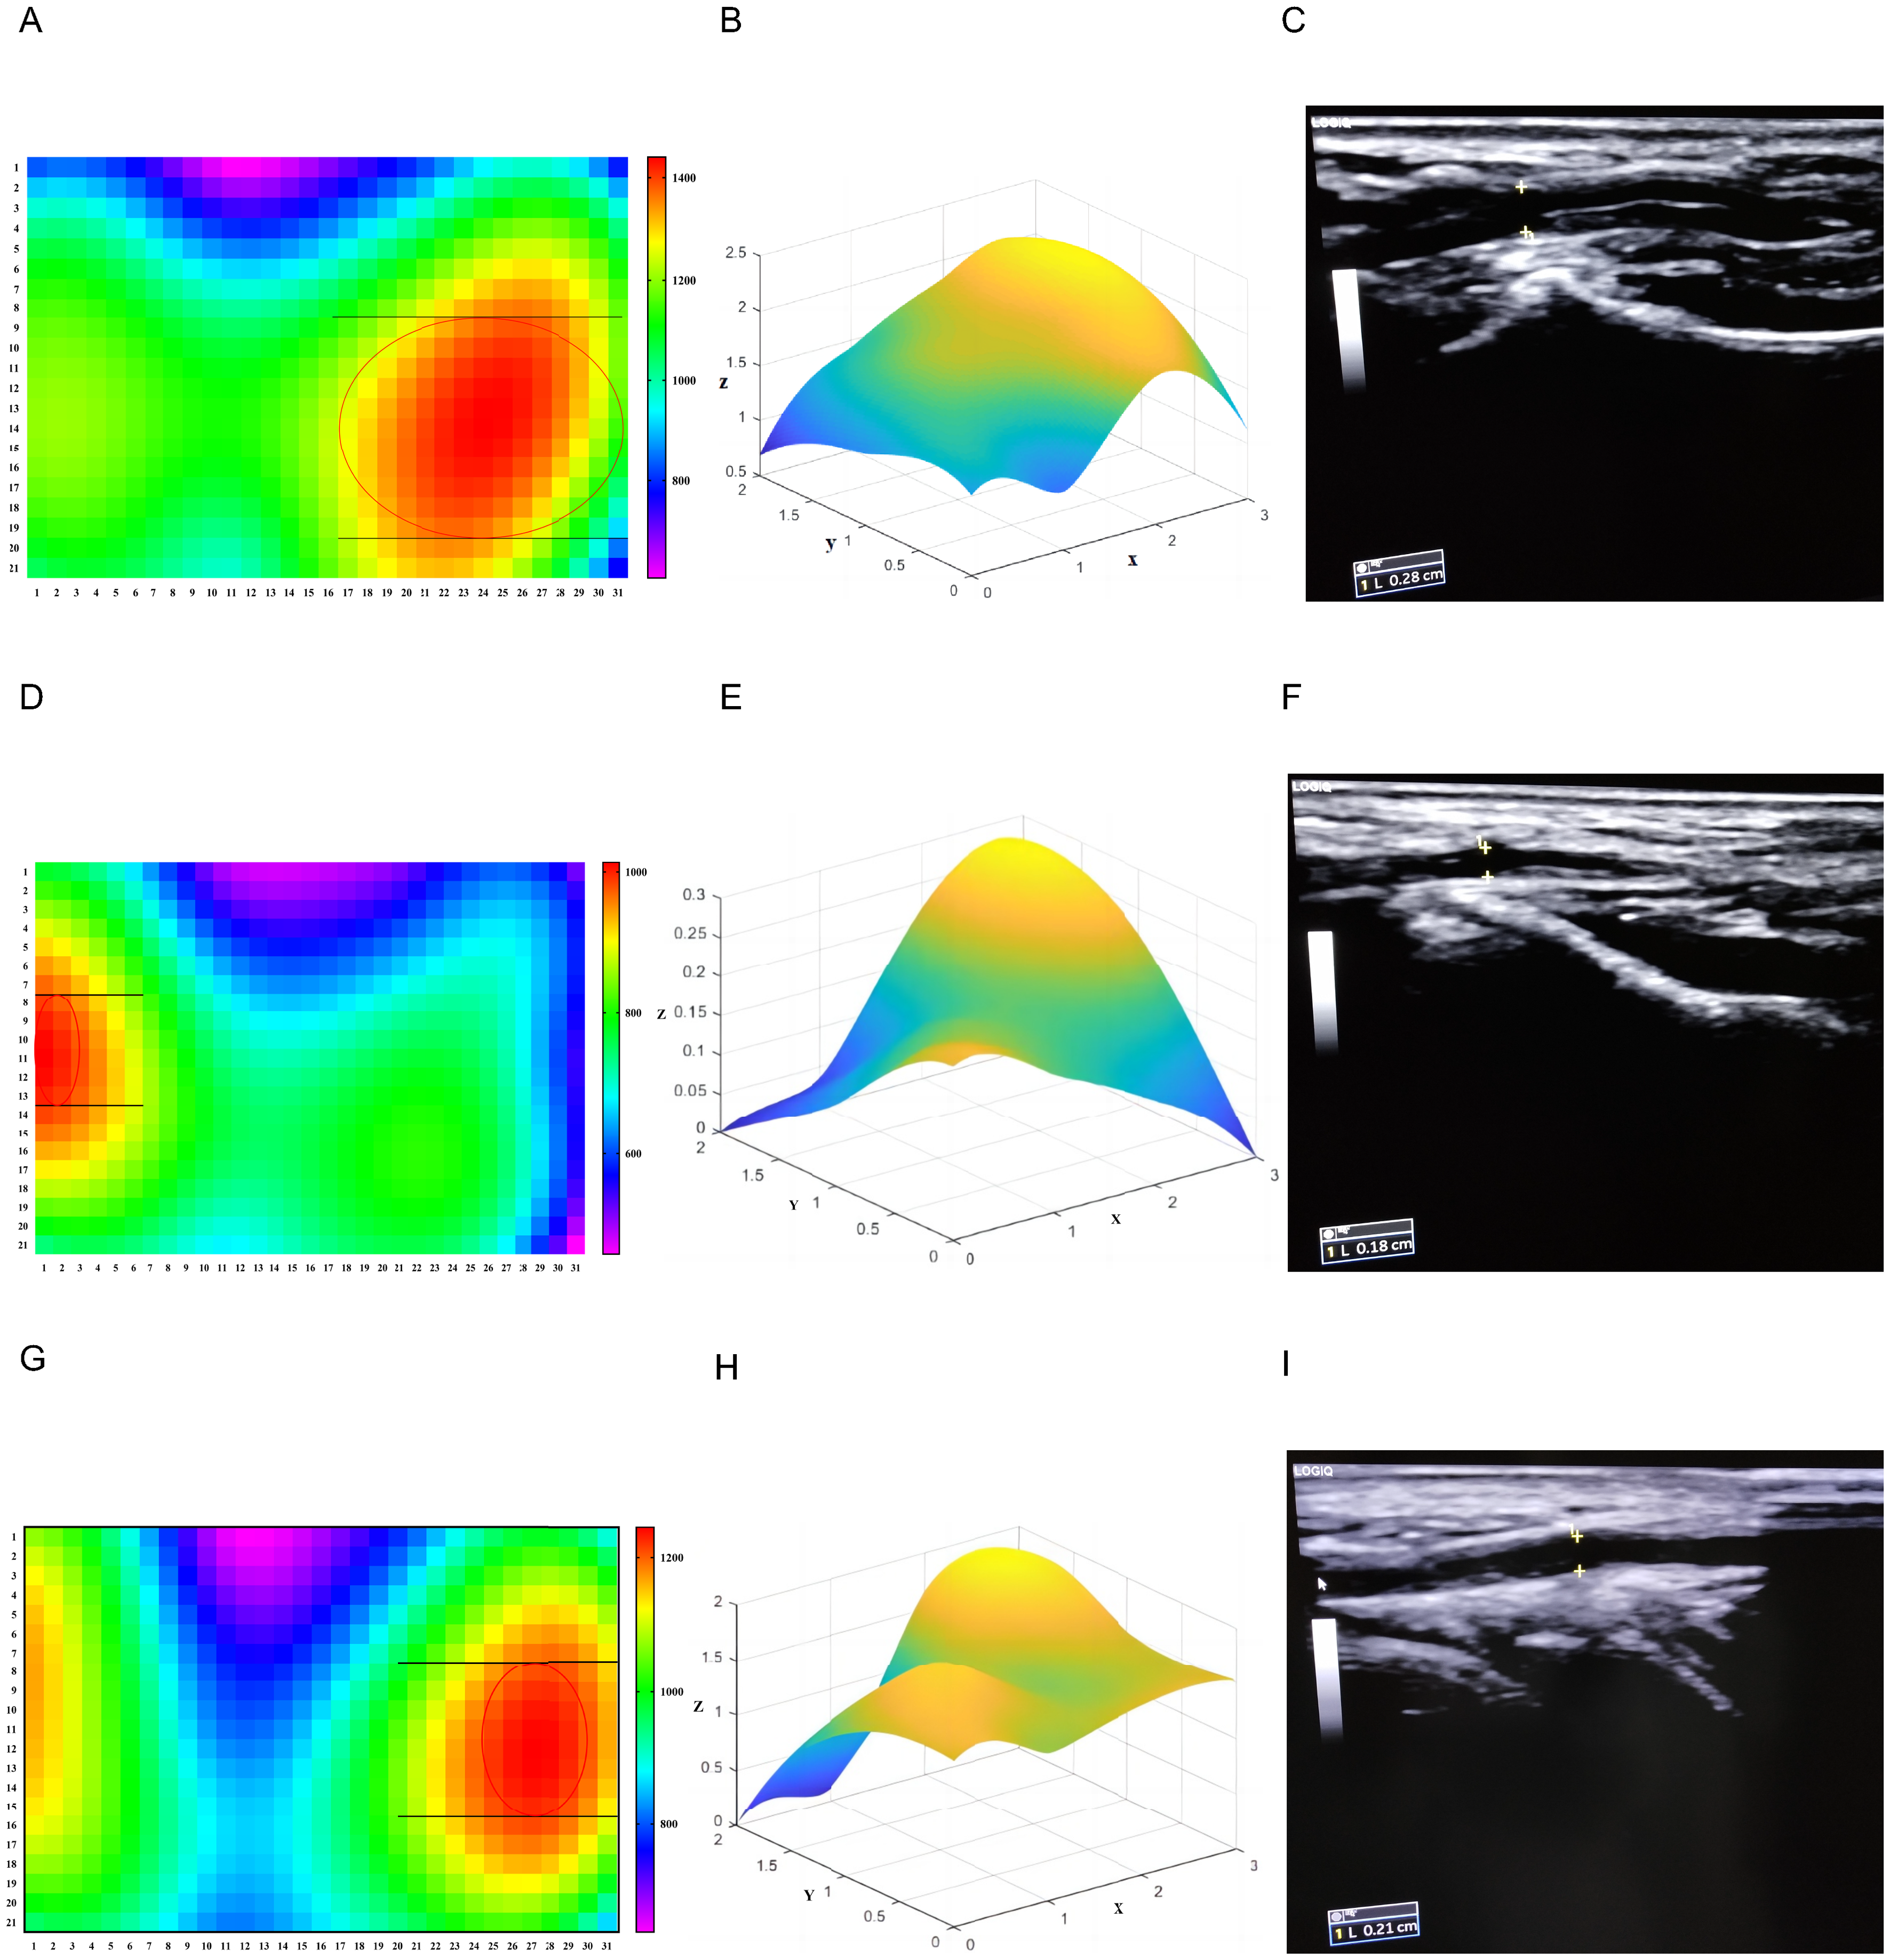
(A)-(C) Wide pulse. (A) Heatmap of h1 after interpolation. (B) Three-dimensional pulse diagram of h1 after preprocessing and interpolation. (C) The inner diameter of the radial artery at guan position of cunkou site was measured by color ultrasound. (D)-(F) Thready pulse. (D) Heatmap distribution of h1 after interpolation. (E) Three-dimensional pulse diagram of h1 after preprocessing and interpolation. (F) The inner diameter of the radial artery at guan position of cunkou site was measured by color ultrasound. (G)-(I) Normal pulse. (G) heatmap distribution of h1 after interpolation. (H) three-dimensional pulse diagram of h1 after preprocessing and interpolation. (I) The inner diameter of the radial artery at guan position of cunkou site was measured by color ultrasound. <Note: CE: Please check the figure caption 7 and set as per style.>
The data presented in Figures 7D-F were derived from a healthy female volunteer aged 30 years, with a BMI of 19.050 and a blood pressure of 100/60 mm Hg. Pulse-taking revealed that the pulse was thready. Figure 7D shows that the maximum h1 was > 1000 and that the maximal h1 area (red area) occupied seven sites along the longitudinal axis (y-axis) with a space of 6. The calculated pulse width was 0.375 mm*6 = 2.250 mm. The results of the three-dimensional pulse diagram of h1 revealed that the h1 of each point was relatively clear; however, the overall amplitude was lower than that of the wide pulse, and the pulse strength was weak. Color Doppler ultrasonography at the guan position of cunkou site of the radial artery revealed a vessel diameter of 1.800 mm (Figure 7F).
The data presented in Figure 7G-I were derived from a healthy male volunteer aged 32 years with a BMI of 23.100 and a blood pressure of 122/83 mm Hg. Pulse-taking revealed that the pulse was normal. As shown in Figure 7G, the maximum h1 was >1200, which was between the values for wide and thready pulse. The maximal h1 area (red area) occupied nine sites along the longitudinal axis (y-axis) with a space of 8, and the calculated pulse width was 0.375 mm × 8 = 3.000 mm. The three-dimensional pulse diagram of the h1 results shows that the overall pulse potential was between those of the wide and thready pulse. Color Doppler ultrasonography at the guan position of the cunkou site of the radial artery revealed that the vessel diameter was 2.100 mm (Figure 7I). Table 1 presents the specific comparison results for the three pulse shapes.
Comparison of Wide Pulse, Thready Pulse, and Normal Pulse.

Abbreviation: BMI, body mass index.
Table 1 presents the results of the comparison of the three pulse conditions.
Characteristics of the Pulse Width and Pulse Potential in the High Blood Pressure Population
Data were collected from 52 males aged 20–40 years who visited the Physical Examination Center of Shuguang Hospital between October 11, 2019, and December 20, 2019. Individuals with acute and chronic diseases were excluded. Twenty-six participants were hypertensive, whereas the remaining 26 participants were normotensive. The blood pressure grading criteria of the two groups were as follows: participants with systolic blood pressure (SBP) < 140 mm Hg and diastolic blood pressure (DBP) < 90 mm Hg were included in the normotensive group whereas participants with SBP ≥ 140 mm Hg and/or DBP ≥ 90 mm Hg were included in the high blood pressure group. Table 2 presents the basic information on the two groups. The SBP, DBP, and BMI in the high blood pressure group were higher than those in the normotensive group (P < .05 and P < .001, respectively).
Basic Information, Maximal h1, and Pulse Width of the Two Groups (n = 26).

Group 1, normotensive group; Group 2, high blood pressure group; BMI, body mass index; SBP, systolic blood pressure; DBP, diastolic blood pressure; HR, heart rate. Data are presented mean ± SD. P-values for the independent sample T-test. *P < .05, **P < .01, ***P < .001.
Comparison between the maximum h1 amplitude, strongest pulse strength, and pulse width of the normotensive and high blood pressure groups revealed that the results were comparable between the two groups. The maximum h1 in the high blood pressure group was higher than that in the normotensive group (P < .01). Similarly, the pulse width in the high blood pressure group was greater than that in the normotensive group (P < .05) (Table 2 and Figure 8).
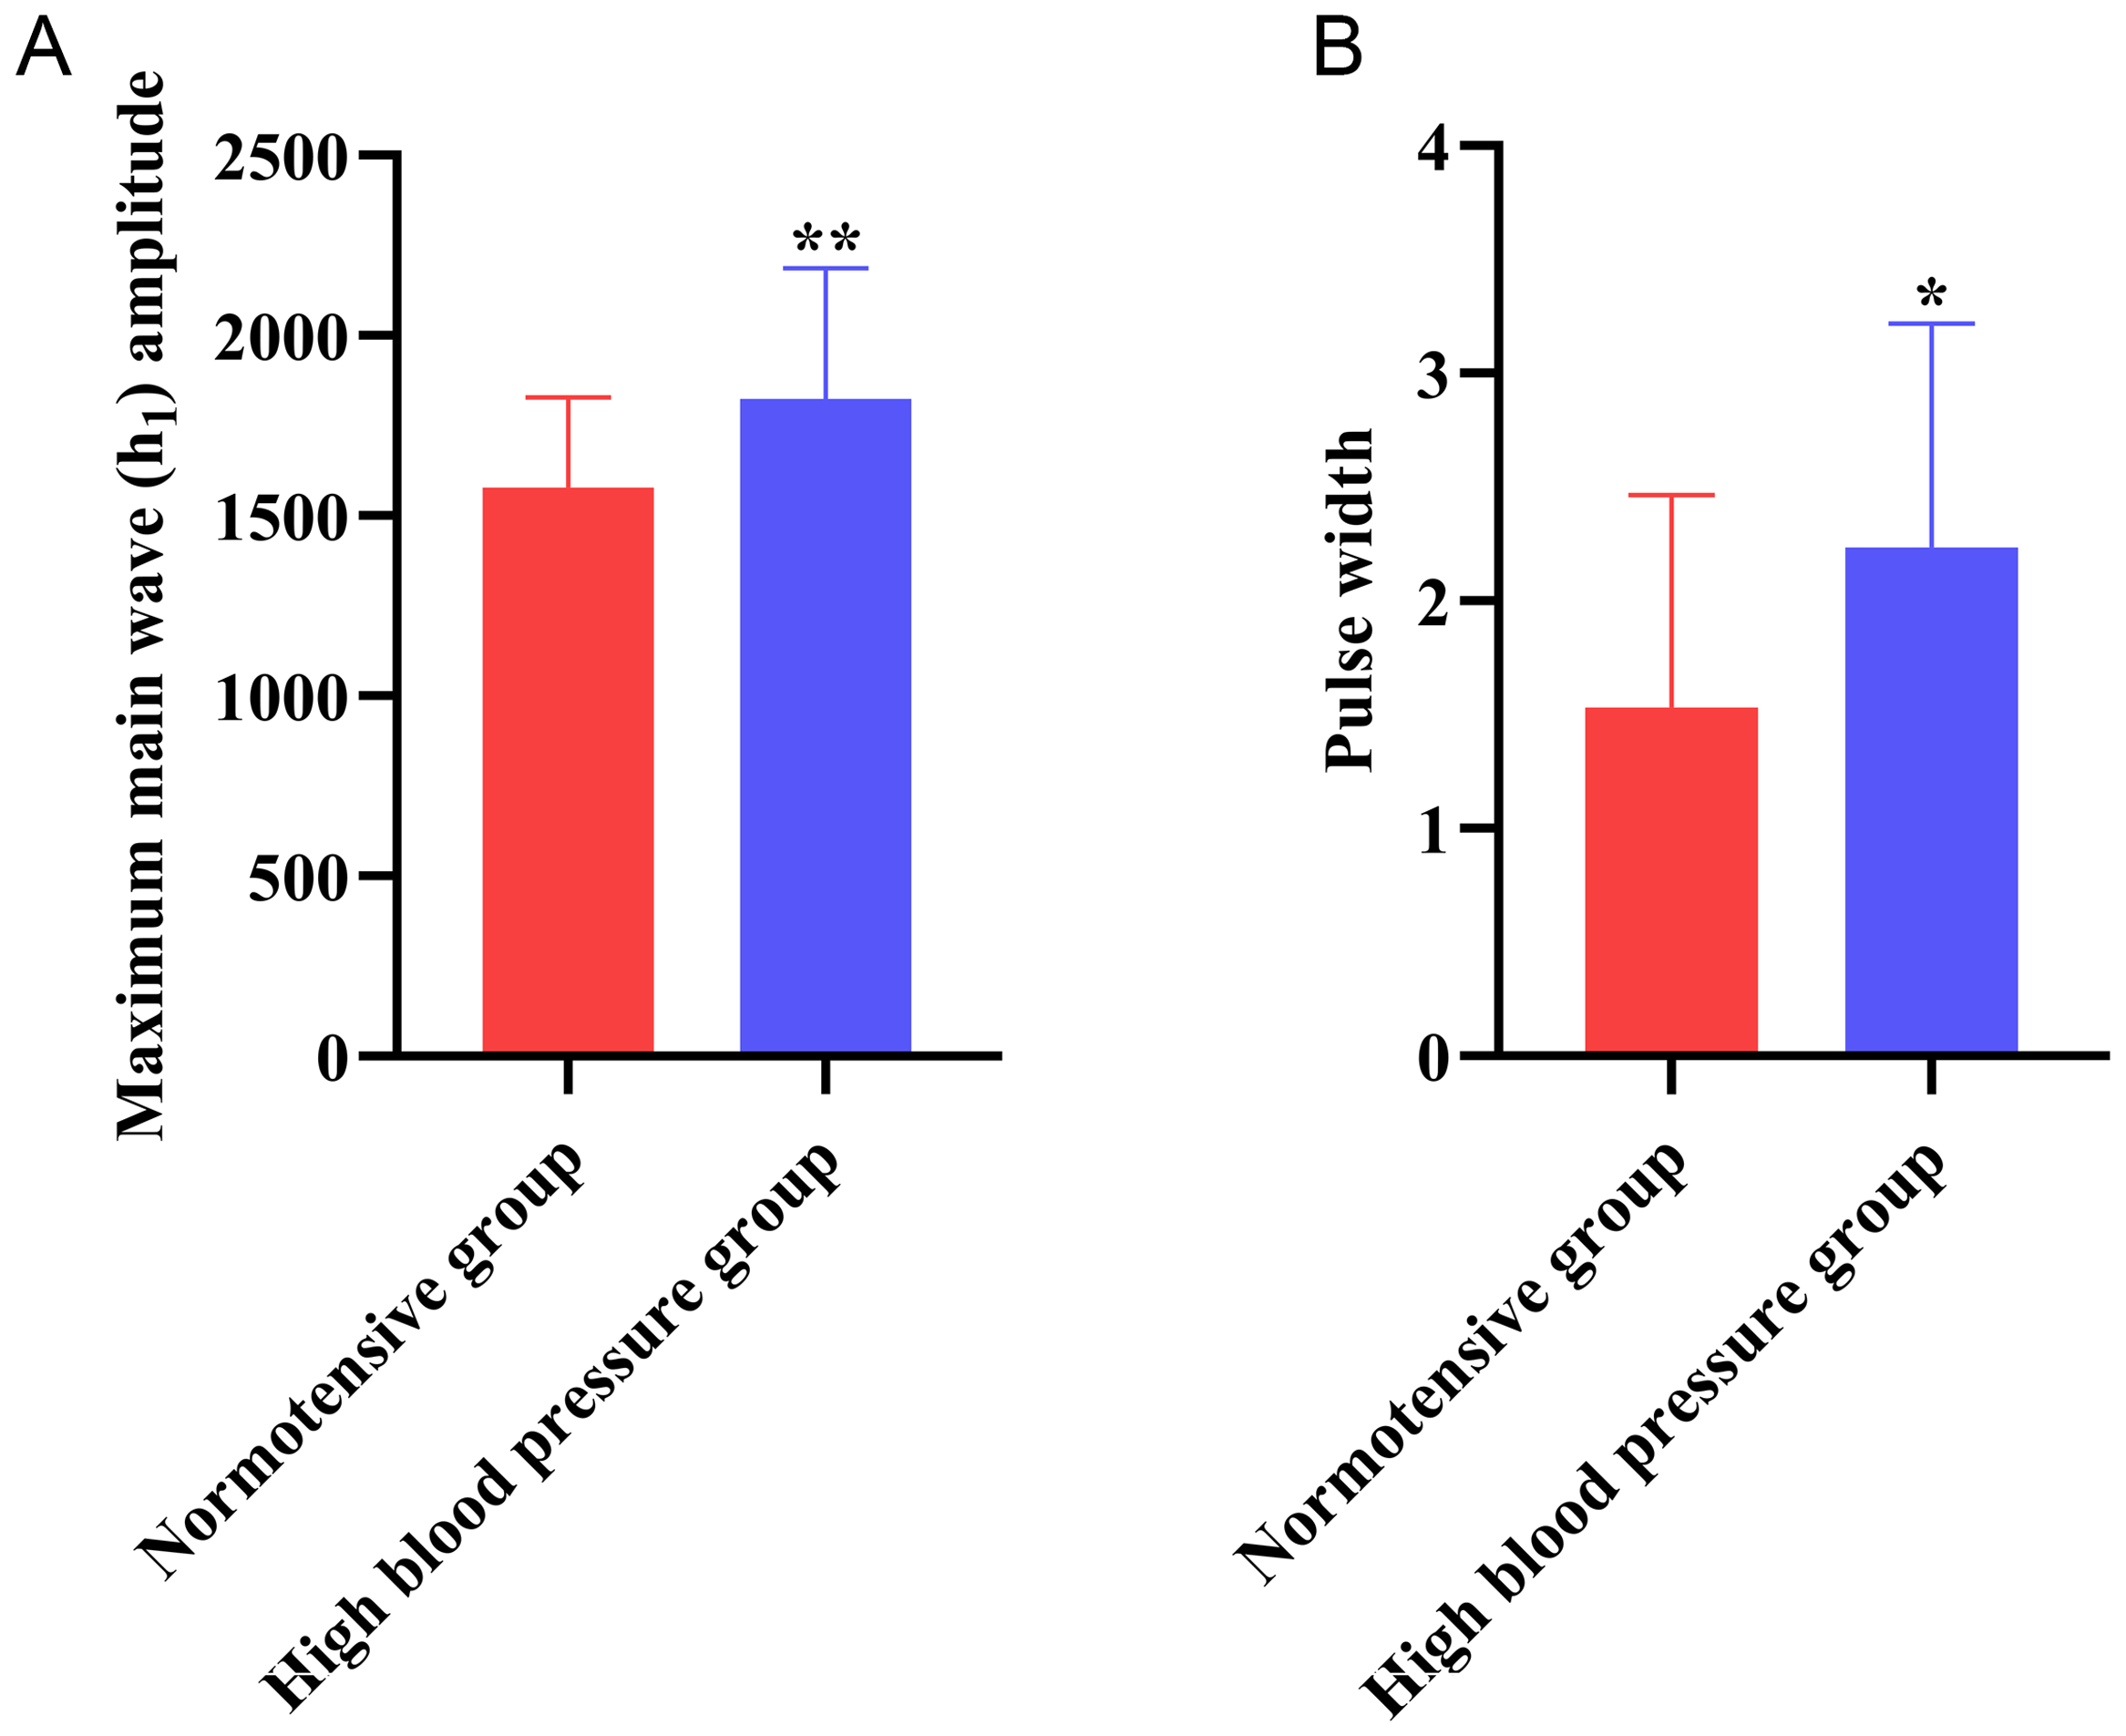
Comparison results of the maximal h1 (A) and pulse width (B) between the two groups.
Discussion
The pulse shape is the steric sensation of the pulse under the finger pulp, whereas the pulse width is the radial length of the pulse. It is associated with blood viscosity, blood vessel elasticity, and tension, in addition to various physical quantities. The methods for measuring the pulse width have been limited in pulse-taking digitization owing to limitations in the collection equipment and the absence of breakthrough methods for realizing pulse-width data. A PPS array acquisition device was used to acquire the multichannel pulse waves simultaneously in this study. The device had a transverse length of 7.5 mm along the blood vessel and could detect pulse waves at different points in the transverse region of the blood vessel. The normal pulse width is approximately 2.7 mm. 3 Based on the pulse-taking theory of TCM, the maximum h1 amplitude was considered as a breakthrough in pulse width digitization in this study. Biharmonic spline interpolation was used to compensate for transverse factors, wherein only three sensing units cause the problem of inaccurate pulse width measurements. This interpolation method can better fit h1 between two consecutive points and is more consistent with the morphological characteristics of the pulse wave. h1 at different points after interpolation was visualized using a heatmap, and the pulse widths of the participants were measured using the area of the highest h1.
The pulse width refers to the width of the pulse shape during pulse acquisition. Wide pulse and thready pulse represent different syndromes and have different clinical significances. The pulse width is considered less significant in clinical practice, and more attention is given to the fluency and tension of the pulse. However, the physiological and pathological significance of the pulse width cannot be ignored. Determining the pulse width according to a patient's status often aids in the determining the diagnosis and prognosis of the disease. The pulse width was perceived under the finger via pulse-taking in the present study. A radial artery color Doppler ultrasound diagnostic apparatus was used to measure the vessel diameter. Comparison of the pulse widths reflected by the highest h1 region with those obtained using the two methods mentioned above revealed that although the pulse width method of measuring a wide pulse, thready pulse, and normal pulse using h1 is different from these two methods, it can be used as a reliable clinical reference value. The pulse width measured during pulse acquisition reflect the strength range of the pulse wave. The inner diameter of the blood vessel measured using color Doppler ultrasound was used as the reference standard in the present study; however, the two parameters are not equivalent. The former corresponds to the strength of the pulse wave, whereas the latter corresponds to the shape of the blood vessel, which are essentially different. There is no objective reference standard for determining the pulse width in TCM; therefore, the pulse width perceived under the finger pulp was used as the subjective reference standard. h1 is the highest peak in a pulsation cycle and the pulse wave strength is the strongest. However, a minimum pulse-wave strength threshold that the finger pulp can perceive that is, finger-sensing threshold, is present. The finger-sensing threshold varies among individuals. 3 A pulse wave signal below the lowest threshold can be detected using instruments; however, it cannot be perceived by the finger pulp. Therefore, the area of the highest h1 was considered to reflect the range of pulse wave strengths that the finger pulp can perceive, which can also be used to calculate the actual pulse width. Unprocessed raw pulse wave data was used as the heatmap in the present study, and a three-dimensional pulse diagram was constructed by fitting the acquired raw pulse wave data after filtering and standardization. An obvious baseline drift was present in the original pulse wave; therefore, the pulse wave characteristic inflection point of each channel were clearer after filtering and standardization, and the occurrence of other frequency interference waves was also suppressed. In addition, the filtered pulse waves were standardized to aid in the construction of a better three-dimensional pulse diagram that reflects the pulse-beating effect of different parts of the pulse tube simultaneously to better reflect the characteristics of the pulse.
Age is an important factor affecting the pulse. The pulse progresses from normal, normal-slippery, thin-slippery, slippery, thin-wiry, taut-slippery, and wiry as healthy adults age. 20 The appearance of the taut-slippery pulse indicates hemodynamic changes, increased peripheral resistance, decreased stroke volume, and decreased vascular compliance. 21 Arterial compliance (AC) of school-age children gradually increases with age, which may be related to the increase in the number of elastic fibers and a decrease in the number of collagen fibers. The rapid accumulation of elastic fibers occurs from two months after birth till puberty, at which point it reaches the highest level; thus, the vascular compliance is also high. 22 The half-life of elastic fibers is 40 years, that is, from the end of puberty to the age of 40 years. The elastic fibers of the blood vessels are in a relatively stable state at this age. “Qianjin Fang” states that the pulse is often weaker in women than that in men. The pulse of healthy men was slippery, whereas that of healthy women was wiry. The differences in pulse owing to sex decreases with age. 23 Blood pressure is the lateral pressure exerted by the blood on the vessel wall. The energy released during the contraction of the ventricular muscles is used as the kinetic energy to eject the blood and the lateral pressure exerted on the blood vessel wall. The pulse rate is dependent on the heart and is affected by vascular resistance and elasticity. The state of the blood vessels also affects blood pressure. Thus, the confounding factors in the data were controlled for in this study and the male participants were divided into the normal and high blood pressure groups. Comparison of the highest h1 and pulse width between the two groups revealed that these two indicators were higher in the high blood pressure group than those in the normal blood pressure group. This finding may be attributed to greater pressure on the blood vessel wall, stronger pulse wave strength, and wider pulse potential observed in the high blood pressure group.
A wide pulse and thready pulse indicate different syndromes and their clinical significance varies. A wide pulse is more dominant in individuals with the excess syndrome, whereas a thready pulse is dominant in individuals with the deficiency syndrome. The medical history of the patient and information regarding the pulse width aid in determining the diagnosis and prognosis of the disease. Previous studies have proposed techniques to obtain an increasing number of three-dimensional pulse waves24,25; however, the measurement of pulse width remains under researched. This study proposed a new method to measure the pulse width based on the h1 amplitude. The proposed method, which is based on the original pulse wave data, showed high performance and strong authenticity. Nevertheless, this study has some limitations. First, only limited data were available for analysis in this study as only one case each for wide, normal, and thready pulse were included in this study, leading to poor persuasion. Second, the number of spaces on Y-axis was counted manually, which increases the risk of error. In summary, this study provided a new method for measuring the pulse width based on h1, which needs to be verified using a large amount of data in the future.
Conclusions
This study developed a method to digitize pulse-width information. The maximum h1 amplitude, which is the area corresponding to the strongest finger sensation, was used to determine the specific value of the pulse width. The principle of this method is based on the theory of pulse-taking in TCM. The maximal h1 was used to determine the pulse width of wide, thready, and normal pulse, which corresponded to the results of color Doppler ultrasound. These results can be used as reference values. A comparative study of different blood pressure groups revealed that the maximal h1 of the high blood pressure group was higher and the pulse width was larger, which was consistent with the findings of clinical pulse-taking. These findings verified the credibility of the proposed method to a certain extent. Nevertheless, this study has certain limitations, and there are few data in the verification section. Further studies must include women, individuals of varying ages and individuals with different types of diseases to validate the findings of this study.
Footnotes
Acknowledgements
The authors acknowledge all the participants in this study and all Chinese medicine practitioners who contribute to the study but not in the list of authors.
Author Contributions
Zijuan Bi carried out the experiments, analysed data, and wrote the paper, Xinghua Yao and Xiaojuan Hu provided technical support; Sihan Wang, Mengchen Liang, Zhihui Zhou Performed data collection and organization; Jiatuo Xu, Ji Cui and Xiaojuan Hu designed the experiments and revised the paper. All authors have read and approved the final manuscript.
Declaration of Conflicting Interests
The authors declared no potential conflicts of interest with respect to the research, authorship, and/or publication of this article.
Ethical Approval
This study was approved by the Institutional Review Board of Shuguang Hospital affiliated with Shanghai University of TCM (No. 2018-626-55-01). A clear explanation of the objectives and goals of the study was provided to the participants. Written informed consent was obtained from all participants prior to inclusion in the study.
Funding
This work was supported by the National Natural Science Foundation of China (NSFC) (No. 81973750, 81904094), National Key Technology R&D program of the 13th Five-Year Plan (No. 2017YFC1703301) in China.