
Abstract
Endoplasmic reticulum (ER)–plasma membrane (PM) contact sites/junctions play important roles in cell physiology including signal transduction, ion and lipid transfer, and membrane dynamics. However, little is known about the dynamic regulation and functional roles of ER–PM junctions in neurons. Using a split green fluorescent protein-based membrane contact probe, we find that the density of ER–PM contact sites changes dynamically in the dendrites of hippocampal neurons undergoing long-term synaptic potentiation (LTP). We show that the Ca2±-sensing membrane tethering protein Extended Synaptotagmin 1 (E-Syt1) mediates the formation of ER–PM contact sites during LTP. We also show that E-Syt1 is required for neuronal activity-dependent surface expression of the α-amino-3-hydroxy-5-methyl-4-isoxazole propionic acid-type glutamate receptors. These findings implicate ER–PM junctions in the regulation of neurotransmitter receptor trafficking and synaptic plasticity.
Introduction
In neurons, the endoplasmic reticulum (ER) network extends from the cell body into the processes and forms membrane contacts with other organelles including the plasma membrane (PM) (Spacek and Harris, 1997; Wu et al., 2017). In addition to protein and lipid synthesis, the ER in axon and dendrites functions in Ca2± signaling to regulate synaptic transmission and plasticity (Holbro et al., 2009; Johenning et al., 2015; Lee et al., 2016; de Juan-Sanz et al., 2017). Although the ER is the most widely distributed organelle in neuronal cells, mechanisms for the formation and regulation of contacts between the ER and other organelles as well as the physiological roles of ER membrane contact sites in synaptic structure and function are largely unexplored.
Synaptic plasticity is the modulation of synaptic strength in response to changes in neural activity, which is a key feature of neurotransmission and the cellular correlate of learning and memory (Nabavi et al., 2014). The long-term synaptic potentiation (LTP) in excitatory synapses in the CA1 region of the hippocampus is a classic form of synaptic plasticity. It is initiated when glutamate released from the presynaptic terminal activates N-methyl-D-aspartate-type receptors (NMDAR) located in the postsynaptic membrane of dendritic spines of CA1 pyramidal neurons. Opening of NMDAR allows calcium influx into spines, which triggers signaling cascades to promote physical expansion of the postsynaptic structure to accommodate more receptors and surface expression and synaptic delivery of the AMPA-type receptors (AMPARs), resulting in long-term potentiation of AMPAR-mediated fast synaptic transmission (Herring and Nicoll, 2016). The molecular and cellular mechanisms underlying LTP induction and expression involve signal transduction, actin cytoskeleton reorganization, vesicle trafficking, and membrane remodeling (Yasuda, 2017; Hiester et al., 2018; Yang and Liu, 2022). Notably, electron microscopy studies revealed that membrane depolarization causes reversible decrease in ER–PM contact areas in hippocampal neuronal soma (Tao-Cheng, 2018). Junctophilin 3 and 4, tethering proteins for the ER–PM junctions, are required for the integrity of a tripartite complex of the ER-localized ryanodine receptor (RyR) and PM-localized voltage-gated calcium channel Cav1.3 and calcium-activated potassium channel KCa3.1, and regulate the excitability of hippocampal CA1 pyramidal cells (Sahu et al., 2019). Whether and how ER–PM junctions contribute to the process of LTP remain to be determined.
In this study, we investigated the ER–PM junctions in dendrites of hippocampal neurons in resting and activated states. We show that they undergo activity-dependent dynamic changes which require cytosolic Ca2± and the membrane tethering protein Extended Synaptotagmin 1 (E-Syt1). Moreover, silencing of E-Syt1 expression also inhibits LTP stimuli-induced AMPAR surface expression. Collectively, these data implicate ER–PM contact sites in synaptic plasticity.
Results and Discussion
ER–PM Junctions in Dendrites Undergo Dynamic Reversible Changes During LTP Induction and Expression
The split fluorescent proteins have been engineered to visualize membrane contact sites (Cieri et al., 2018; Yang et al., 2018b; Vallese et al., 2020). When the complementary fragments of split green Fluorescent Protein/yellow fluorescent protein (YFP) localized at different organelle membranes come into proximity, they reassemble into a fluorescent complex (on-rates ranging from 25 to 70 M−1s−1 in in vitro reconstitution assays) (Koker et al., 2018) that can be imaged by fluorescence microscopy. To detect ER–PM contact sites in hippocampal neurons in dissociated culture, we transfected cells with construct expressing the split GFP/YFP-based contact site sensor SPLICSs-P2AER−PM, the fluorescent signals of which indicate interorganellar interactions over a range of ≈ 8 to 10 nm (Vallese et al., 2020). To verify that the fluorescent puncta in neurons indicate bona fide membrane contacts, we replaced the ER targeting signal for the β11 strand of YFP with a trans-Golgi network (TGN) targeting sequence to generate SPLICSs-P2ATGN−PM as control. Similar to the SPLICSs-P2AER−MT probe for ER-mitochondria membrane contacts (Vallese et al., 2020), SPLICSs-P2AER−PM fluoresced as distinct puncta in both the somatodendritic and axonal compartments of hippocampal neurons, while no fluorescent signal was detected in cells transfected with SPLICSs-P2ATGN−PM (Figure 1A), demonstrating that the fluorescent signals in neurons expressing SPLICSs-P2AER−MT or SPLICSs-P2AER−PM were not artifacts caused by nonspecific reconstitution of the YFP1–10 and the β11 strand moieties. These observations together indicate that the ER–PM contact sites in neurons can be detected and visualized with the SPLICSs-P2AER−PM sensor.

The ER–PM contact sites in dendrites of hippocampal neurons undergo dynamic changes during LTP induction and expression. (A) Mouse hippocampal neurons were co-transfected with constructs expressing mCherry and SPLICSs-P2AER−MT, SPLICSs-P2AER−PM, or SPLICSs-P2ATGN−PM on DIV12, fixed and counterstained with the nuclear dye DAPI (blue) on DIV16, and imaged by confocal microscopy. Shown are representative images. Bars, 5 μm. (B) Experimental protocol of LTP induction and expression. LTP was chemically induced by incubating cultured neurons with glycine (Gly, 200 μM) for 5 min, followed by glycine washout and LTP expression for up to 30 min. (C) Mouse hippocampal neurons were co-transfected with constructs expressing mCherry and SPLICSs-P2AER−PM on DIV12, treated with glycine to induce LTP on DIV16 and fixed at indicated time points shown in (B), and imaged by confocal microscopy. Shown are representative images of dendrites. (D) Quantification of SPLICSs-P2AER−PM signals (MCS) in (C). Data represent mean ± SEM (n = 10–12), **p < .01, ***p < .001. Bar, 5 μm. (E) Mouse hippocampal neurons were transiently transfected with construct expressing EGFP (as negative control) or SPLICSs-P2AER−PM on DIV12, and imaged live by TIRF microscopy on DIV15-16 before and during LTP induction. Shown are representative images (left) and normalized kinetics of changes in fluorescence intensity (right) of EGFP (n = 3) and SPLICSs-P2AER−PM with (n = 4) or without (n = 3) BAPTA-AM treatment before and after glycine application. Bars, 1 μm. DAPI: 4′,6-diamidino-2-phenylindole; EGFP: enhanced green fluorescent protein; ER: endoplasmic reticulum; LTP: long-term synaptic potentiation; MCS: membrane contact sites; ns: not significant; PM: plasma membrane; TIRF: total internal reflection fluorescence.
Of note, although the complementation of GFP1–10 and β11 fragments in vitro is irreversible (Kent and Boxer, 2011), recent imaging studies observed formation, disappearance, and movement of split GFP signals in live cells (Yang et al., 2018b; Vallese et al., 2020), indicating that the reassembly of the fluorophore is reversible and therefore can be used to detect dynamic changes of membrane contact sites. To compare ER–PM junctions in hippocampal neurons in resting and activated states, we chemically induced LTP (cLTP) with glycine, an NMDAR coagonist (Park et al., 2006b; Fortin et al., 2010), and captured fluorescent images of cells during LTP induction and expression (Figure 1B) by confocal microscopy. LTP stimuli caused rapid increase in the number of SPLICSs-P2AER−PM fluorescent puncta in dendrites, followed by restoration to the resting-state levels during LTP expression (Figure 1C and D), indicating that the ER–PM junctions are regulated by neuronal activity.
To corroborate changes in dendritic ER–PM junctions during LTP, next we performed total internal reflection fluorescence (TIRF) microscopy-based live imaging of hippocampal neurons expressing SPLICSs-P2AER−PM. Consistently, glycine application caused rapid elevation in fluorescent signals of the probe close to the dendritic PM but not cytosolic enhanced green fluorescent protein (EGFP) (Movie 1 and Figure 1E), indicating an increase in ER–PM junctions upon LTP induction.
Elevation of Cytosolic Ca2+ is Required for Activity-Induced ER–PM Junctions
During LTP induction, NMDAR-mediated Ca2+ influx causes membrane depolarization to activate the L-type voltage-gated calcium channel (LTCC) located in the spine membrane, allowing entry of more Ca2+ to further activate the ER-resident RyR to release the ER Ca2+ store into the cytosol. This process of signal amplification, termed calcium-induced calcium release (CICR), causes elevation of cytosolic Ca2+ in dendritic shaft adjoining potentiated spines (Dittmer et al., 2017; Dittmer et al., 2019). We then determined whether the LTP-induced transient increase in dendritic ER–PM junctions is regulated by intracellular Ca2+ by treating neurons with the Ca2+ chelator 1,2- bis( o-Aminophenoxy)ethane-N,N,Nʹ,Nʹ-tetraacetic Acid Tetra(acetoxymethyl) Ester (BAPTA-AM). Indeed, preloading of hippocampal neurons with BAPTA-AM abolished the cLTP-induced increase in SPLICSs-P2AER−PM signals detected by both TIRF live imaging and confocal microscopy (Movie 1, Figure 1E, and Figure 2). Further, inhibition of NMDAR, LTCC and RyR with MK801, Nimodipine and Ryanodine, respectively, had the same effect (Figure 2). These data together demonstrate that NMDAR-mediated Ca2+ influx and CICR are required for activity-dependent formation of ER–PM junctions.
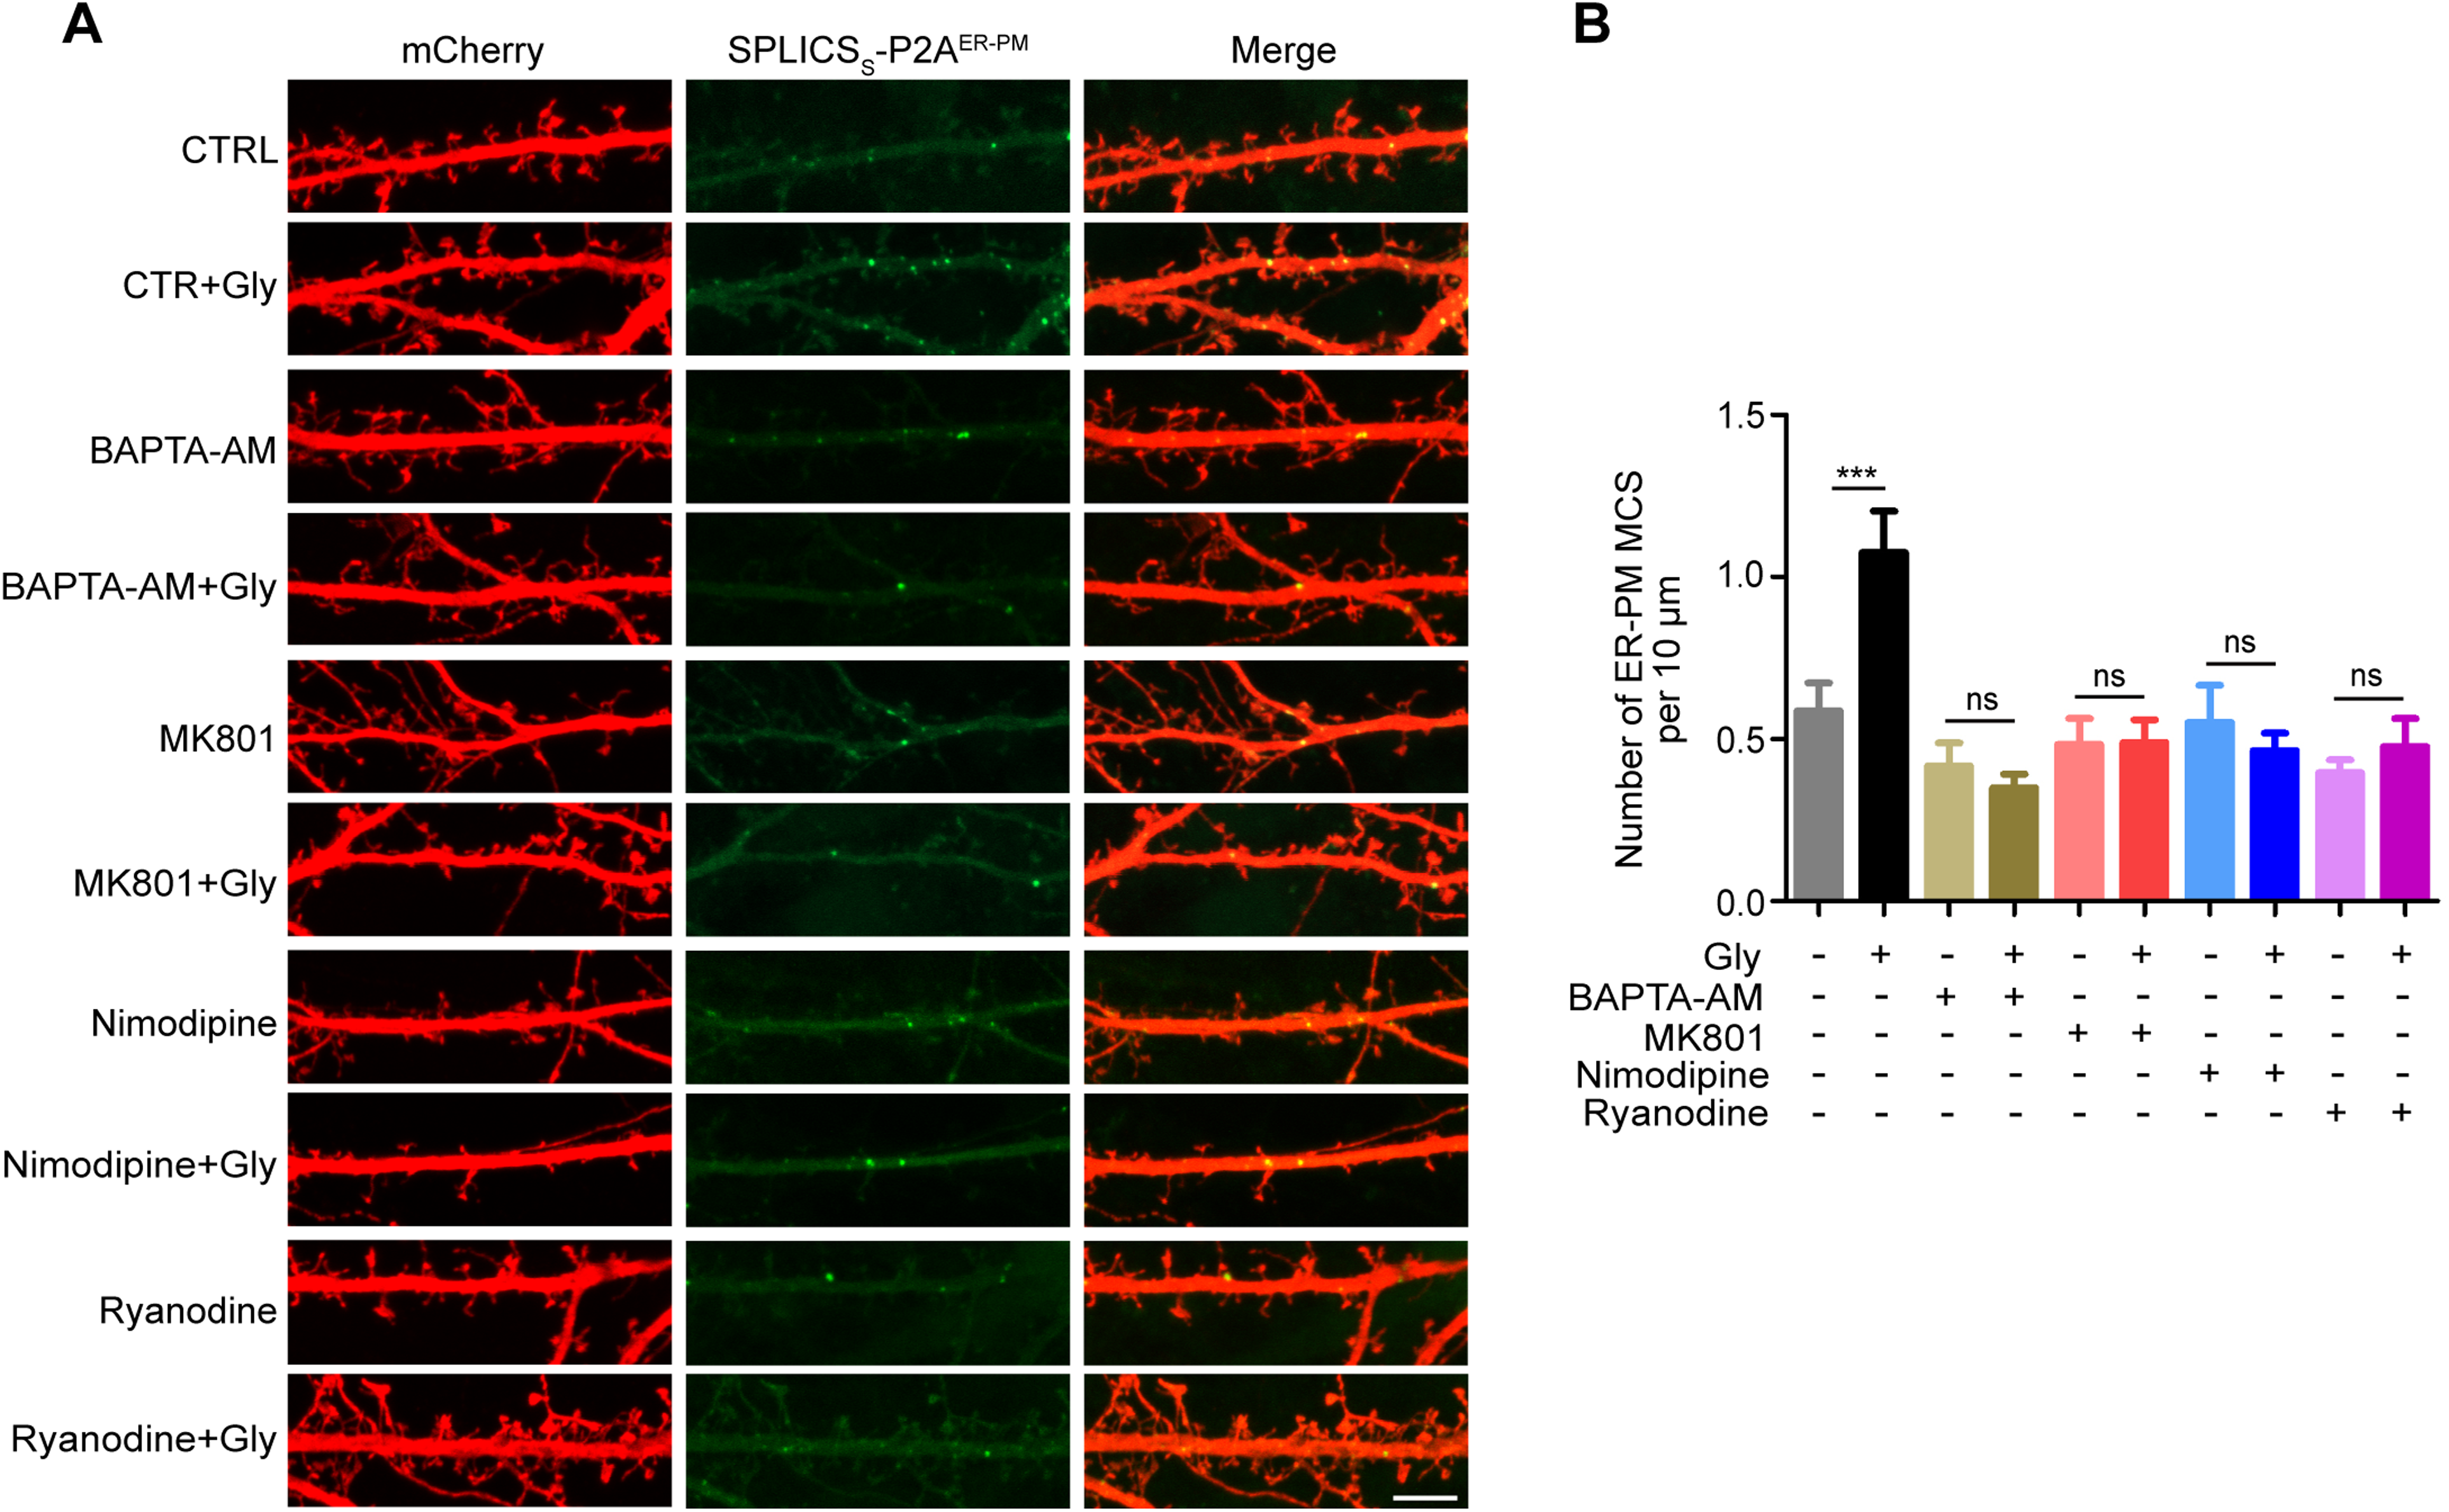
Elevation in cytosolic Ca2+ is required for activity-dependent increases in ER–PM contact sites. (A) Mouse hippocampal neurons were co-transfected with constructs expressing mCherry and SPLICSs-P2AER−PM on DIV12. On DIV16, neurons were pre-loaded with BAPTA-AM, or pretreated with MK801, Nimodipine or Ryanodine, then stimulated with glycine for 5 min, immunostained with anti-mCherry antibodies and imaged by confocal microscopy. Shown are representative images of dendrites. Bar, 5 μm. (B) Quantification of SPLICSs-P2AER−PM signals in (A). All data represent means ± SEM (n = 10–12), ***p < .001. ER: endoplasmic reticulum; ns: not significant; PM: plasma membrane.
E-Syt1 Mediates the Enhanced ER–PM Connection During LTP
Having established that neuronal activity-induced increase in ER–PM junctions is Ca2+ dependent, we speculated that Ca2+-sensing membrane tethering protein(s) are involved. The ER-localized E-Syt family members of tethering proteins interact with each other to form heteromeric complexes and mediate formation of ER–PM junctions (Giordano et al., 2013). In neurons, E-Syts function in axonal growth and synaptic transmission (Kikuma et al., 2017; Gallo et al., 2020; Nath et al., 2020). Among them, E-Syt1 enhances ER–PM connection by binding to the PM via its C2E domain in response to Ca2+ influx across the PM (Chang et al., 2013; Giordano et al., 2013; Idevall-Hagren et al., 2015), and functions in lipid homeostasis at the PM via its glycerophospholipid transferring SMP (synaptotagmin-like, mitochondrial-lipid-binding protein) domain (Saheki et al., 2016; Yu et al., 2016). To determine whether E-Syt1 regulates ER–PM junctions during LTP, first we monitored its distribution in dendrites by TIRF live imaging. LTP induction by glycine stimulation caused rapid increase in fluorescent signals of EGFP-E-Syt1 at the dendritic PM, which was inhibited by BAPTA-AM (Movie 2 and Figure 3A), indicating that E-Syt1 binds to the PM in response to activity-regulated cytosolic Ca2+.

E-Syt1 is required for activity-dependent formation of ER–PM contact sites. (A) Mouse hippocampal neurons were transfected with construct expressing EGFP-E-Syt1 on DIV12, and imaged live by TIRF microscopy on DIV15-16 before and during LTP induction. Shown are representative images (left) and normalized kinetics of changes in fluorescence intensity (right) of EGFP-E-Syt1 before and after glycine application, with (n = 4) or without (n = 3) BAPTA-AM treatment. (B) DIV6 mouse hippocampal neurons were co-transfected with constructs for EGFP-mouse E-Syt and scramble shRNA or mouse E-Syt-targeting shRNA co-expressing with mCherry for 72 h. Shown are representative confocal images. (C) Mouse hippocampal neurons were co-transfected with constructs for SPLICSs-P2AER−PM and scramble shRNA or E-Syt-targeting shRNA co-expressing with mCherry on DIV12, treated with glycine for 5 min to induce LTP on DIV16. Shown are representative confocal images of dendrites. (D) Quantification of ER–PM contact sites in (C). (E) Mouse hippocampal neurons were co-transfected with constructs expressing SPLICSs-P2AER−PM, scramble shRNA or E-Syt1-targeting shRNA and the Flag vector, or SPLICSs-P2AER−PM, E-Syt1-targeting shRNA and shRNA-resistant Flag-tagged human E-Syt1, C2Cx, ΔC2E or ΔSMP mutant on DIV12, treated with glycine for 5 min to induce LTP on DIV16, followed by immunostaining with anti-mCherry and anti-Flag antibodies. Shown are representative confocal images of dendrites. (F) Quantification of ER–PM contact sites in (E). All data represent means ± SEM (n = 11–14), *p < .05, **p < .01, ***p < .001. Bars, 1 μm in (A) and 5 μm in (B), (C) and (E). ER: endoplasmic reticulum; E-Syt1: Extended Synaptotagmin 1; LTP: long-term synaptic potentiation; ns: not significant; PM: plasma membrane; TIRF: total internal reflection fluorescence.
Next we determined the impact of E-Syts on activity-dependent increase in ER–PM junctions. To this end, we generated constructs co-expressing mCherry (as cell fill) and E-Syt-targeting shRNA (Figure 3B showing knockdown efficiency). Suppressing expression of either E-Syt2 or E-Syt3, the E-Syt family members that lack Ca2+-sensing capacity, caused decrease in the density of dendritic ER–PM junctions in resting neurons (Figure 3C and D). In contrast, silencing E-Syt1 abolished activity-dependent formation of ER–PM junctions upon LTP induction (Figure 3C and D). Moreover, the LTP-induced formation of ER–PM junctions was rescued by expression of shRNA-resistant full-length E-Syt1 or its lipid-transfer deficient (ΔSMP) mutant (Saheki et al., 2016), but not the Ca2+-binding deficient (C2Cx) mutant or the PM-binding deficient (ΔC2E) mutant (Giordano et al., 2013; Idevall-Hagren et al., 2015; Bian et al., 2018) (Figure 3E and F), indicating that both its Ca2+-sensing and PM-binding functions are required for formation of ER–PM contact sites in response to cytosolic Ca2+. Collectively, these results indicate that E-Syt2 and E-Syt3 are required for the formation of ER–PM junctions in resting neurons, whereas E-Syt1 mediates the formation of new ER–PM contact sites during LTP induction.
E-Syt1 is Required for Activity-Induced AMPAR Surface Expression
Having established that E-Syt1 mediates ER–PM membrane tethering in neurons undergoing LTP, next we asked whether E-Syt1 functions in synaptic plasticity. To this end, we analyzed changes in surface expression of the GluA1 subunit of AMPAR after LTP induction. While silencing E-Syt expression did not affect surface GluA1 levels in resting neurons, depletion of E-Syt1 but not E-Syt2 or E-Syt3 abolished LTP-induced surface expression of GluA1 (Figure 4A and B). Moreover, activity-dependent AMPAR surface expression was rescued by expression of either the wild-type or lipid-transfer deficient mutant, but not the Ca2+-binding or PM-binding deficient mutant of E-Syt1 (Figure 4C and D). Together, these data indicate that the Ca2+-sensing tethering protein E-Syt1 is required for LTP, and implicate ER–PM junctions in synaptic plasticity.

E-Syt1 is required for activity-dependent surface expression of AMPARs. (A) Mouse hippocampal neurons were transfected with construct co-expressing mCherry and scramble shRNA or E-Syt-targeting shRNA on DIV12, treated with glycine for 5 min to induce LTP on DIV16, followed by immunostaining of surface GluA1 and mCherry. Shown are representative confocal images of dendrites. (B) Quantification of surface GluA1 at dendritic PM in (A). (C) Mouse hippocampal neurons were co-transfected with constructs expressing scramble shRNA or E-Syt1-targeting shRNA and EGFP, or E-Syt1-targeting shRNA and shRNA-resistant EGFP-E-Syt1, C2Cx, ΔC2E or ΔSMP mutant on DIV12, treated with glycine for 5 min to induce LTP on DIV16, followed by immunostaining of surface GluA1 and mCherry. Shown are representative confocal images of dendrites. (D) Quantification of surface GluA1 at dendritic PM in (C). All data represent means ± SEM (n = 11–15), **p < .01, ***p < .001. Bars, 5 μm. AMPAR: AMPA-type receptors; E-Syt1: Extended Synaptotagmin 1;LTP: long-term synaptic potentiation; ns: not significant; PM: plasma membrane.
In this study, we have found that E-Syts regulate ER–PM junctions in dendrites, and E-Syt1 in particular mediates their formation in response to Ca2+ in hippocampal neurons undergoing synaptic potentiation. We also demonstrate that E-Syt1 is required for activity-dependent AMPAR surface expression. These findings not only reveal a physiological role of E-Syts in mammalian central nervous system neurons, but also suggest that ER–PM junctions contribute to synaptic plasticity. Notably, the ΔSMP mutant of E-Syt1 could rescue LTP stimuli-induced ER–PM junctions and surface expression of AMPAR in neurons depleted of E-Syt1, indicating that its lipid transfer function at ER–PM contact sites is not involved in activity-dependent AMPAR trafficking. Membrane contact sites play various critical roles in cellular physiology including lipid exchange and metabolism, metabolic channeling, signaling, and membrane dynamics (Prinz et al., 2020). In excitable cells, specialized ER–PM junctions are vitally important for membrane polarization-induced Ca2±-signaling (Dixon and Trimmer, 2022). Given the dynamic nature of ER–PM contact sites, their structure, molecular composition, and mechanistic roles in synaptic plasticity await further investigation.
Materials and Methods
Constructs
SPLICSS-P2AER−PM and SPLICSS-P2AER−MT were gifts from Dr. Tito Cali (Addgene plasmid #164112, 164108) (Vallese et al., 2020), EGFP-E-Syt1 was a gift from Dr. Pietro De Camilli (Addgene plasmid #66830) (Giordano et al., 2013). The pAOV-CAMKIIα-mCherry-2A-3Flag construct for expressing mCherry in neurons as volume marker was purchased from OBiO Technology (Shanghai, China).
SPLICSS-P2ATGN−PM was constructed by replacing the ER targeting sequence for YFP β11 with the TGN targeting sequence of TGN38 (Hao et al., 2020) (aa 304–357: HFFAYLVTAAVLVAVLYIAYHNKRKIIAFALEGKRSKVTRRPKASDYQRLNLKL; DNA sequence: CACTTCTTTGCTTATCTGGTGACCGCTGCTGTTCTTGTTGCTGTCCTCTATATTGCTTACCACAACAAACGAAAGATTATTGCTTTTGCCCTGGAAGGAAAAAGATCCAAAGTCACTCGGAGGCCAAAGGCCAGTGACTACCAACGTTTGAACCTAAAGCTT) via homologous recombination.
To generate mouse E-Syt-targeting shRNA constructs, sense and antisense strands of each shRNA containing a 21 nt target sequence were annealed and inserted into pAKD-CMV-bGlobin-mCherry-H1-shRNA (modified from the vector provided by OBiO Technology, Shanghai, China) between the BglII and SalI sites. Target sequences for mouse E-Syt1: 5′- GATCCTGGTATCTCAGCACTC-3′; mouse E-Syt2: 5′-GCATTCAGCTCAAGTGAAACG-3′; mouse E-Syt3: 5′- GCATGATCATGGAGAACAAGA-3′; for scramble shRNA, which has no homology to known gene sequences: 5′-GAATGCTCTTACGATGATA-3′.
The expression constructs for mouse E-Syt1, E-Syt2, and E-Syt3 were generated by reverse transcription polymerase chain reaction amplification of the coding sequence for each E-Syt family member from mouse brain total RNA and insertion into pEGFP-C1. The construct for Flag-tagged human E-Syt1 was generated by cloning of E-Syt1 from the EGFP-E-Syt1 construct into pCMV-Tag2B via homologous recombination. The E-Syt1 C2Cx, ΔC2E and ΔSMP mutants were generated by site-directed mutagenesis using the corresponding wild-type human E-Syt1 construct as template. Primer sequences for C2Cx: 5’-GCTAGAGGTTGAAGTCTTTGCTAAGGCTTTGGACAAGGATG-3’ and 5’-TCATCCTTGTCCAAAGCCTTAGCAAAGACTTCAACCTCTAGC-3’ (D722A), and 5’-GGTTGAAGTCTTTGCTAAGGCTTTGGACAAGGATGATTTTCT-3’ and 5’-AGAAAATCATCCTTGTCCAAAGCCTTAGCAAAGACTTCAACC-3’ (D724A); for ΔC2E: 5’-ACAGCTCCTCATCGCTGAGTTAGCCGCGGGCCCGGGATCC-3’ and 5’-GGATCCCGGGCCCGCGGCTAACTCAGCGATGAGGAGCTGT-3’; for ΔSMP: 5’-TGGGTCAGCTTCCCAGACGTGCCTGACCTTCAAGATGTGGCT-3’ and 5’-AGCCACATCTTGAAGGTCAGGCACGTCTGGGAAGCTGACCCA-3’. All constructs were verified by DNA sequencing.
Antibodies and Reagents
Antibodies used in this study were: mouse anti-GluA1 (MAB2263, Millipore, Burlington, MA, USA), rabbit anti-red fluorescent protein (RFP) (PM005, MBL International, Tokyo, Japan) and mouse anti-Flag (DYKDDDDK) (MF085-02, Mei5 Biotechnology, Beijing, China). AlexaFluor dye (555, 647)-conjugated secondary antibodies for immunofluorescence staining were from Molecular Probes (Invitrogen, Carlsbad, CA, USA).
Chemicals used in this study were: 4′,6-diamidino-2-phenylindole (10236276001, Sigma-Aldrich, St. Louis, MO, USA), glycine (G7126, Sigma-Aldrich, St. Louis, MO, USA); BAPTA-AM (A1076, Sigma-Aldrich, St. Louis, MO, USA); MK801 (M107, Sigma-Aldrich, St. Louis, MO, USA); Nimodipine (N149, Sigma-Aldrich, St. Louis, MO, USA); and Ryanodine (R-500, alomone labs, Jerusalem, Israel).
Hippocampal Neuron Culture
Primary hippocampal neurons were cultured as previously described (Yang et al., 2018a). Briefly, mouse hippocampi were dissected from newborn C57BL/6J mice, dissociated with 0.25% trypsin in Hank's balanced salt solution without Ca2+ and Mg2+ at 37°C for 17 min, and triturated in Dulbecco's modified Eagle's medium containing 10% F12, and 10% fetal bovine serum (Gibco, Carlsbad, CA, USA). Hippocampal neurons were plated on poly-D-lysine-coated coverslips in 24-well plates or 4-well Nunc™ Lab-Tek™ chambered coverglass (Thermo Fisher Scientific, Waltham, MA, USA) at a density of 2.4–3.0 × 10⁴ cells/well in 24-well plate or 1.0–1.2 × 10⁵ cells/well in chambered coverglass. The medium was replaced with the serum-free Neurobasal A (NB-A) media supplemented with 2% B27 supplement, 1% GlutaMAX (Gibco, Carlsbad, CA, USA) and 0.3% glucose 4 h after plating. Half of the media were replaced every 3 days until use.
Chemical LTP
Chemical induction of LTP was performed as previously described (Park et al., 2006a; Fortin et al., 2010). In brief, neurons were treated with glycine (200 µM) in Mg2+-free extracellular iso-osmotic solution (mM: 125 NaCl, 2.5 KCl, 2 CaCl2, 5 HEPES, 33 glucose, 0.2 glycine, 0.02 bicuculline, and 0.003 strychnine, pH 7.4) for 5 min at 37°C to induce LTP (Yang et al., 2018a). Cells were then incubated with extracellular solution without glycine for up to 30 min.
Transfection and Drug Treatment of Cultured Neurons
Transient transfection of primary neurons was performed using Lipofectamine LTX according to the manufacturer's instructions (Invitrogen, Carlsbad, CA, USA) on 11 to 12 days in vitro (DIV) after plating. Briefly, DNA (0.5 μg/well) was mixed with 0.5 μL PLUS reagent in 50 μL NB-A medium, then mixed with 1.0 μL Lipofectamine LTX in 50 μL NB-A medium, incubated for 20 min at room temperature (RT) and then added to the neurons in 400 μL NB-A at 37°C in 5% CO2 for 1 h. Neurons were then rinsed with NB-A once and incubated in the original medium at 37°C in 5% CO2 for 3 to 4 days. For co-transfection, neurons were transfected with 1.0 μg of DNA consisting of two plasmids (0.5 μg each), or 1.3 μg of DNA consisting of three plasmids (0.4 μg shRNA + 0.4 μg Flag-tagged E-Syt1, E-Syt1 C2Cx, ΔC2E or ΔSMP mutants + 0.5 μg SPLICSS-P2AER−PM).
For drug treatment, primary hippocampal neurons cultured on coverslips were pre-incubated with BAPTA-AM (50 μM) for 30 min, MK801 (20 μM) for 1 h, Nimodipine (30 μM) for 30 min, or Ryanodine (50 μM) for 1 h before LTP induction with glycine. Drugs were kept in buffer during glycine application.
Immunofluorescence Staining, Confocal Image Acquisition, and Analysis
Surface staining of GluA1 was performed as previously described (Yang et al., 2018a). Briefly, neurons were fixed for 10 min at RT in freshly prepared phosphate buffered saline (PBS) containing 4% paraformaldehyde (PFA)/4% sucrose, rinsed with PBS, blocked with 5% normal goat serum in PBS for 45 min, and incubated with mouse anti-GluA1 antibodies in PBS with 5% normal goat serum overnight at 4°C, rinsed with PBS, followed with appropriate fluorescence-conjugated secondary antibodies. Neurons were then postfixed for 15 min at RT with freshly prepared PBS containing 4% PFA/4% sucrose, rinsed with PBS, blocked and permeabilized with 1% bovine serum albumin in PBS containing 0.4% Triton X-100 for 1 h at RT followed by labeling with rabbit anti-RFP antibodies for 1 h at RT, rinsed with PBS, and incubated with appropriate fluorescence-conjugated secondary antibodies for detection. Immunostaining with anti-Flag antibodies was performed the same as with anti-RFP. Confocal images were captured with a 100× Plan Apochromat VC (NA 1.40) oil objective using the Nikon A1 Confocal Microscope (Nikon, Tokyo, Japan). For analysis of ER–PM contact sites and surface GluA1, z projections of images acquired at 0.25 μm step intervals were processed using the NIS-Elements AR software (Nikon, Tokyo, Japan). The number of planes, typically 4 to 8, was chosen to encompass the entire dendrite from top to bottom.
Image analyses were performed with Fiji-ImageJ (NIH) as previously described (Niu et al., 2017; Yang et al., 2018a; Guo et al., 2022). For quantification of the density of SPLICSs-P2AER−PM fluorescent puncta, at least 10 neurons per group in each independent experiment and 3 to 5 segments of secondary dendrites (≥ 30 μm/segment, 30–90 μm from the cell body) per neuron were analyzed. For quantification of surface GluA1, mCherry-labeled dendrites or spines were outlined manually, and the mean intensity of fluorescent signals per unit area was calculated with Fiji-ImageJ.
TIRF Microscopy-Based Live Imaging and Analysis
Mouse hippocampal neurons were cultured in 4-well Nunc™ Lab-Tek™ chambered coverglasses (Thermo Fisher Scientific, Waltham, MA, USA) for live imaging. For detection of changes in PM signals of SPLICSs-P2AER−PM and E-Syt1, cells were transfected with plasmid expressing EGFP (control), SPLICSs-P2AER−PM or EGFP-E-Syt1 (0.5 μg/well) on DIV10-12 and imaged live on DIV16-18 by TIRF microscopy before and after glycine application in the absence or presence of BAPTA-AM. Images were acquired at a continuous rate of 1 to 2 frames/s using Nikon TE2000-E equipped with an autofocusing system (the Perfect Focus Unit, Nikon, Japan), 488 nm solid laser, 473/543 filter, 60× 1.49 oil lens (Nikon CFI Apochromat TIRF) and EMCCD camera (iXon Ultra 897,ANDOR,UK) controlled by the μManager software. Images were analyzed with the Time Series Analyzer V3 plugin of Fiji-ImageJ.
Statistical Analysis
All data were presented as the mean ± SEM. Statistical analyses were carried out with Excel (Microsoft, Seattle, WA, USA) and GraphPad Prism 5 (GraphPad Software, La Jolla, CA, USA). To evaluate statistical significance of two groups of samples, two tailed unpaired t-test was used. For three or more groups of samples, one-way analysis of variance with a Tukey post hoc test was used. A p value of <.05 was considered statistically significant.
Supplemental Material
Supplemental Material
Footnotes
Declaration of Conflicting Interests
The author(s) declared no potential conflicts of interest with respect to the research, authorship, and/or publication of this article.
Funding
The author(s) disclosed receipt of the following financial support for the research, authorship, and/or publication of this article: This work was supported by the National Natural Science Foundation of China, State Key Laboratory of Molecular Developmental Biology, China (grant number 31530039, 31921002, 32270730, 91954126, 2022-MDB-KF-13).
Supplemental Material
Supplemental material for this article is available online.
References
Supplementary Material
Please find the following supplemental material available below.
For Open Access articles published under a Creative Commons License, all supplemental material carries the same license as the article it is associated with.
For non-Open Access articles published, all supplemental material carries a non-exclusive license, and permission requests for re-use of supplemental material or any part of supplemental material shall be sent directly to the copyright owner as specified in the copyright notice associated with the article.