
Abstract
Numerous studies have revealed that organelle membrane contact sites (MCSs) play important roles in diverse cellular events, including the transport of lipids and ions between connected organelles. To understand MCS functions, it is essential to uncover proteins that accumulate at MCSs. Here, we develop a complementation assay system termed CsFiND (
Introduction
Recent studies have revealed that various pairs of organelles form membrane contact sites (MCSs), which contribute to inter-organelle communications. For instance, in yeast, the endoplasmic reticulum (ER)–mitochondria encounter structure (ERMES) is a direct molecular tether between the ER and mitochondria (Kornmann et al., 2009). The ERMES complex consists of four subunits, Mmm1, Mdm10, Mdm12, and Mdm34. Mmm1 is an ER-resident membrane protein, Mdm10 and Mdm34 are mitochondrial outer membrane (MOM) proteins, and Mdm12 is a soluble subunit (Kornmann, 2020; Tamura et al., 2019). Three of the subunits, Mmm1, Mdm12, and Mdm34, contain a synaptotagmin-like mitochondrial-lipid-binding protein domain that belongs to the tubular lipid binding proteins superfamily (Alva & Lupas, 2016; Kopec et al., 2010; Wong & Levine, 2017). The crystal structures of Mmm1 and Mdm12 indicate that these proteins contain a hydrophobic cavity or tunnel for phospholipid binding (AhYoung et al., 2017; Jeong et al., 2016, 2017; Kawano et al., 2018). Furthermore, in vitro assays using membrane fractions or the purified Mmm1-Mdm12 complex revealed that the ERMES directly facilitates phospholipid transport between the ER and mitochondria (Kawano et al., 2018; Kojima et al., 2016). These findings demonstrate that the ERMES complex serves phospholipid transfer at mitochondria–ER contact sites (MERCs).
In addition to the core subunits, previous studies also identified peripheral subunits of the ERMES complex, such as Gem1 and Ltc1/Lam6 (Kornmann et al., 2011; Murley et al., 2015; Stroud et al., 2011). While Gem1, which contains two GTPase domains and two EF-hand motifs, is critical for regulating the number and size of the ERMES clusters, Ltc1/Lam6 possesses a StART-like (VASt) domain responsible for sterol transport (Frederick et al., 2004; Gatta et al., 2015; Kornmann et al., 2011; Murley et al., 2017). These findings indicate that the MERC is a transport site for not only phospholipids but also sterols and suggest that identifying proteins localized at the MCS is critical for the understanding of MCS function.
In mammalian cells, proximity labeling (PL) with the enhanced ascorbate peroxidase (APEX) or its improved version (APEX2) was used to obtain proteome information about the MERCs. Although these proteomic studies identified RTN1A as a promoter of ER–mitochondrial contacts and SYNJ2BP as an ER–mitochondria tethering factor, the APEX-based PL technique has the disadvantage of low spatial specificity (Cho et al., 2017; Hung et al., 2017). Later, more spatially specific ways to analyze MCSs in living cells were developed using a complementation assay with split fluorescent proteins in yeast and mammalian cells (Cieri et al., 2018; Kakimoto et al., 2018; Shai et al., 2018; Tashiro et al., 2020; Yang et al., 2018). In one application, genetic screening using the fluorescent signal of reassembled split venus for visualizing the MCS in yeast identified MCS factors between mitochondria and peroxisome, or nucleus and mitochondria (Eisenberg-Bord et al., 2021; Shai et al., 2018). A different line of biochemical approaches used split-TurboID, an engineered biotin ligase, which enabled spatially specific biotinylation of proteins localized at MERCs. These spatially specific PL assays revealed the MERCs proteome and identified several novel candidates for MERCs-localized proteins in mammalian cells (Cho et al., 2020; Kwak et al., 2020). However, this technique has never been done in yeast system.
Here, we developed a complementation assay system, termed CsFiND (
Results and Discussion
Evaluation of Split-GFP-TurboID Constructs
Previous studies demonstrated that the MCS-specific PL method that used split-TuboID was a powerful tool for identifying MCS proteins. We sought to improve the split-TurboID-based PL method by combining the split-GFP system. Although the reassembly of GFP from its split fragments tends to enhance the formation of artificial MCS, we previously showed that this artifact could be suppressed by keeping the expression of split-GFP proteins at a low level (Tashiro et al., 2020). Moreover, using split-GFP has the advantage of marking where split-GFP-TurboID complementation occurs (Figure 1A). We named this system CsFiND (
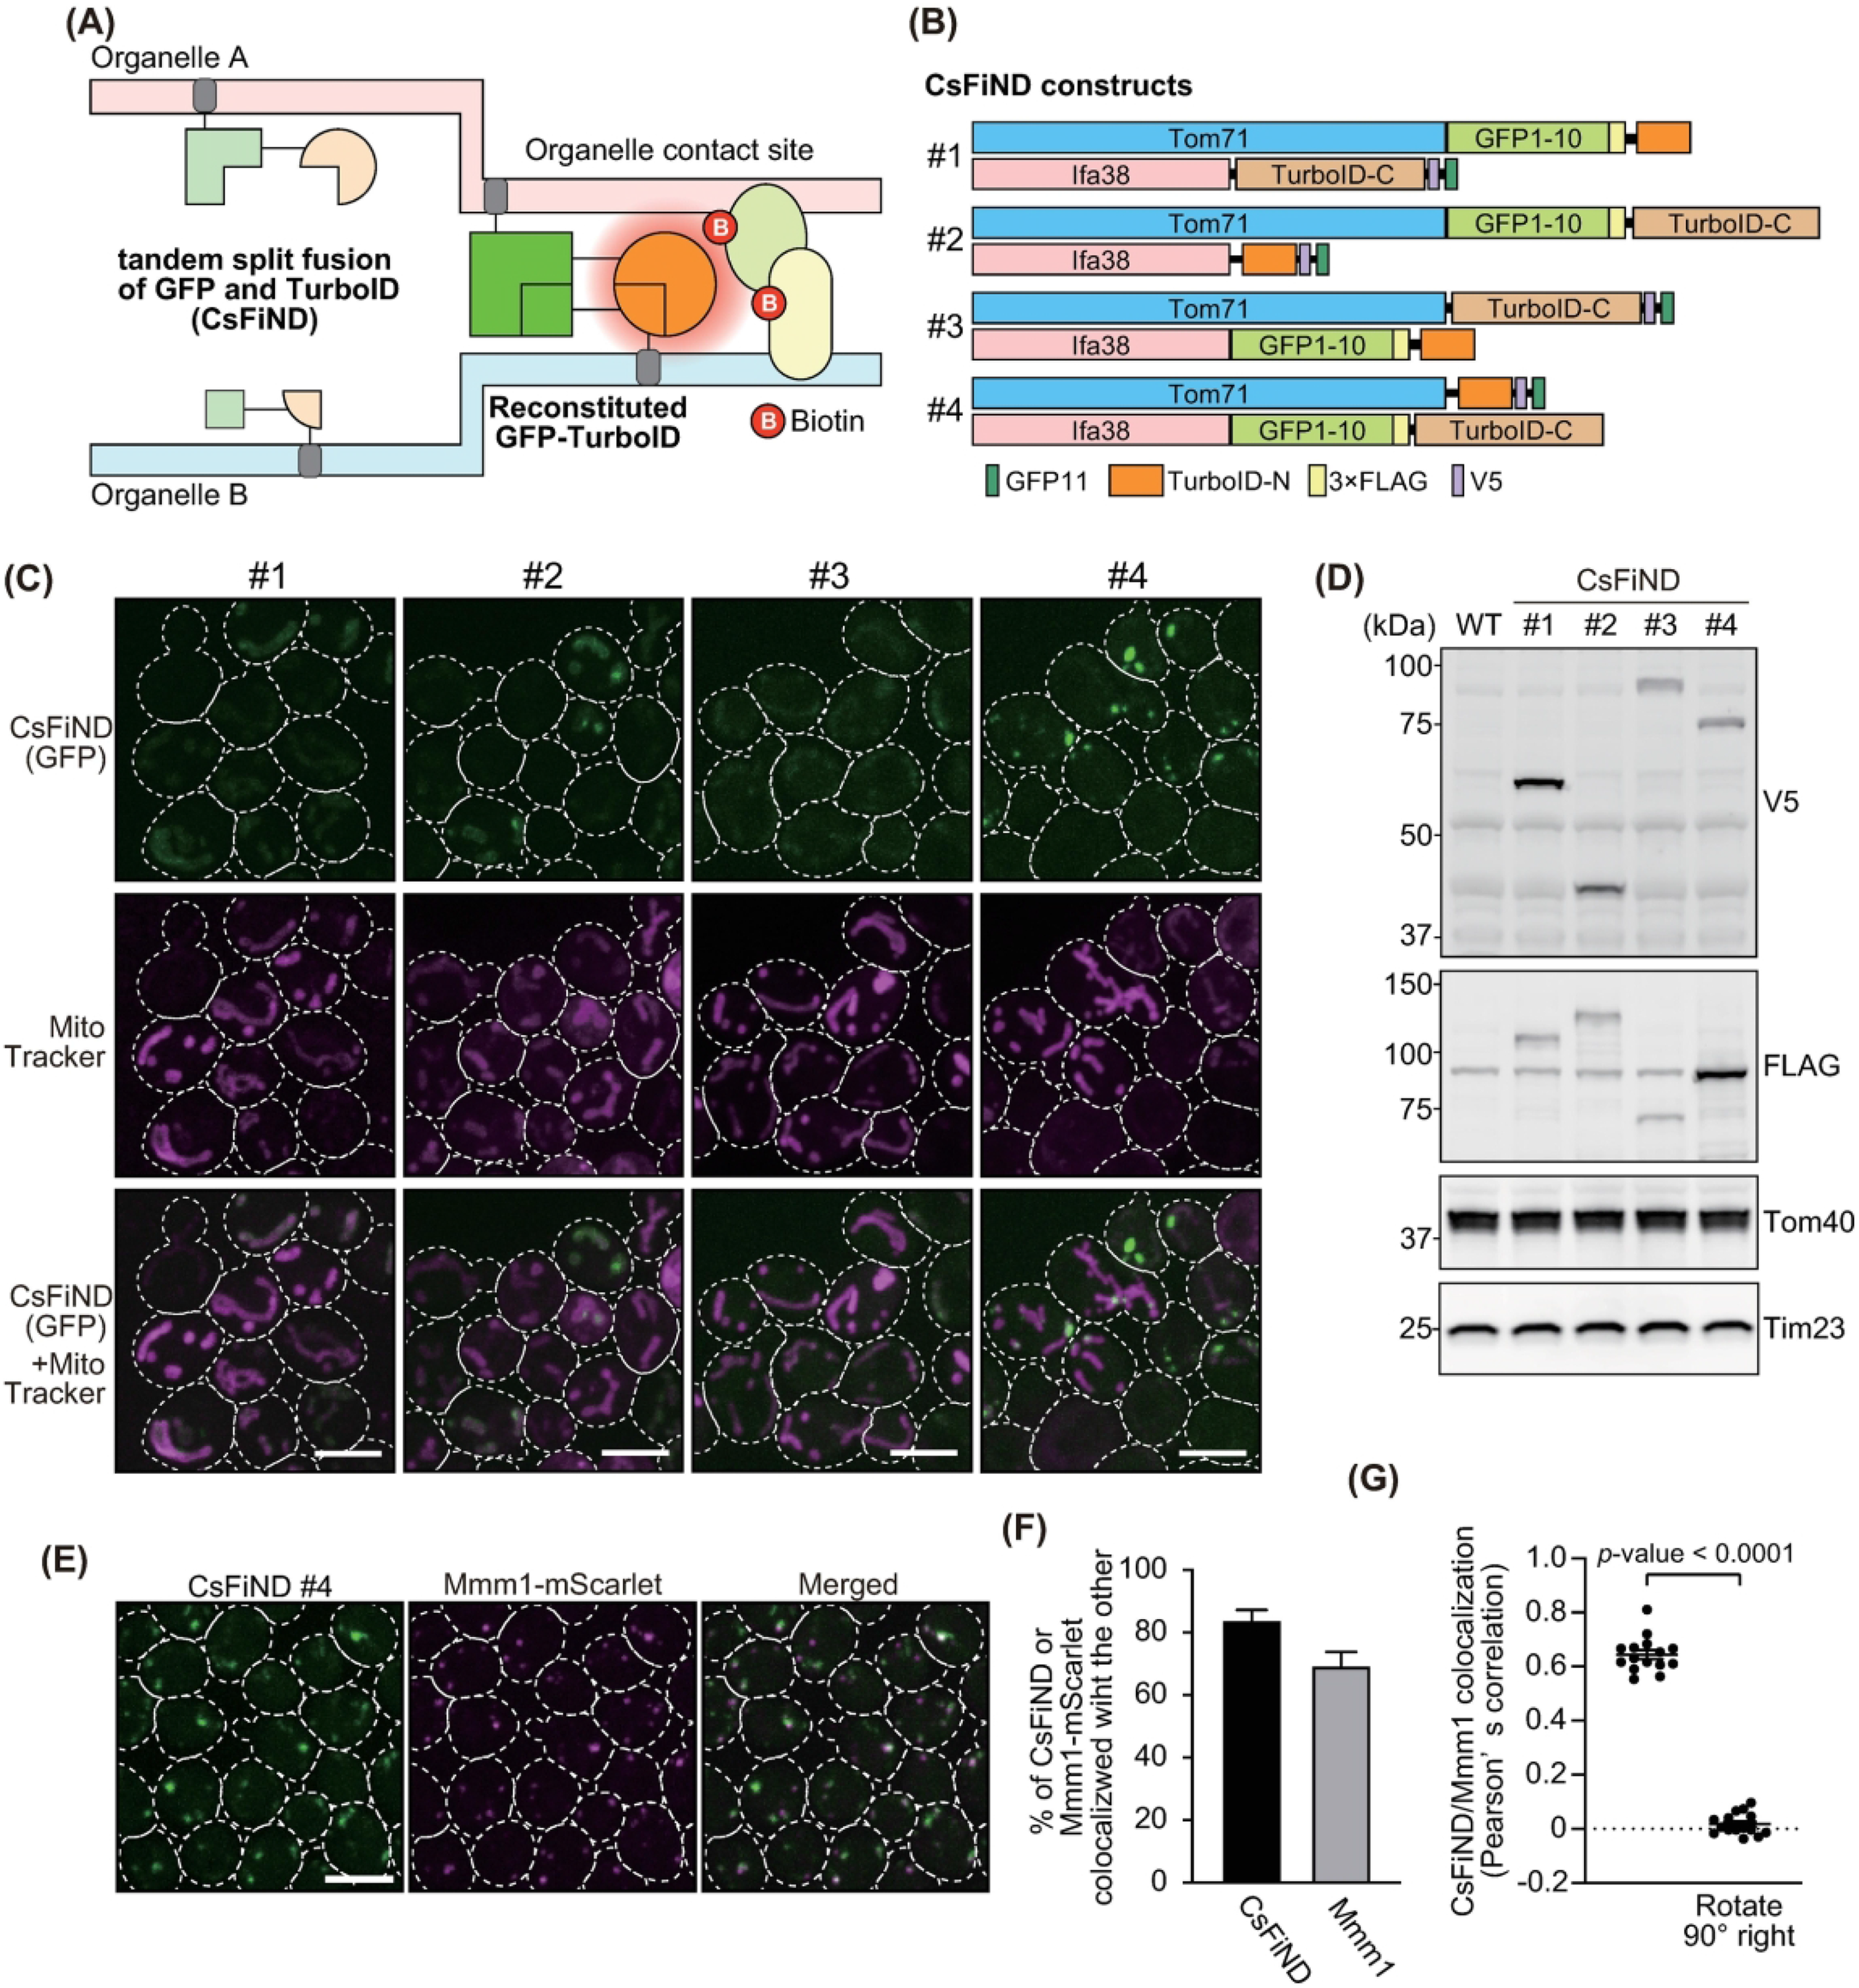
Selection of CsFiND constructs. (A) Schematics showing how organelle-targeted CsFiND proteins work at membrane contact site (MCS). (B) The four CsFiND constructs evaluated in this study. (C) Yeast cells expressing the indicated CsFiND proteins were shown in maximum projection images generated using ImageJ from stacks of confocal sections obtained on a fluorescence microscope. Mitochondria were stained with mitotracker. Scale Bars, 5 µm. (D) Whole-cell extracts prepared from wild-type (WT) cells and CsFiND-expressing cells (CsFiND #1–4) were subjected to immunoblotting using antibodies against the indicated epitope-tags or proteins. (E) Yeast cells expressing CsFiND #4 proteins and Mmm1-mScarlet from the Genomic DNA were imaged under a confocal fluorescence microscope and shown in maximum projection images. Scale bars, 5 µm. (F) Bar graph shows ratio of CsFiND or Mmm1-mScarlet signals colocalized with the other. Means and standard errors were shown (n = 3). (G) Scatter dot plots show the Pearson's correlation measured for CsFiND relative to Mmm1-MScarlet, or relative to a 90° rotated Mmm1-mScarlet. Means and standard errors were shown (n = 3).
As shown in Figure 1B, we created four combinations of CsFiND proteins targeted to the ERM or the MOM. The CsFiND protein consisted of the full length of a membrane protein (Tom71 for MOM or Ifa38 for ERM) followed by the N- or C-terminal fragments of split-GFP and split-TurboID tandem fused in various orders. We then transformed yeast cells with plasmid DNAs encoding these CsFiND proteins and observed GFP signals under a fluorescence microscope. Although CsFiND proteins #1–3 showed only weak GFP signals, the #4 construct exhibited clearly visible punctate GFP signals. This result suggested that the #4 CsFiND proteins were more efficiently assembled at MERCs than the other constructs (Figure 1C). Immunoblotting of whole-cell lysates prepared from yeast cells expressing CsFiND proteins revealed specific bands detected by antibodies against the epitope tag (V5 or FLAG) fused to the CsFiND proteins (Figure 1D), confirming the expressions of CsFiND proteins. Although all the CsFiND proteins were expressed under the same promoter (GPD), the expression levels varied among CsFiND proteins, indicating that protein stability may affect the reconstitution efficiency of the CsFiND proteins. Therefore, we decided to use the #4 construct for further experiments. It should also be noted that the CsFiND expression levels were significantly smaller compared with those expressed under the ADH1 promoter although the GPD promoter was reportedly much stronger that the ADH1 promoter (Mumberg et al., 1995) (Figure S1A–C). This result suggests that CsFiND proteins are not overexpressed. In addition, we employed the genome-based expression of CsFiND to suppress potential artefacts due to the cell-to-cell variation in the CsFiND expression levels (Tashiro et al., 2020) (Figure S1D and E). Furthermore, we analyzed the localization of CsFiND signals relative to MERCs labeled with Mmm1-mScarlet. We observed that ∼80% of GFP signals derived from CsFiND were colocalized with Mmm1-mScarlet and that ∼70% of the Mmm1-mScarlet foci were colocalized with CsFiND signals (Figure 1E and F). These results strongly suggest that the reconstitution of CsFiND proteins occurs at MERCs. We also confirmed the overlap between CsFiND and ERMES foci by Pearson's correlation coefficient (PCC). Although the PCC between CsFiND and Mmm1-mScarlet signals showed a high score (∼0.7), it significantly reduced when we used images rotated 90° to measure the random overlap. These results suggest that the assembly of CsFiND proteins occurred mainly at preexisting MERCs.
CsFiND Exhibits Dynamic Properties Similar to Authentic MERCs
It was previously reported that split-GFP proteins overexpressed on two distinct organelle membranes induced MCS formations (Bishop et al., 2019; Tashiro et al., 2020). We thus examined whether the CsFiND expression affected the formation of MERCs. To this end, we quantified the number and fluorescence intensity of ERMES foci visualized by Mmm1-mScarlet with or without the expression of CsFiND (Figure 2A). We found that neither the number nor fluorescent intensity of ERMES dots was affected by the CsFiND expression (Figure 2B and C). This result indicates that the expression of CsFiND does not strongly affect the formation of MERCs.

CsFiND functions as a good marker for MERCs. (A) Yeast cells expressing Mmm1-mScarlet with (+CsFiND) or without (-CsFiND) the expression of CsFiND #4 proteins from the genomic DNA were imaged under a confocal fluorescence microscope and shown in maximum projection images. Scale bars, 5 µm. (B, C) Scatter dot plots show the distribution of the number of Mmm1 foci per cell (B) and fluorescence intensity of Mmm1 foci. Over 40 cells were analyzed for each case (n = 3). Means and standard errors were shown. n.s. = not significant. (D) Yeast cells expressing CsFiND #4 proteins and Mmm1-mScarlet from the genomic DNA were treated with 1 µg/ml tunicamycin (Tm) or 3 mM DTT for 2 h and then imaged under a confocal fluorescence microscope and shown in maximum projection images. Scale bars, 5 µm. (E) Scatter dot plots show the distribution of the number of CsFiND GFP foci per cell. Total 90 cells were analyzed for each case. Means and standard errors were shown (n = 3). (F) Immunoblotting of whole-cell extracts prepared from cells as in (E). ****p-value < 0.0001 (unpaired t-test, two-tailed).
Recently, we reported that ER stress led to the dissociation of the ERMES complex, resulting in an increased number of ERMES foci (Kakimoto-Takeda et al., 2022). To further confirm that the CsFiND expression does not artificially alter the MERC environment, we investigated whether the CsFiND signal changed in response to the ER stress-dependent ERMES dissociation. We treated yeast cells expressing CsFiND and Mmm1-mScarlet with an ER-stress inducer, tunicamycin or DTT, and observed the fluorescence signals under a fluorescence microscope (Figure 2D). Similar to ERMES foci, the number of GFP signals derived from assembled CsFiND proteins significantly increased upon ER stress (Figure 2D and E). We detected slightly decreased amounts of CsFiND proteins and an increased amount of Kar2, which is a well-known unfolded protein response target protein (Travers et al., 2000), confirming that the increased number of GFP signals was not due to increased levels of CsFiND proteins. These results indicate that CsFiND exhibits dynamic properties similar to authentic MERCs. Thus, we conclude that CsFiND can be used as a good marker for MERCs, although we cannot completely rule out the possibility that the CsFiND expression artificially induced MCSs.
CsFiND Specifically Biotinylates MCS Proteins
We investigated whether the CsFiND specifically biotinylated MCS-localized proteins. For this purpose, we first cultured wild-type and CsFiND-expressing yeast cells in the presence of biotin for variable periods of time to determine the duration of biotin incubation that was sufficient to obtain biotinylated proteins by the reconstituted CsFiND. We then analyzed the proteins from whole-cell lysates prepared from these cells by immunoblotting. Although streptavidin blotting resulted in multiple strong bands that probably corresponded to endogenously biotinylated proteins, there were also several bands specific to the expressed CsFiND proteins (Figure 3A). This result suggested that at least some proteins were biotinylated in a CsFiND-dependent manner. Since the intensity of the CsFiND-specific bands was maximized by biotin incubation for duration of 3 h, we purified biotinylated proteins from the sample of 3 h biotin incubation.

MERCs proteins were specifically biotinylated by CsFiND. (A) Yeast cells of the wild-type (WT) and those genetically modified to express CsFiND (CsFiND) were cultivated in yeast extract peptone dextrose (YPD) medium containing biotin for the indicated times. Whole-cell lysates prepared from these cell cultures were analyzed by immunoblotting using the indicated antibodies or streptavidin-Cy5 (SAv-Cy5). (B) The biotinylated proteins were purified from heavy membrane fractions isolated from wild-type (CsFiND-) and cells expressing CsFiND (CsFiND+) and subjected to streptavidin blotting. (C) The same as in (B) but using the indicated antibodies instead of streptavidin-Cy5. * and ** indicate likely biotinylated CsFiND proteins. Tom70 antibodies we used likely cross-react with Tom71. Thus, Tom71-TurboID-N-V5-GFP11 (Labeled with **) was detected with Tom70 antibodies. Contrast-enhanced images for some MOM proteins were shown (Enhanced). (D) A summary table of known MERCs proteins identified by the CsFiND method.
We purified proteins that were biotinylated by the reconstituted CsFiND at MERCs in two steps. First, we isolated heavy membrane fractions from cells with or without the expression of CsFiND after 3 h biotin incubation. Second, we purified biotinylated proteins from the solubilized membrane fractions by using streptavidin magnetic beads and analyzed them by streptavidin blotting. In addition to endogenous biotinylated proteins, we could detect multiple bands stained with streptavidin-Cy5 only in samples from CsFiND-expressing cells. Among the CsFiND-specific bands, two strong bands appeared between 75 kD and 100 kD, which were probably the CsFiND proteins themselves, considering their molecular weight (see also Figure 1D). Indeed, we confirmed that CsFiND proteins were biotinylated and significantly concentrated in the elute fraction by immunoblotting using antibodies against the FLAG-tag or V5-tag we fused to the CsFiND proteins (Figure 3C). More importantly, we confirmed that Mmm1, Mdm34, and Mdm12, three of the four ERMES core subunits, were collected as biotinylated proteins in the elute fraction. In addition, we could detect Tom70, Tom22, Tom20, and Por1 in the elute fraction, albeit in small amounts when the contrast of the gel image was increased. This may suggest that a fraction of Tom70, Tom22, Tom20, and Por1 are localized at MERCs, similar to Tom71, a reportedly MERCs protein (Murley et al., 2015). In contrast, a MOM protein Tom40, a mitochondrial inner membrane protein Tim23, and ERM proteins Cho1 and Opi3 were not enriched as biotinylated proteins.
Lastly, we performed LC-MSMS analysis of biotinylated proteins purified from membrane fractions expressing the CsFiND proteins. As a negative control, we performed the same experiments using wild-type membrane factions without the CsFiND expression. Among proteins identified, we selected the following two categories of proteins as candidates of MERC proteins: (1) proteins detected in the CsFiND-expressing membrane fraction but not in the negative control; (2) proteins with a 3-fold or greater MS signal compared to the negative control. The complete list of proteins identified by LC-MSMS is included as Supplemental Table (Table S1). In order to confirm the validity of the CsFiND method, we summarized which of the known MERC factors were identified by CsFiND and which were not (Figure 3D). We could identify known MERC-proteins Lam6/Ltc1, Lam5, Gem1, Num1, and Fmp27 in the elute fraction (Figure 3D) in addition to those already identified by immunoblotting. Among ERMES core components, we could not detect Mdm10 by the LC-MSMS analysis. These results demonstrate that CsFiND is a reliable tool for identifying MCS-localized proteins. Combining the PL assay using CsFiND with LC-MSMS or a more quantitative proteomic method such as SILAC will enable the identification of various inter-organelle contact site proteins in future studies.
Conclusions
In this study, we developed a new complementation assay, named CsFiND, and demonstrated its effectiveness as a tool for identifying MCS-localized proteins. We analyzed MERCs in yeast using CsFiND and showed CsFiND specifically biotinylated three of the four ERMES core subunits (Mmm1, Mdm12, and Mdm34), as well as Gem1, Num1, Fmp27, Lam5 and Lam6/Ltc1, all of which are known to accumulate at MERCs in yeast. We believe that this new, highly spatially specific method will make it possible to analyze MCS more accurately not only in yeast but also in mammalian cultured cells. Since the number and degree of MCSs reportedly change under various cellular stresses or nutrient conditions (Elbaz-Alon et al., 2014, 2015; Hariri et al., 2018; Hönscher et al., 2014; Kakimoto-Takeda et al., 2022), CsFiND is expected to help clarify the regulatory mechanism of MCSs under stress conditions. In addition, it would be interesting to see whether using CsFiND in cells that lack known MCS-forming factors, such as ERMES, may identify novel MCS factors, and thereby uncover a backup mechanism for MCS dysfunction. We are currently analyzing various MCSs in yeast and mammalian cultured cells using CsFiND. We expect that future studies using CsFiND will reveal novel factors and functions of MCSs.
Material and Methods
Plasmid Construction
Plasmid DNAs and primers used in this study are summarized in Supplementary Tables S2 and S3, respectively. We constructed plasmid DNAs expressing CsFiND proteins as follows. We first digested previously constructed plasmids, pSFL16 or pSFL22 (Kakimoto et al., 2018), using restriction enzymes NotI and BamHI to cut off the full length of the IFA38 or TOM71 gene without a stop codon. Next, we inserted the IFA38 or TOM71 coding DNA fragments into the NotI/BamHI site flanked by the GPD promoter and the CYC1 terminator of a single-copy yeast expression vector, pYU47 or pYU59 (Kakimoto et al., 2018). Then, we inserted synthesized DNA sequences coding for tandemly bound split-GFP fragments (GFP1-10 or GFP11) and the N- or C-terminal split fragments of TurboID (TurboID-N or TurboID-C) into BamHI/EcoRI sites after the IFA38 or TOM71 gene. The four tandem sequences, GFP1-10-FLAG-TurboID-C, GFP1-10-FLAG-TurboID-N, TurboID-N-V5-GFP11, and TurboID-C-V5-GFP11, were purchased from Eurofins Genomics and are listed in Supplementary Material. The eight vectors resulting from the combination of two protein genes with four tandem sequences, pSFL123, pSFL124, pSFL125, pSFL126, pSFL133, pSFL134, pSFL145, and pSFL146, are summarized in Supplementary Material.
To express the CsFiND proteins from the genomic DNA in yeast, we cloned the CsFiND gene tandemly fused with either the hygromycin-resistant (hphMX) or clonNAT-resistant (natNT2) marker into the pBlueScript SK(-) vector (Agilent Technologies). We first amplified the DNA fragments expressing the CsFiND proteins using the plasmids pSFL124 and pSFL134 as templates with primer pairs YU1390/YU498 or YU1390/YU499. We also amplified the DNA fragments encoding hphMX and natNT2 by PCR. For this, we used pBS-hphMX or pBS-natNT2 (Kojima et al., 2019) as a template with the primer pair YU501/YU503 or YU500/YU502, respectively. Then we further amplified the complete gene cassettes encoding the CsFiND and the drug-resistance genes by an overlap extension PCR. For this step, we used the two DNA fragments previously mentioned as templates and the primer pairs YU1390/YU503 and YU1390/YU502. Finally, we inserted the products into the EcoRI/BamHI site of pBlueScript SK(-) using the SLiCE method (Motohashi, 2015), resulting in vectors pSFL182 and pSFL185, respectively.
Yeast Strains and Growth Conditions
We used a haploid FY833 strain (MATa ura3-52 his3-Δ200 leu2-Δ1 lys2-Δ202 trp1-Δ63) to chromosomally express the CsFiND proteins. To construct this yeast strain, we first transformed the wild-type yeast cells with the GPDp-TOM71-TurboID(n)-V5-GFP(11)-CYC1ter-hphMX gene cassette amplified from vectors pSFL182 by PCR using the primer pairs YU1510/1511. The resulting transformant cells were further transformed with the GPDp-IFA38-GFP(1-10)-3×FLAG-TurboID(c)-CYC1ter-natNT2 gene cassette amplified from vectors or pSFL185 by PCR using the primer pairs YU1506/1507. These gene cassettes were integrated into the LEU2 and URA3 loci, respectively.
The transformants were selected on the yeast extract peptone dextrose (YPD) medium (1% yeast extract, 2% polypeptone, and 2% glucose) containing hygromycin B (200 µg/ml) or clonNAT (200 µg/ml). The integration of the DNA cassettes into the correct sites was confirmed by PCR using the genomic DNA as a template, and the primer pairs YU1512/1513 for the LEU2 locus and YU1514/1515 for the URA3 locus. The C-terminal mScarlet tagging of Mmm1 was performed by homologous recombination using the mScarlet-kanMX4 cassette amplified from pYU101 using the primer pairs YU2055/2056 (Longtine et al., 1998).
To maintain the plasmids expressing the CsFiND proteins, we used the synthetic complete dextrose (SCD)-Ura-Trp medium (0.67% yeast nitrogen base without amino acids, 0.5% casamino acid, and 2% glucose) supplemented with adenine (20 mg/L) and amino acids (20 mg/L L-Histidine, 30 mg/L L-Leucine, and 30 mg/L L-Lysine).
Fluorescence Microscopy
Logarithmically growing yeast cells cultivated in SCD or YPD media were observed using a model IX83 microscope (Olympus) with a CSU-X1 confocal unit (Yokogawa), a 100× objective lens with a numerical aperture of 1.4 (UPlanSApo; Olympus), and an Evolve 512 EM-CCD camera (Photometrics). GFP was excited using a 488-nm laser (OBIS; Coherent), and the emission was detected through a 520/35-nm band-pass filter. For mScarlet, excitation was at 561 nm, and emission was detected through a 617/73-nm band-pass filter. Confocal fluorescent sections were collected every 0.2 µm from the upper to the bottom surface of yeast cells and processed for maximum projection using Image J software (NIH). For MitoTracker staining, 2 µl of 1 mM stock of MitoTracker Red CMXRos (Thermo Fisher Scientific) was added to 5 ml of cell culture (final concentration 400 ng/ml) and incubated for 10 min. Then, the cells were washed twice with 5 ml of MilliQ water before observation.
Purification of Biotinylated Proteins
Overnight culture of yeast cells grown in YPD and expressing CsFiND proteins was inoculated into 60 ml of YPD at OD600 = 0.02 and cultivated for 10 h at 30°C. Then, we added the final 50 µM of biotin to the yeast culture (OD600 = 0.8–1.2) and continued cultivation for 3 h. First, the cells (200 OD600 unit) were collected and incubated in 20 ml of alkaline buffer (0.1 M Tris-HCl, pH 9.5; 10 mM DTT) for 10 min at 30°C. After washing with spheroplast buffer (20 mM Tris-HCl, pH 7.5; 1.2 M sorbitol), the cells were incubated in 25 ml of spheroplast buffer containing 2 units/ml Zymolyase 20T (Nacalai Tesque, Inc.) for 30 min at 30°C. Next, the resulting spheroplasts were washed with ice-cold spheroplast buffer and vortexed in 1 ml of ice-cold breaking buffer (20 mM Tris-HCl, pH 7.5; 0.6 M mannitol; 1 mM EDTA; and 1 mM PMSF) containing 0.5 ml of glass beads for 1 min. After adding 5 ml of ice-cold breaking buffer to the sample, unbroken cells, nuclear fractions, and glass beads were removed by centrifugation at 2000× g for 5 min. Next, the supernatant was collected and centrifuged at 12,000× g for 10 min to precipitate membrane fractions. Finally, the membrane fractions were washed with SEM buffer (10 mM MOPS-KOH, pH 7.2; 250 mM sucrose; 1 mM EDTA) and resuspended in SEM buffer.
Purification of biotinylated proteins from membrane fractions was performed using a method previously described. Briefly, for the immunoblotting analysis, we solubilized the membrane fractions (2 mg protein) in 250 µl of RIPA buffer (50 mM Tris-HCl, pH 7.5; 150 mM NaCl; 1% Triton X-100; 0.5% sodium deoxycholate; 0.1% sodium dodecyl sulfate; and 2 mM PMSF) on ice for 20 min. After centrifugation at 12,000× g for 10 min, 200 µl of the supernatant was transferred to a 2 ml tube containing 1.8 ml of RIPA buffer and 20 µl of Pierce streptavidin magnetic beads (Thermo Fisher Scientific). To purify biotinylated proteins for liquid chromatography with tandem mass spectrometry (LC-MS/MS) analysis, we performed the same experiment on a 4-fold scale, using 8 mg of the membrane fraction. The mixtures were incubated for 4 h at 4°C on a rotating wheel. The magnetic beads were collected using a magnetic rack and washed once with RIPA buffer, 1 M KCl, 0.1 M Na2CO3, and Urea buffer (20 mM HEPES-KOH, pH 7.5; 2 M Urea), twice with RIPA buffer, and then three times with D-PBS (-) (Fujifilm Wako Pure Chemical).
For the immunoblotting analysis, the biotinylated proteins were eluted with 3× SDS sample buffer (0.375 M Tris-HCl, pH 6.8; 6.3% SDS; 30% sucrose; and 0.01% bromophenol blue) containing 2 mM biotin. For LC-MS/MS analysis, the magnetic beads were stored in methanol. After the methanol preserving the magnetic beads was removed, the proteins bound to the magnetic beads were digested in 200 µl of trypsin-containing buffer (1% sodium deoxycholate; 1 M ZOOM™ Urea (ThermoFisher Scientific); 50 mM NH4CO3; and 0.25 µg Sequencing Grade Modified Trypsin (Promega)) at 37°C for 24 h. We added 40 µl of 5% formic acid and vortexed the mixture vigorously, before centrifuging the samples at 20,000× g at room temperature for 10 min. The resulting supernatant (200 µl) was mixed with 200 µl of ethyl acetate, vortexed vigorously, and centrifuged at 20,000× g at room temperature for 5 min. After removing the upper phase, the lower phase was dried in a concentrator plus (Eppendorf) at 40°C. The dried peptides were dissolved in 20 µl of 0.1% formic acid. After desalting using a C-Tip according to the manufacturer's instruction, the peptide mixture was analyzed by using the EASY nLC 1000 system (Thermo Scientific) connected to a quadrupole orbitrap mass spectrometer (Q-Exactive, Thermo Scientific). We acquired the full-scan spectra (m/z range 380–1500) using data-dependent mode to automatically switch between mass spectrometry and tandem mass spectrometry acquisition. Raw file reads were searched against the Swiss-Prot Saccharomyces cerevisiae database, using Proteome Discoverer (version 1.4, Thermo Scientific) with Mascot (version 2.8, Matrix Science, Tokyo, Japan) search engines. Precursor and fragment mass tolerances were set to 10 ppm and 0.8 Da, respectively. The enzyme was set to trypsin with maximum missed cleavage sites of 1. Variable modifications for the oxidation of methionine were set. The results were filtered using Percolator with a false discovery rate of 1%.
Immunoblotting
Proteins were separated on SDS gels and transferred to PVDF membranes (Immobilon-FL, Millipore). For immunoblotting using primary antibodies, the membranes were blocked with 1% skim milk in TBST buffer (10 mM Tris-HCl, pH 7.5; 150 mM NaCl; and 0.05% Tween 20) for 1 h. For streptavidin-Cy5 blotting, membranes were blocked with 3% bovine serum albumin in TBST for 5 h. In streptavidin-Cy5 blotting, specific proteins were detected directly after washing the membranes with TBST. In immunoblotting, Cy5-conjugated secondary antibodies, goat antirabbit, or mouse IgG (H + L) (Thermo Fisher Scientific), were used and the blots were analyzed by using a Typhoon imager (GE Healthcare).
Supplemental Material
sj-docx-1-ctc-10.1177_25152564231153621 - Supplemental material for Complementation Assay Using Fusion of Split-GFP and TurboID (CsFiND) Enables Simultaneous Visualization and Proximity Labeling of Organelle Contact Sites in Yeast
Supplemental material, sj-docx-1-ctc-10.1177_25152564231153621 for Complementation Assay Using Fusion of Split-GFP and TurboID (CsFiND) Enables Simultaneous Visualization and Proximity Labeling of Organelle Contact Sites in Yeast by Shintaro Fujimoto, Shinya Tashiro and Yasushi Tamura in Contact
Supplemental Material
sj-docx-2-ctc-10.1177_25152564231153621 - Supplemental material for Complementation Assay Using Fusion of Split-GFP and TurboID (CsFiND) Enables Simultaneous Visualization and Proximity Labeling of Organelle Contact Sites in Yeast
Supplemental material, sj-docx-2-ctc-10.1177_25152564231153621 for Complementation Assay Using Fusion of Split-GFP and TurboID (CsFiND) Enables Simultaneous Visualization and Proximity Labeling of Organelle Contact Sites in Yeast by Shintaro Fujimoto, Shinya Tashiro and Yasushi Tamura in Contact
Supplemental Material
sj-docx-3-ctc-10.1177_25152564231153621 - Supplemental material for Complementation Assay Using Fusion of Split-GFP and TurboID (CsFiND) Enables Simultaneous Visualization and Proximity Labeling of Organelle Contact Sites in Yeast
Supplemental material, sj-docx-3-ctc-10.1177_25152564231153621 for Complementation Assay Using Fusion of Split-GFP and TurboID (CsFiND) Enables Simultaneous Visualization and Proximity Labeling of Organelle Contact Sites in Yeast by Shintaro Fujimoto, Shinya Tashiro and Yasushi Tamura in Contact
Supplemental Material
sj-xlsx-4-ctc-10.1177_25152564231153621 - Supplemental material for Complementation Assay Using Fusion of Split-GFP and TurboID (CsFiND) Enables Simultaneous Visualization and Proximity Labeling of Organelle Contact Sites in Yeast
Supplemental material, sj-xlsx-4-ctc-10.1177_25152564231153621 for Complementation Assay Using Fusion of Split-GFP and TurboID (CsFiND) Enables Simultaneous Visualization and Proximity Labeling of Organelle Contact Sites in Yeast by Shintaro Fujimoto, Shinya Tashiro and Yasushi Tamura in Contact
Supplemental Material
sj-pdf-5-ctc-10.1177_25152564231153621 - Supplemental material for Complementation Assay Using Fusion of Split-GFP and TurboID (CsFiND) Enables Simultaneous Visualization and Proximity Labeling of Organelle Contact Sites in Yeast
Supplemental material, sj-pdf-5-ctc-10.1177_25152564231153621 for Complementation Assay Using Fusion of Split-GFP and TurboID (CsFiND) Enables Simultaneous Visualization and Proximity Labeling of Organelle Contact Sites in Yeast by Shintaro Fujimoto, Shinya Tashiro and Yasushi Tamura in Contact
Footnotes
Declaration of Conflicting Interests
The author(s) declared no potential conflicts of interest with respect to the research, authorship, and/or publication of this article.
Funding
The author(s) disclosed receipt of the following financial support for the research, authorship, and/or publication of this article: This work was supported by the Japan Society for the Promotion of Science, Japan Agency for Medical Research and Development, AMED and Naito Foundation (grant number 17H06414, 19H03174, 22H02568, JP20gm5910026).
Supplemental Material
Supplemental material for this article is available online.
References
Supplementary Material
Please find the following supplemental material available below.
For Open Access articles published under a Creative Commons License, all supplemental material carries the same license as the article it is associated with.
For non-Open Access articles published, all supplemental material carries a non-exclusive license, and permission requests for re-use of supplemental material or any part of supplemental material shall be sent directly to the copyright owner as specified in the copyright notice associated with the article.