
Abstract
Free-text responses are a crucial part of psychological research, enabling participants to respond without bias toward a predefined set of answers. Unfortunately, many established methods for analyzing such responses require extensive manual coding, which is time- and resource-intensive. To address this issue, automatic-processing methods based on word embeddings and clustering techniques have been proposed. In this article, we introduce SCORES (Semantic Clustering of Open Responses via Embedding Similarity), a user-friendly, graphical tool that makes such automatic methods easy to use and understand for psychological researchers.
Keywords
Free-text responses are a crucial part of psychological research because they offer participants the option to provide responses without being constrained by or biased toward predefined sets of answers. Indeed, free-text responses have provided important insights across different psychological subdisciplines. For example, in clinical psychology, open-ended responses have been used to identify key cultural-competence practices for service providers working with sexual minorities (Bishop et al., 2022), explore the reasons behind individuals’ choices to disclose their self-injury (Ammermann et al., 2021), and understand triggers and cognitions associated with anger episodes (Tafrate et al., 2002). In industrial-organizational psychology, open-ended questions have provided insights into the relationship between perception of power in organizations and sentiment toward them (R. A. Jackson et al., 2022) and the significance of corporate culture and its impact on organizational outcomes (Graham et al., 2022). Social psychology used open responses to examine stereotypes and personal beliefs about individuals with dwarfism (Heider et al., 2013) and investigate the use of stereotypes to explain their social status among members of disadvantaged groups (Degner et al., 2021).
However, the analysis of such responses poses a challenge. Traditionally, such analysis has involved the development of codebooks, followed by manual coding by multiple coders, in line with coding frameworks of, for example, Chi (1997) or Mayring (2019). This process is time-consuming and resource-intensive and thus not always feasible, especially for researchers at less well-resourced institutions. To reduce effort and potential human bias introduced during coding, automatic methods have been introduced. Many of these methods, most prominently Linguistic Inquiry and Word Count (Boyd et al., 2022; Tausczik & Pennebaker, 2010), detect keywords from a prespecified dictionary in free-text responses and automatically code them based on the detected keyword patterns. However, predefined dictionaries may still fail to accurately represent participants’ responses, especially if participants use few or uncommon words. For such responses, a more flexible coding process that can detect similarities even between responses with few and uncommon words is needed. Recently, transformer-based language models have emerged as a novel technology to quantify similarity between text in such a flexible manner (J. C. Jackson et al., 2022; Kjell et al., 2023; Li et al., 2020). In particular, such models translate (short) free-text responses to arrays of numbers (so-called embedding vectors) such that more similar numbers indicate more semantic similarity between the two responses (Kjell et al., 2023; Li et al., 2020; Xiao et al., 2024). This measure of similarity can then be used to automatically group similar free-text responses into clusters (Nicolas et al., 2022), leaving only the task of interpreting the clusters to researchers.
Our contribution is a user-friendly, open-source software that we name SCORES (Semantic Clustering of Open Responses via Embedding Similarity) and that makes such embeddings and clustering methods easy to use for psychological researchers. The method underlying this tool can be seen as a simplified version of BERTopic (Grootendorst, 2022), which has been extensively used in prior research on topic modeling (Feuerriegel et al., 2025; Wu et al., 2024), especially in social media data analysis to discover clusters in large corpora of short-form social media posts (Egger & Yu, 2022). The specific pipeline used in SCORES has been previously used for social-psychology research of stereotypes (Morgenroth et al., 2024), an analysis we reproduce as a step-by-step guide in this article. The software can be downloaded for Windows and Linux systems at https://github.com/ReylordDev/SCORES/releases/latest.
SCORES can dramatically increase the speed at which qualitative data are processed compared with manual coding, especially when working with large numbers of responses (> 100). Although SCORES primarily serves as a method for exploratory data analysis, it can benefit researchers in multiple ways. For example, the tool can be helpful for identifying meaningful clusters associated with specific populations and assessing their prevalence in data sets (e.g., when examining beliefs about traits or stereotypes about different groups). In addition, the tool enables researchers to explore group differences in responses by separately processing open-ended responses for different social groups or participants assigned to different conditions in experimental research. Furthermore, SCORES can be used to test theoretical predictions by evaluating whether observed patterns align with expectations derived from existing theories. For instance, researchers using frameworks such as the stereotype-content model (Fiske et al., 2018) can assess whether their free-response data align with theoretically predicted dimensions (i.e., warmth and competence). Finally, the tool can serve as a comparison with human coding, reducing some (but not all; refer to the limitations section and Feuerriegel et al., 2025) human bias by providing a reliable reference point. For a more extensive review on how such topic-clustering approaches (also known as “neural-topic models”) can be used in social sciences, refer to Feuerriegel et al. (2025).
Objectives and Aims
The core aim of SCORES is to enable researchers to cluster large sets of free-text responses without the need for extensive manual labor or programming experience (i.e., it makes embedding and clustering approaches such as BERTopic easy to use). More specifically, we suggest using SCORES when the following criteria are fulfilled (for a decision schema, see Fig. 1): (a) At least some of the items are free-text responses. (b) The number of data points makes manual processing difficult, meaning typically 100 or more responses. Such study sizes are common to ensure statistical power, especially in online surveys. (c) The length of the free-text responses is short (10 words or less). Embeddings of the text need to cover the content of the entire text. Longer texts should first be divided into different semantic blocks, which are embedded separately. Furthermore, more classic topic-modeling techniques based on word frequencies are appropriate for such longer texts. Although 10 words is not a hard limit (Grootendorst, 2022, were substantially more optimistic and imposed no upper limit at all), we recommend it as a rough guideline to ensure that the embedding can still capture the entire content of the text accurately. Such short texts are common in cases in which participants are asked for short elaborations of their answer. Short-form social media posts form another kind of such short-text data (Egger & Yu, 2022). (d) Data are of low quality or too heterogeneous for simple keyword searches in the sense that typos, synonyms, or linguistic variations are common. For example, in this article, we consider a data set containing responses such as “uneducated,” “undeducated” [sic!], “non-educated,” and “lacking education.” One strength of SCORES is that such raw data can be directly used without the need for cleaning or preprocessing.
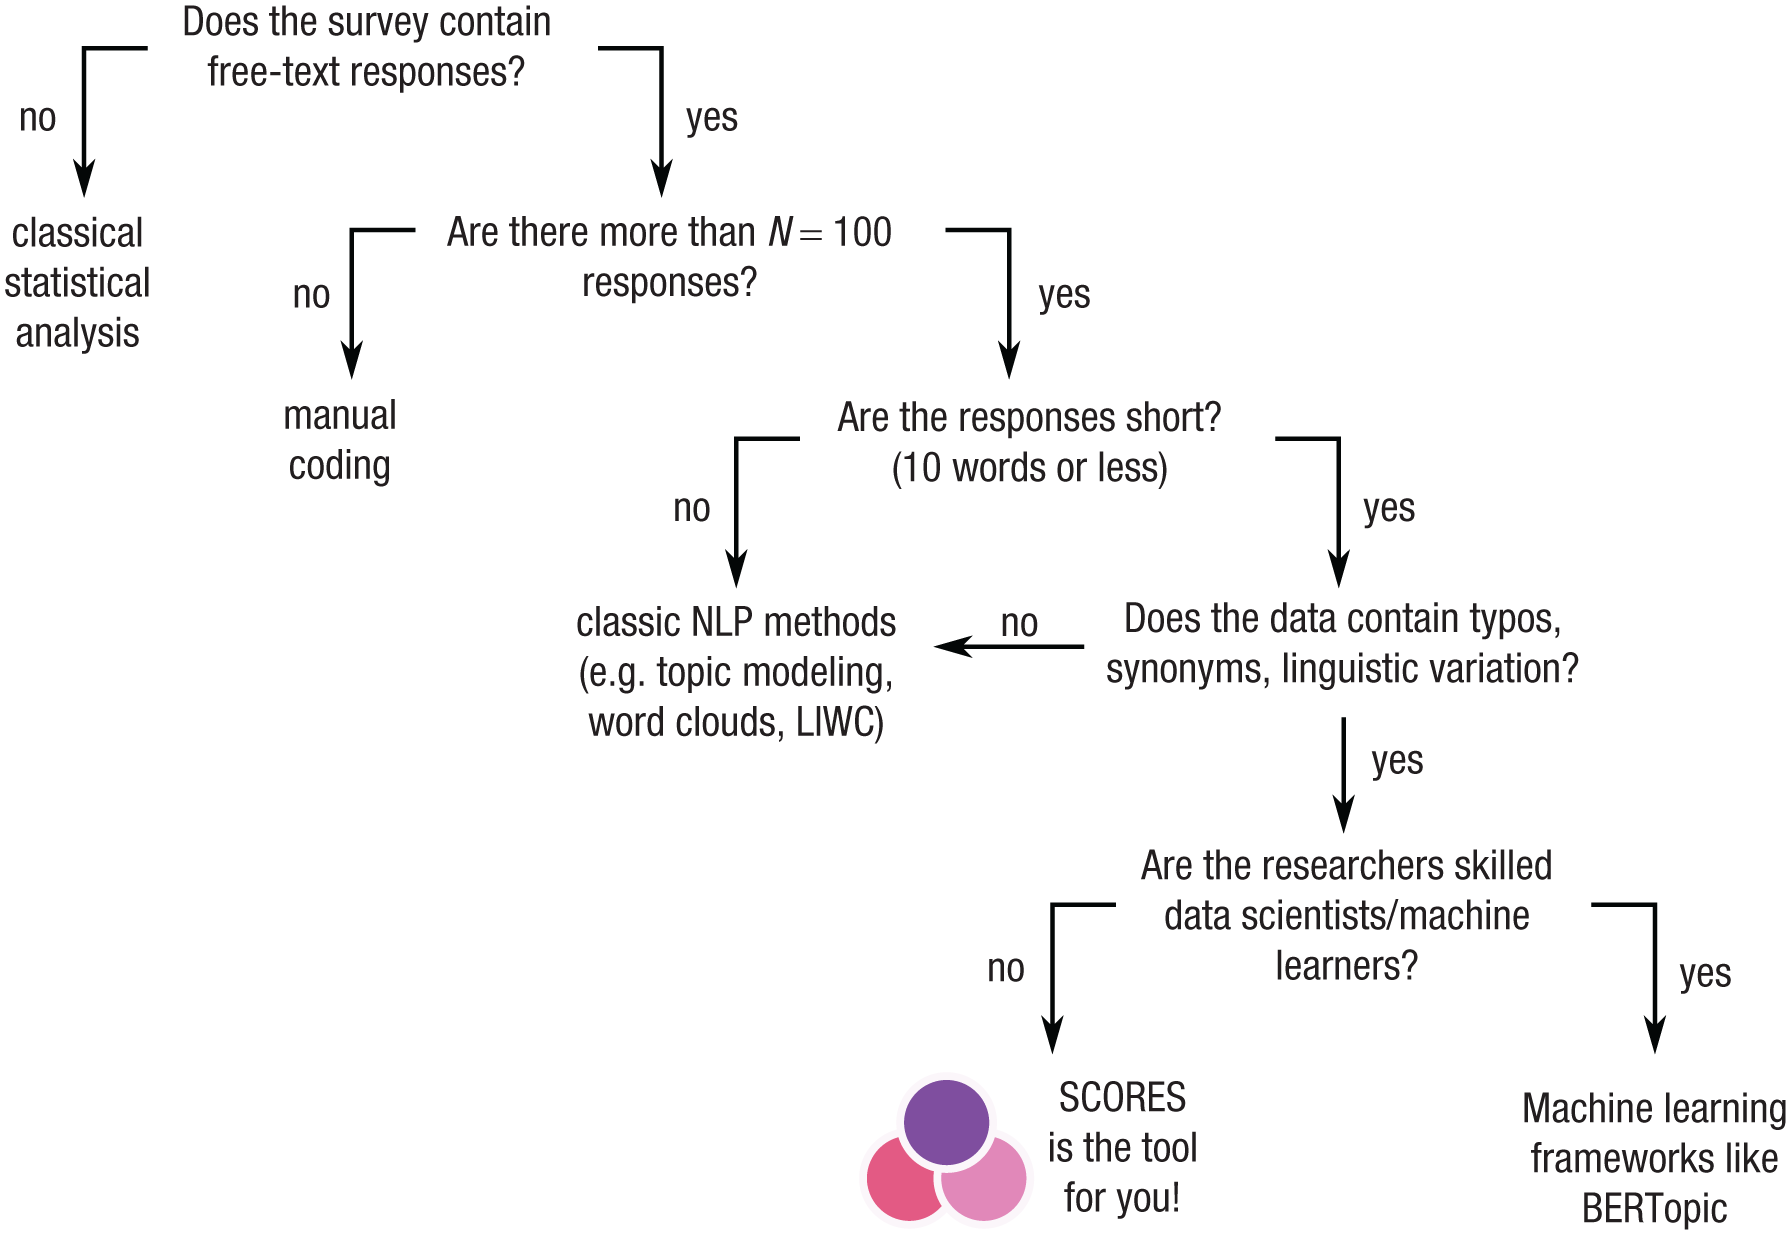
Decision schema to decide whether to use SCORES (Semantic Clustering of Open Responses via Embedding Similarity) to analyze a survey.
Related Work
To our knowledge, there is no current alternative for an embedding-based text-clustering software with a graphical user interface. Prior software has focused on dictionary-based processing of text (Boyd et al., 2022; Tausczik & Pennebaker, 2010) or differential language analysis, which uses supervised-machine-learning methods to identify words and topics that predict discrete variables (e.g., group membership) or numeric variables (Kern et al., 2016; Schwartz et al., 2013). Such software is particularly useful for large-scale text corpora (i.e. massive social media data sets with millions of posts or long text responses with multiple paragraphs) in which topic modeling, dictionary-based approaches, or open-vocabulary methods can be applied. By contrast, our work focuses on studies with a few hundred to thousand participants (i.e., typical sample sizes in psychology) and short free-text responses in which the vocabulary may be highly diverse but semantically overlapping.
Most related to SCORES are prior approaches that also use embeddings as basis for clustering. These have also been described as “neural-topic models” and have been extensively validated and used since the development of neural networks for text embedding (e.g., see the reviews of Feuerriegel et al., 2025; Wu et al., 2024; these reviews also discuss the difference between classic-topic modeling and neural-topic modeling). For example, Nicolas et al. (2022) introduced a spontaneous stereotype-content model in which they first embed free-text responses via word embeddings and then perform k-means clustering with the number of clusters identified via cluster-quality metrics. SCORES is built on this approach but substantially refined: We employ state-of-the-art embedding methods, perform outlier detection before clustering, and refine the clustering via agglomerative clustering. With these refinements, our approach can also be seen as a simplified version of BERTopic, which is intended for topic modeling on documents via language model embeddings (Grootendorst, 2022). BERTopic defines the sequence of steps for topic modeling as embedding, dimensionality reduction, clustering, and three more steps to automatically name each topic. SCORES uses the same embedding step as BERTopic but avoids dimensionality reduction because the similarities produced in the embedding step would be changed, that is, points that are close according to the embeddings may seem farther apart after dimensionality reduction and vice versa, complicating the interpretation of similarities even beyond the difficulty inherent to embedding models (Feuerriegel et al., 2025). Accordingly, SCORES has to use a clustering scheme compatible with high-dimensional data, in this case, spherical k-means (Hornik et al., 2012), which BERTopic states as an alternative approach (Grootendorst, 2022, p. 2). SCORES avoids the last three steps of BERTopic (tokenization of topics, weight tokens, and representing topics with one or multiple representations), which are intended to give names to each cluster. Instead, SCORES simply labels each cluster with the most central response. By reducing the number of processing steps, SCORES makes it easier for researchers to understand and control the procedure while keeping the core functionality of BERTopic intact. More importantly, SCORES provides a graphical user interface and additional guidance for each function inside the user interface and multiple views for interpreting the output, requiring no programming or natural-language-processing skill.
A final category of existing tools uses large language models (LLMs) to perform text-analysis tasks, such as annotation, coding, or classification (Hussain et al., 2024; Kostikova et al., 2025). By contrast, SCORES uses comparably small language models (on the order of ≈100 million parameters compared with ≈100 billion parameters for current LLMs) for text embedding such that SCORES can be run on a standard computer, avoiding some of the privacy and energy-usage concerns of LLMs (Khowaja et al., 2024). Second, SCORES limits the interpretability concerns of language models (Feuerriegel et al., 2025) by using them for only the first step of the procedure, that is, embeddings. Every subsequent step is performed with well-established and interpretable clustering algorithms, that is, K-means (Jain, 2010) and agglomerative clustering (Ackermann et al., 2014).
Background: text embeddings and cosine similarity
To determine which responses should be assigned to the same cluster, SCORES relies on two core concepts from computational linguistics and machine learning, that is, text embeddings and cosine similarity, which are described in turn. First, a language model is used to translate each response into an array of several hundred numbers (a so-called embedding vector). Such language models are trained to auto-complete text with missing words and to generate similar embeddings for texts that should be similar according to the training data while generating dissimilar embeddings for texts that should be dissimilar according to the training data. Importantly, language models are trained to generalize across typos, synonyms, and other forms of linguistic variability, meaning that SCORES can be applied to raw free-text responses without the need for preprocessing or data cleaning. Thereby, SCORES (just as BERTopic; Grootendorst, 2022) exceeds the flexibility of predefined dictionaries. Unfortunately, the single numbers inside embedding vectors do not have a direct interpretation (Feuerriegel et al., 2025). Accordingly, SCORES does not use the embedding vectors directly but instead computes similarities between vectors in the sense that free-text responses with similar embeddings will be put in the same cluster. More specifically, SCORES uses the cosine similarity, the most common similarity measure between embeddings (Muennighoff et al., 2023). Roughly speaking, the cosine similarity measures the cosine of the angle between two embedding vectors on a scale from −1 to +1 in which higher numbers indicate more similarity. For example, in our example data set, the cosine similarity between “laborers” and “hard worker” is 0.90, indicating strong similarity, whereas the similarity between “laborers” and “narrow-minded” is 0.82, indicating lower similarity. The example also illustrates that values tend to be high in general; values below 0.50 are rare. When interpreting cosine similarities, we recommend comparing values relative to each other rather than interpreting absolute values because the absolute values may change depending on the embedding model or the specific data set. In other words, we recommend statements such as “‘laborers’ is more similar to ‘hard worker’ than to ‘narrow-minded’ (because 0.90 > 0.82)” rather than “‘laborers’ is similar to ‘hard worker’ (because 0.90 is close to 1).”
To compute embeddings, SCORES uses language models that are trained specifically to produce similarities that align with human similarity judgments on a wide variety of data sets. In particular, SCORES relies on the Massive Text Embedding Benchmark (MTEB; Muennighoff et al., 2023), which regularly evaluates language models regarding their performance on classification, clustering, or retrieval benchmarks using their embedding similarity. At the time of development, the best-performing model in MTEB (in terms of the clustering ranking) was BAAI/bge-large-en-v1.5 (Xiao et al., 2024), which was also used by Morgenroth et al. (2024). The current default model in SCORES is intfloat/multilingual-e5-large-instruct (Wang et al., 2024), which performed best at time of submission among all models that run on the central processing unit of a regular consumer-grade computer (we operationalized this as limiting the selection to language models smaller than 1 billion parameters). Researchers also have the option to use a different model in the “Advanced Settings” (Fig. 3), for example, if a model is trained for a specific language or if substantially better-performing models are released in the future. We recommend that researchers document the choice of language model in their analysis for reproducibility purposes.
Tutorial
Below, we walk through an example of a full clustering process, reproducing the analysis of Morgenroth et al. (2024), who used open-response data to examine stereotypes of upper-class and lower-class White groups in the United States. Participants listed 10 stereotypes for a group that was randomly assigned to them. We use this example to illustrate the different functions of SCORES and provide evidence for the interpretability of the results.
Data loading and setup
When starting SCORES for the first time, researchers are asked to download a language model. This can be done by clicking on “Download” next to the model researchers wish to use; “intfloat/multilingual-e5-large-instruct” is the recommended default.
SCORES requires input in the form of a CSV table in which responses (typically participants) are rows and items (variables, e.g., open responses) are columns. Such tables can be exported from data-processing software, such as Excel, SPSS, R, and Python. In our example, we use the “lower class data.csv” from Morgenroth et al. (2024), available at https://raw.githubusercontent.com/ReylordDev/SCORES/refs/heads/main/example_data/lower%20class%20groups.csv. Researchers may want to keep the full data set for clustering or split the file based on predictor variables, for example, depressed versus nondepressed participants or participants who have undergone some treatment versus participants who have not. SCORES will show the table and let researchers select the columns to be considered for clustering (Fig. 2). Importantly, typical preprocessing steps for text processing, such as spell-checking or stemming, are not required in SCORES. In our example, we used the raw data as provided by study participants and selected the “Stereotype 1” to “Stereotype 10” columns for analysis.
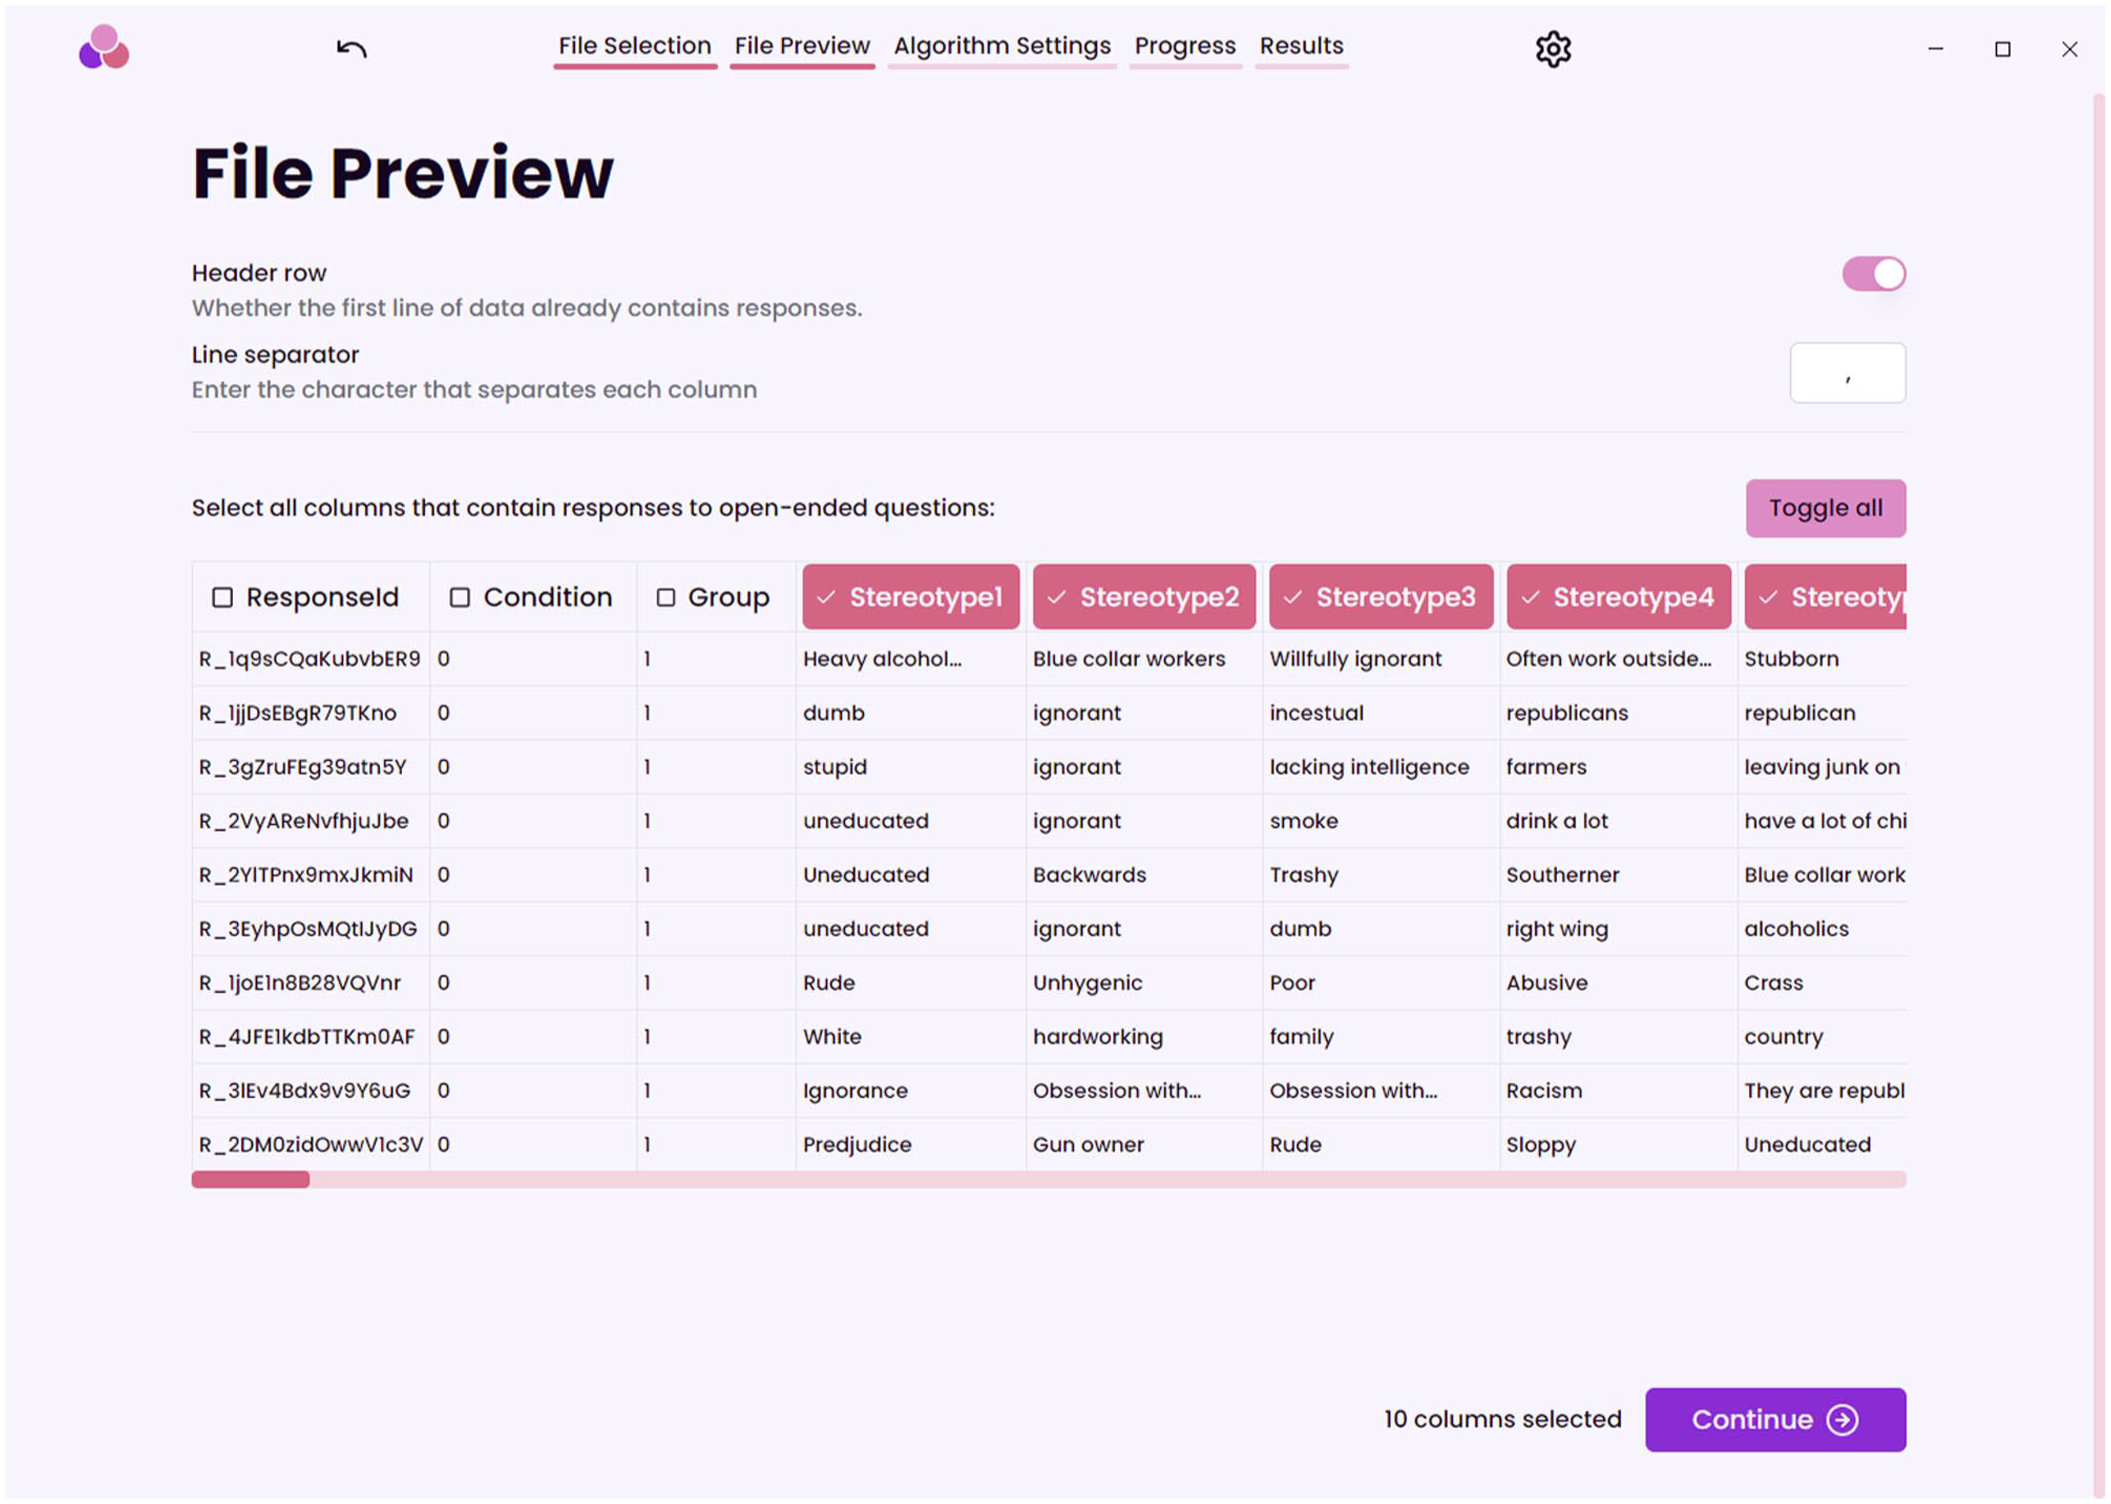
An image of the file preview in SCORES (Semantic Clustering of Open Responses via Embedding Similarity) and which columns are selected for clustering.
Next, SCORES lets the researchers decide the parameters for the cluster analysis, such as the desired number of clusters, words that should be excluded from analysis, the threshold for outlier detection, and the threshold for merging similar clusters (Fig. 3). By default, a tutorial mode is enabled that gives users in-depth explanations of each setting and advice on reasonable values.
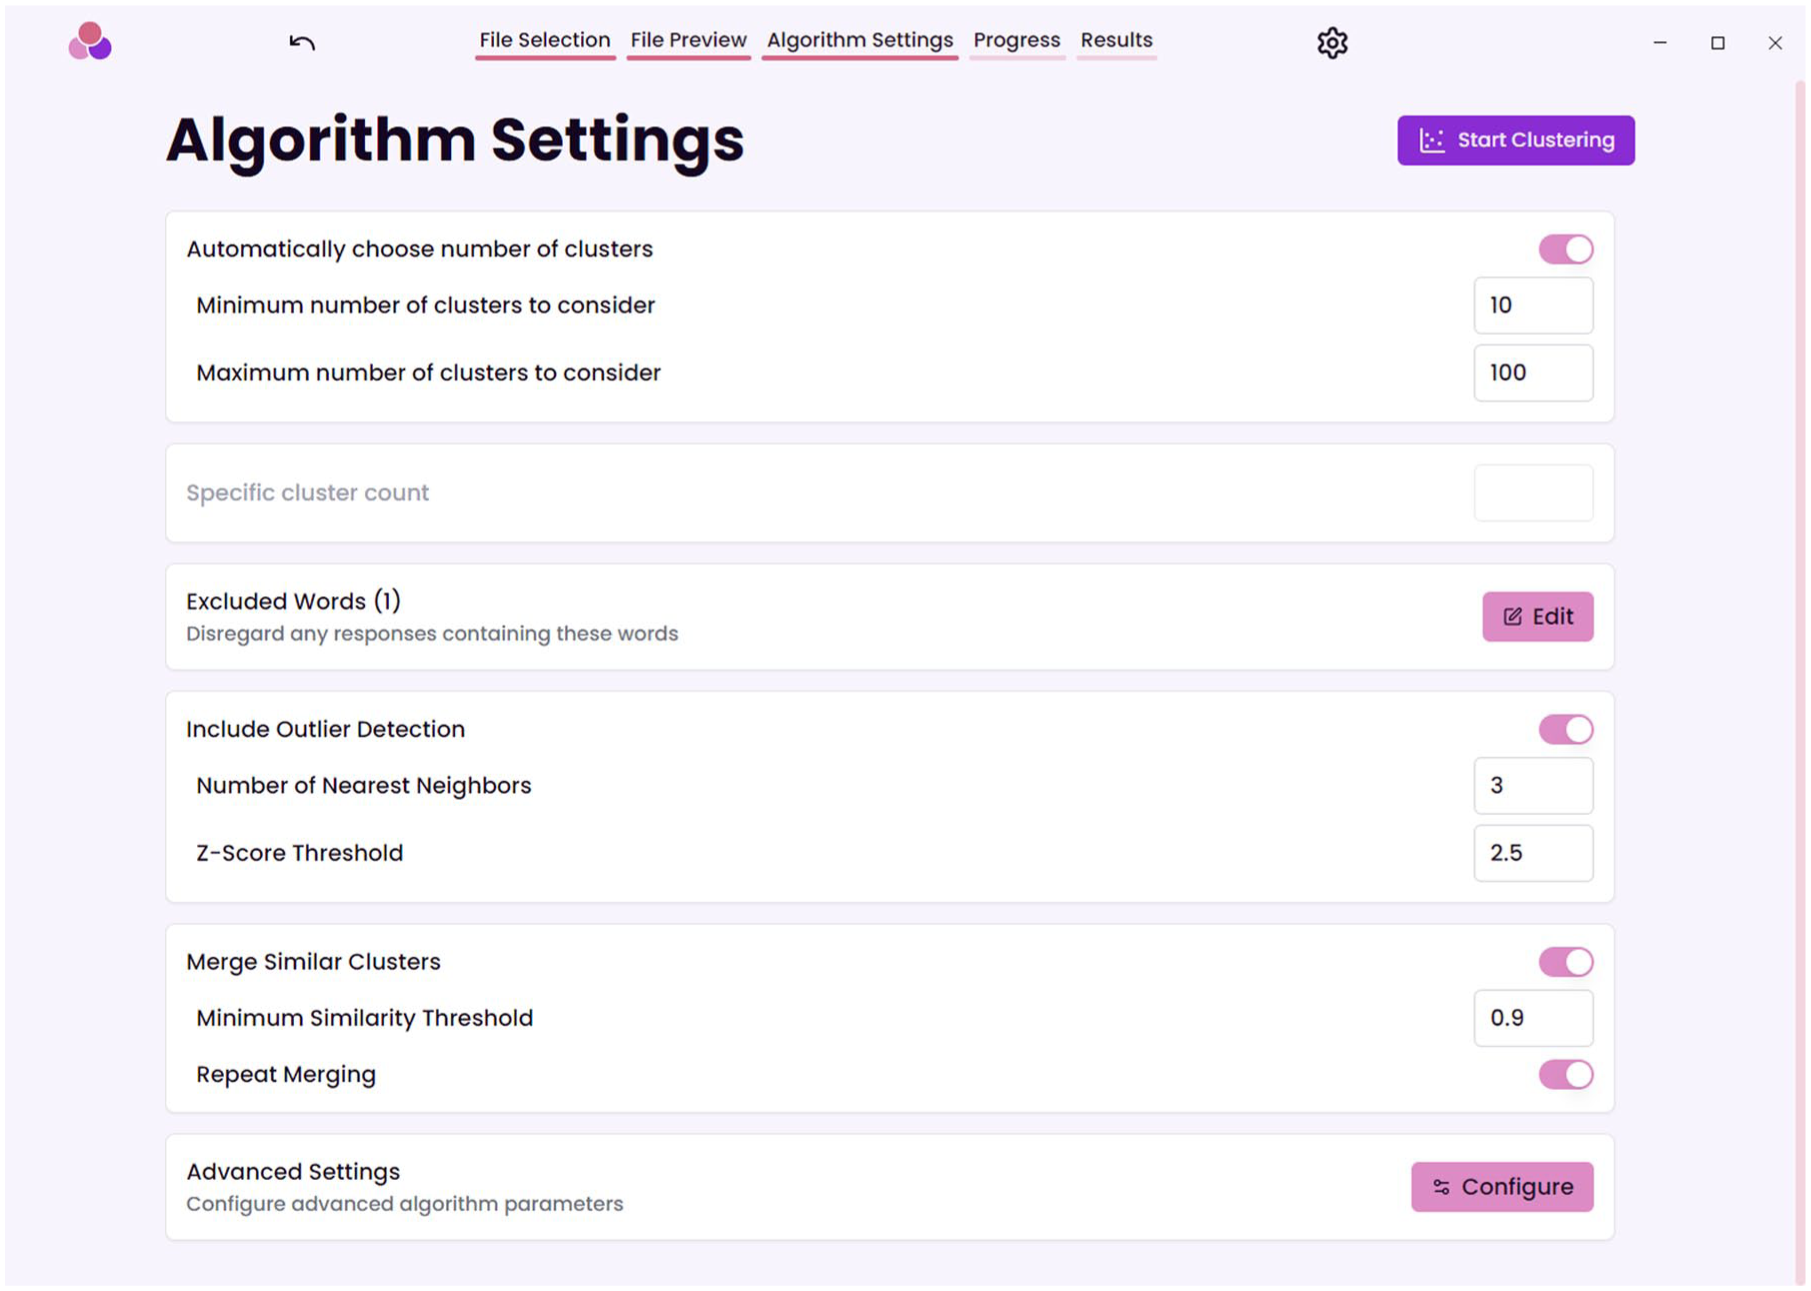
The algorithm settings of SCORES (Semantic Clustering of Open Responses via Embedding Similarity).
Once the parameters are selected, SCORES starts processing the data and will present the result in multiple views that are intended to support researchers in interpreting the results and guide their choices in adjusting the parameters and running the clustering again: “Response Outliers,” “Cluster Assignments,” “Merged Clusters,” and “Cluster Similarities.” In the following sections, we cover these views and how they help to make algorithmic choices.
Response outliers
The goal of clustering is to group responses with similar embeddings. However, the clustering process can be complicated by responses that are dissimilar to most responses and therefore do not fit into any cluster. We refer to such responses as “outliers.” SCORES defines outliers as responses that are substantially more dissimilar to their closest neighbors compared with the average response. More specifically, SCORES computes the mean cosine similarity of each response to its k closest neighbors (i.e., the k responses with the highest cosine similarity, in which k is set by the researcher). Then, SCORES computes the mean and standard deviation of those mean cosine similarities and removes all responses at least z standard deviations below the mean. Note that we recommend k > 1 to ensure that SCORES can still identify outliers if they have synonyms in the data (e.g., “I don’t know” and “don’t know”).
The number of nearest neighbors k and the threshold for outlier detection z can be set by the researchers in the algorithm settings (Fig. 3). Setting the threshold lower will exclude a larger number of responses, and increasing the number of neighbors means that larger groups of responses may be classified as outliers, which can be useful if the same outliers occur in slightly different words (e.g., in very large data sets). The default parameters are quite conservative to include as many points as possible. We advise to decrease z and inspect the “Response Outliers” view for unwanted exclusions (see Fig. 4). SCORES lists the data points closest to the decision boundary first, simplifying the decision. In our example, for z = 1.5 and k = 3, 65 responses were excluded (Fig. 4). These included uncommon but potentially meaningful responses, such as “a comb in their back pocket,” and nonsensical responses, such as “honestly can’t think of any others.” Importantly, the outliers are not removed from the primary data. They merely are ignored for clustering.

An image of the outlier detection overview in SCORES (Semantic Clustering of Open Responses via Embedding Similarity) for our example.
Cluster assignments and cluster-count visualization
SCORES groups responses into clusters (i.e., the equivalent of coding categories in manual coding) using K-means clustering. K-means is a well-established clustering method (Jain, 2010) and has been recommended for clustering of free-text responses (Nicolas et al., 2022). Before clustering, the number of desired clusters K must be set by the researcher in the algorithm settings (Fig. 3). Then, K-means clustering (1) selects K random responses inside the data set, which serve as the initial cluster means; (2) assigns each response to the closest mean via the cosine similarity, thus forming clusters; and (3) computes new cluster means as the average embedding of all points in the respective cluster. Steps 2 and 3 are repeated until the clusters no longer change.
To support interpretation, SCORES automatically names each cluster according to the data point closest to its center (Fig. 5).
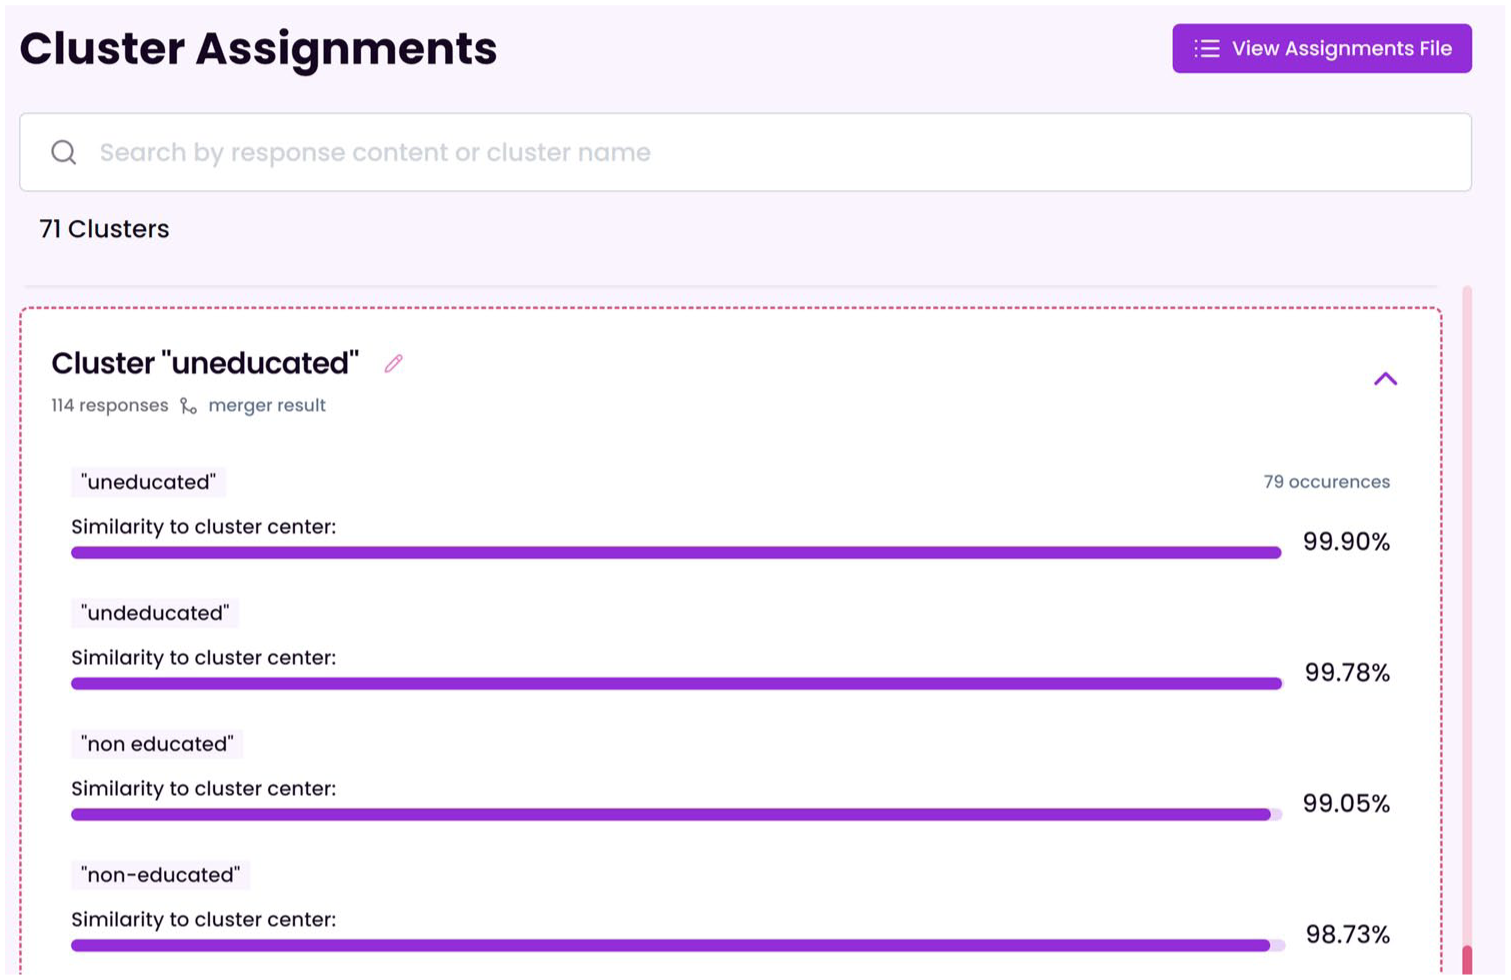
The “Cluster Assignments” view in SCORES (Semantic Clustering of Open Responses via Embedding Similarity) showing an example cluster that has been named “uneducated” based on the response closest to its mean.
One criticism of K-means clustering is that it becomes unreliable in high-dimensional spaces (e.g., the embedding spaces used in SCORES), meaning that repeated clustering leads to very different results (Hornik et al., 2012). To alleviate this issue, SCORES does not use distances for clustering but cosine similarities, which are more suitable for high-dimensional spaces and for which the embeddings are specifically trained (see above). This approach is inspired by spherical K-means (Hornik et al., 2012), a variant of K-means designed for high-dimensional data. Still, researchers should be aware that K-means may get stuck in undesirable, suboptimal cluster solutions in these high-dimensional spaces and should review the clustering result (we provide an example for cluster interpretation below). Many low-similarity responses being clustered together indicate a suboptimal clustering, and the clustering should be rerun.
Another challenge of K-means is how to choose the number of clusters K (Jain, 2010; Schubert, 2023). In line with Nicolas et al. (2022), SCORES supports researchers in finding the right K by trying out several values and computing quality metrics for each K. In particular, SCORES computes the silhouette, Calinsky-Harabasz, and Davies-Bouldin metrics, which are among the best performing in the evaluation of Schubert (2023) and have complementary strengths for more uniform data distributions. The metrics are combined with default weights 40%, 40%, and 20%, respectively, emphasizing the better-performing metrics more. After the clustering run, the quality metrics are plotted against in the cluster-count visualization (see Fig. 4) to help researchers select the K that optimizes the metrics. Still, we note that all metrics tend to overestimate the number of optimal clusters in our tests, which is one reason we introduce a cluster-merging step below.
Using the outlier settings mentioned above, we found that SCORES identified 98 clusters as optimal for our example data set (Fig. 6).
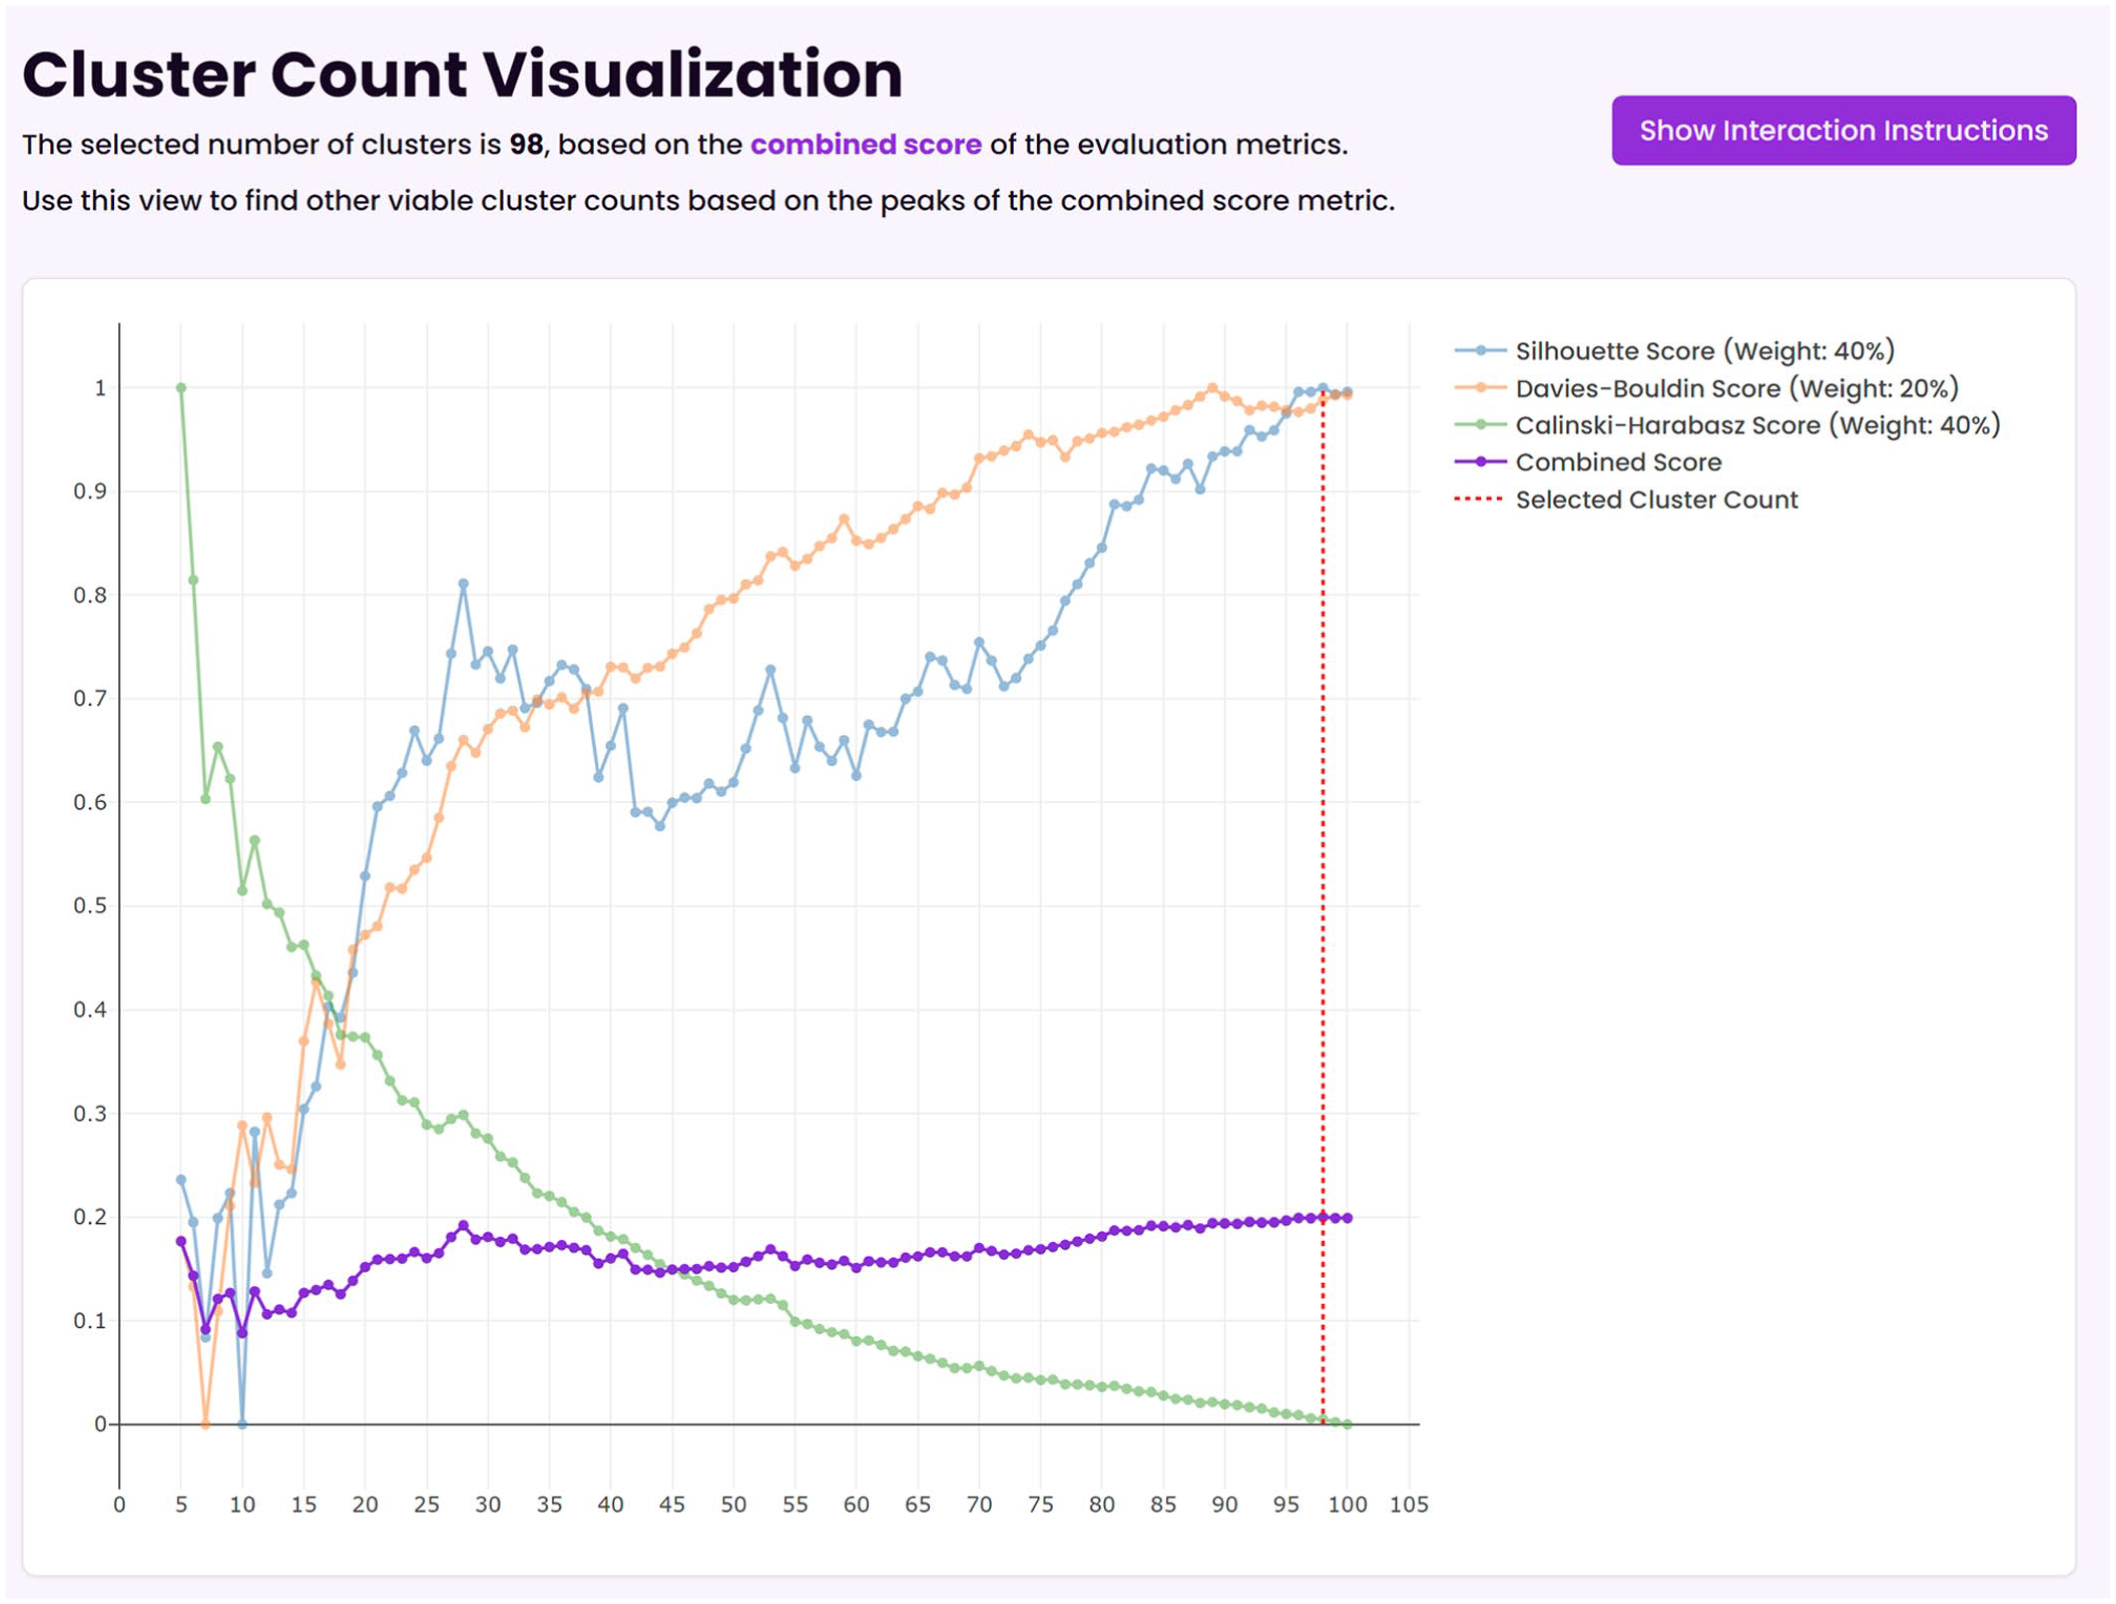
The cluster number index in SCORES (Semantic Clustering of Open Responses via Embedding Similarity) for our example, indicating that 98 clusters are optimal.
Merged clusters and cluster similarities
K-means may return many clusters with overlapping semantics and correspondingly, high cosine similarity. For example, one cluster in our data was titled “love of guns,” and another was titled “gun owner,” with a cosine similarity of 0.97 between the respective means. Therefore, SCORES offers the option to merge clusters if the cosine similarity between their means exceeds a predefined threshold (Fig. 7). The merging is performed via agglomerative clustering (Ackermann et al., 2014), which ensures that clusters with the highest cosine similarity are merged first. Researchers can choose the threshold for merging. To support researchers in making these decisions, SCORES provides an overview of the similarity between clusters. A lower threshold will result in fewer, larger, and more heterogeneous clusters, whereas a higher threshold will result in a higher number of smaller, more homogeneous clusters.

The “Merged Clusters” view in SCORES (Semantic Clustering of Open Responses via Embedding Similarity), showing that two similar clusters were merged.
SCORES provides the “Merged Clusters” view and the “Cluster Similarities” view to support researchers in setting the threshold. In our example, we first applied merging with a threshold of 0.90 (the default parameter) and then inspected the “Merged Clusters” view to find that two semantically distinct clusters with the content “untrustworthy” and “reckless” had been merged at a similarity of 0.951. Therefore, we increased the merge threshold to 0.952. However, increasing the merging threshold also means that semantically overlapping clusters remain. In our example, the “Cluster Similarities” view revealed that “missing teeth” and “toothless” remained in separate clusters (Fig. 8), and we would have needed to reduce the threshold below 0.948 to merge them. In this example, we kept the threshold at 0.952 to avoid merging distinct clusters. This still reduced the number of clusters from 98 to 71.

The cluster similarities view in SCORES (Semantic Clustering of Open Responses via Embedding Similarity), showing that two separate clusters for “missing teeth” and “toothless” remain that would be merged at a threshold of 0.95.
Interpretation of clusters
To illustrate the interpretability of the resulting clusters, Table 1 shows the five largest clusters in our example using the settings documented above. As shown in Table 1, the clusters make intuitive sense. Four out of five clusters in Table 1 specify a category, and contained words are either synonyms or closely related (e.g., “poor” and “low income”). The fact that such related (but not equal) words, including typos, are reliably grouped together illustrates the strength of clustering based on language models as performed by SCORES. For the cluster “strong,” we note that less related words are still clustered (e.g., “strong,” “smart,” and “loyal”) and that the most central response is not necessarily representative of the overall cluster. This cluster illustrates that SCORES may cluster words that are used in similar textual contexts (in this case, positive descriptors) but may need to be treated separately (e.g., by setting the merge threshold even higher or subdividing the data).
Five Largest Clusters and Their Five Most Central Responses for Lower-Class Groups
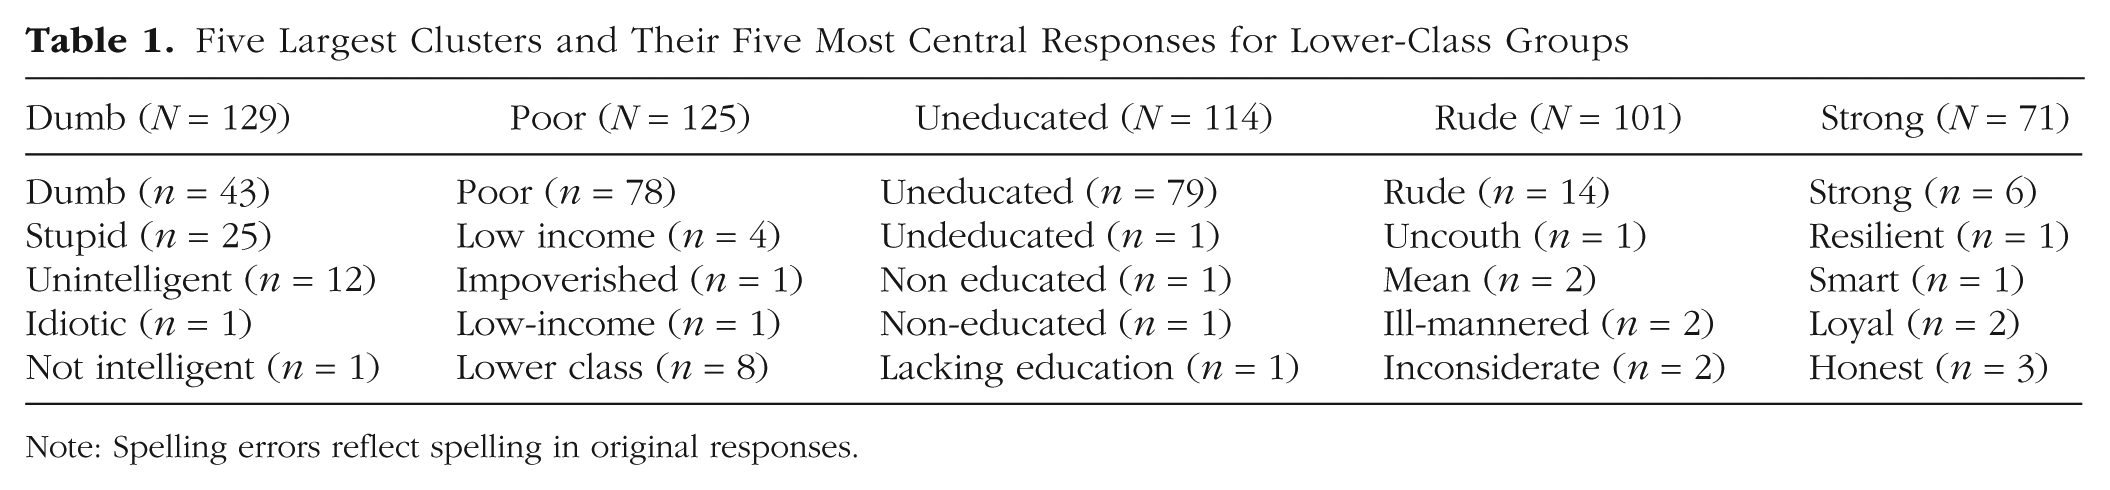
Note: Spelling errors reflect spelling in original responses.
To be a useful tool for psychological researchers, SCORES should produce not only interpretable clusters but also meaningful clusters, for example, in the sense that they reflect meaningful differences between groups. Comparing the most common clusters of the “lower class” condition with the largest clusters of the “upper class” condition (see Table 2) shows that this is indeed the case. Not only are the top clusters different (except for “rude,” which overlaps), they also reflect what would be predicted by psychological theory (in this case, the stereotype-content model; Fiske et al., 2018): Lower-class clusters reflect a lack of competence (illustrated by the clusters “dumb” and “uneducated”), and upper-class clusters reflect competence (“dominant,” “educated”) but a lack of warmth (“rude” and “selfish”).
Top Clusters and Responses for Upper-Class Groups
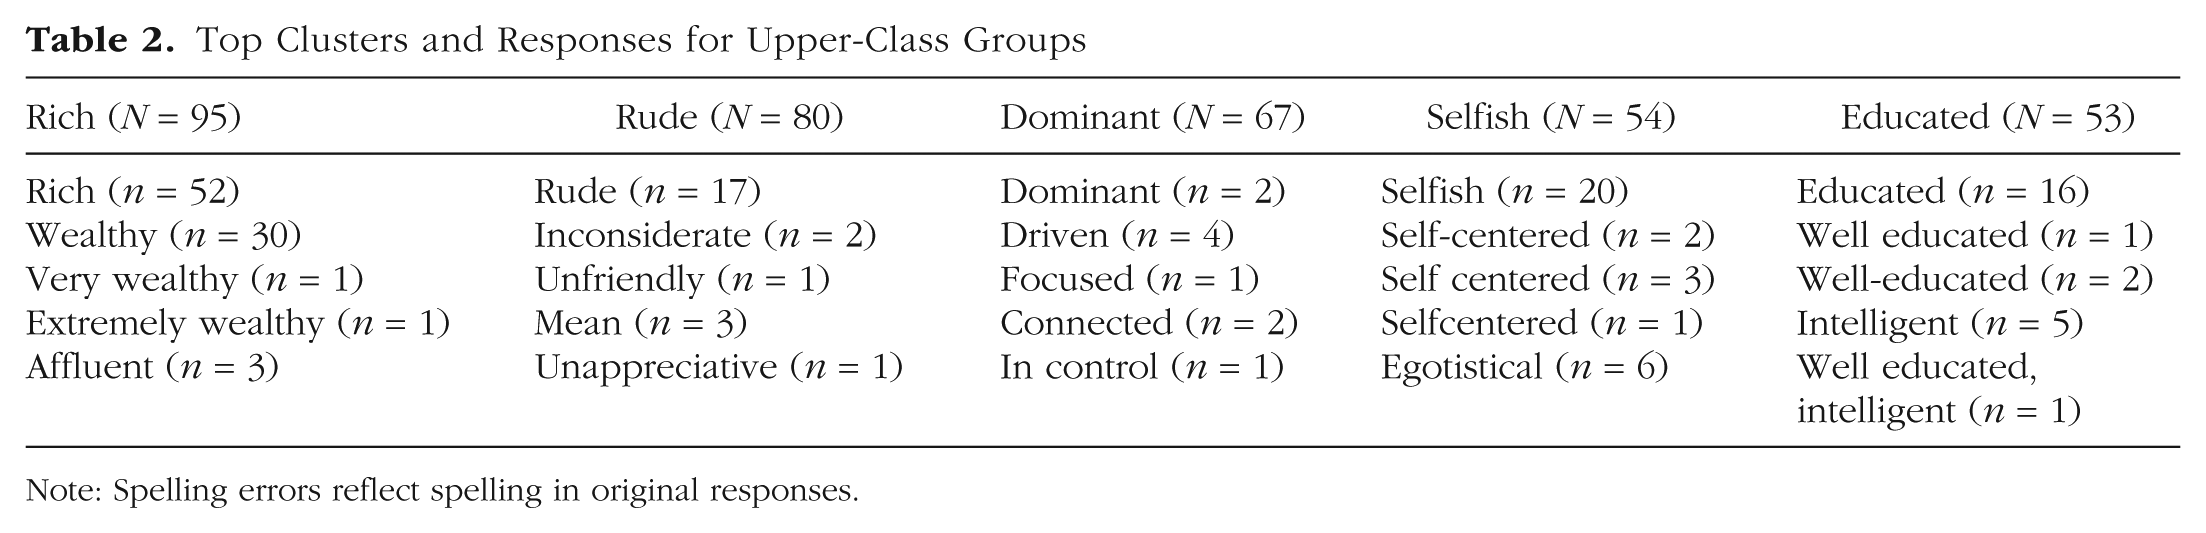
Note: Spelling errors reflect spelling in original responses.
Output files for subsequent analysis
To support subsequent analysis of clustering results, SCORES stores the results of the cluster analysis in two CSV files: one file containing the cluster assignments and one file that augments the input file with one additional column per free-text response column containing the corresponding cluster index for each response.
Limitations
SCORES is not without limitations. First, embeddings produced by language models typically reproduce human biases and stereotypes, such as associating gender with stereotypical professions (Bolukbasi et al., 2016). For example, with the intfloat/multilingual-e5-large-instruct embedding model, the cosine similarity between “woman” and “nurse” is 0.88, but the cosine similarity between “woman” and “surgeon” is only 0.84. Second, embeddings sometimes struggle with opposite words that are nonetheless related (Fodor et al., 2023). For example, the cosine similarity between “uneducated” and “educated” is 0.91, and the cosine similarity between “republican” and “democrat” is 0.95. Such undesired similarities necessarily affect the resulting clusters of SCORES and, hence, need to be considered when interpreting the clustering. Third, SCORES does not produce perfectly reproducible outcomes. The K-means clustering may yield slightly different clusters each time because of randomly changing initial conditions—although the core clusters tend to be consistent across repeated analyses. We note that these limitations are not specific to SCORES but affect any tool that performs clustering on embeddings (e.g., BERTopic). Fourth, and more specific to SCORES, we acknowledge that SCORES does not incorporate the full flexibility of more extensive neural-topic-modeling frameworks, especially BERTopic. Instead, SCORES is deliberately limited to a specific, simplified sequence of steps (most importantly, embedding and clustering), which makes the sequence of steps easier to understand and control for researchers without extensive data-science and machine-learning knowledge but at the price of being limited to a specific clustering scheme.
Conclusion
We introduced SCORES, a graphical user interface to cluster free-text responses across a wide range of psychological-research fields. Although we focus on exploratory data analysis, SCORES also supports comparisons between populations and checking theoretical predictions against empiric results. We designed SCORES to be as transparent as possible (up to the inherent interpretability limitations of embedding models; Feuerriegel et al., 2025), giving researchers insight and control over every individual step of the clustering process, thus enhancing interpretability and reproducibility even when supported by this automated and machine-learning-based method. We hope that SCORES will enable a wider range of psychological researchers to make use of the richness of open responses regardless of their resources and programming skills.
Footnotes
Transparency
Action Editor: David A. Sbarra
Editor: David A. Sbarra
Author Contributions