
Abstract
Accurately measuring, reporting, interpreting, and evaluating identity categories in social-science research is essential; however, check-all-that-apply (CATA) responses present methodological challenges because of the large permutations of categories and the fluctuating salience of intersecting identities across time and contexts. These challenges can hinder the validity of quantitative studies, particularly those examining racial, ethnic, and other social-identity differences. Although quantitative-critical-race-theory scholars have proposed principles for handling racial and ethnic categories in quantitative research, their application in statistical analyses remains limited. In this article, we introduce CATAcode, an R package designed to assist researchers in exploring and preparing CATA demographic items for statistical modeling. By applying this tool to cross-sectional and longitudinal data, in the tutorial, we demonstrate how CATAcode can enhance the generalizability, transparency, and reproducibility of social-science research. Improving the rigor of demographic measurement is essential for identifying and addressing social inequalities, allocating resources, and understanding broader patterns of marginalization.
Keywords
Over the past 30 years, there has been a significant shift in how people can self-identify their racial identity (Woo et al., 2011). This shift has been shaped by political and policy developments that expanded individuals’ ability to self-identify with multiple racial categories. Before a 1997 directive from the Office of Management and Budget (OMB), the U.S. census required multiracial individuals to choose only one racial identity, forcing them to pick the race they most identified with or select a generic “other” category. Following the OMB directive, federal agencies revised their racial-identification questions to allow individuals to choose more than one race, aiming to better reflect the complexities of racial identity (Mays et al., 2003; Perlmann & Waters, 2002; U.S. Census Bureau, 2001). The 2000 U.S. census was the first time individuals could self-identify as belonging to multiple racial groups (e.g., Black and White; U.S. Census Bureau, 2001). Following this change, the research community adopted the new approach, allowing respondents to select multiple races. Charmaraman et al. (2014) reviewed how studies measured multiracial identity from 1990 to 2009 and found that all 37 studies that included race items permitting multiple responses were published in 2000 or later. This evolution in how racial identity is measured has contributed to notable shifts in racial self-identification in the United States since 2000, characterized by an increase in the number of Americans who identify as multiracial compared with Americans identify as monoracial (Agadjanian, 2022). Specifically, from 2010 to 2020, the multiracial population in the United States grew by 276%, increasing from 9 million to 33.8 million people over the decade (U.S. Census Bureau, 2020). These changes are linked to several factors, including shifts in the demographic composition of the United States, reassessment of identity prompted by the popularity of ancestral genetic testing, and changes in the measurement of race that allow for multiple responses (Viano & Baker, 2020). Given these developments, researchers must determine the best way to capture and measure racial- and ethnic-identity membership in check-all-that-apply (CATA) items.
Challenges in Measuring Multiple Identities
Accurately measuring complex demographic identities is critical for examining group differences, making comparisons across studies, tracking longitudinal trends, and assessing the generalizability and reproducibility of research findings (Call et al., 2023). In their review of how studies measure race and ethnicity for administrative purposes, Viano and Baker (2020) demonstrated that allowing respondents to CATA is a common approach to capturing complex identities. However, allowing for CATA responses presents significant methodological and substantive challenges. First and foremost, CATA responses can generate a large number of permutations and combinations of categories. Furthermore, intersecting categories often fluctuate over time and across contexts as the salience of identities shifts. These complexities pose practical problems related to statistical power and precision because of limited sample sizes within subgroups (Viano & Baker, 2020). Subjective decisions to recategorize, prioritize, or merge identities into broader demographic groups for statistical modeling can significantly influence the interpretation and subsequent implications of research findings (Guluma & Saperstein, 2022) and affect policy decisions related to resource distribution (Campbell-Montalvo, 2020).
Allowing individuals to select multiple responses for self-identification offers several advantages for research, including an improved ability to capture and describe participants’ identities, examine subgroup differences, make comparisons across studies, and increase the generalizability and reproducibility of research findings (Call et al., 2023). However, measuring multiple-identity categories (CATA items) is only the first stage of the data-analytic process. Researchers face critical challenges in accurately preparing and analyzing complex identity patterns within statistical models, which have received much less attention in the literature (Viano & Baker, 2020). Despite significant demographic shifts over the past several decades, basic research has yet to address the analytical challenges posed by demographic items that allow multiple responses. Although studies may allow multiple responses for self-identification (e.g., CATA, multiple yes/no items), statistical models frequently ignore participants who select more than one category or fail to capture the fluidity of identities over time (Viano & Baker, 2020). Small subgroup sample sizes often create concerns about statistical power, so multiple categories are frequently merged into an “other” category. This common practice typically lacks a clear explanation of who the “other” category includes or what it represents, resulting in a heterogeneous group that is difficult to interpret (both culturally and statistically) and nonsensical in most contexts. Accurately capturing and describing individuals who identify with multiple categories (e.g., multiracial individuals) and documenting the strategies used to merge or prioritize categories for statistical modeling can be challenging. Furthermore, the increase in individuals self-selecting multiple categories across various identities (e.g., race, gender identity, sexual orientation) has raised concerns about how researchers can comprehensively and justly assess CATA responses (Call et al., 2023). Studies have shown that subjective coding decisions to CATA demographic items can significantly influence research findings and their implications (Dougherty et al., 2019; Guluma & Saperstein, 2022; Howell & Emerson, 2017; Shiao, 2019; Suyemoto et al., 2020).
Theoretical Framework: Quantitative Critical Race Theory
Quantitative-critical-race-theory (QuantCrit) scholars have introduced several principles and innovative approaches for measuring, reporting, interpreting, and evaluating the use of racial and ethnic categories in social-science research (Garcia et al., 2018; Gillborn, 2010). These principles are relevant to social-science research, in which accurately capturing and analyzing demographic data is essential for identifying and addressing social inequalities. Prior work in this area has primarily focused on questionnaire design, including the operationalization and categorization of demographic identities, such as race and ethnicity, with less attention to how these categories are used in statistical analyses (Viano & Baker, 2020). Inconsistencies in measuring and analyzing demographic data can introduce biases that affect estimates, subsequent recommendations, and interventions (Beaulieu, 2022; Polubriaginof et al., 2019).
QuantCrit scholars are leading this area of inquiry, critically examining current research methodologies for their superficial categorization of race and ethnicity. They argue that current methods oversimplify and overlook the intersectional nature of identities, prioritizing statistical properties such as power, precision, and parsimony at the expense of the validity and reliability of the data (Viano & Baker, 2020). QuantCrit advocates for more sophisticated, inclusive, and intersectional approaches to quantitative research that more accurately reflect the realities of diverse populations and address systemic inequalities (Viano & Baker, 2020). Our work aligns with QuantCrit scholars in our values and orientation by (a) acknowledging that the purported neutrality and objectivity of quantitative methods often overlook inherent biases in the design and interpretation of race and ethnicity data, (b) recognizing a significant lack of critical discussions about how power dynamics influence the measurement and analysis of identity that subsequently affects research findings, and (c) agreeing that quantitative research frequently neglects the structural aspects of “isms” (e.g., racism), which are essential for fully understanding the context and impact of racial and ethnic disparities (Gillborn et al., 2018). These challenges collectively hinder the ability of social-science research to accurately and comprehensively capture the complexities of race and ethnicity, underscoring the need for a more nuanced and critically informed approach.
Exploring Racial Identification Using CATAcode
To advance methods and reporting standards for researchers working with CATA demographic items, we created CATAcode, an R package designed to improve the handling of data that allow for multiple responses (Nickodem & Merrin, 2025). Aligned with QuantCrit principles, CATAcode helps researchers more easily explore and transparently document subjective decisions made when measuring and modeling identity items that allow multiple responses (Guluma & Saperstein, 2022; Viano & Baker, 2020). The tool enhances the generalizability, transparency, and reproducibility of research findings by assisting researchers in identifying, visualizing, and preparing demographic items for statistical analysis.
CATAcode works with demographic items in cross-sectional and longitudinal studies, enabling analysis of all response combinations within and across time. Although we focus on race and ethnicity in this tutorial, the tool can be applied to any identity group with CATA responses or multiple yes/no items. We also provide recommendations for transparently describing samples and documenting strategies for merging or prioritizing categories for statistical modeling, which we detail below.
Current Study
To address these challenges, in the current study, we present a series of scenarios and decisions that researchers commonly encounter when analyzing demographic items with CATA responses. We also introduce the features of CATAcode to assist researchers with managing CATA items using principled decision rules. In this article, we demonstrate the features of identifying and preparing demographic items that allow for multiple responses through examples using race variables in cross-sectional and longitudinal contexts. In addition, we provide recommendations for accurately describing and reporting sample demographics and documenting the strategies used to modify categories for statistical modeling.
In the current article, we use a tutorial-style approach, leveraging real-world data to demonstrate the challenges of handling identity items that allow multiple responses while also presenting the features and functions of the CATAcode package. We illustrate the issue of capturing multiple categories within an identity with examples from large cross-sectional and longitudinal data sets of adolescents. We then present the primary CATAcode functions that assist researchers with (a) identifying participants who endorse multiple categories, (b) generating a table that shows every identity combination in the data for both cross-sectional and longitudinal data, and (c) providing strategies for merging and prioritizing categories to create new variables that account for the identity combinations observed in the data and describing the strengths and limitations of each strategy. We conclude with implications for transparency, generalizability, and reproducibility and provide recommendations for reporting demographic data, highlight notable limitations, and suggest future directions.
We recognize that CATAcode, like any quantitative tool, requires researchers to make decisions that inherently involve power dynamics. CATAcode is not a neutral tool and does not eliminate the researcher’s power to create or alter categories. Instead, in this package and article, we encourage researchers across disciplines to center the ethical implications of categorization by making subjective decisions explicit and documenting them transparently. Specifically, CATAcode helps researchers provide more detailed descriptions of samples and approach the preparation, reporting, and use of social identities with greater care, intention, and transparency. Despite the challenges and complexities, we hope this work sparks a movement toward more transparent, equitable, and just representations of study participants’ self-reported identities.
Method
Analytic data samples
The longitudinal data sample is included in the CATAcode package when installed to R (Nickodem & Merrin, 2025), and the R script and cross-sectional data sample to reproduce the current article’s findings are publicly available on GitHub. 1
Cross-sectional sample
Baseline data were collected from 8,281 Massachusetts high school students in fall 2019 as part of a planned evaluation of a school-based bias-based-harassment-prevention program. Eleven high schools participated (10 public, one Catholic), and sample sizes ranged from 278 to 1,382. Full project data are not publicly available. Students were asked, “What is your race?” and allowed to CATA from the following list: Black/African American, Asian/Asian American, Latin American, Native American, Native Hawaiian/Pacific Islander, White, multirace, another term best describes my race (with a space to specify; renamed to “another race”).
Longitudinal sample
Four waves of data were collected from 6,442 Colorado high school students from fall 2017 to spring 2019 as part of a longitudinal randomized controlled trial of a school-based youth-wellness and suicide-prevention program called “Sources of Strength” (Espelage et al., 2024). Twenty high schools participated, and enrollments ranged from 34 to 472. Data are publicly available (Espelage et al., 2023). At each of the four waves, students were asked to CATA from the following list of racial and ethnic identities: Black/African American, Asian, American Indian/Alaskan Native (renamed to “Native American”), multiracial, Native Hawaiian/Pacific Islander, Hispanic, White.
Results/Demonstration
An initial challenge for researchers is addressing missing data. CATAcode automatically identifies participants who are missing responses to all response options for a given demographic variable. For example, 681 participants did not endorse any of the eight race/ethnicity categories in the cross-sectional data set, which reduces the analytic sample to 7,600 for this demonstration. In the longitudinal sample, all 6,442 students reported their racial identity at least once. CATAcode can synthesize the available responses despite attrition and missing data across waves (see Espelage et al., 2024).
In Tables 1 and 2, we present the raw frequencies of race/ethnicity for the cross-sectional sample and at each of the four time points in the longitudinal sample, respectively. These frequencies are not mutually exclusive and allow for multiple responses; thus, individuals may appear in more than one racial or ethnic category. However, individuals must be counted in a single category to use indicator variables (e.g., dummy variables) in statistical models. To address this issue, several coding approaches can be used to prepare demographic CATA items. CATAcode enables users to explore all combinations of the categories, aiding researchers in determining how best to handle participants who select multiple categories. This information can then be used to create new versions of the CATA variables while transparently reporting how they were altered.
Raw Frequencies and Percentages of the Check-All-That-Apply Race Variable From 7,600 Participants in the Cross-Sectional Data

Note: Total percentage is > 100% because individuals may appear in more than one category.
Raw Frequencies and Percentages of the Check-All-That-Apply Race/Ethnicity Variable at Each of the Four Waves in the Longitudinal Data From 6,442 Participants
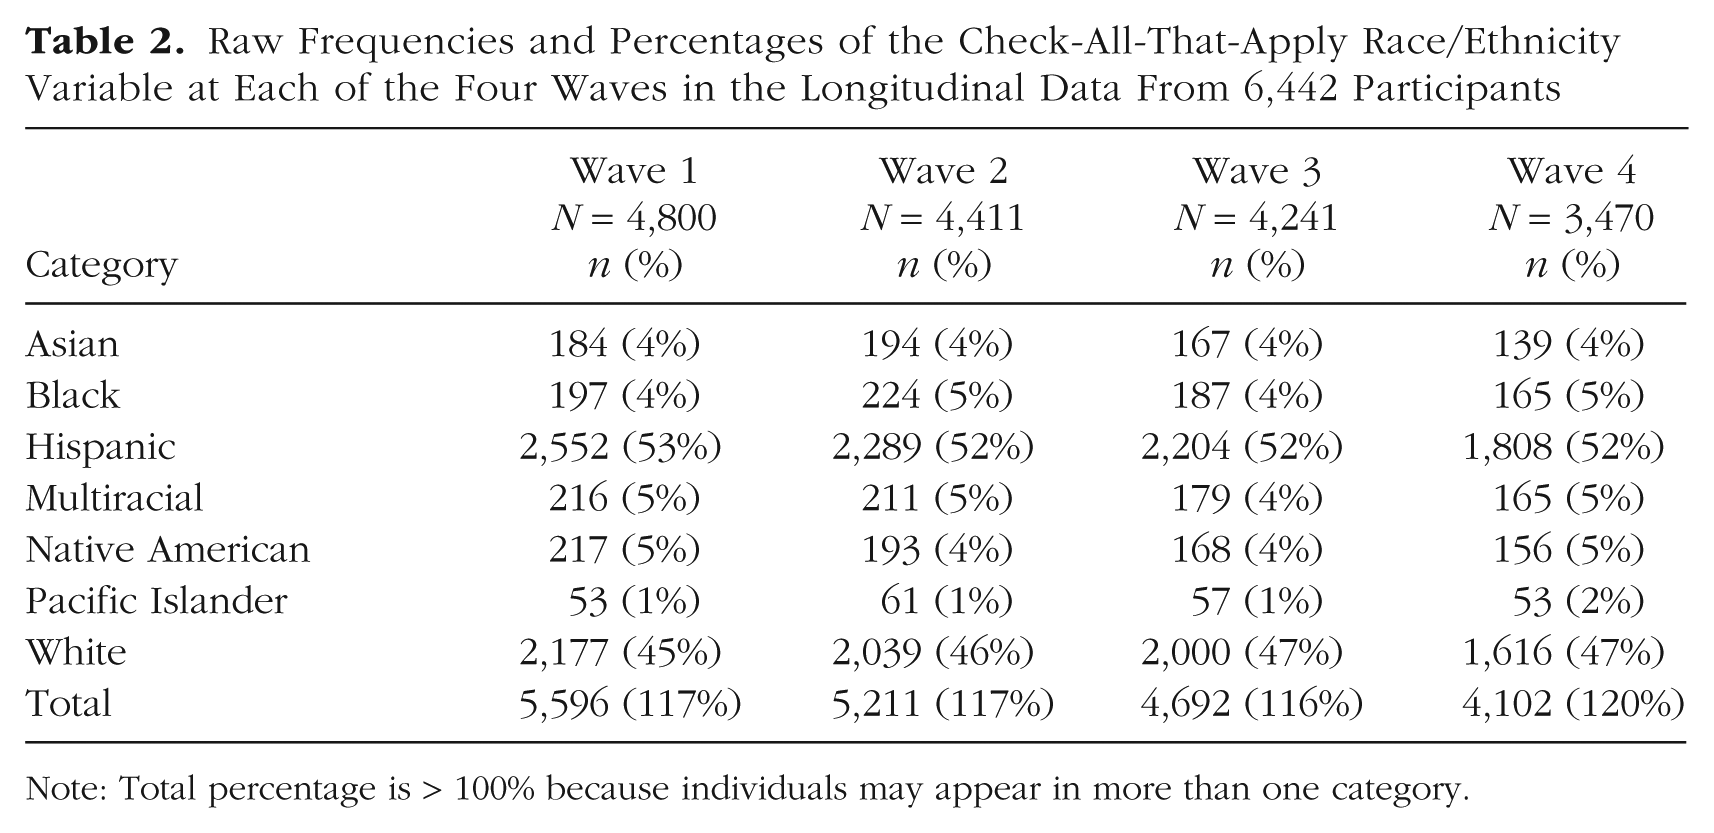
Note: Total percentage is > 100% because individuals may appear in more than one category.
Data preparation
To use CATAcode, the data must include an ID variable uniquely identifying each participant, and each race category must have its own dichotomous variable (e.g., 1/0, yes/no, true/false). This format is output by most survey software (e.g., Qualtrics, SurveyMonkey). Before using the primary cata_code function, the data must be in tidyverse verbiage (Wickham et al., 2019), which is in a longer format, with one row per id-by-category (and by time if the data are longitudinal) combination. Researchers can manually reshape their data from wider to longer or use the cata_prep function. The R code below demonstrates how to prepare the data set using cata_prep for both the cross-sectional (called “cross”):

and longitudinal data sets (called “longitudinal”):

The cols argument specifies the race categories. For the cross-sectional data, the eight binary-race variables for each category are consecutive columns and can therefore be selected using a colon (:), which selects all columns from “Black” (the first category) to “Another_Race” (the last category). If the identity categories are not consecutive, the columns can be explicitly listed within the c() function (concatenate), as shown for the longitudinal data. For longitudinal data, the time argument must be included to specify the variable name designating the wave or time point. This means that before using cata_prep, longitudinal data must be in longer format with one row per id-and-time combination. The data-frame output from the cata_prep function then includes the id and time (if provided) columns along with two new variables that by default, are labeled as the “Category” and “Response” variables, which are subsequently used in the cata_code function. If desired, these labels can be changed using the names_to and values_to arguments, respectively, in cata_prep.
Response exploration
Once the items are prepared, the cata_code function can first be used to explore all combinations of categories present in the data to inform subsequent decisions on merging or prioritizing categories for statistical modeling. The example below demonstrates how to use the cata_code function with the cross-sectional data, specifying approach = “all” to explore all category combinations:

In addition to specifying approach = “all”, the prepped data frame (“cross_prep”) from the previous step is supplied to the data argument along with the corresponding column names for the id, categ, and resp arguments. In this data set, the race variables are dichotomous, with a value of 1, indicating that the participant selected the race category. Therefore, in cata_code, we specified endorse = 1. The new.name argument allows customizing the column name in the output containing the combination of categories selected by each participant. In Table 3, we summarize the frequency of the 85 unique race combinations selected by the 7,600 participants from the eight options in the cross-sectional data. Likewise, the 6,442 participants in the longitudinal data selected 88 unique race/ethnicity combinations from the seven options; 69, 62, 62, and 57 were the unique combinations within each of the four waves, respectively.
All 85 Race Combinations Present in the Cross-Sectional Data

Note: Categories are mutually exclusive; therefore, the “Count” column sums to the N = 7,600 participants.
The “all” approach is an important exploratory step, particularly useful for researchers interested in retaining as much detail as possible by identifying intersecting categories with sufficient sample sizes to retain for further analysis. In Table 3, for instance, 45 participants identified as Black and White, and an additional 51 identified as Black, White, and at least one other group. A researcher may decide that a sample size of 96 is sufficient to code Black and White as a racial-identity group that retains nuance, although this still requires prioritizing specific identities and justifying that decision. Nonetheless, the all approach is ideal for examining identity combinations and developing a strategy or cutoff to manually collapse categories that reach a threshold for statistical modeling.
The “counts” approach is designed for longitudinal data and outputs a data frame with the number of times a participant endorsed each category. Like the all approach, the counts approach is a good starting point for exploring complexity in longitudinal data. For instance, the approach shows that 4,924 (76%) participants endorsed only one race/ethnicity category across the four waves and identifies the 32 participants who endorsed all seven race/ethnicity categories at least once in the longitudinal data. The R script using the counts approach is presented below:

Comparing coding approaches
The “multiple,” “priority,” and “mode” approaches provide structured, automated options for collapsing identity categories after all combinations have been explored and when manual collapsing is not the preferred strategy. Designed for use with both cross-sectional and longitudinal data, the multiple approach will automatically combine individuals who have reported two or more categories into the same group, which is given the name specified by the multi.name argument. Individuals who reported a single category remain in that group. For longitudinal data, individuals are collapsed into the multi.name group if they endorse more than one race at any point across all waves. The R script using the multiple approach for the race/ethnicity variables with the cross-sectional data set is presented below. Frequencies are presented in Column 2 of Tables 4 and 5 for the cross-sectional and longitudinal data, respectively:

Race Variable Frequency (%) in the Cross-Sectional Data With the Multiple or Priority Coding Approaches (N = 7,600)
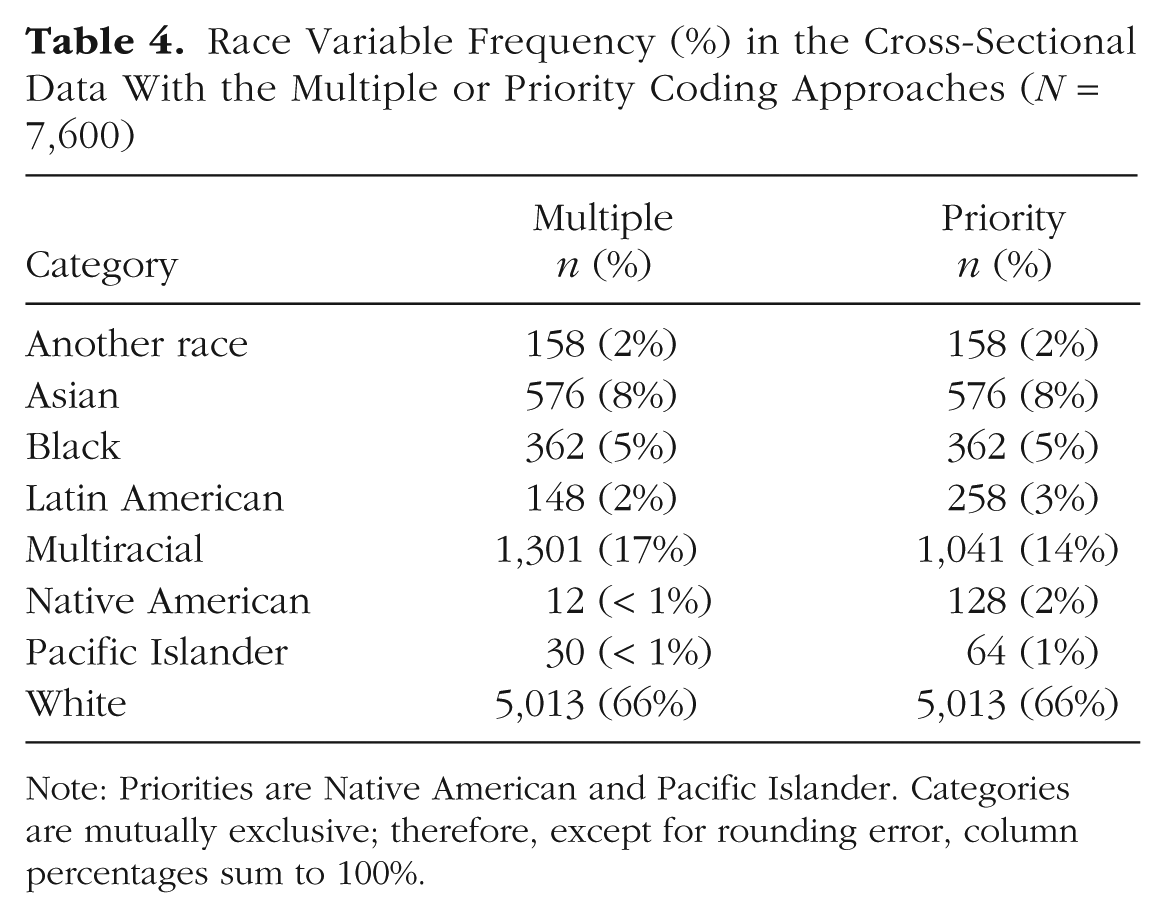
Note: Priorities are Native American and Pacific Islander. Categories are mutually exclusive; therefore, except for rounding error, column percentages sum to 100%.
Frequency (%) of Race Variable for 6,442 Participants in the Longitudinal Data After Coding Into a Single Category Using the Multiple, Priority, or Mode Approaches

Note: Categories are mutually exclusive; therefore, except for rounding error, column percentages sum to 100%.
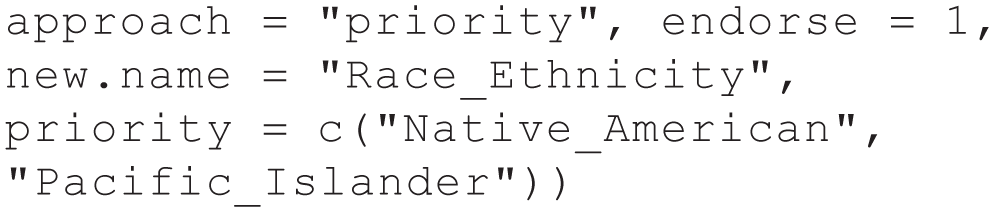
The priority approach can also be used with cross-sectional and longitudinal data, allowing users to prioritize up to four prespecified categories over others. This approach is helpful when specific groups are of primary interest or are underrepresented. Thus, the order in which the priority categories are listed matters; those listed earlier take precedence. The R script using the priority approach for race/ethnicity for prioritizing responses of Native Americans and Pacific Islanders at any time point in the longitudinal data set is presented below. Native Americans are listed first on the priority list; therefore, if a participant identified as Native American and Pacific Islander, they will be coded as Native American. Column 3 of Tables 4 and 5 displays the frequencies for the cross-sectional data and longitudinal data, respectively:

In the cross-sectional data, compared with the multiple approach, the sample size of participants coded as Native American increased from 12 (0.2%) to 128 (1.7%), and the sample size of participants coded as Pacific Islander (which does not include participants who also selected and were coded as Native American) increased from 30 (0.4%) to 64 (0.8%) when prioritizing responses of Native American and Pacific Islander, respectively, in the priority approach (Table 4). Likewise, in the longitudinal data, when we compared the multiple and priority approaches, the sample sizes of Native American and Pacific Islander participants increase from 35 (0.5%) to 445 (6.9%) and from 14 (0.2%) to 88 (1.4%), respectively. One key insight from this comparison is that in both data sets, most students who identified as Native American and/or Pacific Islander also identified with another race or ethnic group. Consequently, Native American and Pacific Islander students could easily be overlooked and analyzed as part of a combined, heterogeneous multiracial group rather than as unique groups.
The mode approach is specifically designed for use with longitudinal data and helps examine fluctuating categories over time. This option places individuals into the category they most often endorsed across all time points. In the case of ties among two or more categories, the participant is given the code specified by the multi.name argument. The R script using the mode approach for race/ethnicity with the longitudinal data set is presented below. Frequencies are presented in Table 5, Column 4:

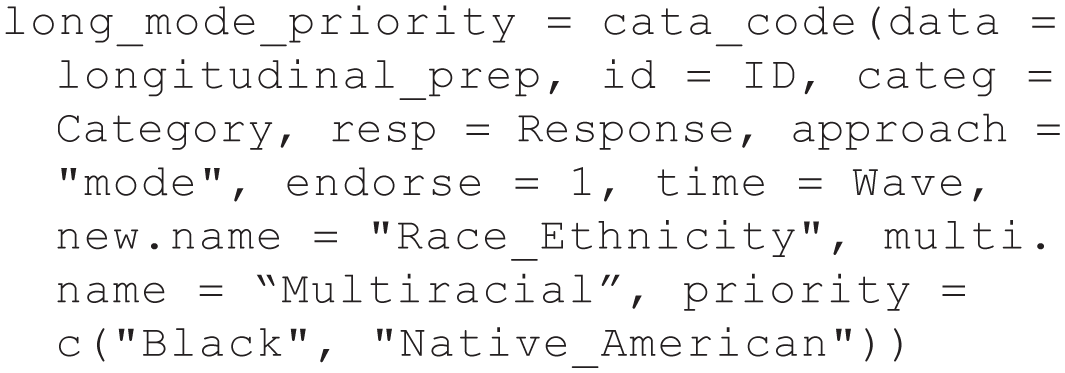
The mode approach can also be used in combination with the priority argument to prioritize specific categories before applying the mode approach. The R script below applies the mode approach with the priority option for Black and Native American participants in the longitudinal data set. In this case, any individual who identifies as Black or Native American at any point across time will be coded in that order, respectively, and the other combinations will be based on the category most often endorsed across time:
Discussion
In the present study, we address a significant yet often overlooked challenge in how racial- and ethnic-identity items that allow for multiple responses and other demographic items are typically handled. We introduced a new R package called CATAcode, a tool designed to help researchers better examine and document the identity composition of their samples and make more thoughtful, intentional, and transparent decisions when merging and prioritizing categories for statistical modeling. As populations become more diverse and identities remain fluid, researchers’ methods must adapt to accurately capture these complexities. Researchers must ensure that subjective methodological decisions for merging or prioritizing identity categories (a) are documented and transparently reported, (b) respect the participants’ identities, and (c) consider the broader social implications of their decisions because these decisions are often made within systems that have historically marginalized certain groups (Guluma & Saperstein, 2022). CATAcode was explicitly designed to help address the challenges of handling CATA demographic items in a transparent and principled manner. Although CATA responses can complicate analyses, our structured approach helps clarify to whom findings may generalize, improves cross-study comparisons, and balances the complexities of identities with the parsimony needed for statistical analyses.
Implications for QuantCrit
Our study builds on prior QuantCrit research that calls for improvements in measuring and reporting social identities in quantitative research while helping to address the potential bias inherent in presumed objective research practices (Garcia et al., 2018; Gillborn et al., 2018; Viano & Baker, 2020). QuantCrit scholars have significantly improved the conceptualization of racial and ethnic identity in quantitative research (Garcia et al., 2018; Gillborn, 2010); however, much of the research has focused primarily on questionnaire design or critiquing existing racial and ethnic categories. For instance, the ability to select and identify as Middle Eastern and North African (MENA) has historically been excluded from survey questionnaires, often forcing MENA individuals to identify as “White” or “other” (Maghbouleh et al., 2022). This is also true within the cross-sectional and longitudinal data sets in the present demonstration.
Although these efforts are critical for improving the measurement of race and ethnic identity, relatively little work has examined the analytical side of transparently preparing, coding, and using these categories in statistical analyses (Viano & Baker, 2020). CATAcode guides researchers through key decision points on coding multiple and shifting identities by providing a structured approach to explore, visualize, and prepare categories for statistical modeling. We showed how researchers can use the package to examine all possible identity combinations, make systematic decisions about merging or prioritizing categories, and in longitudinal data, explore how identities fluctuate over time. We also demonstrated that exploring CATA responses and being more intentional and transparent in decision-making can help reduce the practice of combining all multiracial participants into a heterogeneous “other” category, thereby invisibilizing specific subgroups (Fong & Irizarry, 2025; Teranishi, 2007). Instead, researchers can and must explicitly choose which identities are most relevant to the study’s goals when deciding which categories to merge, retain, or prioritize based on sample size. QuantCrit scholars have underscored how quantitative methods presumed neutrality and objectivity can perpetuate systemic inequities (Garcia et al., 2018). As Castillo and Gillborn (2023) emphasized, researchers must critically examine whether their categorization decisions “resonate with the people that they seek to describe or have groups been broken up/grouped together in misleading ways” (p. 11). Although CATAcode facilitates researcher-led decisions, it does not assume those decisions inherently align with how participants understand or express their identities. CATAcode cannot eliminate the power dynamics inherent in researchers’ categorization decisions, but it can make these dynamics visible and encourage more thoughtful decision-making. By providing researchers with tools for summarizing demographic patterns and documenting these decisions, CATAcode seeks to create a more accountable process that acknowledges the inherent power dynamics in quantitative research, recognizes its inherent biases, and encourages researchers to be more self-reflexive and transparent. As QuantCrit scholars emphasize, researchers must consider whether their decisions authentically represent the communities being studied or inadvertently perpetuate harmful misrepresentations through convenient but misleading groupings (Castillo & Gillborn, 2023).
Implications for social-science research and practice
Demographic items that allow for CATA responses are standard in most quantitative research, but participants who select multiple categories are often ignored or collapsed into a heterogeneous “other” category. This practice obscures the realities of multiracial people, who are becoming increasingly prominent in the United States. CATAcode addresses this issue by helping researchers strategically identify, summarize, and prepare CATA data while balancing analytical demands with the goal of retaining as much identity nuance as possible. When participants with multiple identities are appropriately captured and reported, readers can more accurately assess the extent to which the study findings extend to other populations and can strengthen cross-study comparisons. Minimum standard reporting requirements for CATA demographic items across several fields are needed and could increase the generalizability, transparency, and reproducibility of study findings. In practice, providing more detailed descriptions of demographic identities in research studies can help practitioners develop and implement interventions better tailored to the needs of the communities they serve. For example, detailed identity reporting might inform targeted outreach campaigns or culturally responsive initiatives, ensuring resources are distributed equitably to the needs of historically marginalized and underrepresented communities. By implementing minimum reporting standards for CATA demographic items, researchers can move toward more inclusive findings that address structural and social inequalities among diverse populations.
Recommendations for using CATAcode
An essential first step when exploring CATA demographic items using CATAcode is to examine every combination of categories represented in the data—the all and counts approaches. Depending on the sample size, some categories could and should be retained rather than merged into a single heterogeneous group. In our cross-sectional example, we identified 85 unique race combinations; some had to be merged because of low sample sizes, whereas others could be retained. In practice, merging categories will likely be required; however, we encourage researchers to document and justify these subjective decisions in the article. We also recommend that researchers include a supplemental table listing all category combinations represented in the data to provide a complete demographic overview of the samples.
The multiple, priority, and mode approaches, although convenient, should be used with intention. For example, the multiple approach can quickly group participants who select multiple identities into a single category. Although this approach is helpful when the number of individuals with multiple identities is small, it may obscure data when a large number of participants in the sample report multiple identities (e.g., the “Black and White” category). In this case, the priority approach may be a better option. The priority approach allows researchers to list categories of particular interest, ensuring they are retained even if participants also select other response options. This strategy is helpful when the study aims to prioritize and examine often overlooked identities. The priority approach, however, can hide additional endorsed identities. Thus, it is important to have a strong justification for prioritizing specific categories. The mode approach is used with longitudinal data to elevate participants’ most frequently reported identity over time. Although this approach captures individuals’ most consistently salient identity, it can mask changes in identity over time. We offer the mode approach as an alternative to other common approaches for longitudinal data, such as baseline reports, the most recent report (last wave of data), or any categories ever reported across waves. To account for identity shifts, identity can be included as a time-varying covariate in longitudinal models. In this case, CATAcode could identify and prepare the identity variables at each time point. Ultimately, we encourage researchers to retain as much information about participant identity as possible when sample size allows. Regardless of the approach used, transparency in reporting and justifying the subjective decisions made to merge or prioritize categories is critical.
Current limitations and future directions
Most prominently, demographic items, including an “other” category, often have a write-in response option. If present, we recommend carefully examining responses for three reasons. First, there might be a sizeable group in the sample with a common identity that the response options failed to reflect. For example, in the cross-sectional data used for the demonstrations, there was a small but distinct group who identified as Cape Verdean. Depending on the study’s aims and required sample size, these participants could be recoded as a separate group rather than remaining in the default “another race” category. Second, carefully investigating write-in responses may reveal that a participant endorsed existing categories. For instance, a participant who responded to the another-race write-in option with “mixed with Black and White” could be meaningfully recoded as endorsing both Black and White response options rather than the another-race option. Such decisions should still be documented and justified. Third, examining the write-in responses can also help identify nonsensical responses or mischievous responders. Identifying and recoding or removing these responses can have critical implications for interpreting subsequent results (Cimpian et al., 2025; Cimpian & Timmer, 2020). At this time, CATAcode does not have the functionality to support the examination of write-in responses for identifying subsets of common responses, responses that can be recoded into existing categories, or mischievous responses. Moving forward, we envision adding these supports to CATAcode and various expansions, including visualization tools, additional methods for longitudinal data, and features specifically for intersectional analyses (e.g., Race × Gender × Sexuality). Although in this article we focus on demographic variables and race and ethnic identity, CATAcode can be used in other fields in which CATA responses are commonly used (e.g., health conditions) and more specialized functionality may be desired. In addition to enhancing the package’s functionality, we hope to influence institutional change. Journals and funding agencies could implement guidelines that require transparent reporting of how CATA items are managed, including supplemental descriptive tables for each race combination, thereby promoting more rigorous and equitable quantitative research.
Conclusion
As individuals become more likely to share multiple identities, quantitative methods must advance to accurately and equitably capture these realities. In this study, we introduced CATAcode as a practical tool with a principled and replicable process for addressing the complexities of CATA demographic items. By encouraging transparent documentation of subjective decisions around merging and prioritizing response categories, CATAcode helps reduce the long-standing practice of overlooking participants who identify with more than one category. By enhancing the precision and inclusivity of demographic data, CATAcode supports more robust social-science research that better reflects the lived experiences and health needs of diverse communities. We hope this approach contributes to the ongoing dialogue among QuantCrit scholars and encourages broader improvements in the measurement, analysis, and reporting of individuals who report multiple identities. Adopting principled, transparent practices for managing CATA items can advance several fields in the social sciences toward more equitable, valid, and relevant research, ensuring that participants’ self-reported identities are respected and accurately represented.
Footnotes
Transparency
Action Editor: Pamela Davis-Kean
Editor: David A. Sbarra
Author Contributions