
Abstract
Chen et al. designed a novel strategic-resource-use (SRU) intervention that higher-education students could self-administer online. This intervention aimed to help students improve their performance by stimulating them to think about using learning resources for an exam preparation. The SRU intervention was tested in two undergraduate introductory-statistics courses. In the first experiment, students in the control condition received an email asking them to state their desired grade, how motivated they were to get that grade, how important it was to obtain the desired grade, and how confident they were in obtaining it. Participants in the experimental condition received the same mail and took the 15-min SRU intervention. On the final course exam, the SRU group outperformed the control group, yielding a small to medium effect size, a finding that was replicated in a second study. We conducted four preregistered conceptual replications of Chen and colleagues’ study in four undergraduate introductory-statistics courses at two Dutch higher-education institutions. In our study, the meta-analytic standardized effects on the final-exam scores in the intention-to-treat meta-analysis and the compliant-only analysis were small and not significantly different from 0, and the upper limits of the 95% confidence intervals of both meta-analyses were smaller than the effect sizes of the two studies reported by Chen and colleagues. Comparable results were obtained for the pass rates. Thus, the results of the present study failed to corroborate the previously demonstrated positive effect of the SRU intervention on final-exam scores and pass rates.
Keywords
In higher education, students need to attain their learning goals mainly through independent, that is, unsupervised study. This means they need to regulate their own learning to be successful. Self-regulated learning has been defined in various ways, but all definitions include four components (e.g., Boekaerts, 1997, 1999; Goetz et al., 2013; Panadero, 2017; Schunk, 2005; Zimmerman, 1989). First, self-regulated learning involves a metacognitive component, meaning that students plan, monitor, and evaluate their own behaviors and cognitions. Second, self-regulated learners display persistence and put considerable efforts in their learning activities. Third, self-regulated learners show cognitive control by selecting and using techniques that foster the acquisition of meaningful knowledge structures (e.g., Dunlosky et al., 2013; Fiorella & Mayer, 2015). Fourth, self-regulated learners are characterized by a distinct motivation profile, such as a high need for cognition, high degrees of self-efficacy and self-control, and a constructive self-judgment. In self-regulated theories, all four components and most notably the metacognitive and motivational components are assumed to work interdependently to produce student learning.
It has been demonstrated that aspects of self-regulated learning are positively related to achievement (e.g., Caprara et al., 2008; Paris & Paris, 2001; Pintrich & De Groot, 1990; Teng & Zhang, 2018). However, for educational purposes, it is also important to design interventions that cause performance improvement through enhancing self-regulated learning (e.g., Zepeda et al., 2015). A recent study by Chen et al. (2017) suggested that only a brief, precise, self-directed intervention that aimed at enhancing self-regulated learning by combining goal setting and formulating a specific implementation plan (e.g., Gollwitzer, 1999; Schunk, 1990) may be sufficient to produce a performance improvement. The intervention of Chen and colleagues focused on supporting students in the forethought phase of self-regulated learning (planning and activation), in which students direct their learning by setting goals, activating prior content knowledge and metacognitive knowledge, activating motivational perceptions (e.g., task value, self-efficacy), and strategically planning their learning activities (Pintrich, 2000; Zimmerman & Moylan, 2009). This planning phase requires a representation of the task and learning environment, clear and specific goals, and the ability to apply the activated metacognitive knowledge of, for example, learning strategies and procedures to a learning task at the right time for the right reasons (procedural and conditional metacognitive knowledge; Efklides, 2011; Pintrich, 2000). Chen and colleagues’ intervention aimed at externally supporting these metacognitive processes during the planning and forethought phase by helping students to strategically manage their study resources before their exam. With their strategic-resource-use (SRU) intervention, they prompted students to strategically reflect on which resources they would use, why they would use them, and when, which presumably resulted in a concrete goal-directed plan for studying.
Previous studies have demonstrated that supporting planning can have effects on learning processes and performance. For example, a study by Bonestroo and de Jong (2012) found that behavioral-sciences students who were required to plan their own learning route spent more time on planning than students who used a plan generated for them by a computer. However, the two groups of students did not differ in performance on a final exam. These results were in line with a study by Azevedo et al. (2008), who used a human tutor for planning support (assisting learners with feedback on goals and prior knowledge activation) and who observed an increase in the number of planning activities used by the middle school and high school students who participated in their studies. In addition, Manlove et al. (2009) found a positive relationship between goal setting and the number of planning activities performed by high school students. In a recent study by Zepeda et al. (2015), middle school students who received metacognitive instructions during class aimed at providing support in planning, monitoring, and evaluation performed better on near-transfer problems in eighth-grade physics assignments than students assigned to a problem-solving-only condition.
In Chen and colleagues’ (2017) first experiment, undergraduate students from a public U.S. midwestern university who were enrolled in an introductory-statistics course were randomly assigned to two conditions. Seven to 10 days before an exam, participants in the control condition received an email asking them to state their desired grade, how motivated they were to get that grade, how important it was to obtain the desired grade, and how confident they were in obtaining it. Participants in the experimental condition received the same mail as their peers in the control condition, but they also took part in the 15-min SRU intervention. This intervention required students to strategize about which academic resources, such as book chapters or video lectures, they would use for their study; why each resource would be useful; and how they would use these resources. On the final course exam, the SRU group outperformed the control group, a finding that was replicated in the second study conducted in the same manner in the same course but with a different cohort.
The results reported by Chen and colleagues (2017) are promising for applications in education and beyond. Indeed, Chen and colleagues repeatedly hinted at the generality of their findings in their article. For example, they stated that “the intervention is amenable to convenient, large-scale application in schools, and even potentially for online learners taking massive open online courses” (p. 784). In addition, they stated, Beyond education, there are many other situations in real life in which people engage in goal pursuit ineffectively, especially when they are not aware of how unproductive their strategies are or how to make the most of the resources around them. Encouraging self-reflection in people about how to approach their goals strategically with the resources that are available to them can go a long way in helping them to achieve their goals. Through psychologically precise, self-administered interventions, such as the Strategic Resource Use intervention, people can be empowered to take control of their goal pursuit in a strategic and effective manner. (p. 784)
This appeal to generality is understandable given the goal of educational science to unearth instructional design/interventions that have effects beyond the situations in which they were tested. Certainly, the SRU intervention would have little scientific—or practical—value if its effectiveness would be limited to the specific university, the specific course, and the specific population in which it was assessed (e.g., Simons, 2014; Simons et al., 2017). However, the implied generality of the SRU intervention effect has yet to be empirically established through conceptual replications of Chen and colleagues’ (2017) study. On the one hand, when successful, these replications corroborate not only the hypothesis from the original study but also the theory underlying it. On the other hand, when not successful, they serve as a trigger for further research directed at unraveling potential moderators to the original effect.
The Present Study
The present study was set up to examine the generality of the performance-enhancing effect of the SRU intervention designed by Chen and colleagues (2017). Many authors of the present study have extensive experience in coordinating and teaching undergraduate introductory-statistics classes in higher education, and based on this experience, we can say that students often seem to have problems regulating their study behavior. One of these problems is that they do not seem to think specifically and strategically about how they should go about achieving the desired learning goals. This applies to students in all four courses in the present study. Hence, employing the SRU intervention of Chen and colleagues seems to hold a considerable promise for increasing the final test performance of the students in these courses.
We conducted four conceptual replications of Chen and colleagues’ (2017) study that were carried out in four undergraduate statistics courses at two Dutch institutions of higher education. Conducting these replications is important for several reasons. For one, the results of the original study by Chen and colleagues suggest that a very short intervention can have a strong impact on learning and performance in higher education. If this is true, the intervention taps onto important psychological mechanisms, which would require the scrutiny of further study. However, before delving into possible mechanisms, it is pivotal to examine the robustness of the initial finding. In addition, this short and highly cost-efficient intervention has a high practical value for higher education if proven to be robust. Third, the original study has been very influential, with more than 156 citations (according to Google Scholar, dated June 10, 2024). Yet independent replications are lacking.
On the basis of Chen and colleagues’ (2017) article, we assumed that the following experimental conditions should be reinstated to obtain the effect: (a) Students should indicate the desired course grade, their motivation to obtain that grade, and their confidence in doing so; (b) students should be informed about the value of strategic use of resources for their final-test performance; (c) given the final-test content and format, students should strategize about how to use available resources to enhance their test performance; and (d) students should make a specific and concrete plan about how, when, and where to use the selected resources. These four features of the experimental treatment form the “primary information focus” (see Schmidt, 2009) and were reproduced in all four conceptual replications.
Furthermore, the exact form of the introductory course (e.g., schedule, activities, didactic approach, test format) and the characteristics of the student population in the conceptual replications differed from the original study, and they varied between conceptual replications. If these experiments would replicate the original effect, the heterogeneity in course characteristics and population can be considered irrelevant to the effect of the SRU intervention. According to the principle of heterogeneity of irrelevancies (e.g., Cook, 1990; Shadish, 1995), such an outcome would allow for generalizations of the changed course and population features, adding to the robustness of the SRU effect. Thus, our conceptual replications hold the promise of a considerable scientific gain, but if they fail to replicate, it might be hard to tell what caused the difference with the original findings. Yet in response to that concern, one could say that any form of heterogeneity that may arise from the present planned study would be theoretically (and practically) relevant because it signals an incomplete understanding of the hypothesized link between short, online, self-administered, self-regulated learning instructions and academic performance. This would trigger further theory development and testing.
For this study, we created an OSF page (https://osf.io/qydb2/). This page contains the approved Stage 1 Registered Report manuscript, the hypotheses, the planned method, and the planned analyses. The latter three components were also preregistered (see https://osf.io/zavxd). Furthermore, we reported how we determined our sample size, all data exclusions, all manipulations, and all measures in the study.
Method
In planning the methods for the four conceptual replications, we followed the approach of Chen and colleagues (2017) as closely as possible. One of these conceptual replications—the experiment in the course Quantitative Techniques at Avans University of Applied Sciences—was already in progress when we received the reviews of our initially submitted Stage 1 Registered Report manuscript. The reviewers requested changing the originally proposed procedure in one important way. Specifically, to prevent anchoring effects, they advised us to move the questions about gender, age, and grade point average (GPA) to the end of the postexam survey. Because we could not incorporate this change anymore into the experiment in the Quantitative Techniques course, we conducted the primary and secondary analyses on the data from the other three experiments. However, we also report the outcomes of these analyses with the data from the Quantitative Techniques experiment. In each of the remaining three conceptual replications, we followed the protocol described below.
Methodological and procedural differences between the planned conceptual replications and the original study
In each of the four proposed conceptual replications, we used the same primary materials as in the original study, but the secondary materials from the original study, which were related to motivation and emotion, were excluded because they were not relevant to the treatment effect. Each conceptual replication contained the preexam survey, the exam reminder, the SRU exercise, and the postexam survey used in the study of Chen and colleagues (2017). The materials in the conceptual replications deviated in four aspects from those of Chen and colleagues, and there were no theoretical or practical reasons to assume they would influence the effect under investigation. First, the list of resources, which was part of the SRU exercise, varied between the conceptual replications depending on the format of the courses in these replications, and most probably did not contain the exact same resources as in the original study. Second, the postexam survey contained a few items/questions that were not used by Chen and colleagues. Students were asked to indicate the average amount of time they spent on preparing for the final course exam and how they spaced their self-study time across the last course week. These retrospective estimations have been used in other studies (e.g., Kamp et al., 2012), and the validity of this approach was substantiated by Moust (1993). Moust demonstrated that a retrospective estimation of study time (in which students had to estimate the amount of self-study time they spent on average per week in the last 9 weeks) were strongly correlated with study-time estimation based on a log method, in which students had to track self-study time on each day. Furthermore, the mean reported self-study time per week hardly differed between both methods. However, based on other findings, Moust pointed out that retrospective estimation may be valid only when students must trace back their study time over a relatively short interval (i.e., no longer than 9 weeks back). This condition was clearly met in the conceptual replications of the present study. Thus, we are confident that the retrospective estimations were appropriate to measure final-exam preparation time. However, we are not aware of published studies that provide information about the validity of the retrospective estimation of spacing. Therefore, we will be cautious when referring to the spacing estimation outcomes. In any case, both measures were collected as secondary outcomes to examine possible important factors in the causal chain linking the SRU intervention to the performance advantage (see the discussion in Chen and colleagues’ article). That is, compared with the control condition, the SRU exercise may stimulate students to spend more time self-studying and to space their study efforts, and that, in turn, may have yielded a better final-exam performance. Third, except for the conceptual replication in the Quantitative Techniques course, the postexam survey asked students to report their gender, age, and high school GPA. Fourth, for the Dutch students in the conceptual replications, the English materials were translated into Dutch. For international students at the Avans University of Applied Sciences and Erasmus University Rotterdam, we used the English materials from Chen and colleagues’ study.
The procedure in the three conceptual replications was identical to that in the original study with only one difference. In the original study, the statistics courses comprised two intervening exams before the final test, and before each of these exams, students took the preexam survey and the SRU intervention. The courses in the conceptual replications did not have intervening exams, so in each of them, we took only one preexam survey before the final test. However, the results of Chen and colleagues’ (2017) study suggests that a single SRU exercise suffices to produce the performance advantage.
Participants and design
Participants were first-year undergraduate students enrolled in an introductory-statistics course. For each participant in each course, the statistics course was prerequisite for a major in a different field than methodology or statistics. The courses were conducted in 2017 and 2018.
At a Dutch university of applied sciences, we conducted a conceptual replication in the course Quantitative Techniques using a slightly different procedure than in the other three conceptual replications. Contrary to the procedure in the other three conceptual replications, participants were asked about their gender and high school GPA on the preexam survey. Because of an omission error in the online survey, we did not ask students to report their age. This course was part of the first-year program of the general and financial management studies curriculum. At a Dutch university, the conceptual replication took place during the course 1.3 Statistics I: An Introduction. This course was part of the first-year bachelor program of the psychology and pedagogical sciences curricula. The third conceptual replication took place at a Dutch university of applied sciences and was conducted in the course Statistics/SPSS. This course was part of the first-year program of the international business and management studies curriculum. The fourth conceptual replication took place at a Dutch university of applied sciences in the course Statistics 1. This course was part of the first-year program of the technical management sciences curriculum. For detailed information about the total number of participants in the conceptual replications and the participation percentage, see the Results section.
Each participant provided written informed consent before taking part in the experiment. Furthermore, at the university, participants received 30 min of research-participation credits when they completed the two sessions of the experiment. At the Dutch university of applied sciences, students participated on a voluntary basis.
In each conceptual replication, all students enrolled in the course received an email invitation to participate in the experiment. After they gave their informed consent, they were randomly assigned to the control condition or the SRU-intervention condition. The primary dependent variables were the end-of-course exam scores (score = obtained points / total points × 100%) and the proportion of students who passed the exam. Furthermore, secondary dependent variables were the self-reported study time, the spacing of study time, the scores on the eight-item Self-Reflection on Learning scale, the number of resources used, and the scores on the Effectiveness of Resources scale (for more information, see the Materials section).
Ethics
The following ethics statement applies to all experiments in the present study. In Dutch legislation, the law on medical-scientific research on humans (Wet Medisch Wetenschappelijk Onderzoek met mensen [WMO]) serves to protect people from medical maltreatment and experimentation. The WMO applies to research in which people are submitted to a medical/physical intervention or to research in which a certain mode of behavior is imposed on people. At the time the experiments were conducted, according to the WMO, approval from an ethics committee was not required for certain behavioral studies.
The plans for the conceptual replications at the Dutch university of applied sciences were submitted to educational committees of the faculties where the experiments were to be conducted. These committees are responsible—among others—for evaluating planned interventions into the educational program against ethical standards such as those of the American Psychological Association (2017). For the three conceptual replications, the committees gave their approval.
For the conceptual replication at the Dutch university, P. P. J. L. Verkoeijen consulted the chair of the Ethics Committee Psychology (ECP). At the time the experiments were conducted, the committee fulfilled an advisory role: Its members evaluated whether formal approval of a Medical Ethical Committee was required. Based on the consult, P. P. J. L. Verkoeijen concluded that formal advice of the ECP was not necessary in this case because (a) participants of the conceptual replication would be asked to give their informed consent; (b) participants would take part on a voluntary basis; (c) the experimental procedure would be noninvasive; (d) participants were not expected to experience harm by taking part in the study, that is, compared with a no-treatment, standard course situation, participants in the control group and the experimental group were both likely to benefit, albeit in varying degrees; and (e) the results would be analyzed and reported in an anonymized fashion.
Power analysis
Sample-size calculations were conducted using the software G*Power 3.1 (Faul et al., 2007). The aim of this calculation was to obtain the minimally required sample size to detect a difference in mean exam scores between two independent groups (treatment vs. control condition) with a .95 power using an α level of .05 (two-tailed). The required sample size per condition to detect the smallest effect sizes found by Chen and colleagues (2017) of Cohen’s d = 0.33 (for the intention-to-treat analysis) and Cohen’s d = 0.38 (for the compliant-only analysis) are n = 240 (i.e., 480 in total) and n = 180 (i.e., 360 in total), respectively.
Chen and colleagues (2017) did not include pass rate as a dependent variable in their study. Hence, it is difficult to set a baseline effect size for the power calculations. Furthermore, the power of a test for two proportions depends on the pass rate observed in the control group. Because it was hard to predict what the overall pass rate would be in the control condition (i.e., the pass rate collapsed across the conceptual replications in the analysis), we calculated the smallest possible proportion difference we could obtain with a two-tailed test powered at 95% and an α level of .05 for the required sample sizes in the crucial above-presented exam-scores analyses, that is, n = 240 per group and n = 180 per group. With these sample sizes, the minimum proportion difference we would be able to detect was .15 (assuming a pass rate of either .55 or .70 in the control group).
Materials
For the English materials, see Appendix A. These materials were used for the international psychology students in the conceptual replication at the Dutch university and for the non-Dutch students in the conceptual replication in the international business and management studies curriculum at the Dutch university of applied sciences. The other students received Dutch translation of these materials. The materials consisted of an email message to introduce the preexam survey, the preexam survey, two preexam reminders, an email message to introduce the postexam survey, two postexam reminders, and the postexam survey. The surveys were administered online. The preexam survey and postexam surveys were programmed in Qualtrics and delivered through a Qualtrics link. The text in these surveys was based on the text used in the original study of Chen and colleagues (2017).
Procedure
We followed the procedure of Chen and colleagues (2017) as closely as possible, but to ensure optimal conditions to achieve a treatment effect, we adapted the procedure to the characteristics of the local course context. The procedure consisted of four phases. First, in the class/lecture, depending on the course context, before the preexam-survey invitation, teachers informed their students about the survey. They told their students a survey would be mailed to them on day/date X (this information was course specific). Furthermore, they told them this survey was administered to help them with their preparation for the upcoming course exam. If students had questions about the survey, teachers would provide no extra information than that stated on the first screen of the preexam survey. Students who would like to receive more information about the outcomes of the survey were informed that they could receive this information after the course. This in-class information was planned to encourage students to take the survey and hence to maximize the response rate. For the conceptual replication at a Dutch university, participants were asked at the start of the course to sign up for the experiment by providing their consent in an online form that was mailed to them. The students who gave their consent would later receive the preexam survey. For the conceptual replications at a Dutch university of applied sciences, the consent form was included in the preexam-survey mail. When students gave their consent, they had to push a “continue” button to start the preexam survey. We decided on this procedure after consulting the coordinators of the courses in which the conceptual replications took place. Students receive many mails at the start of a course (related to assignments, course structure, and meeting schedules), and the coordinators were concerned that students might miss or even ignore a consent mail. Second, participants received the mail about the preexam survey 9 to 12 days before the exam date. This timing was assumed to influence exam preparations because the end-of-course exam is not too far away to be deemed irrelevant and because it allowed students sufficient time to do the preparation. When participants took the survey, they were automatically and randomly assigned to the control condition or the SRU condition. Reminders were sent 1 day and 2 days after the initial invitation to take the survey. The survey closed 3 days after the initial invitation. Third, immediately after students received their grade of the end-of-course exam, students were invited to take the postexam survey. The postexam survey reminders were mailed 2 days and 4 days after the initial invitation. The survey was closed 5 days after the initial invitation.
Results
For the results of the present study, we followed the analyses as described in the preregistration. In the exceptional case we did not follow the preregistered analyses, we flagged this in the subsequent text. The data and the scripts used for the analyses were made publicly available on the OSF page of the present study (see https://osf.io/qydb2). In addition, and as pointed out in the preregistered analyses plan, for our main conclusions, we excluded the data from the Quantitative Techniques course from the primary and secondary analyses presented below. However, we also reported the outcomes of those analyses with the data from the Quantitative Techniques experiment. For the readers’ convenience, we did this in the Results section itself and not, as stated in the preregistration, only on the OSF page.
Planned data analyses, preexam survey (primary analyses)
Preexam survey descriptive statistics
For each course, we report the consent percentage, the participation percentage, and the compliance percentage. First, we calculated the consent percentage according to the following formula from the preregistration: (number of participants who gave their consent for participation / total number of students who filled out the consent form) × 100. The consent percentage was 98.6% (287 / 291 × 100) in the Quantitative Techniques course, 100% (326 / 326 × 100) in the Statistics I: An Introduction course, 100% (139 / 139 × 100) in the Statistics/SPSS course, and 98.9% (94 / 95 × 100) in the Statistics I course.
Then, we calculated the participation percentage in each course of the present study. As indicated in the preregistration, the participation percentage was defined as follows: (the number of participants who started the preexam survey / total number of students who took the final course exam) × 100. In the Quantitative Techniques course, 577 students took the final course exam. Of these 577 students, 226 started the preexam survey, leading to a participation percentage of 39.2%. Furthermore, 576 students took the final exam in the Statistics I: An Introduction course. Of these students, 326 started the preexam survey, leading to a participation percentage of 56.6%. In the Statistics/SPSS course, 226 took the final exam. One hundred thirty-nine of them started the preexam survey, leading to a participation percentage of 61.5%. In the Statistics I course, 179 students took the final exam. Ninety-five of them started the preexam survey, leading to a participation percentage of 53.1%.
Furthermore, we calculated the compliance percentage per course per condition according to the following preregistered formula: (number of participants who met the inclusion criteria / total number of students who started the preexam survey) × 100. To this aim, we used the subsequent exclusion criterion from the preregistration: a participant gave informed consent but did not take the survey, a participant did not complete the survey, a participant completed the survey but failed to adhere to the survey instructions (a participant failed to adhere to the survey instructions if an invalid response was provided on Screen 6 [usefulness of resources], Screen 7 [planning], or on both screens; see Appendix A), a participant took the same survey (SRU condition or control condition) more than once, and a participant took the survey in both the SRU condition and the control condition. The number of compliant participants and compliance percentage are presented in Table 1 as a function of course. The results indicate that compliance rate was high in each of the courses and in each of the two conditions.
Number of Compliant Participants and Compliance Percentage in the Preexam Survey as a Function of Course and Treatment Condition

Note: SRU = strategic resource use.
In Table 2, we present relevant descriptive statistics for the compliant participants in the SRU condition and the control condition. In the Statistics/SPSS course and the Statistics I course, a considerable percentage of participants who took the preexam survey did not take the postexam survey. Consequently, the interpretation of self-identified gender, age, and high school GPA should be interpreted with caution. The results in Table 2 indicate that in each of the courses, the SRU condition and the control condition were largely comparable. In all courses and in each of the two conditions, participants’ mean desired grades ranged from 6.6 to 7.5. In the Dutch higher-education grading system, the lowest passing grade is typically a 5.5. Hence, the reported desired mean grades are above this threshold. In addition, grades within the 6.6 to 7.5 range would be considered as a pass or generous pass. It is somewhat hard to compare these results with those of Chen and colleagues (2017) because the desired grades were reported on a different scale. However, their results suggest that participants’ desired grades were, on average, between a B and C, which is comparable with what we observed in the present study. Furthermore, participants’ mean scores on motivation to obtain the desired grade, importance to obtain the desired grade, and confidence to obtain the desired grade were above the midpoint of the 7-point scale, with confidence being, on average, somewhat lower than motivation and importance, particularly in the Statistics 1: An Introduction course. These results were comparable with those in Chen and colleagues, except for the confidence score, which appeared to be slightly lower, on average, in our study than in theirs.
Percentage Gender Identification, Mean Age, Mean High School Grade Point Average, Mean Desired Grade, Mean Motivation to Obtain the Desired Grade, Mean Importance of Desired Grade, Mean Confidence in Obtaining Desired Grade as a Function of Course and Treatment Condition

Note: Sample size is presented per condition for all variables. PnS = prefer not to say; PsD = prefer to self-describe; SRU = strategic resource use.
Treatment effects
The critical results for the conceptual replications in the present study involved the comparison of the SRU and the control conditions on the mean final course exam grade and the proportion of students who passed the test. Note that the final-exam course grade was calculated for each course for each student according to the following formula: points obtained / total number of possible points × 100%. The median grade was reported for descriptive purposes only. In each course, we planned to calculate Cronbach’s α for the course exam. However, we obtained only the final scores but not the scores on the individual items on the course exams. Hence, Cronbach’s α was not computed; this was the only deviation from the preregistered analyses plan.
Following the approach of Chen and colleagues (2017), we conducted the analyses on the final mean exam scores and the pass rates on the data of students who met the inclusion criteria, that is, a compliant-only analysis; and on the data of all students who were assigned to the two conditions of the experiment, that is, an intention-to-treat analysis. From the latter analysis, we excluded participants who took the survey in both conditions. The relevant descriptive statistics for the compliant participants are presented in Table 3. Table 4 contains the same results for the participants intended to treat. Overall and based on the descriptive statistics, the effect of the SRU treatment seems to be small when looking at the mean grade and the pass rate for both the compliant-only and the intention-to-treat situations. The Statistics/SPSS course appears to be an exception because the mean (and median) grade was higher in the SRU condition than in the control condition, with a difference comparable with the one reported by Chen and colleagues. The pass rate showed a somewhat different picture because in both situations, there was a slight to large advantage of the SRU condition relative to the control condition in three out of four courses. The Statistics 1 course was an exception, with a higher pass rate in the control condition than in the SRU condition.
Mean (SD) Grade, Median Grade, and Pass Rate as a Function of Course and Treatment Condition (Compliant-Only Data)

Note: SRU = strategic resource use.
Mean (SD) Grade, Median Grade, and Pass Rate as a Function of Course and Treatment Condition (Intention-to-Treat Data)

Note: SRU = strategic resource use.
Meta-analyses for compliant only, intention to treat, final-exam scores (mean grade), and pass rates
To obtain the critical results, we conducted eight random-effect meta-analyses with Version 3.0 of the software program Comprehensive Meta-Analysis (CMA): four on the final-exam scores (i.e., compliant only and intention to treat, with and without the results from the Quantitative Techniques course) and four on the pass rates (i.e., compliant only and intention to treat, with and without the results from the Quantitative Techniques course). The software program CMA unfortunately has no syntax, but the .cma-datasets are available on the OSF page associated with the present study.
Figures 1 through 8 present the forest plots of the standardized mean differences, that is, Cohen’s d, and the associated 95% confidence intervals (CIs) for each of the involved studies in a forest plot calculated with the random-effects model. In addition, each figure includes the meta-analytic pooled standardized mean difference with the associated 95% CI, presented as the area between left side and the right side of the diamond at the bottom of the forest plot. In the description of the results and consistent with the preregistered analyses plan, we focus on the figures without the Quantitative Techniques course. However, note that the outcomes of the results of the meta-analyses without this course were comparable with those with the Quantitative Techniques course included. The latter results are presented in Figures 5 through 8.

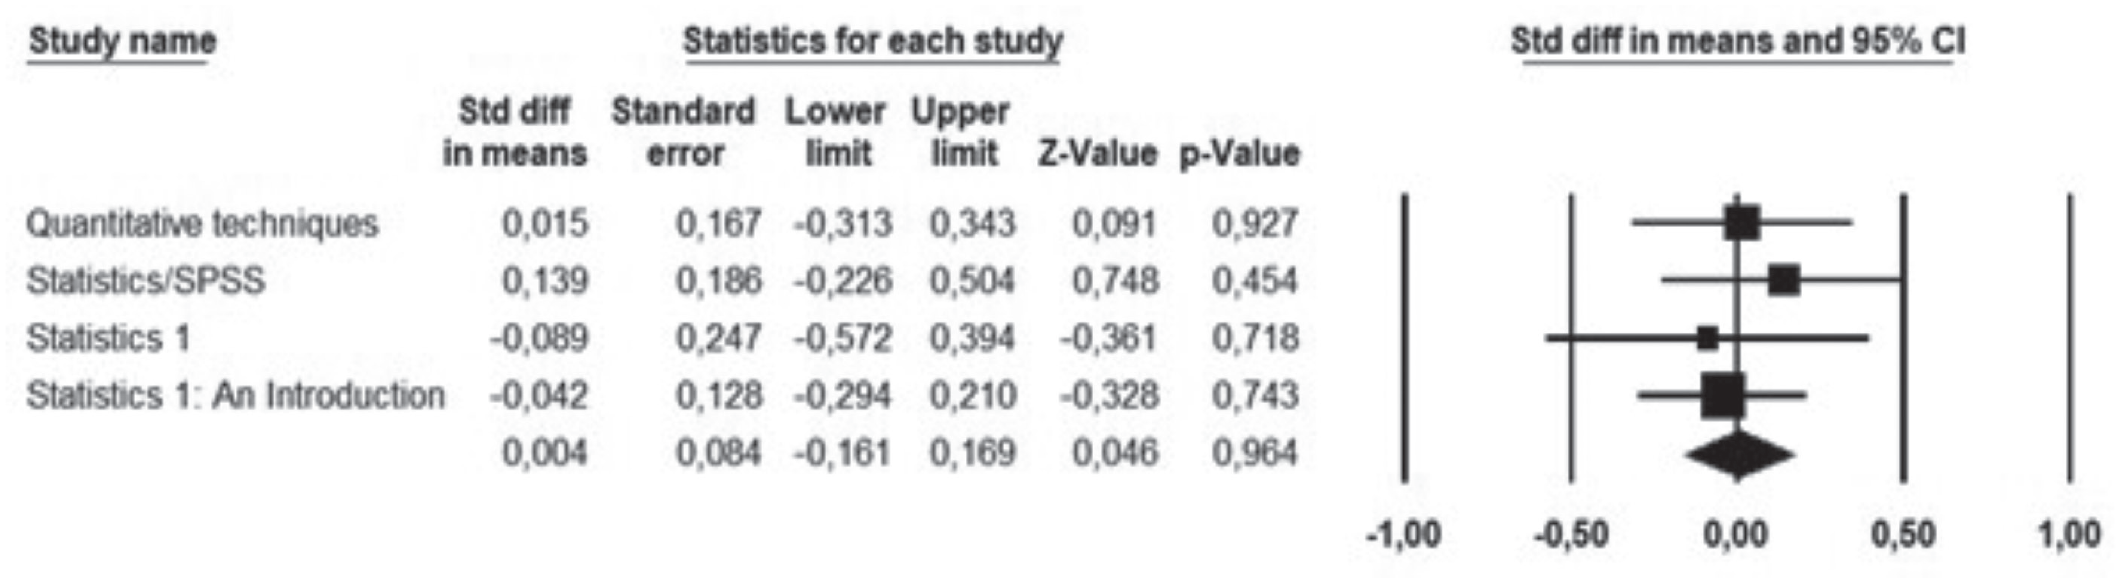
Forest plot and meta-analytic result for the standardized difference in mean final-exam grade between the strategic-resource-use condition and the control condition for the participants intended to treat, without the Quantitative Techniques course. The standardized mean difference for each study is indicated by a square denoting Cohen’s d. The error bars indicate 95% confidence intervals around that standardized mean difference. The diamond represents the meta-analytic standardized mean difference of the random-effects meta-analysis with the width representing a 95% confidence interval around the meta-analytic difference. SRU =

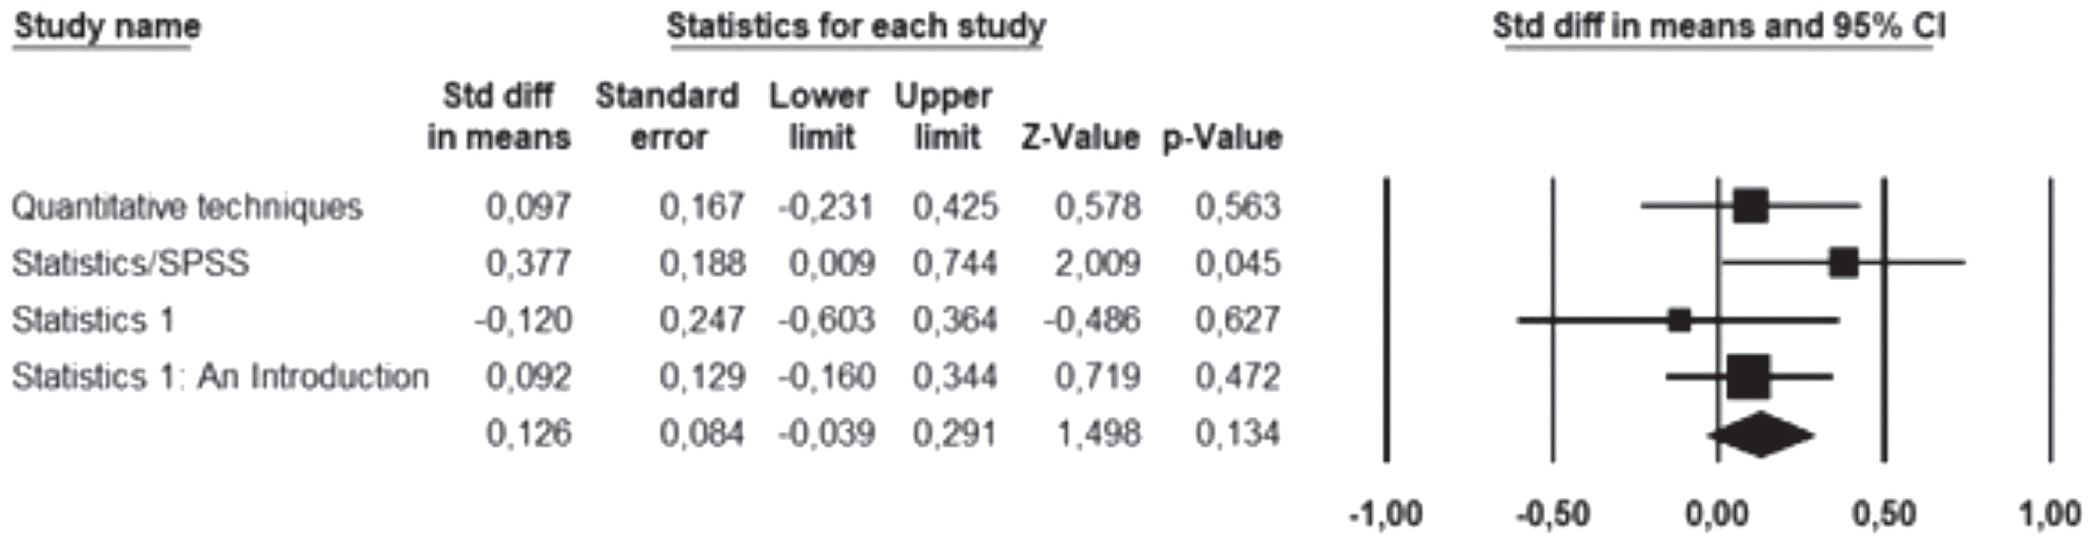
Forest plot and meta-analytic result for the standardized difference in mean final-exam grade between the strategic-resource-use condition and the control condition for the compliant participants, without the Quantitative Techniques course. The standardized mean difference for each study is indicated by a square denoting Cohen’s d. The error bars indicate 95% confidence intervals around that standardized mean difference. The diamond represents the meta-analytic standardized mean difference of the random-effects meta-analysis with the width representing a 95% confidence interval around the meta-analytic difference.

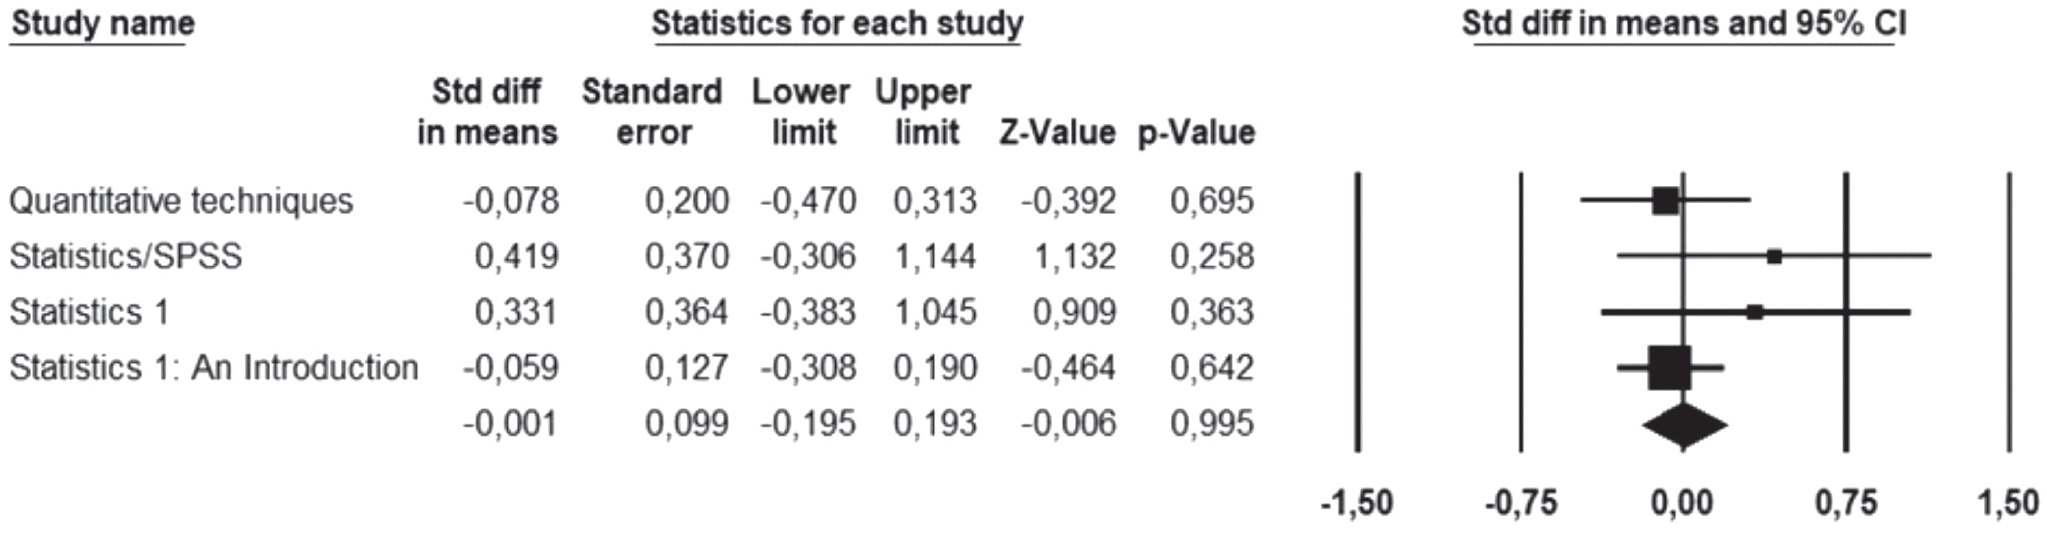
Forest plot and meta-analytic result for the standardized difference in mean pass rate between the strategic-resource-use condition and the control condition for the participants intended to treat, without the Quantitative Techniques course. The standardized mean difference for each study is indicated by a square denoting Cohen’s d. The error bars indicate 95% confidence intervals around that standardized mean difference. The diamond represents the meta-analytic standardized mean difference of the random-effects meta-analysis with the width representing a 95% confidence interval around the meta-analytic difference.

Forest plot and meta-analytic result for the standardized difference in mean pass rate between the strategic-resource-use condition and the control condition for the compliant participants, without the Quantitative Techniques course. The standardized mean difference for each study is indicated by a square denoting Cohen’s d. The error bars indicate 95% confidence intervals around that standardized mean difference. The diamond represents the meta-analytic standardized mean difference of the random-effects meta-analysis with the width representing a 95% confidence interval around the meta-analytic difference.

Forest plot and meta-analytic result for the standardized difference in mean final-exam grade between the strategic-resource-use condition and the control condition for the participants intended to treat, with the Quantitative Techniques course. The standardized mean difference for each study is indicated by a square denoting Cohen’s d. The error bars indicate 95% confidence intervals around that standardized mean difference. The diamond represents the meta-analytic standardized mean difference of the random-effects meta-analysis with the width representing a 95% confidence interval around the meta-analytic difference.
Forest plot and meta-analytic result for the standardized difference in mean final-exam grade between the strategic-resource-use condition and the control condition for the compliant participants, with the Quantitative Techniques course. The standardized mean difference for each study is indicated by a square denoting Cohen’s d. The error bars indicate 95% confidence intervals around that standardized mean difference. The diamond represents the meta-analytic standardized mean difference of the random-effects meta-analysis with the width representing a 95% confidence interval around the meta-analytic difference.

Forest plot and meta-analytic result for the standardized difference in mean pass rate between the strategic-resource-use condition and the control condition for the participants intended to treat, with the Quantitative Techniques course. The standardized mean difference for each study is indicated by a square denoting Cohen’s d. The error bars indicate 95% confidence intervals around that standardized mean difference. The diamond represents the meta-analytic standardized mean difference of the random-effects meta-analysis with the width representing a 95% confidence interval around the meta-analytic difference.
Forest plot and meta-analytic result for the standardized difference in mean pass rate between the strategic-resource-use condition and the control condition for the compliant participants, with the Quantitative Techniques course. The standardized mean difference for each study is indicated by a square denoting Cohen’s d. The error bars indicate 95% confidence intervals around that standardized mean difference. The diamond represents the meta-analytic standardized mean difference of the random-effects meta-analysis with the width representing a 95% confidence interval around the meta-analytic difference.
For the results on the final-exam scores without the Quantitative Techniques course, see Figures 1 and 2. The results of the meta-analyses were highly consistent for the intention-to-treat analysis and the compliant-only analysis. The meta-analytic standardized effect size on final-exam score of the intention-to-treat meta-analysis was small, not significantly different from zero, d = 0.03 (95% CI = [–0.15, 0.21]), and the variability across studies was consistent with what would be expected by chance, Q(2) = 0.56, p = .76, I2 = 0.00%. The meta-analytic standardized effect size on final-exam score of the compliant-only meta-analysis was also small, d = −0.00 (95% CI = [–0.19, 0.19]), and the variability across studies was consistent with what would be expected by chance, Q(2) = 0.79, p = .67, I2 = 0.00%. Hence, the final-exam-score results indicate that the effect of the SRU intervention was small in the present study and not significantly different from zero. Furthermore, the upper limits of the two meta-analytic effect sizes, respectively, 0.21 and 0.19, were smaller than the point estimates of Cohen’s d in the study by Chen and colleagues (2017), which were, respectively, 0.38 in their Study 1 and 0.47 in their Study 2. Therefore, the results of the present study with respect to final-exam scores are inconsistent with those in Chen and colleagues’ study.
We also conducted random-effects meta-analyses on the pass rates; note that pass rates were not reported in the study by Chen and colleagues (2017). For the results on the pass rates without the Quantitative Techniques course, see Figures 3 and 4. The meta-analytic standardized effect size, that is, Cohen’s d, for the intention-to-treat meta-analysis was small, d = 0.15 (95% CI = [–0.03, 0.33]), and the variability across studies was consistent with what would be expected by chance, Q(2) = 1.89, p = .39, I2 = 0.00%. The meta-analytic standardized effect size, that is, Cohen’s d, for the compliant-only meta-analysis was also small, d = 0.14 (95% CI = [–0.05, 0.33]), and the variability across studies was consistent with what would be expected by chance, Q(2) = 2.84, p = .24, I2 = 29.54%. The results on the pass rates indicate that the effect of the SRU intervention was small in both the intention-to-treat analysis and in the compliant-only analysis and not significantly different from zero. These results are consistent with those obtained from the final-exam scores, although the point estimates of the meta-analytic standardized effects seem to be larger for the pass rates.
Planned data analyses postexam survey (secondary analyses)
Data exclusion and data screening
Participants’ data from the postexam survey were excluded from the secondary analyses for the following reasons: (a) participant did not complete the postexam survey and (b) participant took the postexam survey more than once.
Note that exclusion was blind to condition, final course exam score, and passing rate. After the exclusions, the postexam survey data were scanned for errors. Such errors could occur for the student number, the reported number of hours spent on exam preparation, the spacing of these hours, the reported age, and the reported high school GPA. Errors were corrected when necessary.
Postexam survey descriptive statistics
A total number of 692 students started the postexam survey: 118 of these students did not meet the inclusion criteria, initially leaving 574 valid survey entries. Of these 574 students, 448 of them took the preexam survey, that is, they underwent the SRU or the control treatment. Of these 448 students, 416 met the inclusion criteria. The results reported in Tables 5 through 7, and the postexam inferential analyses were based on these 416 participants. Note, however, that the Cronbach’s αs for the self-reflection test were based on the scores of all participants who met the inclusion criteria, that is, 574 in total.
Number of Participants and Percentage of Participation in the Postexam Survey as a Function of Course and Treatment Condition

Note: This percentage was calculated conditional on preexam-survey participation. SRU = strategic resource use.
Mean (SD) and Median of the Number of Study Hours Spent on Each of the 7 Days Immediately Before the Final Exam Date and on the Exam Date as a Function of Course and Condition

Note: SRU = strategic resource use.
Mean (SD) Total Hours Spent on Exam Preparation, Mean (SD) Score on the Self-Reflection on Study Approach Scale, Mean (SD) Number of Resources Used, and Mean (SD) Usefulness of Used Resources a Function of Course and Condition

Note: SRU = strategic resource use.
In Table 5, we report the number of participants for each course, in each condition, that met the inclusion criteria. In addition, we report the percentage of participation. This percentage was obtained for each course for each condition by dividing the number of participants by the number of compliant participants in the corresponding condition on the preexam survey. The results show that the attrition rate was high in most of the courses in each of the two conditions, with notable exceptions in the Statistics 1: An Introduction course and in the SRU condition in the Quantitative Techniques course.
In Table 6, we report the mean and median of the number of study hours spent on each of the 7 days immediately before the final-exam date and on the exam date as a function of course and condition. Note that we did not ask for the number of study hours on the exam date itself in the Quantitative Techniques course. In each of the involved courses, the study-hour results were comparable for the SRU and the control conditions. In addition, in each of the courses in each of the conditions, study time appeared to increase as the exam approached, with a relatively large amount of study hours on the last day before the exam. This pattern of results, which is indicative of academic procrastination, was also demonstrated in a study by Kerdijk et al. (2015).
In Table 7, we report the mean total hours spent on exam preparation, the mean score on the self-reflection on study approach scale, the mean number of resources used, and the mean usefulness of used resources as a function of course and condition. The self-reflection on study approach scale measures important aspects of students’ self-regulated learning, such as whether they adapted their study strategies to the course requirements, whether they monitored and reflected on their learning strategies, and whether they adapted their learning strategies if necessary. We calculated Cronbach’s α of this scale in each course, and for this, we used the scores of all participants (n = 574) who met the inclusion criteria. This, however, and as pointed out before, led to the inclusion of item scores of participants who had not underwent the SRU or the control treatment. The results in Table 7 were based on the 416 participants who met the inclusion criteria and who underwent either the SRU or the control treatment. Cronbach’s α for the self-reflection on study approach scale was .69 in the Quantitative Techniques course, .67 in the Statistics 1: An Introduction course, .76 in the Statistics/SPSS course, and .44 in the Statistics 1 course. These results were in line with the Cronbach’s α reported by Chen and colleagues (2017) in their study (i.e., Cronbach’s α = .80), except for our Statistics 1 course, in which Cronbach’s α was considerably lower.
Furthermore, in each of the courses, the SRU and the control groups had comparable means on the hours students spent on preparing for the exam. The overall preparation time differed between courses, and this might be the result of the fact that course loads differed between the courses. Furthermore, in each of the courses, students’ mean self-reflection score was high (approximately 4 on a 5-point scale) in each of the conditions, with hardly any differences between the conditions. The same applied to the usefulness of resources (which was also measured on a 5-point scale.) The mean number of used resources hardly differed between the conditions in each of the courses.
Postexam survey inferential analyses
Meta-analyses for total study time, self-reflection, resources, and usefulness of resources
The total time spent on exam preparation and self-reflection, resources, and usefulness of resources were submitted to the same analysis as the grades (see Figures 9–16).

Forest plot and meta-analytic result for the standardized difference in mean total exam preparation hours between the strategic-resource-use condition and the control condition, without the Quantitative Techniques course. The standardized mean difference for each study is indicated by a square denoting Cohen’s d. The error bars indicate 95% confidence intervals around that standardized mean difference. The diamond represents the meta-analytic standardized mean difference of the random-effects meta-analysis with the width representing a 95% confidence interval around the meta-analytic difference.

Forest plot and meta-analytic result for the standardized difference in mean proportion of resources used between the strategic-resource-use condition and the control condition, without the Quantitative Techniques course. The standardized mean difference for each study is indicated by a square denoting Cohen’s d. The error bars indicate 95% confidence intervals around that standardized mean difference. The diamond represents the meta-analytic standardized mean difference of the random-effects meta-analysis with the width representing a 95% confidence interval around the meta-analytic difference.

Forest plot and meta-analytic result for the standardized difference in mean self-reflection between the strategic-resource-use condition and the control condition, without the Quantitative Techniques course. The standardized mean difference for each study is indicated by a square denoting Cohen’s d. The error bars indicate 95% confidence intervals around that standardized mean difference. The diamond represents the meta-analytic standardized mean difference of the random-effects meta-analysis with the width representing a 95% confidence interval around the meta-analytic difference.

Forest plot and meta-analytic result for the standardized difference in mean usefulness of resources between the strategic-resource-use condition and the control condition, without the Quantitative Techniques course. The standardized mean difference for each study is indicated by a square denoting Cohen’s d. The error bars indicate 95% confidence intervals around that standardized mean difference. The diamond represents the meta-analytic standardized mean difference of the random-effects meta-analysis with the width representing a 95% confidence interval around the meta-analytic difference.

Forest plot and meta-analytic result for the standardized difference in mean total exam preparation hours between the strategic-resource-use condition and the control condition, with the Quantitative Techniques course. The standardized mean difference for each study is indicated by a square denoting Cohen’s d. The error bars indicate 95% confidence intervals around that standardized mean difference. The diamond represents the meta-analytic standardized mean difference of the random-effects meta-analysis with the width representing a 95% confidence interval around the meta-analytic difference.

Forest plot and meta-analytic result for the standardized difference in mean proportion of resources used between the strategic-resource-use condition and the control condition, with the Quantitative Techniques course. The standardized mean difference for each study is indicated by a square denoting Cohen’s d. The error bars indicate 95% confidence intervals around that standardized mean difference. The diamond represents the meta-analytic standardized mean difference of the random-effects meta-analysis with the width representing a 95% confidence interval around the meta-analytic difference.

Forest plot and meta-analytic result for the standardized difference in mean self-reflection between the strategic-resource-use condition and the control condition, with the Quantitative Techniques course. The standardized mean difference for each study is indicated by a square denoting Cohen’s d. The error bars indicate 95% confidence intervals around that standardized mean difference. The diamond represents the meta-analytic standardized mean difference of the random-effects meta-analysis with the width representing a 95% confidence interval around the meta-analytic difference.
Forest plot and meta-analytic result for the standardized difference in mean usefulness of resources between the strategic-resource-use condition and the control condition, with the Quantitative Techniques course. The standardized mean difference for each study is indicated by a square denoting Cohen’s d. The error bars indicate 95% confidence intervals around that standardized mean difference. The diamond represents the meta-analytic standardized mean difference of the random-effects meta-analysis with the width representing a 95% confidence interval around the meta-analytic difference.
Following the preregistration, we report only the outcomes of the meta-analyses in which the Quantitative Techniques course was excluded, that is, the results presented in Figures 9 through 12. The results with the Quantitative Techniques course included are presented in Figures 13 through 16, and the results of the meta-analyses were comparable with those without the Quantitative Techniques course. Regarding the results presented in Figures 9 through 12, the meta-analytic standardized effect size, that is, SRU condition compared with the control condition, for the mean total time spent on exam preparation was small, d = 0.05 (95% CI = [–0.18, 0.28]), with a low degree of heterogeneity between studies, Q(2) = 0.001, p > .99, I2 = 0.00%. Similar meta-analytic effects were obtained for the mean proportion of resources used, d = −0.05 (95% CI = [–0.27, 0.18]), Q(2) = 4.21, p = 0.12, I2 = 52.51%; the mean self-reflection on study, d = −0.064 (95% CI = [–0.29, 0.16]), Q(2) =1.63, p = 0.44, I2 = 0.00%; and the mean usefulness of the resources, d = 0.025 (95% CI = [–0.19, 0.25]), Q(2) = 2.28, p = .32, I2 = 12.18%.
Causal process
To examine the causal process linking the SRU treatment to final test performance, Chen and colleagues (2017) tested a serial mediation model (Chen et al., 2017, Figure 2) on the data from their Studies 1 and 2. We tested the same model in the present study using almost the same analytic approach as Chen and colleagues did. The only difference between the analysis of Chen and colleagues versus our analysis is that we took the clustering of students within studies into account using the TYPE=COMPLEX option in Mplus (Version 8; Muthén & Muthén, 2017). We deviated from the preregistration in that we chose this option over a multilevel approach because it was not possible to fit the multilevel mediation model because the number of clusters (the four conceptual replications) was too small relative to the number of parameters in the model. This means, we (a) pooled the data across the conceptual replications in our proposal considering the statistical dependency of students within studies and (b) fitted a serial mediation model to the data to assess the total effect of condition (SRU vs. control) on final grade and the indirect effect mediated by self-reflection and self-reported use of resources and the direct effect of condition on final grade independent of self-reflection and self-reported use of resources.
For results of the serial mediation model, see Figure 17. Accounting for dependency in the data, we found a nonsignificant serial mediation of the effect of condition on final grade via an effect on self-reflection and self-reported use of resources (standardized indirect effect β = −0.00, bootstrapped 95% CI = [–0.02, 0.00]). The direct effect was also nonsignificant (β = −.06, 95% CI = [–0.18, 0.11]), just like the total effect from condition on final grade (β = −0.06, 95% CI = [–0.18, 0.10]). The only significant path in the model, as shown in Figure 17, is from self-reported use of resources on final grade (β = 0.27, 95% CI = [0.16, 0.43]). These results are largely inconsistent with those reported by Chen and colleagues (2017); the only consistent result is the positive relationship between the self-reported use of resources and final grade.

Results of the serial mediation model run in Mplus, accounting for dependency in the data. Standardized path coefficients are reported: ns = nonsignificant (p > .05). *p < .05. **p < .01.
General Discussion
Chen and colleagues (2017) described an SRU that higher education students enrolled in two undergraduate statistics courses underwent online. In each course, an experiment was conducted in which participating students were randomly assigned to the SRU intervention or the control condition. In both courses/experiments, the mean final-exam score was higher in the SRU condition than in the control condition, with effect sizes of, respectively, Cohen’s d = 0.37 and Cohen’s d = 0.48. Thus, the SRU intervention seems to hold considerable promise for application in higher-education practice.
To examine the generality of the findings of Chen and colleagues (2017), we conducted four conceptual replications in four higher-education, first-year statistics courses, involving many undergraduate students. In our study, the meta-analytic standardized effects on the final0exam scores in the intention-to-treat meta-analysis and the compliant-only analysis were very small and not significantly different from 0, and the upper limits of 95% CIs of both meta-analytic standardized effect sizes were smaller than the point estimates of the effect sizes of the two studies reported by Chen and colleagues. The meta-analytic standardized effect sizes for the pass rate showed similar results. Hence, the results of the present study failed to reveal a positive effect of the SRU intervention on final-exam scores and pass rates. Our results are in line with earlier work (e.g., Schäfer & Schwarz, 2019) that showed that effect sizes of preregistered studies, such as our study, are considerably smaller than nonpreregistered studies, such as those of Chen and colleagues.
The inconsistency between our findings and those of Chen and colleagues (2017) might have occurred for a variety of reasons. They might have arisen because of unchecked researcher degrees of freedom, which are much less likely to occur in a preregistered study such as ours than in a nonpreregistered study. However, it might also be possible that the positive effect of the SRU intervention on exam performance occurs only under certain conditions. In a recent correlational study, Chen and colleagues (2022) provided some relevant suggestions regarding this. They compared users of an Exam Playbook intervention (which was very much comparable with the present SRU intervention) and nonusers in 14 undergraduate STEM courses on various topics. The results showed an overall mean positive standardized relationship between the use of the Exam Playbook and final-exam performance, corresponding with a meta-analytic effect size of Cohen’s d = 0.18. In addition, there was also a substantial and significant degree of heterogeneity in the relationship: In eight of the 14 courses, the relationship was not significantly different from zero. This heterogeneity was related to what Chen and Gunderson referred to as “class climate.” Providing students with bonus points for working with the Exam Playbook was an important element of a beneficial class climate. That is, the positive relationship between Exam Playbook use versus nonuse and final-exam performance was stronger, on average, in courses in which teachers gave students bonus points when they used the Exam Playbook.
In our study, students did not receive bonus points, whereas students did receive them in the study by Chen and colleagues (2017). In Chen and colleagues’ article, providing bonus points was not identified as an important condition for the effect, but perhaps it is. Further research is needed to determine whether and under what conditions providing bonus points might indeed be a moderator of the causal effect of an SRU intervention on final-exam performance. It might be reasonable, for example, to assume that the effect of the SRU condition might be contingent on providing bonus points only if the plan is checked by a teacher. In that case, students might work more conscientiously on their plan than when bonus points are provided without a teacher’s check. Yet if teachers need to check the plans, the elegance of the brief, online intervention disappears. It is then transformed into an intervention that substantially increases teachers’ workload, which might be unfeasible, particularly in large classes. Furthermore, if students receive bonus points only after a teacher’s check, they might use generative artificial intelligence (AI) to create a plan. This might increase teachers’ workload even more because they also need to check the plans on AI fraud.
Another potentially relevant difference between the original study and our study was the participation rate. The number of students who took part in the experiment—either in the control group or the SRU-intervention group—was smaller in our conceptual replications (i.e., on average about 50%) than in the original study by Chen and colleagues (2017), in which it was about 70%. Perhaps providing bonus points had led to a sample consisting of a larger proportion of students with a lower degree of academic motivation in the original study, and perhaps these students were more likely to benefit from the SRU intervention. Further research is needed to examine whether the causal effect of the intervention interacts with academic motivation. However, one could ask whether students with a relatively low level of academic motivation would generate a high-quality plan when bonus points are rewarded without a teacher’s check on the quality of the plan. In addition, in each of our replications, the levels of the desired mean grade, mean motivation to obtain this grade, and mean importance of obtaining the desired grade were comparable with the mean scores on these variables in the study of Chen and colleagues. These results suggest that our participants were not that different from those of Chen and colleagues’ on relevant characteristics. All in all, it is not clear whether differences in participation rates reflect possible moderators of the SRU-intervention effect.
Apart from possible moderators, which suggest the SRU-intervention effect is contingent on certain yet to be uncovered student characteristics or features of the learning environment, there might be reasons to be skeptical about the impact of a short, self-administered online intervention on performance altogether. For example, making a strategic plan reflects behavioral intentions, but these might not necessarily be transformed into actual, self-regulated behavior. Recently, McDaniel and Einstein (2020) proposed that to support sustained self-regulated use of effective cognitive-learning strategies, students’ training should incorporate four elements. Students should be provided with declarative and procedural metacognitive knowledge of effective learning strategies, they should believe that these strategies work, they should be committed to using these strategies, and they should implement these strategies. In the SRU intervention, students are informed—albeit briefly—that making a strategic resource plan will benefit their exam performance (knowledge). However, it is not clear, both in our study and the study of Chen and colleagues (2017), whether students believed that making such a plan works or whether they were committed to execute the plan. Lack of expected SRU effectiveness (belief) or lack of commitment to action will disrupt the causal link between strategic planning and performance.
In conclusion, the current set of conceptual replications failed to corroborate the positive effects of an SRU intervention on final-exam performance observed by Chen and colleagues (2017). These results limit the generality of the causal effect of this intervention, and they might point at yet undiscovered moderators of the effect. Under what conditions, for which learners, and for which types of learning outcomes a brief, online, self-administered, not teacher-checked intervention will be effective for performance in higher education remains to be seen.
Footnotes
Appendix A
Acknowledgements
We thank Patricia Chen for providing valuable information about the procedure she used in her experiments and for sharing the original materials. We also thank Loes Hoefnagels and Johan Wouters, whose assistance and feedback made one of the conceptual replications possible. A. E. G. Heijltjes retired in November 2021.
Transparency
Action Editor: Pamela Davis-Kean
Editor: David A. Sbarra
Author Contributions