
Abstract
What information do science journalists use when evaluating psychology findings? We examined this in a preregistered, controlled experiment by manipulating four factors in descriptions of fictitious behavioral-psychology studies: (a) the study’s sample size, (b) the representativeness of the study’s sample, (c) the p value associated with the finding, and (d) institutional prestige of the researcher who conducted the study. We investigated the effects of these manipulations on 181 real journalists’ perceptions of each study’s trustworthiness and newsworthiness. Sample size was the only factor that had a robust influence on journalists’ ratings of how trustworthy and newsworthy a finding was; larger sample sizes led to an increase of about two-thirds of 1 point on a 7-point scale. University prestige had no effect in this controlled setting, and the effects of sample representativeness and of p values were inconclusive, but any effects in this setting are likely quite small. Exploratory analyses suggest that other types of prestige might be more important (i.e., journal prestige) and that study design (experimental vs. correlational) may also affect trustworthiness and newsworthiness.
Science journalists play an important role in the scientific ecosystem. In the United States, they are the primary external watchdogs that can monitor scientists and scientific institutions for problematic practices and call out dubious claims without much fear of harming their career prospects. In fact, the code of ethics from the U.S.-based Society for Professional Journalists instructs journalists to “Be vigilant and courageous about holding those with power accountable” (Society for Professional Journalists, 2014), a responsibility that extends to science journalists, who are charged with monitoring scientists and scientific institutions and keeping them accountable. However, for science journalists to play this important role, they need to have access to and know how to use relevant information when deciding whether to trust a research finding and whether and how to report on it.
In this article, we examine what information primarily U.S.-based science journalists use when evaluating psychology findings in a controlled experimental setting. In particular, our study aims to better understand the influence of factors such as the research design (the study’s sample size and the representativeness of the study’s sample), the statistical evidence (the p value associated with the finding), and reputational factors (institutional prestige) on science journalists’ judgments of a finding’s trustworthiness and newsworthiness. Understanding which, if any, of these factors influence science journalists’ perceptions of research findings may provide insight into which findings are more likely to be communicated to the public.
The Importance of Science Journalists
Criticism, scrutiny, and oversight are accepted, even valued, in many domains. From professional restaurant reviewers to corporate governance boards and environment-monitoring organizations, this is seen as an important, often remunerated, activity. Ideal candidates for these jobs know enough about the subject on which they are reflecting to be able to scrutinize it but have enough distance to minimize conflicts of interest. Science is different. It is easy to imagine that science might not need external auditors: Scientific scrutiny is meant to be a built-in feature of science, an integral part of the scientific process. Before any discoveries can be published, they must undergo evaluation by other scientists in the field—a process known as “peer review.” However, we believe that external science watchdogs are in fact needed and play a crucial role in vetting the findings that get transmitted to the public. In many cases, they also determine which findings get shared with the public.
Although some science communication work can be done by university public relations offices or the scientists themselves, science needs scrutiny from “inside-outsiders,” more impartial critics (Ihde, 1997), a role that is often played by science journalists. Blum (2021) argued that the role of the modern science journalist is to “portray research accurately in both its rights and its wrongs” (p. 323), whereas Carr (2019) suggested science journalists should scrutinize research and “do so on behalf of readers, not scientists.” Carr’s defense of the role of science journalism as something done for readers, not scientists, reflects the deep changes the profession has undergone in the last century. Arising from a desire to popularize science in the early 20th century in the United States, what would eventually become science journalism was originally focused on publicizing “smart and positive science stories” (Blum, 2021, p. 323). Although framed as a way to inform American citizens so they could better participate in democracy, science popularization also aimed to secure funding for future scientific endeavors by creating a public that cared enough about science to demand more of it (Katz, 2016).
In the United States, science journalism’s original penchant for positively framed science stories changed over the last century. Around the 1960s and 1970s, journalism saw the incorporation of more diverse voices and viewpoints into the news and more skeptical, critical science journalism as it became increasingly clear that scientific progress also had its downsides (Blum, 2021; Crewdson, 1993). Despite these changes, some journalists, such as Crewdson (1993), heavily criticized science journalism in the 1990s, arguing that journalists are often too close to the scientists they report on and too keen to cheer science on—leading Crewdson to describe science journalists as “perky cheerleaders” for science.
Today, science journalism is in the process of “growing up” (Blum, 2021). In the United States, more emphasis on training and investigative reporting, starting in the 1980s and 1990s, has better positioned the profession to act as the science watchdog that is needed. New technological developments have helped science journalists by increasing the visibility of their work and allowing them to tackle the complexities of reporting on scientific findings with new communication tools (e.g., by creating data visualizations or recording podcasts). Science journalists now have more opportunity to become good science watchdogs who can help the public consume scientific research through a critical lens and draw the public’s attention to more rigorous research. Clearly, a more informed public with access to more nuanced scientific information is a social benefit of having more critical science journalists.
Critical science journalism also has many benefits for science itself. First, if uncertain science is communicated uncritically, without the proper context and caveats, science risks losing credibility. Although scientific theories can never be proven definitively, some research areas or findings are much more certain and justify bold claims more than others. But if these differences in certainty are not made explicit, the public could get the impression that all published findings are equally solid. When it becomes clear that this is not warranted—if coffee cures cancer one week but causes it the next—this can erode public trust in science and at the extremes, facilitate the types of science denialism that are seen, for example, toward climate-change research. A good science journalist can evaluate each research finding to see if it is solid enough to warrant reporting on and, if it is, to help contextualize it and calibrate the claims to the evidence.
Second, scientists need science watchdogs so that incentives on scientists reward better research practices and therefore better science. That is, good science journalism helps ensure that the best research, however it is defined, is receiving the most attention. Media attention is part of the incentive structure in science, and there is some indication that it is rewarding to scientists—getting media coverage for their work may boost scientists’ citations, facilitate invitations to collaborate or give talks, and help them attract more investors or donors to fund their research (Dance, 2018). Media attention is only one of many rewards that scientists may respond to, but it can be an important one. Therefore, it is important to know whether journalists’ decisions about whether and how to report on research findings track the quality of the research.
Finally, having competent science watchdogs serve as intermediaries between researchers and the general public can help keep scientists honest. Scientists are only human, and like all humans, they are prone to biases about their own research. For example, public engagement with scientists’ work may help them get funding, and therefore they have an incentive to exaggerate their own accomplishments. But if scientists anticipate that their work will receive the appropriate amount of scrutiny as it is being transmitted to the general public, this provides an incentive to improve research practices and better calibrate claims to the evidence.
Given the important role that science journalists play in communicating and critiquing science, it is worth understanding how science journalists form opinions about findings they could potentially report on. In this study, we ask what information science journalists use when deciding what findings are trustworthy and newsworthy, and we investigate four potential factors in a controlled experimental setting.
The Present Study
As a first step to understanding the factors that influence science journalists’ decision-making, we investigated how science journalists evaluate research findings in psychology. Specifically, we invented findings similar to those that might arise in the field of social and personality psychology (our area of expertise) and experimentally manipulated four features of these research studies to investigate how these features affect science journalists’ perceptions of the research. Given constraints related to participant compensation and our sampling strategy (described below), we assumed we would sample primarily U.S.-based science journalists, and therefore the study descriptions (locations, samples) were also U.S.-centric. We examined the effect of four variables. All four manipulated variables pertained to some aspect of the research studies that the science journalists read and evaluated: the sample size (number of participants in the study), sample representativeness (whether the participants in the study were from a convenience sample or a more representative sample), the statistical significance level of the result (just barely statistically significant or well below the significance threshold), and the prestige of the researcher’s university. Our aim was to examine the causal effects of these factors on our dependent variables: journalists’ perceptions of the trustworthiness and newsworthiness of the research presented.
We selected the four manipulated variables from a larger pool of potential factors that either do affect the strength of the evidence a study can provide or are commonly thought to be related to study quality. Our final selection of these four variables was the result of balancing various considerations, including making sure that the variables could easily be manipulated, that science journalists could understand the information presented, and that we manipulated a diverse set of factors (e.g., some that would require some statistical literacy and others that would not). We describe the four variables we manipulated and provide an explanation of why we might expect each to have an effect on journalists’ judgments of trustworthiness and/or newsworthiness, although we emphasize that we did not make any predictions about these effects (although we did preregister our research questions and analysis plan; see next section).
First, we chose to manipulate sample size, a feature of studies that has recently (and historically) received a lot of attention in psychology. Quantitative studies in psychology generally aim to measure or estimate a parameter (e.g., a correlation or group difference), and the more data that are available (i.e., the larger the sample size or number of observations), the more precise that estimate will be. Thus, if science journalists’ reasoning is consistent with scientific values, we would expect studies with larger sample sizes to be judged as more trustworthy and more newsworthy, all else being equal.
We also manipulated sample representativeness because it directly affects how much a given finding can be generalized to the population as a whole. The mismatch between psychology’s broad claims and the samples those claims are based on has been the subject of criticism for decades (Henrich et al., 2010; Sears, 1986). Findings based on unrepresentative samples (e.g., studies of human adults based on convenience samples of college students at one university) suffer from greater threats to their generalizability than do studies with more representative samples. In our study, every vignette presented to journalists included a quotation from the researcher making a general claim about people based on their finding. Thus, the representativeness of the sample (which we manipulated) should affect science journalists’ evaluations of the trustworthiness (and potentially newsworthiness) of the claims in the vignettes.
The third variable we manipulated is the p value associated with the finding. As a result of common pressures and practices in psychology, the p value can be a useful clue for researchers to differentiate real effects from noise and guard against false positives (although, like many clues, it is far from perfect). Mathematically, well-designed studies examining real effects should most often produce very small p values, well below the .05 cutoff that is commonly used. Although studies that present p values closer to that threshold (e.g., between .03 and .05) are not necessarily suspect, p values in that range are more common when researchers engage in questionable practices or overfit their data and may be an indication that a finding is not as trustworthy. Thus, if science journalists are aware of and agree with this reasoning, findings with p values closer to the .05 cutoff should lead them to judge the finding as less trustworthy (and presumably less newsworthy) than findings with p values close to 0.
Finally, we manipulated the level of prestige of the researcher’s university. Although this may or may not have any bearing on the actual trustworthiness or newsworthiness of a finding, we believe there is a common assumption in North American social sciences that research quality is higher at prestigious institutions. Therefore, we expected that U.S.-based science journalists may judge research from more prestigious universities as more newsworthy and potentially also more trustworthy because of stereotypes (accurate or not) that they might hold or might expect the public to hold about how prestige is related to research quality and rigor. We reasoned that this might be especially likely in the context of our experiment, in which the science journalists were given relatively little information.
We chose to maximize internal validity (the validity of our causal inferences) by using fictitious summaries of research to allow us to manipulate these variables independently from the content of the research presented. This design decision comes at the expense of external validity and realism. For example, our findings may have limited applicability in contexts in which journalists have much more information about the research or do not have the kind of information presented in our fictitious summaries. We discuss these and other limitations in our discussion. We believe that understanding the causal influence of the features examined here provides a foundation for future studies examining or intervening on science journalists’ approach to evaluating scientific findings. Understanding whether and how science journalists’ judgments are influenced by features of the research design or by the prestige of researchers’ institutions can point to avenues for further strengthening the role of science journalists as critics.
Method
Participants
We aimed to recruit journalists who self-identify as science journalists or journalists who sometimes report on scientific research. Participants were offered a $25 U.S. Amazon gift card as compensation for the time spent taking the survey. Participants were recruited through professional networks of C. Aschwanden and through snowball sampling in which members of C. Aschwanden’s professional network were asked to help identify other potential participants. Although we did not ask participants for location information and had no geographic restrictions on who could participate in the study, we believe that our sample is mostly U.S.-based because of our sampling methodology and the fact that our participant incentives were restricted to U.S. Amazon gift cards, which are rarely useful to anyone outside the United States.
Data collection started on December 22, 2020, and ended 3 months later, according to our preregistered stopping rule (for the full preregistration, see https://osf.io/kv9uw/), resulting in 186 complete observations. We excluded five participants who self-reported having provided inaccurate data, resulting in 181 participants. No participants were excluded for nonserious responding, and the pattern of responses did not indicate a need to worry about nonjournalists having completed the survey. Although we asked participants to guess what variables we were manipulating, as per our preregistration, we did not exclude those who guessed correctly.
Stimuli
Participants were shown vignettes created by J. G. Bottesini and S. Vazire to resemble real social- and personality-psychology study results. We aimed to create vignettes that varied in topic, methodology, and other characteristics but that were similar in their format and average in plausibility and interestingness (to avoid floor and ceiling effects in ratings of trustworthiness and newsworthiness). To ensure that we achieved this goal, we first created a pool of 25 vignettes (https://osf.io/9xvfa/) that we pretested
1
to assure they were near the middle of the response scale in plausibility and interestingness. We also received feedback from C. Aschwanden on which ones seemed to be too implausible. On the basis of this feedback, we eliminated three vignettes, for a final set of 22 vignettes, which can be found at https://osf.io/xej8k/. One example vignette is shown below: University City, ST – Being more open to new experiences might also mean shopping at a wider variety of stores, a new study by researchers at [University Name] has found. The researchers measured openness to experience in [Sample Size] [Sample Type], and also asked them about their shopping habits. Those who scored higher in openness to experience were also more likely to buy from multiple stores instead of being regular shoppers at one or a few stores ([Statistical Test, p value]). According to Dr. Diaz, one of the lead scientists on the project, “that willingness to try out new things might be a deciding factor for where people choose to spend their money.”
Design
We varied four characteristics in each vignette: the sample size, which could be small (N between 50 and 89) or large (N between 500 and 1,000); the sample type, which could be a convenience sample (e.g., “local volunteers”) or a more representative U.S. sample (e.g., “people from a nationwide sample”); the p value, which could be high (between .05 and .03) or low (between .005 and .0001); and the prestige of the university where the research was done, which could be higher (e.g., “Yale University”) or lower (“East Carolina University”). This created a 2 (sample size: small vs. large) × 2 (sample type: convenience vs. more representative) × 2 (p value: high vs. low) × 2 (university prestige: higher vs. lower) design for a total of 16 conditions. We randomly assigned participants to see eight of these 16 conditions in a planned-missingness within-subjects design. Each of the eight conditions was superimposed on a different, randomly selected vignette.
Because of the within-subjects design, participants were likely to see the same level of the manipulated variables multiple times (e.g., small sample sizes or a high-prestige university). To make it more difficult for participants to guess what we were systematically varying across vignettes, we avoided presenting the exact same value by operationalizing each level of each variable in multiple ways. For the two numeric independent variables (sample size and p value), numbers from the corresponding range were randomly sampled from a uniform distribution. For example, if a participant was assigned to see a small sample size on a given vignette, the actual sample size presented was a whole number between 50 and 89 inclusive, sampled with uniform probability. For the two independent variables that were nonnumeric (sample type and university prestige), each level had a corresponding list of eight options, and one of the options was randomly selected with equal probability. For example, if a participant was assigned to see a more representative sample type on a given vignette, the description of the sample was one of the eight possible descriptions for more representative samples. All options can be found at https://osf.io/xej8k/.
For each participant who started the study, all 16 possible conditions (i.e., all combinations of the four factors) were created, and a random operationalization of each level was selected without replacement. From these 16 conditions, a random set of eight conditions was selected without replacement. These eight conditions were superimposed on eight randomly selected vignettes out of the 22, virtually guaranteeing that no participant saw the same stimuli (e.g., the same description of a convenience sample or the same exact p value) more than once. After providing their ratings of the eight vignettes, all participants saw the rest of the questions in the same order.
On the basis of feedback from C. Aschwanden and a few other journalists who pretested the survey, we opted to present only half of the 16 conditions to each participant to keep the study relatively short and avoid participant fatigue. A simulation of this study design conducted a priori with 10,000 iterations revealed that a sample size between 150 and 250 participants, who each saw eight vignettes, would give us 91% to 99% power to detect an unstandardized main effect of 0.2 scale points for each of the four variables with α = .05, two-tailed. On the basis of the simulation results, we estimate that our obtained sample afforded us at least 95% power to detect these effects.
Procedure
After consenting to participate and confirming they met the inclusion criteria (“a journalist who [at least sometimes] covers science and/or health, medicine, psychology, social sciences, or wellbeing”), participants were presented with a series of eight one-paragraph vignettes describing fictitious findings in psychology. Participants were asked to evaluate the research described in each vignette on our two dependent variables: its trustworthiness (four Likert-type items; example item: “The methodology of this study is rigorous.”) and its newsworthiness (two Likert-type items; example item: “This study is worthy of being reported on.”). For the full survey used, see https://osf.io/xej8k/.
After completing the vignette evaluations, participants were asked three open-ended questions. First, they were asked to describe how they typically evaluate research findings. Then, participants were asked to describe how they evaluated the findings that were presented in the study. Finally, they were asked whether they had any guesses about what characteristics of the fictitious study vignettes we were systematically varying; if participants answered yes, they were then provided with a text box to describe their guesses.
Participants were then debriefed about each of the manipulated variables sequentially. First, we described the variable that we manipulated. Then, we asked whether they agreed that they were familiar with this variable as a factor that can be used to evaluate the quality of a study and whether they agreed that a “better” level of this factor (e.g., larger sample size or lower p value) increased the validity or newsworthiness of a scientific study. This process happened for each of the manipulated variables in turn, and all three questions were answered on a scale from − (strongly disagree) to +3 (strongly agree) for all four variables.
Finally, we asked participants for some demographic information (including gender, the topics they typically cover, and educational background), offered a space for any general comments, and then provided them with an opportunity to self-report that their data should not be included in the analyses. At the end of the survey, participants were redirected to a separate survey in which they entered identifiable information so that we could verify their identities as journalists. The two surveys were completely unlinked, and participants were told this repeatedly.
Results
This was a preregistered study (registration: https://osf.io/mnrw2; file: https://osf.io/7edbp). The descriptives and main research-question results reported below follow our preregistered analysis plan, and any deviations from the preregistration are explicitly reported. The analyses in the Exploratory Analyses section were not preregistered and were decided on after looking at the data. All data and survey materials used in this study can be found at https://osf.io/tnmfu/. We report how we determined our sample size, all data exclusions (if any), all manipulations, and all measures in the study.
Sample
The majority of the 181 participants in the final sample reported identifying as women (76.8%); 19.3% of participants self-identified as men, 2.8% of participants self-identified as nonbinary, and 1.1% of participants preferred not to say. No participants chose to self-describe their gender.
Participants reported regularly covering a variety of scientific domains: life sciences (63.5%), health and medicine (58.0%), general science (46.4%), physical sciences (37.6%), psychology (26.5%), social science (24.9%), lifestyle and well-being (16.6%), and other (16.6%).
In terms of the types of news organizations they primarily worked for, most participants reported working for online news organizations (92.3%), followed by print news organizations (58.6%); a few reported working for audio (7.7%), video or TV (3.9%), or another type (2.2%) of news organization. The audience of these news organizations was described as being primarily a general audience (36.5%), primarily science oriented (29.8%), or an even mix of both (33.7%).
We also asked participants about their educational background. Of the participants, 61.9% reported having studied physical or natural sciences at the undergraduate level, and 24.3% reported studying social sciences at the undergraduate level. Furthermore, 35.4% reported having studied physical or natural sciences at the graduate level, and 13.3% reported studying social sciences at the graduate level; 48.1% reported having a journalism degree.
Descriptives
Our two dependent variables, trustworthiness and newsworthiness, were calculated by reverse-scoring the relevant items and averaging the items measuring each construct. The trustworthiness measure included four items that showed excellent reliability: coefficient α = .92, McDonald’s ω = .93. A one-factor confirmatory factor analysis showed good fit, χ2(2) = 7.846, p = .02; comparative fit index = .999, root mean square error of approximation = .045. Newsworthiness was measured with two items, also with excellent reliability: coefficient α = .95, McDonald’s ω = 095. Trustworthiness (Mdn = −0.5, interquartile range [IQR] = 2.25, range = [–3, +3]) and newsworthiness (Mdn = −0.5, IQR = 3, range = [–3, +3]) did not show any evidence of floor or ceiling effects and demonstrated reasonable variance.
Judgments of trustworthiness and newsworthiness were highly correlated: After averaging the trustworthiness and newsworthiness ratings for each participant, we found that participants who tended to rate vignettes as trustworthy also tended to rate vignettes as newsworthy (r = .64, 95% confidence interval [CI] = [.55, .72]). In turn, when averaging the ratings for each vignette, we found that vignettes that were typically rated as trustworthy were also more likely to be rated as newsworthy (r = .85, 95% CI = [.67, .94]). Finally, a mixed-effects model with newsworthiness regressed on trustworthiness revealed that across vignettes and participants, judgments of trustworthiness were highly associated with judgments of newsworthiness (B = 0.73, 95% CI = [0.69, 0.78]).
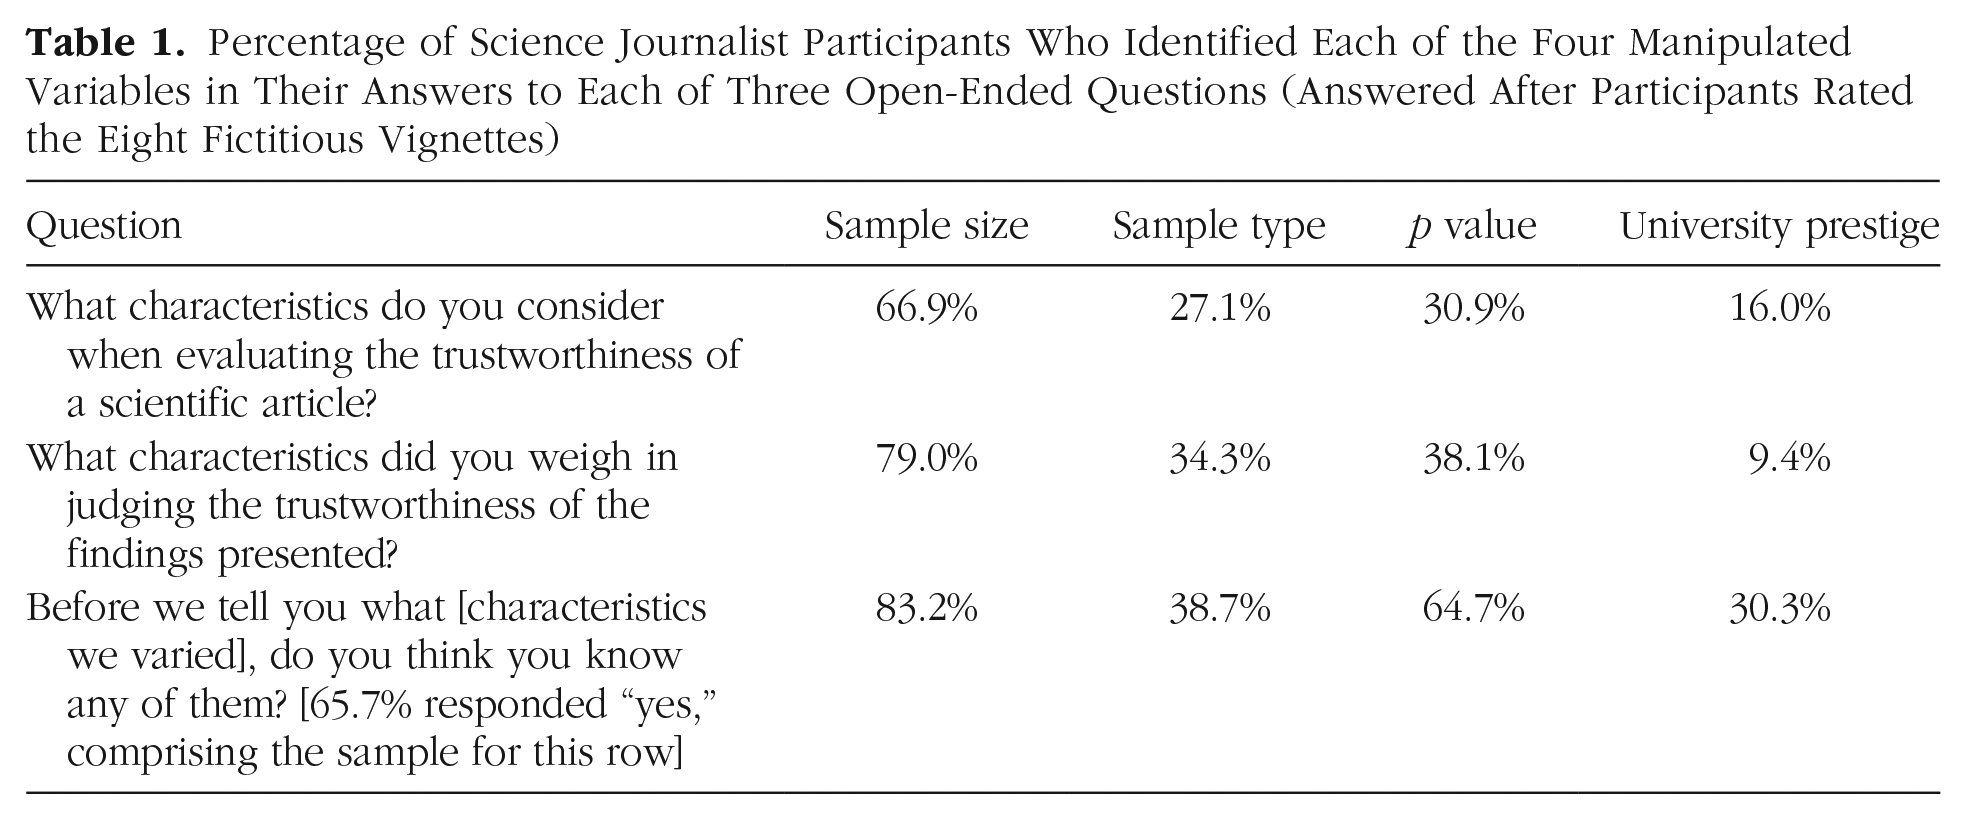
Answers to the three open-ended questions—descriptions of how participants typically evaluate research findings, how they evaluated the findings in the present study, and their guesses about which characteristics of the vignettes we manipulated—were manually coded by two coders for whether they contained mentions of the four manipulated variables (Table 1). Initial agreement was good (Cohen’s κ = .90). Disagreements were resolved by discussion between the two coders, deviating from the preregistered procedure, which stated we would use a third coder to resolve disagreements. Almost every participant who completed the study wrote at least a few words on every open-ended question they were presented with.
First, participants reported what information they typically use to evaluate findings. Of the participants, 66.9% mentioned sample size, 27.1% mentioned the representativeness of the sample, 30.9% mentioned p values, and only 16.0% mentioned the prestige of the institution where the research was conducted.
Then, participants reported what characteristics they used in forming their judgments of vignettes in the present study. Of the participants, 79.0% mentioned sample size, 34.3% mentioned the representativeness of the sample, 38.1% mentioned p values, and only 9.4% mentioned institutional prestige.
Finally, when asked whether they had any guesses about what was being systematically varied in the vignettes, 65.7% of participants said they had a guess. Of those participants, 83.2% mentioned sample size, 38.7% mentioned the type of sample, 64.7% mentioned p values, and 30.3% mentioned the prestige of the university. We expected this number to be quite high, especially given that each participant read eight vignettes, so we preregistered our a priori decision to not exclude participants who correctly guessed our manipulated variables. However, this does present some concerns in terms of demand characteristics or self-presentation from the participants. We further examine some possible consequences of this for the interpretation of our results in the Limitations section of our discussion.
When asked to rate on a scale of −3 to +3 their familiarity with each of the independent variables as a factor that may be used when evaluating the quality of a study, participants reported higher familiarity with sample size (M = 2.66, Mdn = 3, IQR = 1, range = [+1, +3]), followed by the representativeness of the sample (M = 2.31, Mdn = 3, IQR = 1, range = [–3, +3]), the p value (M = 2.11, Mdn = 2, IQR = 1, range = [−, +3]), and university prestige (M = 1.45, Mdn = 2, IQR = 2, range = [−3, +3]).
The lower mean for university prestige suggests that participants may not have interpreted this question as being strictly about familiarity with the variable because we expect that close to 100% of our sample is likely familiar with the idea that university prestige is sometimes used as a factor when evaluating the quality of a study. We suspect participants may have treated this rating in part as an opportunity to express endorsement of the use of this factor in evaluating the quality of research studies (a construct we aimed to capture with the next item).
In terms of whether these factors could increase the validity of a study, participants generally agreed that larger sample sizes (M = 2.10, Mdn = 2, IQR = 1), more representative samples (M = 2.18, Mdn = 2, IQR = 1), and smaller p values (M = 1.23, Mdn = 2, IQR = 2) can increase the validity of a study but tended to disagree that higher university prestige could do the same (M = −0.57, Mdn = −1, IQR = 3).
Results were similar for newsworthiness: Participants generally agreed that larger sample sizes (M = 1.03, Mdn = 1, IQR = 2), more representative samples (M = 1.33, Mdn = 2, IQR = 1), and smaller p values (M = 0.62, Mdn = 1, IQR = 2) can increase the newsworthiness of a study but tended to disagree that higher university prestige could do the same (M = −0.41, Mdn = 0, IQR = 3). These distributions can be seen in Figure 1.
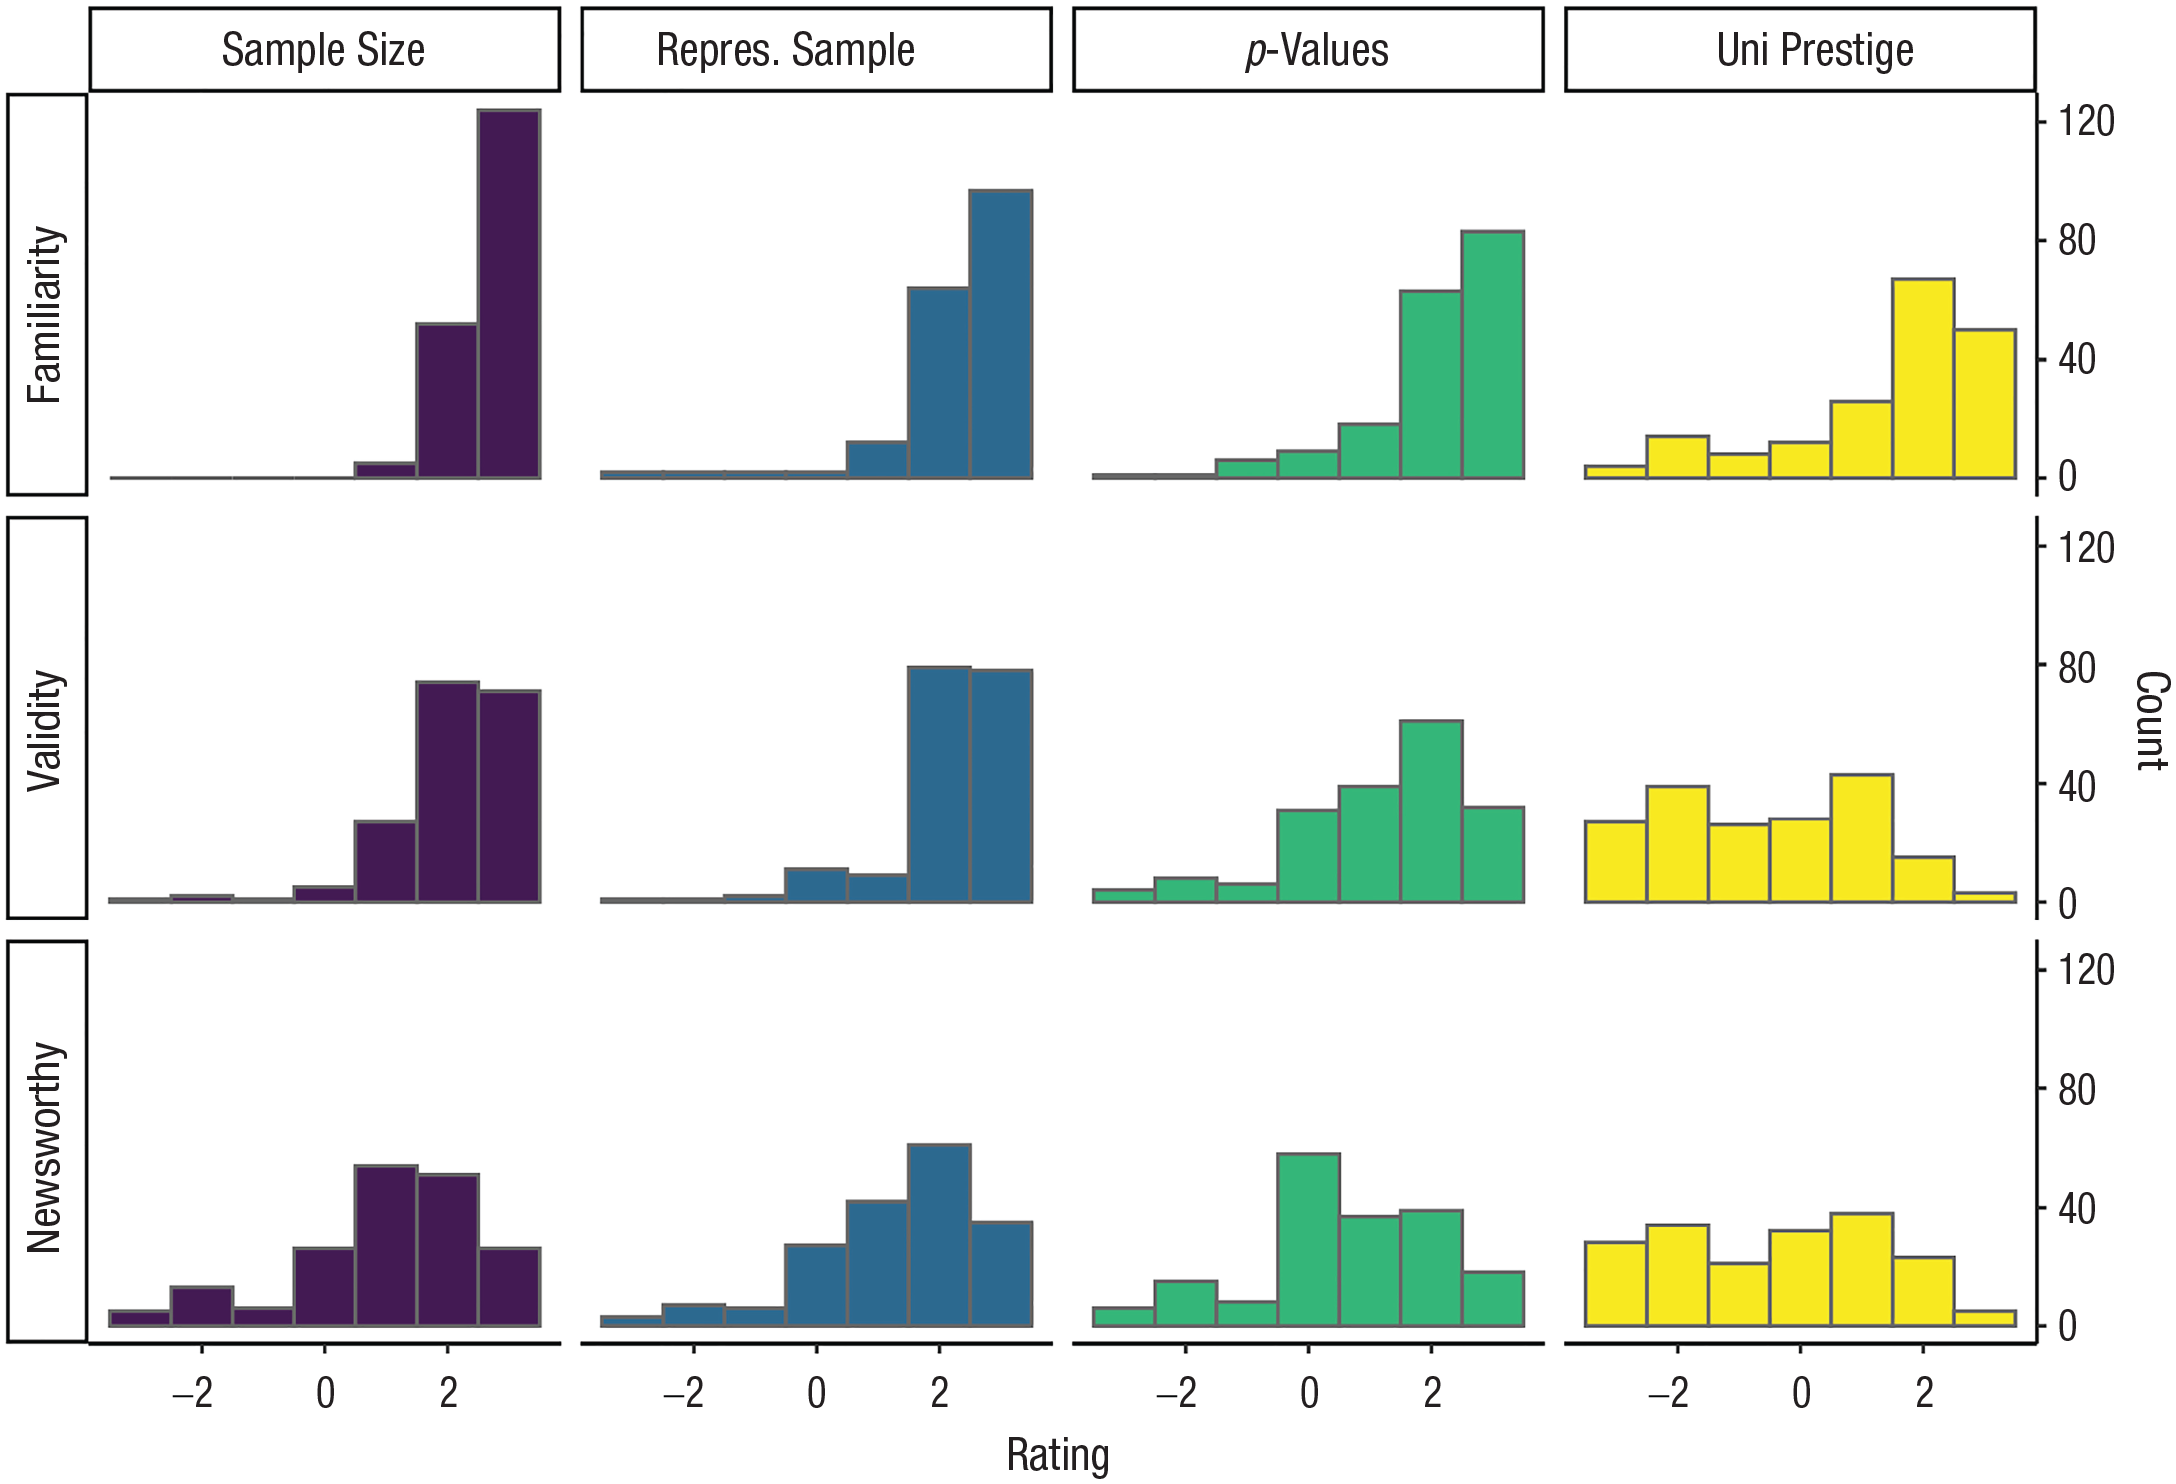
Distribution of journalists’ answers to questions about their familiarity with each of the independent variables as a factor that may be used when evaluating the quality of a study (top row) and whether they thought these factors increased the validity of a study (middle row) and newsworthiness of a study (bottom row).
Main research questions
To examine our first research question, we fit a linear mixed-effects model in which trustworthiness ratings were predicted by each of the four independent variables: the sample size, the sample type, the p value, and the prestige of the university. In addition to the main effect of each variable, our model also included random intercepts for participant and vignette, allowing us to account for variability because of a participant’s particular characteristic (e.g., a participant’s general tendency to rate vignettes as more trustworthy).
University prestige did not significantly affect trustworthiness ratings (B = −0.01, bootstrapped 95% CI = [−0.13, 0.11], t = −0.09, p = .926), and neither did having a more representative sample instead of a convenience sample (B = 0.12, 95% CI = [–0.00 0.23], t = 1.95, p = .051). Having a lower p value did have a very small but statistically significant effect on trustworthiness ratings (B = 0.15, 95% CI = [0.05, 0.27], t = 2.61, p = .009). The most robust effect was that larger sample sizes led to higher ratings of trustworthiness (B = 0.73, 95% CI = [0.61, 0.85], t = 12.44, p < 2×10-16) such that having a small sample (N between 50 and 89) led to studies being rated 0.73 points lower on a −3 to +3 scale than having a larger sample (N between 500 and 1,000). This is shown in Figure 2.

What factors influence journalists’ ratings of trustworthiness? Trustworthiness was rated on a −3 to +3 scale; bootstrapped 95% confidence intervals. Effects are presented in raw units (difference between two conditions; e.g., smaller vs. larger p value).
We fit a similar mixed-effects model to examine our second research question: whether newsworthiness ratings were predicted by each of the four independent variables. For the same reasons as mentioned previously, we also included random intercepts for participant and vignette.
Results were quite similar: University prestige did not significantly affect newsworthiness ratings (B = 0.03, bootstrapped 95% CI = [−0.12, 0.16], t = 0.39, p = .696), and neither did having a more representative sample instead of a convenience sample (B = 0.09, 95% CI = [−0.04, 0.22], t = 1.35, p = .179). Having a lower p value had a very small but significant effect on newsworthiness ratings (B = 0.15, 95% CI = [0.03, 0.28], t = 2.31, p = .021). Once more, the only robust effect was that vignettes with larger sample sizes were perceived as more newsworthy (B = 0.59, 95% CI = [0.45, 0.72], t = 9.01, p < 2×10-16) such that having a small sample led to studies being rated 0.59 points lower on newsworthiness on our −3 to +3 scale compared with having a larger sample. This is shown in Figure 3.
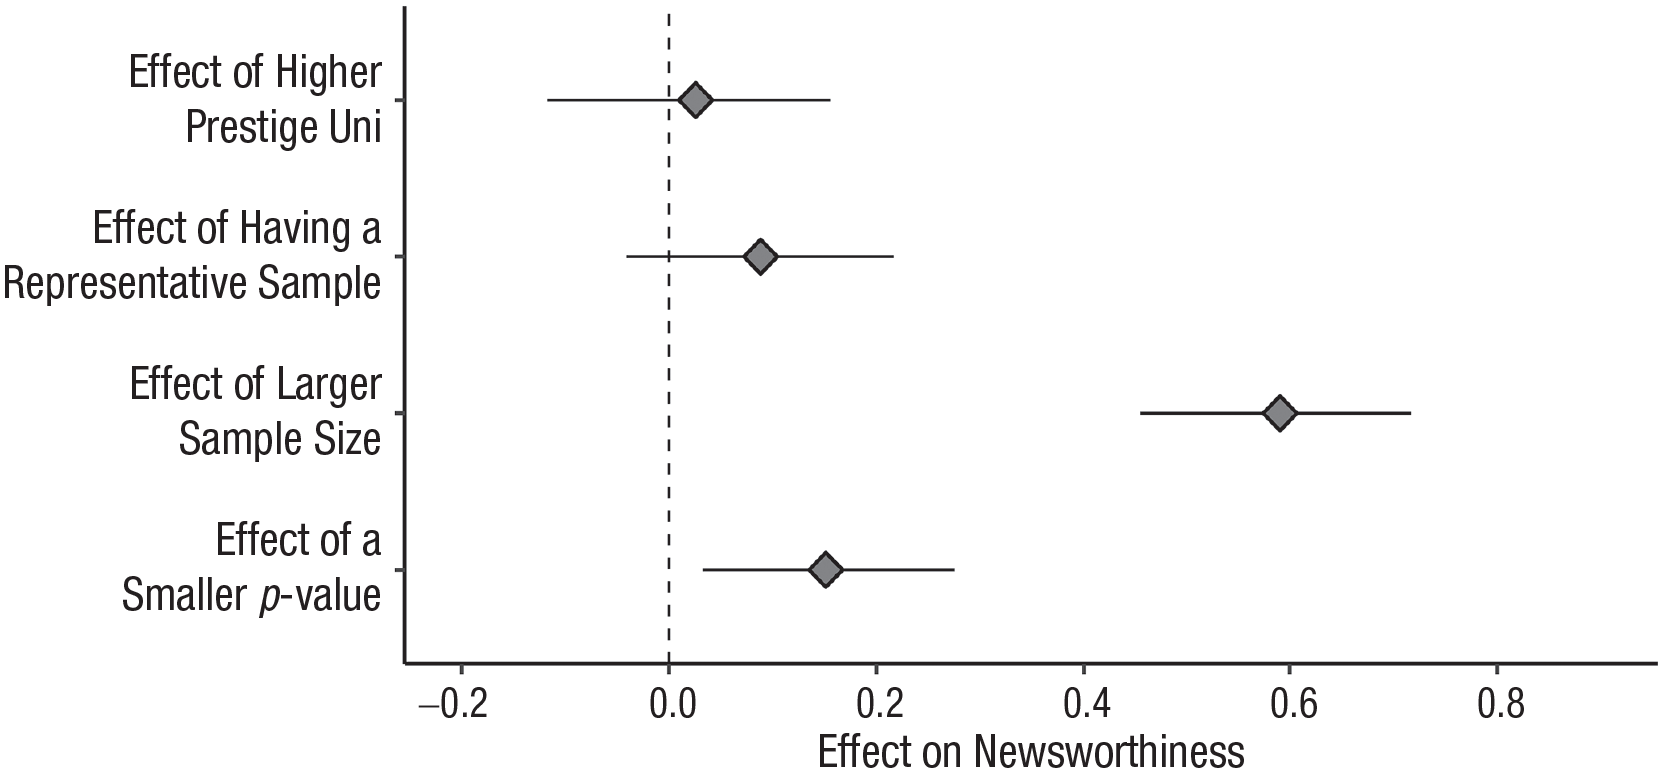
What factors influence journalists’ ratings of newsworthiness? Newsworthiness was rated on a −3 to +3 scale; bootstrapped 95% confidence intervals. Effects are presented in raw units (difference between two conditions; e.g., smaller vs. larger p value).
Exploratory analyses
All analyses presented below were not preregistered and were run after we had already seen the data and results.
Equivalence tests
To determine whether the nonsignificant results and the significant results with very small effect sizes provide evidence of absence (i.e., suggest that the effect is smaller than our smallest effect size of interest [SESOI]), we performed equivalence tests for our mixed models (Isager, 2019). We did not select our SESOI a priori, but only after this analysis was suggested by a reviewer during peer review. For our SESOI, we chose an unstandardized main effect of 0.2 scale points in raw units on the original −3 to +3 scale because that is the effect size we used for our power calculation. This gives us an equivalence bound of −0.2 to 0.2, with an α of .05.
Trustworthiness
For the effect of higher university prestige on trustworthiness, the equivalence test was significant on both ends, p < .001, suggesting the effect of university prestige on trustworthiness is statistically equivalent to zero. For both the effect of having a more representative sample and the effect of having a smaller p value, the equivalence test was not significant at the upper bound (p = .08 and p = .22, respectively). When taken with the main analysis, this suggests inconclusive results for these variables such that we can neither rule out our smallest effect size of interest nor rule out that there is no effect.
Newsworthiness
For the effect of higher university prestige on newsworthiness, the equivalence test was significant on both ends, p < .005, suggesting the effect of university prestige on newsworthiness is statistically equivalent to zero. Surprisingly, this was also true for the effect of having a more representative sample; the significant equivalence test on both ends (p < .05) suggests this effect is also statistically equivalent to zero. Finally, for the effect of having a smaller p value, the equivalence test was not significant at the upper bound (p = .23), suggesting an inconclusive result such that we can neither rule out our smallest effect size of interest nor rule out that there is no effect.
Variance partitioning
How much of the variance in the dependent variables (trustworthiness and newsworthiness) can our model explain, and how much of that is due to the vignettes, the participants, or the manipulated variables? For the trustworthiness model, 38% of the variance in this dependent variable can be explained by different parts of the model. First, about 20% of the variance is due to between-participants differences, whereas 11% is due to between-vignettes differences. Finally, around 7% of the variance is explained by our manipulated variables, most of which is due to the sample-size variable.
For the newsworthiness model, 39% of the variance in this dependent variable can be explained by different parts of the model. First, 26% of the variance is due to between-participants differences, whereas 9% is due to between-vignettes differences. Finally, 4% of the variance is explained by our manipulated variables, most of which is due to the sample-size variable.
Associations with vignette characteristics
The vignettes naturally varied in several ways other than the manipulated characteristics. These differences were accidental—in coming up with hypothetical studies and findings, we naturally came up with vignettes that varied in their design and in the characteristics of the researchers. Note that unlike our manipulated variables, these variables were not randomly assigned to vignettes—they were confounded with the content of the vignettes. Although we had no plans to examine any of the variables on which the vignettes naturally varied, after reading participants’ open-ended answers about what factors they used to evaluate the vignettes (see below for a summary of some of the most common themes), two characteristics stood out to the coders as potentially explaining some of the variance in participants’ ratings. The first was the design of the study—whether it was experimental or correlational. As it happened, 11 out of the 22 vignettes we used presented a study that was described as (or strongly implied to be) an experiment, and 11 presented a study with a correlational design. The second characteristic that stood out to us was the implied ethnicity of the researcher. Every vignette included a quote from the fictitious researcher along with the researcher’s last name. As it happened, 11 out of the 22 vignettes we used presented a last name that was likely to be perceived as non-White or as Hispanic (e.g., Zheng, Mustafa, Rivera), and 11 presented a last name that was unlikely to be perceived as non-White or as Hispanic (e.g., Quinn, Cabot, Carter). Although these two characteristics were not experimentally manipulated, we could still examine the association between judgments of trustworthiness/newsworthiness and these variables as they naturally varied across vignettes.
To examine the association between the study design (experimental vs. correlational) and trustworthiness ratings, we fit a mixed-effects model with the study-design variable as the only predictor and random intercepts for participant and vignette, similarly to our models for the main analyses. We found that having an experimental design was a good predictor of trust in a vignette’s findings (B = 0.56, bootstrapped 95% CI = [0.26, 0.92], t = 3.31, p = .003) such that people rated vignettes with an experimental design as being half a point higher on trustworthiness on average. This effect was similar for newsworthiness: Vignettes with experimental designs received higher newsworthiness ratings than vignettes with correlational designs (B = 0.47, 95% CI = [0.11, 0.82], t = 2.59, p = .018).
There was no association between the implied race/ethnicity of the researcher and either trustworthiness or newsworthiness ratings (trustworthiness: B = −0.12, 95% CI = [–0.58, 0.30], t = −0.59, p = .563; newsworthiness: B = −0.01, 95% CI = [–0.40, 0.38], t = −0.03, p = .974).
Themes in the open-ended responses
After participants had read all eight vignettes, we asked them three open-ended questions: “What characteristics do you [typically] consider when evaluating the trustworthiness of a scientific finding?” “What characteristics did you weigh in judging the trustworthiness of the findings presented?” and “We varied some characteristics of the fictional studies you read about. . . . Do you think you know what any of them were?” As reported above (Table 1), participants often mentioned the four manipulated variables—the sample size and its representativeness, the p value, and the prestige of the university where the research was done—across all three questions. However, there were also a few other recurring themes. Table 2 shows the most interesting themes we noticed in participants’ responses to each of the three questions with a few selected examples for each. This is a subjective, nonsystematic exploration of the topics brought up by the participants in their free responses, but it serves to illustrate the content of the answers given by the participants and potentially generate new research questions for future research.
Percentage of Science Journalist Participants Who Identified Each of the Four Manipulated Variables in Their Answers to Each of Three Open-Ended Questions (Answered After Participants Rated the Eight Fictitious Vignettes)
Selected Examples of Themes in Open-Ended Responses Beyond the Four Manipulated Variables

Note: For an extended version of this table of examples, see https://osf.io/drzga/.
When asked what characteristics of a study they considered when evaluating its trustworthiness, participants often mentioned the prestige of the journal in which it was published or the fact that it had been peer reviewed. Many participants also seemed to value experimental methodology, or methodology that allows researchers to make causal claims. Some answers suggested that journalists do take statistical significance into account, but only very few included explanations that suggested they made any distinction between higher or lower p values; instead, most mentions of p values suggest journalists focused on whether the key result was statistically significant.
Many participants mentioned that it was very important to talk to outside experts or researchers in the same field to get a better understanding of the finding and whether it could be trusted. Journalists also expressed that it was important to understand who funded the study and whether the researchers or funders had any conflicts of interest. Finally, they indicated that making claims that were calibrated to the evidence was also important and expressed misgivings about studies for which the conclusions do not follow from the evidence.
When explaining what details in the vignettes they had relied on to judge the trustworthiness of the presented studies, many of these same themes resurfaced, including mentions of overclaiming or claims that were not calibrated to the evidence or design of the study and concerns about the methods that were used, including making causal claims based on correlational evidence. Participants also mentioned the general plausibility of the findings as an important factor in helping them evaluate the trustworthiness of each study. Many participants said they did not have enough information to evaluate the presented study vignettes and implied that their typical evaluation when deciding whether to pursue a story is much more thorough, sometimes relying on outside experts, a full press release, or the entire article.
Finally, participants correctly guessed our manipulated variables quite often, but many other naturally varying characteristics of the vignettes were also brought up. Many participants guessed we were manipulating the study design, the ethnicity of the researcher through last names, and the level of overclaiming or the calibration of the claim being made at the end to the evidence presented. A few participants guessed that we manipulated the gender of the researcher (e.g., “I also noticed that the gender of the quoted researcher seemed to be male in most of the paragraphs”) even though no information about researcher gender was provided in the vignettes.
Discussion
In this study, we examined the causal influence of four factors on (likely U.S.-based) science journalists’ evaluations of the trustworthiness and newsworthiness of fictitious psychology findings. This study is a first step toward understanding the process that science journalists go through when reading, evaluating, and reporting on science.
Sample size was the only one of the four manipulated factors that had a robust influence on participants’ ratings of trustworthiness and newsworthiness across vignettes. This effect was consistent with scientific reasoning; larger samples provide more evidence and precision and so are generally considered more trustworthy, all else being equal. The magnitude of the effect of sample size on science journalists’ evaluations was modest; vignettes describing studies with larger samples were perceived as more trustworthy and newsworthy by about two-thirds of 1 point on a 7-point scale compared with vignettes describing studies with smaller samples. The finding that this was the only manipulated variable that influenced participants’ evaluations is consistent with participants’ self-reports on the open-ended question: When asked what factors they used to evaluate the findings in this study, 79% of participants mentioned using sample size, the highest of any of the four manipulated factors.
In contrast, the other three factors did not have appreciable effects on science journalists’ perceptions of the trustworthiness or newsworthiness of studies. Studies with samples that were more versus less representative, results with small (close to zero) versus large (close to .05 but still significant) p values, and research from more versus less prestigious institutions were all perceived similarly by our participants. Our study was designed to provide quite precise estimates, and indeed, the 95% CIs around these results exclude all effects larger than about one-third of 1 point on a 7-point scale. Furthermore, taking into account the equivalence tests performed on these estimates allows us to rule out meaningful effects of university prestige in conditions similar to this experiment. In contrast, we are not able to rule out a really small but still potentially meaningful effect of smaller versus larger p values or sample representativeness on at least one of our outcomes, rendering these results mostly inconclusive. We emphasize that we chose an extremely small SESOI (one-fifth of 1 point on a 7-point scale), so even if such an effect did exist, the reader’s guess is as good as ours as to whether it could have any practical significance. In short, a study’s sample size seemed to matter quite a bit more for journalists’ evaluations of research than did the representativeness of the study’s sample, the p value of the (significant) result, or the prestige of the researcher’s institution.
Although we did not preregister any predictions, we admit to being surprised by the finding that journalists’ evaluations of research were not affected by the prestige of the authors’ institutions. We expected journalists to perceive research conducted at more prestigious institutions to be both more trustworthy and more newsworthy. Our results suggest our assumption—that science journalists are influenced by flashy university names—is wrong, at least in contexts similar to this experiment (including those in which journalists may feel the need to self-present in a positive way) and with journalists similar to the participants in our sample. We discuss some potential alternative explanations for this finding below.
We also found that manipulating the representativeness of the samples did not affect journalists’ perceptions of trustworthiness or newsworthiness. Again, although we did not preregister any predictions, we found this surprising given how often social-science research is critiqued (and critiques itself; Clarke et al., 2023) for relying too heavily on student samples (e.g., Rad et al., 2018). Moreover, there has been a big push for more diverse samples in the social sciences (Henrich et al., 2010), although it is not clear that this has translated into better research practices on this front. Nevertheless, we suspect that most social scientists assume that their research is judged, in part, based on the effort they put into recruiting samples that match the population they wish to understand. If it is in fact the case that the representativeness of the sample does not affect how science journalists evaluate research, this would suggest a mismatch between what social scientists believe that the media or the public care about and what science journalists care about. Below, we discuss some alternative explanations for this finding.
We also did not detect much effect of the research finding’s exact p value on journalists’ evaluations. Both levels of this manipulation presented vignettes in which results had statistically significant p values, but in one condition, p values were far below the significance threshold of .05 (e.g., p = .003), whereas in the other condition, p values were only just below .05 (e.g., p = .041). Effects that are nonzero in the population are much more likely to produce p values close to zero than close to .05 in sample data, and p values close to .05 indicate results that are more likely to have been influenced (likely inadvertently) by p-hacking or overfitting (compared with results with p values close to zero; Simmons et al., 2011; Simonsohn et al., 2014). We did not necessarily expect science journalists to be familiar with or to apply this reasoning (and, again, we did not make any predictions regarding the effect of this manipulation). Our results in conjunction with participants’ open-ended responses (see Table 2) suggest that there may be some journalists who were influenced by this manipulation of p values but that most were not. This suggests a potential area for greater communication between methodologists and science journalists to ensure that information about how to evaluate statistical results is shared with people who can use it.
Exploratory analyses of participants’ open-ended comments (see Table 2) suggest that there are many other factors that can influence science journalists’ judgments of research findings than those we included in our study. First, whereas manipulating p values within the statistically significant range (0–.05) did not have much of an effect on journalists’ evaluations, their comments suggest that whether the p value is statistically significant (i.e., p < .05 vs. p > .05) may matter more. It is also possible that differences in the norms surrounding p-value thresholds had an impact on this result. Different fields of science often adopt other thresholds for publication than psychology’s customary .05. Because this sample of science journalists reported covering a variety of domains, with only about a quarter covering psychology specifically, there might be a lot of variance among participants in how they interpret our vignettes’ statistical results. For example, journalists accustomed to physics, in which the usual significance threshold is much lower, may consider all p values presented equally “too high,” whereas the opposite might be true of journalists accustomed to fields in which results with even higher p values are still publishable.
Another factor that may be influential is different types of prestige. Although manipulating the prestige of the researchers’ universities did not have an effect on journalists’ evaluations in our study, their comments suggest that the prestige of the journal in which the research is published may matter more. We did not manipulate this factor in our study, and journal names were not mentioned in any of the vignettes presented, but many of our participants spontaneously mentioned this factor nonetheless. This also suggests prestige may play a role in other ways we were not able to capture in our study (e.g., the prestige of specific researchers or research groups in a given field, independent of what university they are at).
Several journalists mentioned factors related to other scientists’ approval as a factor that they typically use to evaluate research. This included whether a finding had been through peer review and the opinions on the finding from other researchers in that field. This suggests that journalists may supplement their own knowledge of how to evaluate a scientific finding with information provided by researchers unaffiliated with the study, whether indirectly through peer review or more directly as external expert sources. Specifically, journalists mentioned that it was important these researchers be independent of the original research team.
Study design and methodology was revealed to be quite relevant to the participants’ evaluations. Several journalists mentioned whether the study was experimental or observational as being important to how they typically evaluate research findings. Although we did not manipulate study design in a controlled fashion, it varied incidentally across vignettes, so we were able to conduct exploratory analyses to test this. We found that, indeed, vignettes presenting experimental research were perceived as more trustworthy and newsworthy than those presenting observational research (although we cannot rule out confounds because we did not systematically manipulate this variable). Other aspects of study design, such as randomization and measurement practices, were also mentioned by participants in their open-ended answers, indicating that the design of the study itself is quite important to how it is evaluated.
The plausibility and calibration of the claims being made was also frequently mentioned in the open-ended responses. We noticed this concern took a variety of forms; some participants mentioned the surprisingness of the finding itself or whether it seemed “silly” as something they used in their evaluations. Others mentioned a possible mismatch between the evidence and the claims being made—for example, making generalizations based on a small and/or unrepresentative sample. Although claim plausibility does not require much formal training to evaluate, if journalists are interested in being able to spot the specific validity threats mentioned, they might benefit from specialized training.
One final aspect mentioned by science journalists refers to researchers’ conflicts of interest and sources of funding for the research. Although it is common to disclose funding sources in psychology, the disclosure of conflicts of interest is much less frequent. This theme came up when participants were asked about what they typically use to evaluate research, so it raises the question of whether this is always important for journalists or whether it matters more for some disciplines than others. If it does matter more generally, this could translate into higher credibility for psychology (or social-science articles more generally) that choose to have a more thorough disclosure of conflicts of interest.
Limitations
Although we believe our results are an important first step in understanding the process through which scientific findings get communicated to the public, our study has several limitations. First, having journalists evaluate scientific findings by presenting them only with short, fictitious study vignettes enhances experimental control but is highly artificial compared with science journalists’ usual process. This was reflected in participants’ answers to the open-ended question asking them what information they used when evaluating the study vignettes; many participants mentioned not having enough information or implied that their real evaluation process is much more thorough than this context allowed (e.g., “This was a difficult exercise as there wasn’t much information to go on”; for more examples, see Table 2). This problem could be mitigated by more accurately mirroring journalists’ process as they evaluate research findings. One solution might be to use press releases for real findings, which would include more information than our vignettes and are closer in format to what journalists first see when they encounter a potential topic to write about. This is a particularly relevant distinction because there is evidence that the cautiousness of the claims made in press releases may affect the cautiousness of the claims made in media coverage of the research (e.g., Adams et al., 2019).
We feel confident that we can generalize from the results of our 22 specific vignettes to other possible vignettes containing similar types and amounts of information because we modeled vignette as a random factor and because journalists’ ratings of the vignettes’ trustworthiness and newsworthiness suggest there was a good amount of variance among these 22. However, we cannot generalize beyond this type of vignette, which all presented fictitious behavioral-psychology findings. Thus, we have no reason to believe these results would generalize even to studies of how journalists evaluate findings in other subfields of psychology, much less findings in other fields.
Another limitation of this study is how the sample of science journalists was obtained. We used a snowball-like sampling approach: C. Aschwanden sent a recruiting message to her professional network, and the message included a request to forward it to other science journalists they might know. Although the size of the sample we obtained (N = 181) suggests we were able to collect a range of perspectives, we suspect this sample is biased by an “Aschwanden effect”: that science journalists in the same professional network as C. Aschwanden will be more familiar with issues related to the replication crisis in psychology and subsequent methodological reform, a topic C. Aschwanden has covered extensively in her work. Therefore, we are not confident that the results obtained here can be generalized to all U.S.-based science journalists. Instead, our conclusions should be circumscribed to U.S.-based science journalists who are at least somewhat familiar with the statistical and replication challenges facing science.
Of course, the sample and design being primarily U.S.-focused also means that our findings have unknown generalizability outside of the United States. We suspect that most of the variables we manipulated have similar effects on science journalists across countries that are culturally similar to the United States, but the university prestige variable may be unique to the United States. Other countries may have their own version of gradations of university prestige, but we suspect the U.S. stereotypes about high- versus low-prestige universities are stronger than in many other countries. The manipulation of sample representativeness was also U.S.-focused, with the “high representativeness” conditions still reflecting mainly U.S.-based samples.
Another limitation is that we used ad hoc items and scales for all of our measures. We do not think this was a problem for the key measures: Both the trustworthiness and newsworthiness dependent variables had multiple items with very good reliability, and the concepts were straightforward. However, the high correlation between the two outcomes suggests we were not able to empirically distinguish these two conceptually distinct constructs. This could reflect a halo effect, in which journalists interpreted both sets of items as tapping a common underlying factor, such as the value of the research. In addition, the high correlation between the two dependent variables could reflect the influence of demand characteristics such that participants tried to convey that they would not cover untrustworthy studies. Certainly, the psychometric properties of science journalists’ judgments (e.g., the number and content of dimensions along which journalists evaluate potential findings) might be worth exploring in future studies.
Moreover, at least one variable in our secondary analyses, measured with an item created by us ad hoc, clearly suffered from low validity. Specifically, when asked to describe their familiarity with all four manipulated variables as a factor that may be used when evaluating the quality of a study, participants reported being much less familiar with university prestige than any of the other three variables. This suggests participants did not interpret this question as intended (i.e., as being about familiarity) given that we would expect most participants to be extremely familiar with university prestige as a factor that could be used as an indicator of research quality because this is quite common in a U.S. context. Rather, the result suggests at least some participants were expressing their disagreement that university prestige is a valid indicator that a particular finding can be trusted. The familiarity item was not used in our primary analyses.
Another concern is that the journalists in our study were aware of being studied, which may give rise to demand characteristics or concerns about self-presentation. The participants were often highly trained science journalists, and many accurately guessed what variables were being manipulated across vignettes: Nearly two-thirds hazarded a guess about what variables were being manipulated, and more than 95% of participants correctly guessed at least one manipulated variable. We anticipated this and decided a priori not to treat data from those participants differently because we did not think that being aware of the research hypotheses would alter participants’ responses or present a threat to the validity of our conclusions. Nevertheless, whether or not participants could guess what was being manipulated, we are concerned about the possibility that participants’ responses could have been influenced by feeling that their answers might be judged. Specifically, it is also possible that participants believed there was a “right” answer (or believed that the researchers were looking for a specific answer) and, instead of answering honestly, gave the answer that they believed would be judged as correct. This poses a problem for interpreting our results. For example, it may not be that participants truly trust research with larger samples more but instead believe that to be the “correct” answer or the answer the researchers were looking for. This is especially plausible because, indeed, we (and likely other researchers) do in fact believe that some of the factors we manipulated should influence science journalists’ judgments of trustworthiness and newsworthiness.
Another challenge to interpreting our results is that it is difficult to compare the results across the four manipulated factors. Some manipulations were probably more salient than others. For example, although the representativeness of the sample and the university where the research was done were presented in text and blended in with the rest of the vignette, the p value and sample size were presented numerically and likely stood out more visually. In particular, the sample-size information may have stood out because in 10 of the 22 vignettes, the sample-size number was at the start of a sentence, which is unusual—and incorrect, according to Associated Press style guidelines, which journalists will certainly be familiar with. Such differences in how salient the manipulated factors were likely to be can make it difficult to compare effects across these factors.
Some of these problems arise from the fact that we had to dichotomize our variables to be able to manipulate them (e.g., decide on a “high” vs. “low” level) when all four are, in fact, continuous. We attempted to select two slices of these continuous variables that we thought would show the largest difference while still being realistic and appropriate for our study design. However, our findings may be specific to the slices we selected, and we may inadvertently have made some of the comparisons starker than others. For example, it is difficult to know how to translate the difference between small and large (significant) p values into a conceptually similar difference in sample size. Our decision to use sample-size categories of 50 to 89 versus 500 to 1,000 may have been crucial to our finding that sample size had a bigger effect on journalists’ ratings than did the other variables we manipulated. Moreover, sample size may matter a lot more than the other factors for the specific range we used, but there is almost certainly a range after which it will stop mattering as much. Is a study with 3,000 people noticeably more trustworthy than one with 1,000? In other words, our findings may not generalize to other levels of these variables we manipulated. Furthermore, another characteristic that journalists reported using when they evaluate findings is whether a study was significant (p values above vs. below .05), suggesting that this “slice” of the p-value variable might also be worth investigating. Finally, we manipulated sample representativeness by varying whether the vignette participants were from a convenience or a more representative sample of people in the United States—if we had instead compared convenience samples to globally representative samples, this variable may have had more impact on journalists’ ratings. In the end, we cannot be sure that other slices of the same variables would not show stronger or weaker effects.
More broadly, this raises the question of whether we selected the most relevant factors to manipulate. Our exploratory analyses suggest that vignettes presenting an experimental study received higher ratings of trustworthiness and newsworthiness compared with those that included an observational study. This correlational evidence in conjunction with the comments from journalists, which often mentioned experimental design as a factor they use when evaluating findings, suggests that this and other variables we did not manipulate might have an important impact on journalists’ evaluations.
Implications
Despite these issues, our results do suggest some practical implications. In particular, the result for sample size might indicate that for some science journalists, samples smaller than 100 participants (in a typical, between-subjects social-psychology study) are particularly untrustworthy—enough to noticeably decrease their evaluations. This might suggest that the perils of small sample sizes are a more talked-about issue, making it an easy basis for a “rule of thumb.” Although a small sample can be indicative of methodological issues, if attention to sample size comes at the expense of attention to more diagnostic information presented, this could be a problem. In our study, sample size had a substantially larger effect on journalists’ evaluations of research than did other factors that are arguably equally—or more—important, such as the extremity of the statistical result and the representativeness of the sample. A large but nonrepresentative (or biased) sample may result in inaccurate estimates with small CIs that convey trustworthiness but are in fact incorrect (e.g., Bradley et al., 2021).
The lack of any effect of sample representativeness is interesting, especially for psychologists, who often do research on convenience samples. Within psychology, there seems to be much talk and little action about this problem. The results of the current study suggest that perhaps the lack of action could be due in part to a lack of consequences—findings based on samples that are very unrepresentative of the population that researchers claim to be studying (e.g., “undergraduates at the university”) were rated as just as trustworthy and newsworthy as findings from studies in which the sample and population are more similar (e.g., “people from a nationwide sample”). Given the extra effort often required to recruit more representative samples, if the consequences are trivial, at least as far as media exposure and criticism from journalists go, then this could help perpetuate the status quo.
In addition, we feel confident concluding that even for science journalists who are familiar with the replication crisis, how close a significant p value is to the threshold for significance does not affect journalists’ evaluations, on average. We suspect that if this sample of journalists was not influenced by variation in the extremity of statistically significant p values, then it is unlikely other science journalists would be. Once again, this suggests that there may not be negative consequences (in terms of media attention and credibility in journalists’ eyes) for engaging in questionable research practices (e.g., p-hacking) or much reward for engaging in practices that reduce the risk of p-hacking.
Finally, although university prestige did not seem to influence journalists’ evaluations of research findings in our study, we do not think that this means that journalists do not use prestige-related clues. Of course, it may not be a problem or may even be desirable for journalists to use prestige-related cues among other cues if prestige-related cues are valid predictors of the quality or importance of research findings and journalists do not rely heavily on this cue. However, many prestige-related variables are poor proxies for quality (Brembs et al., 2013) and can be problematic for other reasons (e.g., perpetuating inequalities). Thus, we encourage more research into other possible prestige-related factors that influence journalists’ evaluations and the degree to which journalists rely on these cues in naturalistic contexts. For example, several of the journalists in our study mentioned using journal prestige when asked about how they normally evaluate findings (“[I pay attention to] the journal itself where the findings were published and its impact factor”; for more examples, see Table 2). If journalists are influenced by journal prestige more than by university prestige, this may suggest that journalists’ evaluation process is similar to researchers’ (who notoriously use journal prestige as a shorthand for research quality; Harney et al., 2021). If this cue has a strong influence on journalists’ evaluations of research quality, we would find this concerning because of the growing evidence that journal prestige is a poor indicator of research quality and that its use as a proxy for quality is harmful (Brembs et al., 2013; Vazire, 2017).
Future directions
How can we gain more insight into what factors science journalists use to evaluate research? First, qualitative studies would be helpful for generating hypotheses. For example, our selection of the four manipulated variables was driven by our interests in these factors and our perception that they may or should play a role in journalists’ evaluations. However, if we had asked science journalists to describe their process, we might have selected a different set of variables (e.g., journal prestige instead of university prestige). The open-ended questions in this study provide a glimpse into what researchers could learn from a qualitative study and are a good starting point when generating ideas for follow-up studies.
One avenue for future research is to observe journalists in their usual decision-making process. For example, by collaborating with practicing science journalists, observational studies could compare what findings journalists report on versus what they hear about but decide not to report on. This would allow us to examine what factors are associated with these decisions. Observational studies could also examine what questions journalists ask when they contact independent researchers to inform their evaluation of the research they are considering reporting on. This may offer insights into what aspects of the study are most important for journalists’ judgments of trustworthiness and newsworthiness. Finally, observational studies could examine what is taught in journalism schools and training programs. What tools are these training programs providing prospective journalists for evaluating research?
Finally, if the goal is to improve the quality of science communication, conducting intervention studies might clarify what actions would get individuals there faster. For example, would educating journalists about methodological issues have a substantial impact on how they decide which findings to report on? This might be especially valuable if done at journalism schools by providing journalists with the tools they need to evaluate the soundness of research early in their careers. Another possible avenue for interventions is training journalists on how to ask better questions of scientists. Several participants mentioned that getting the perspective of independent researchers was part of their process when deciding whether to report on a study; doing so more effectively might improve their ability to evaluate the quality of the evidence in a scientific article.
Conclusion
In this contrived setting with this specific sample, the sample size of the study presented to science journalists seemed to have an important influence on their evaluations of the trustworthiness and newsworthiness of the research. In contrast, the representativeness of the sample in the research presented, the level of statistical significance of the research finding’s p value, and the prestige of the researchers’ affiliation did not seem to influence science journalists’ evaluations. Our exploratory results suggest that experimental research is trusted more than observational research, and the open-ended responses suggest that the prestige of the journal in which the research is published is also worth looking into. Quantitative and experimental studies like ours help scientists understand what implicit and/or explicit rules journalists might use when evaluating scientific studies.
Footnotes
Transparency
Action Editor: David A. Sbarra
Editor: David A. Sbarra
Author Contribution(s)