
Abstract
Several options exist for conducting inference on indirect effects in mediation analysis. Although methods that use bootstrapping are the preferred inferential approach for testing mediation, they are time-consuming when the test must be performed many times for a power analysis. Alternatives that are more computationally efficient are not as robust, meaning accuracy of the inferences from these methods is more affected by nonnormal and heteroskedastic data. Previous research has shown that different sample sizes are needed to achieve the same amount of statistical power for different inferential approaches with data that meet all the statistical assumptions of linear regression. By contrast, we explore how similar power estimates are at the same sample size, including when assumptions are violated. We compare the power estimates from six inferential methods for between-subjects mediation using a Monte Carlo simulation study. We varied the path coefficients, inferential methods for the indirect effect, and degree to which assumptions are met. We found that when the assumptions of linear regression are met, three inferential methods consistently perform similarly: the joint significance test, the Monte Carlo confidence interval, and the percentile bootstrap confidence interval. When the assumptions were violated, the nonbootstrapping methods tended to have vastly different power estimates compared with the bootstrapping methods. On the basis of these results, we recommend using the more computationally efficient joint significance test for power analysis only when no assumption violations are hypothesized a priori. We also recommend the joint significance test to pick an optimal starting sample size value for power analysis using the percentile bootstrap confidence interval when assumption violations are suspected.
Keywords
Mediation analysis examines how much a predictor variable affects an outcome variable through a mediator variable, described as the indirect effect (MacKinnon et al., 2004). According to a WebofScience search, more than 10,000 published articles across many disciplines used the technique in 2021 alone. Within that, more than 3,000 were from psychology. To effectively use these models, researchers can conduct a power analysis to determine an appropriate sample size given the size of effects they are expecting (Cohen, 1992). Ensuring adequate power prevents valuable research resources from being wasted by either collecting an unnecessarily large sample when fewer would be sufficient or collecting too small of a sample and missing an effect that actually exists.
One way to select a sample size is through power analysis. A sample size can be calculated by setting a desired power level and Type I error rate (α level), along with setting reasonable estimates for the population effect sizes (for further information on the challenges of estimating reasonable effect sizes, see Anderson et al., 2017). Power analysis for mediation also requires the researcher to first choose an inferential method. Several methods exist to make inferences about the indirect effect, each varying in statistical power (Hayes & Scharkow, 2013; Yzerbyt et al., 2018). These inferential methods also vary in computational efficiency, with the resampling methods that rely on bootstrapping being more time-consuming (Shrout & Bolger, 2002). This is particularly problematic for mediation because power analyses using bootstrapping require computer simulations in which the analysis is repeated many times. However, a major benefit to these methods is that they provide inferences that are robust to violations of normality and homoskedasticity (Biesanz et al., 2010). The purpose of this research is to evaluate whether power estimates among the methods are similar enough for researchers to use a more computationally efficient inferential method for power analysis then a more computationally intensive test for data analysis, with added benefits such as robustness to assumption violations and production of a confidence interval (CI) that justify the computational time.
Fritz and MacKinnon (2007) explored differences in sample size requirements among methods of testing the indirect effect and provided sample size guidelines for commonly observed coefficients for each inferential method of the indirect effect at the same level of power. Their analyses and subsequent recommendations focused entirely on data that met statistical assumptions of linear regression, including normality and homoskedasticity of residuals. Because Fritz and MacKinnon found that the methods required different sample sizes to reach the same level of power, researchers might conclude that they must always use the same inferential method for their power analysis as their data analysis. The current research questions this approach because it can necessitate using a method that takes much longer for power analysis because of benefits for data analysis, which are not relevant for power analysis (e.g., having a CI). Instead, similar power estimates could potentially be obtained using different inferential methods, such as when the joint significance test recommends 74 participants and a bootstrapping method recommends 78 participants for medium effects at 80% power (Fritz & MacKinnon, 2007).
To explore current practices in power analysis for mediation, we conducted a brief literature review of articles published in Psychological Science in 2020 because of the journal’s requirement for a justification of sample size selection. There were 36 articles that included the word “mediation.” Seven articles were excluded: four that mentioned mediation as a future direction, a meta-analysis, a commentary, and one that used the word “mediation” in a different context. The Supplemental Material available online includes the remaining 29 articles, indicated with an asterisk in the reference list. Only one article did a statistical power analysis for the mediation analysis using the Monte Carlo CI method for power analysis and then the percentile bootstrap CI for data analysis. Twelve articles included a power analysis for an analysis other than the mediation, and 16 articles had no mention of a power analysis at all. More guidance and recommendations for power-analysis procedures for mediation analysis are needed for documented sample size planning to become a common practice. Power analysis for mediation is so uncommon that researchers cannot rely on a common practice to understand how it is currently done, so the aim of this article is to explore a possible way to reduce the computational time required for the process.
We seek to aid researchers in estimating appropriate sample sizes for mediation analysis, including cases in which assumptions of normality and homoskedasticity are violated. First, we describe how to estimate a mediation model for between-subjects designs with one mediator and overview six inferential methods testing for mediation. Then, we discuss choosing an inferential method and the implications of that method for power analysis. We give results from a simulation study comparing statistical power for each inferential method for the same sample sizes, including when data violate the statistical assumptions of linear regression. We conclude with recommendations for when to choose a more computationally efficient inferential method for power analyses and when to switch to a more robust, time-intensive inferential method that matches the inferential method used for data analysis.
Inferential Methods for Mediation Analysis
In a mediation model, a predictor variable (X) affects an outcome variable (Y) through a mediator variable (M). Figure 1 shows the total effect of X on Y as path c, without the mediator (top) and the direct effect of X on Y in the mediation represented by c′ (bottom). The indirect effect ab is how much Y changes as a result of the X variable manipulation 1 through M.
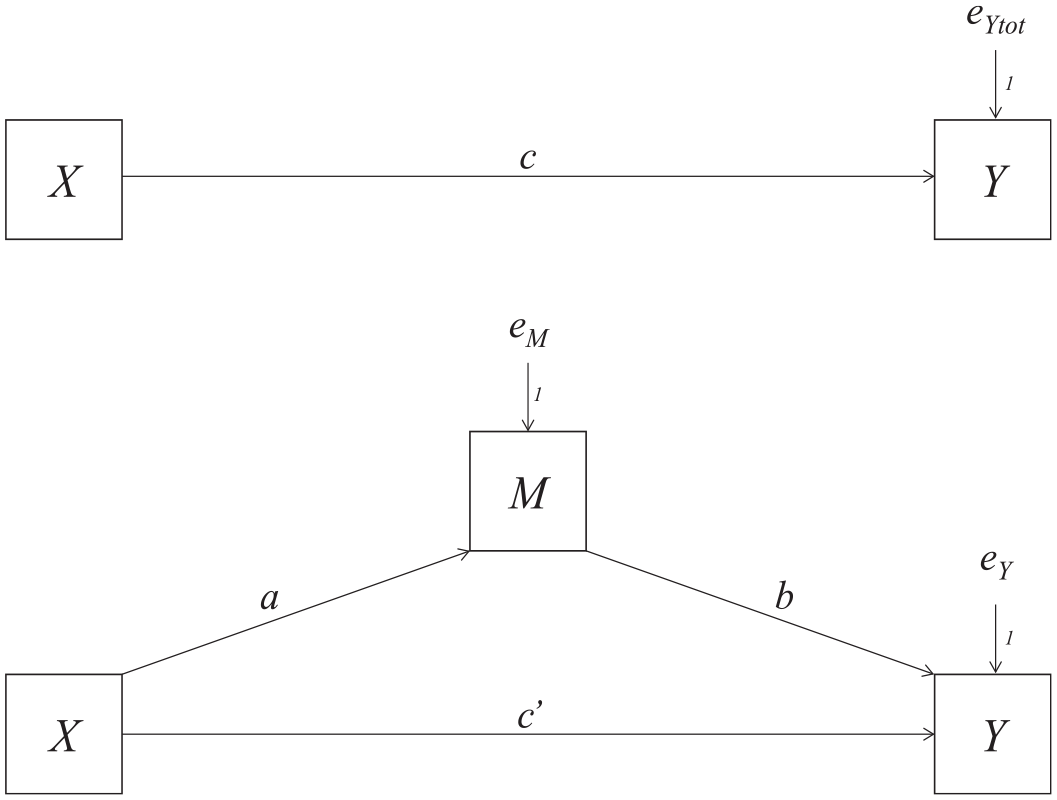
Mediation-analysis path diagram.
Mediation analysis in this regression framework can be thought of as two regression analyses, which must meet several statistical assumptions. These assumptions of regression involve the conditional distribution of the dependent variable: linearity, independence, homoskedasticity of variance, and normality (Poole & O’Farrell, 1971).
In this article, we focus on six inferential methods for the indirect effect: the causal steps approach (Baron & Kenny, 1986), the joint significance test (MacKinnon et al., 2002), the Sobel test (Sobel, 1982), the percentile bootstrap CI (Bollen & Stine, 1990), the bias-corrected bootstrap CI (Shrout & Bolger, 2002), and the Monte Carlo CI (MacKinnon et al., 2004). For all the tests, the α level must be predetermined. Table 1 provides a comparison of these inferential methods in terms of robustness to assumption violations, computational intensity, power, and Type I error rate based on prior literature.
Comparison of Inferential Methods
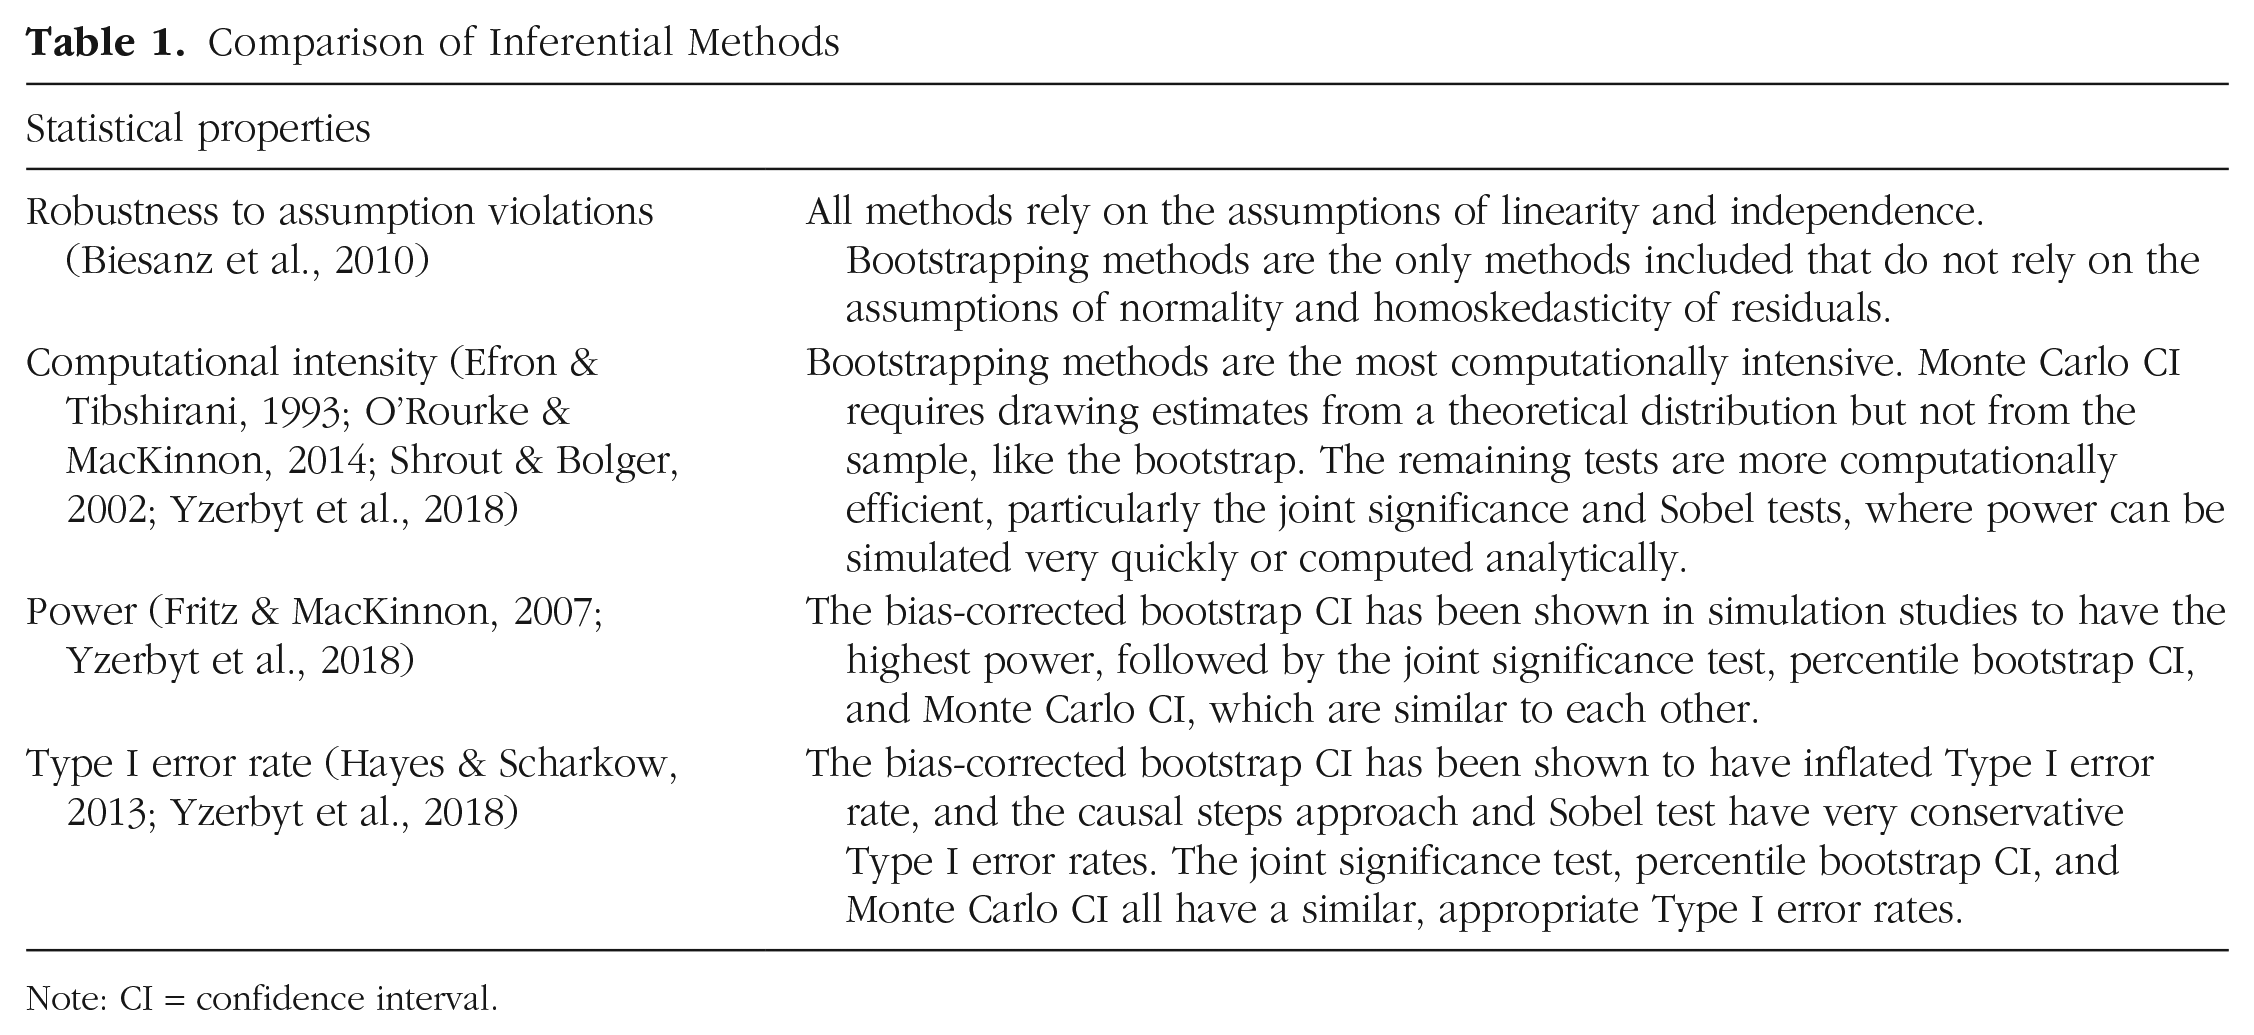
Note: CI = confidence interval.
Causal steps approach
The causal steps approach requires four null hypothesis significance tests to conclude a mediated effect exists: (1) the total effect of X on Y (c path), (2) the effect of X on M (a path), (3) the effect of M on Y controlling for X (b path), and (4) the direct effect (c′) to determine partial or complete mediation, although that is not a useful distinction (Hayes, 2009; Rucker et al., 2011). If the first three tests are all significant, the causal steps approach rejects the null hypothesis that there is no mediation.
Joint significance test
The requirement for the total effect to be significant in order to find a significant indirect effect may cause a mediated effect to be overlooked (MacKinnon et al., 2002; Preacher & Hayes, 2004). For the joint significance test, if both the a path and the b path are significant (i.e., Steps 2 and 3 above), then the researcher would conclude that mediation is present (Kenny et al., 1998). The joint significance test has a closed-form solution, and so direct calculation of power is possible, making it even more computationally efficient (O’Rourke & MacKinnon, 2014).
Sobel test
The Sobel test estimates the indirect effect and the standard error of the indirect effect using equations given in Sobel (1982). The estimated indirect effect is divided by its standard error estimate, producing a Z statistic that can be compared with a standard normal distribution to conclude if mediation is present.
Percentile bootstrap CI
Bootstrapping for mediation resamples with replacement the number of observations from the original sample, and an indirect effect is calculated from the resampled data (Bollen & Stine, 1990). This process is repeated many times to get many estimates of the indirect effect, and then the percentile bootstrap CI constructs a CI by ordering these estimates from lowest to highest. Any values above the
Bias-corrected bootstrap CI
Using the same process for generating bootstrap samples, the bias-corrected bootstrap CI method adjusts the cutoffs to account for differences between the median of the bootstrap sampling distribution and the true indirect effect. The cutoffs are calculated by doubling the Z score corresponding to the proportion of bootstrap estimates less than the original sample estimate and adding it to the cutoffs used for the percentile bootstrap CI (Efron & Tibshirani, 1993).
Monte Carlo CI
Monte Carlo CIs use sample estimates to generate estimated sampling distributions of
The distribution of the product confidence method is asymptotically equivalent to the Monte Carlo CI and is more computationally efficient; this procedure is available in the RMediate package (Tofighi & MacKinnon, 2011), but because it is originally written in closed-source software, we were unable to implement it in our simulation as one of the comparable methods.
Power Analysis in Mediation
Power for between-subjects mediation is determined by the following values: sample size; population effect size as set by path coefficients a, b, and c′; α level; and the inferential method used (for discussion of factors to consider for mediation with repeated-measures designs, see Montoya, 2022). Estimating statistical power for mediation relies on the product of two regression coefficients that does not follow a normal distribution (Lomnicki, 1967), so power analyses using simulation methods are preferred for the indirect effect because of their ability to generate the nonnormal distribution of the product (Schoemann et al., 2017). Conducting a simulation for power analysis involves generating thousands of samples of data. When an analytical formula is available for power analysis, it is possible to calculate sample size from power and power from sample size. With simulation methods, it is possible to calculate power given sample size only because thousands of samples of data from that set sample size must be simulated. This means it is often necessary to repeat the whole simulation several times for different sample sizes until a sample size is found that achieves the desired level of power, adding to the computational burden.
Software packages
Most software for power analysis for mediation implements only one or two of the discussed inferential methods. The available software packages also assume normality and homoskedasticity. No software package yet exists to output a sample size using a bootstrapping method, although bmem (Zhang & Wang, 2013) and WebPower (Zhang & Yuan, 2018) can estimate power using bootstrapping from a given sample size. For tools that can estimate a sample size for a desired power, the R package pwr2ppl (Aberson, 2019b) uses the joint significance test, the Shiny app MCpowrMed (Schoemann et al., 2017) uses the Monte Carlo CI, and the web application and R package WebPower (Zhang & Yuan, 2018) use the Sobel test by default.
Power analyses using different inferential methods differ in their computational ease. In R 4.1.1 on a laptop computer running macOS Big Sur, estimating power with the joint significance test or Sobel test takes less than a second with 1,000 repetitions with path coefficients of .26 and a sample size of 200, and the Monte Carlo CI takes only a few seconds under the same conditions drawing 1,000 samples from the random normal sampling distribution for each repetition. Power analysis using bootstrapping is much more time-consuming because each simulated sample must be bootstrapped thousands of times, taking more than 24 hr with 1,000 repetitions and 5,000 bootstraps. 2 Researchers typically repeat this process for many different possible sample sizes and coefficient estimates for power analyses. For example, if a sample size of 200 does not have sufficient power, they then need to choose a higher sample size and calculate power again. If that sample size, say 250, gives power that is higher than necessary, they would need to try a smaller sample size between 200 and 250. This iterative process goes on until a sample size is found that yields adequate statistical power. This raises the following question: Is bootstrapping, the recommended method for data analysis, worth the additional computational resources for power analysis?
Choosing an inferential method for power analysis and data analysis
No method is optimal for both power analysis, which values computational efficiency, and data analysis, where the percentile bootstrap CI with its robustness to violations of statistical assumptions and CI production is preferred (Hayes, 2009). The benefit of an inferential method being robust to violations of assumptions of normality and homoskedasticity in power analysis are still relevant, although in this process, in which each repetition is a dichotomous decision of whether the null hypothesis can be rejected, a CI is not necessary. If different inferential methods agree in terms of sample size recommendations, then the more computationally efficient method could be used for a power analysis to get close to the appropriate sample size, and then the more robust percentile bootstrap CI could be used for data analysis.
In summary, power analysis for mediation requires researchers to make a choice about which inferential method they want to use. Bootstrapping methods are the preferred method for data analysis, but they are very computationally intensive to the point where few tools are available for power analysis with bootstrapping. In addition, no tools exist that output a recommended sample size given a desired level of power. Previous research shows that the sample sizes required for 80% power from the joint significance test, the percentile bootstrap CI, and the Monte Carlo CI are very similar (Fritz & MacKinnon, 2007). This suggests that the joint significance test could be a reasonable method for approximating a sample size in a power analysis close enough to the percentile bootstrap CI. This needs to be empirically tested. The use of different inferential methods for power analysis and data analysis also has yet to be examined in situations in which data do not meet the statistical assumptions of normality and homoskedasticity.
The Present Study
This research builds on sample size recommendations for various inferential methods from Fritz and MacKinnon (2007). We test if power estimates for the same sample size at a given α level agree enough across inferential methods to use a more computationally efficient approach than the percentile bootstrap CI for power analysis. As an example, our simulation shows when both a and b are set to .59, the joint significance test recommends a sample size of 92 to achieve 80% power. Using a sample size of 92 and the same parameter coefficients, the percentile bootstrap CI achieves a power of 80.7%. If a similar pattern holds across many coefficient estimates, researchers could reasonably use a less computationally intensive method for power analysis. We also discuss the agreement of these methods in power analysis when assumptions of normality and homoskedasticity are violated and offer suggestions for researchers when they know a priori that their data will violate these assumptions.
Disclosures
Preregistration
This study was preregistered at https://osf.io/ebq9gs. The preregistered measure of agreement was power estimates within 5 percentage points for the same sample size and effect size combination. We determined agreement between each method and the percentile bootstrap CI. This is a slight deviation from our preregistration, in which all methods were intended to be compared in a pairwise manner with each other. Upon peer review, we determined this to be a more effective test of our question because it focuses on the percentile bootstrap CI as the proposed data-analytic method and explores all other methods as the method used for power analysis.
Data, materials, and online resources
Simulation code, results, and data analysis scripts are available at https://osf.io/tnpu7/.
Reporting
We report all simulations and analyses conducted as part of this work.
Method
The purpose of this simulation study was to examine how aligned power estimates are among inferential methods for mediation analysis. We do this by comparing six inferential methods for the indirect effect at the same sample sizes, including when data violate the statistical assumptions of linear regression. For each inferential method, 10,000 samples of data were generated at each sample size until the simulation found a sample size with 80% power (within 0.1 percentage points) at
Data generation
We used GAUSS 19 on a Windows server to generate data for three variables: X, M, and Y, where X is 0 or 1 with equal allocation to represent random assignment to one of two experimental conditions. Small (.02), medium (.15), and large (.35)
Data were also generated with varying levels of nonnormality and heteroskedasticity of residuals using the same effect size combinations. Six variations of nonnormal data were generated using the procedure from Fleishman (1978) to account for slight or extreme skew of the residuals of just the M variable, just the Y variable, or both. Three conditions of heteroskedastic residuals were generated using the procedure from Long and Ervin (2000): M, Y, and both M and Y. Full details of the data-generating procedures for assumption violations are available in the Supplemental Material.
Data analysis and inferential method agreement
Power was calculated as the proportion of samples that detected a significant indirect effect out of the 10,000 samples. For bootstrapping methods, each sample was bootstrapped 5,000 times. For the Monte Carlo CI, 10,000 estimates were drawn from the sampling distribution for each CI. Each inferential method was used to find the sample size at which it had 80% power for each effect size combination. That sample size was then used in a power analysis with the percentile bootstrap CI to estimate its power at the same sample size as the other inferential method. For example, we first used the Sobel test with parameters
Results
Table 2 includes the proportion of times the percentile bootstrap CI achieved power between 75% and 85% using the sample size determined from each of the inferential methods for the same effect size combination. The columns represent the assumption violation conditions, where either no regression assumptions were violated, normality was violated, or homoskedasticity was violated. For example, when the sample size required for 80% power with the Sobel test gives a power estimate of 83% with the percentile bootstrap CI for the same parameter combination, those inferential methods would be in agreement. This overall proportion of agreement is in Table 2, where the third row is the Sobel test, and the second column is the proportion of agreement with no assumption violations. Thus, .69 represents the proportion of path coefficient combinations for which the percentile bootstrap CI found power between 75% and 85% when using the sample size required for 80% power from the Sobel test assuming normal and homoskedastic residuals.
Agreement Proportion With the Percentile Bootstrap CI

Note: Proportion of times the sample size produced by each inferential method in a power analysis also had between 75% and 85% power using the percentile bootstrap CI for data analysis, split by assumption violation conditions. CI = confidence interval.
Two methods had agreement in all conditions with the percentile bootstrap CI when the assumptions of linear regression were met: the joint significance test and the Monte Carlo CI. For all 16 parameter combinations included in this simulation, these two inferential methods produced sample sizes for 80% power that had power between 75% and 85% for the percentile bootstrap CI. Using sample sizes from the joint significance test, power estimates for the percentile bootstrap CI ranged from 79.0% to 82.2%, and sample sizes from the Monte Carlo CI had power estimates for the percentile bootstrap CI ranging from 79.0% to 81.1%. The largest observed difference among the inferential methods that met that criteria was 2.1% off using the joint significance test. The sample sizes required for 80% power using the causal steps approach, the Sobel test, and the bias-corrected bootstrap CI did not always agree with the percentile bootstrap CI. However, this disagreement occurred only for certain parameter combinations; for details, see Table S2 in the Supplemental Material.
The causal steps approach, Sobel test, and bias-corrected bootstrap CI had low agreement with the percentile bootstrap CI across all conditions, with power as low as 72% using the sample size from the bias-corrected bootstrap CI in a power analysis using the percentile bootstrap CI when no assumptions were violated. Inferential methods that are not considered to agree with the percentile bootstrap CI in this simulation tended to estimate consistently higher sample sizes (causal steps approach and Sobel test, where the sample size requred for 80% power reached 89.8% power using the percentile bootstrap CI) or lower sample sizes than the percentile bootstrap CI (bias-corrected bootstrap CI). Table 3 gives the ranges of power the percentile bootstrap CI achieved using sample sizes from each of the six inferential methods. When assumptions are violated, the differences in power estimated using the percentile bootstrap CI compared with either the causal steps approach or the Sobel test differ even more drastically.
Ranges of Power Using the Percentile Bootstrap CI

Note: Range of powers achieved between inferential methods (%); bold indicates the inferential methods had agreement across all coefficient estimates. All estimates are power from the percentile bootstrap CI using sample sizes required to achieve 80% power with each inferential method in the first column. CI = confidence interval.
Assumption violations
When the normality assumption is violated, the joint significance test and the Monte Carlo CI agree with the percentile bootstrap CI, and in these conditions, the largest difference in power among agreeing methods was 3.64%. When the homoskedasticity assumption is violated, the pattern of agreement does not always hold. The sample sizes recommended by the joint significance test and the Monte Carlo CI each have power only between 75% and 85% using the percentile bootstrap CI in .79 of the conditions with heteroskedastic residuals. When just the residuals of M are heteroskedastic, power ranges from 78.5% to 81.2% with joint significance test sample sizes and power ranges from 79.1% to 81.6% with the Monte Carlo CI. The disagreement occurs in cases in which the residuals of the Y variable are heteroskedastic. In those cases, the power for the percentile bootstrap CI using estimates from the joint significance test or Monte Carlo CI could be as low as 63% or 62%, respectively. The most extreme values occurred at the highest degree of nonnormality for both M and Y residuals.
Discussion
When performing a power analysis for a mediation analysis, researchers have a variety of inferential methods to choose from. For data analysis, previous research suggests the percentile bootstrap CI performs best but is perhaps too computationally intensive to be used for power analysis. Sample size recommendations from five of the most commonly used inferential methods for the indirect effect were compared with the percentile bootstrap CI with respect to achieved power. Under the assumptions of linear regression, the joint significance test and the Monte Carlo CI had power estimates that agreed with the percentile bootstrap CI for the same sample sizes. 3 This fits with the previous findings that these inferential methods have similar trade-offs between power and Type I error rates (Hayes & Scharkow, 2013; MacKinnon et al., 2002). The joint significance test is the least computationally intensive inferential method of the three and also includes a closed-form solution for power (O’Rourke & MacKinnon, 2014). Tools such as the R package pwr2ppl (Aberson, 2019a) can be used to do power analysis with the joint significance test with an a priori expectation of meeting normality and homoskedasticity assumptions.
When the a priori expectation is that the normality or homogeneity assumptions are violated, more caution must be used when starting a power analysis. When the assumption of normality is violated, the joint significance test and Monte Carlo CI agree with the percentile bootstrap CI in a power analysis. This is the case when just the M variable is nonnormal, just the Y variable is nonnormal, and both the M and the Y variables are nonnormal, at least to the degree that the normality assumption was violated in these simulation conditions. When the assumption of heteroskedasticity is expected to be violated in the Y residuals, the joint significance test and the Monte Carlo CI do not always agree with the percentile bootstrap CI. Here, the percentile bootstrap CI requires larger sample sizes than the joint significance test and the Monte Carlo CI. The joint significance test, percentile bootstrap CI, and Monte Carlo CI all agree regardless of the M residuals being heteroskedastic or at least to the degree that the homoskedasticity assumption was violated in these simulation conditions. 4
Although the current research suggests that under some conditions the joint significance test can be used for sample size selection when the percentile bootstrap CI will be used for data analysis, these findings are limited by the effect sizes and other data-generating conditions used in this study. One approach researchers could take is using the joint significance test to hone in on a sample size and then check the power of that sample size using a power analysis with percentile bootstrap CI. This would require only one run of the percentile bootstrap CI (which will admittedly take a while) but can help to ensure that the results from the joint significance test are valid. If the percentile bootstrap CI does not return a power close to the desired power, the researcher may want to continue to iterate the sample size using the percentile bootstrap CI. These features of the joint significance test can be beneficial and time saving in the beginning stages of a power analysis in which many different sample sizes may be tested. The goal is to get a more strategic starting value for doing the final power analysis using the more time-consuming percentile bootstrap CI. The causal steps approach, Sobel test, and bias-corrected bootstrap CI do not produce similar enough estimates to be recommended for use in a power analysis if the percentile bootstrap CI will be used for data analysis, and researchers should be careful to not use power analysis tools that rely on these inferential methods if they intend to use the percentile bootstrap CI for data analysis.
Even in cases in which the joint significance test and the Monte Carlo CI have agreement in terms of power with the percentile bootstrap CI when there are assumption violations, the required sample sizes can be very different from when these assumptions are met. For example, with medium parameter coefficients (both the a path and b path are .39), the joint significance test requires a sample size of 210 with homoskedastic residuals, but when M has heteroskedastic residuals, the required sample size is 340. Researchers should take that into account and simulate data that include the assumption violations they expect a priori for the most accurate power analysis.
Limitations and future directions
In this study, we considered inferential methods to agree if power was within a 5 percentage point margin of error. Because of the arbitrary nature of the cutoff decided in preregistration, even the inferential methods that were considered in agreement were not exactly the same. One implication of this is the recommendation to start with the joint significance test in a power analysis could produce starting sample sizes with varying degrees of accuracy.
Another limitation is that all the information about handling violations of statistical assumptions requires the researcher to simulate data for their power analyses that violate the assumptions. Additional tools need to be developed for power analysis in mediation that allows expected degree of assumption violations as an input. Given the simulation results, caution should be used in particular when selecting a sample size when the heteroskedasticity assumption will be violated.
Additional research can be done to generalize these findings to other analyses beyond mediation analysis, such as moderated mediation, which involves interactions in a mediation analysis. Research on power analysis is needed in this area because more and more studies are investigating interactions in mediation analyses. Larger sample sizes are generally necessary to detect interactions (Aguinis & Stone-Romero, 1997), so power analyses to determine appropriate sample sizes are necessary. Multilevel modeling in combination with mediation models is also possible (Preacher et al., 2010), and these models are much more complex and computationally intensive to fit. Future research on power analysis in multilevel mediation models could aid researchers in estimating sample sizes for these models, adding to the only tool available for power analysis in multilevel mediation, PowerUpR (Kelcey et al., 2021). Likewise, maximum likelihood estimation is common in structural equation modeling used for mediation analysis and is another iterative, computationally intensive process that makes power analysis difficult. Similar to this research, it may be possible to use ordinary least squares to more efficiently approximate required sample size for maximum likelihood estimation.
Summary
When assumptions of linear regression are met, sample size required for 80% power using the joint significance test and the Monte Carlo CI agrees with the percentile bootstrap CI. This pattern tends to hold when the assumption of normality is violated, but not homoskedasticity. When researchers want to use the percentile bootstrap CI for data analysis to get more robust mediation results with a CI, a good starting sample size for a power analysis can be more quickly found using the less computationally intensive joint significance test in the iterative process of inputting sample sizes to calculate power. Prioritizing an inferential method that is quick to compute for power analysis will save time, then the percentile bootstrap CI can verify and ultimately determine the sample size. The percentile bootstrap CI should also be used for data analysis because it is more robust to violations of statistical assumptions and also gives a CI.
Supplemental Material
sj-docx-1-amp-10.1177_25152459231156606 – Supplemental material for When to Use Different Inferential Methods for Power Analysis and Data Analysis for Between-Subjects Mediation
Supplemental material, sj-docx-1-amp-10.1177_25152459231156606 for When to Use Different Inferential Methods for Power Analysis and Data Analysis for Between-Subjects Mediation by Jessica L. Fossum and Amanda K. Montoya in Advances in Methods and Practices in Psychological Science
Footnotes
Acknowledgements
Transparency
Action Editor: David A. Sbarra
Editor: David A. Sbarra
Author Contribution(s)
Notes
References
Supplementary Material
Please find the following supplemental material available below.
For Open Access articles published under a Creative Commons License, all supplemental material carries the same license as the article it is associated with.
For non-Open Access articles published, all supplemental material carries a non-exclusive license, and permission requests for re-use of supplemental material or any part of supplemental material shall be sent directly to the copyright owner as specified in the copyright notice associated with the article.