
Abstract
Studies in vision, psychology, and neuroscience often present visual stimuli on digital screens. Crucially, the appearance of visual stimuli depends on properties such as luminance and color, making it critical to measure them. Yet conventional luminance-measuring equipment is not only expensive but also onerous to operate (particularly for novices). Building on previous work, here we present an open-source integrated software package—PsyCalibrator (https://github.com/yangzhangpsy/PsyCalibrator)—that takes advantage of consumer hardware (SpyderX, Spyder5) and makes luminance/color measurement and gamma calibration accessible and flexible. Gamma calibration based on visual methods (without photometers) is also implemented. PsyCalibrator requires MATLAB (or its free alternative, GNU Octave) and works in Windows, macOS, and Linux. We first validated measurements from SpyderX and Spyder5 by comparing them with professional, high-cost photometers (ColorCAL MKII Colorimeter and Photo Research PR-670 SpectraScan). Validation results show (a) excellent accuracy in linear correction and luminance/color measurement and (b) for practical purposes, low measurement variances. We offer a detailed tutorial on using PsyCalibrator to measure luminance/color and calibrate displays. Finally, we recommend reporting templates to describe simple (e.g., computer-generated shapes) and complex (e.g., naturalistic images and videos) visual stimuli.
Research in vision, psychology, and neuroscience routinely uses visual stimuli, including shapes, letters, faces, objects, scenes, and videos. The appearance of a stimulus can vary dramatically depending on stimulus properties, the digital display, and the visual environment. For example, the same picture looks rather different when just one parameter of the display changes (gamma value; Fig. 1). Observations such as this have long motivated vision scientists to carefully calibrate displays and characterize stimulus properties (e.g., Brainard, 1989; Brigell et al., 2003; Pelli & Zhang, 1991). Yet across vision science, psychology (e.g., cognitive, clinical, social, and developmental psychology), and neuroscience, there is a systematical failure in current experimental studies to report visual characteristics (e.g., luminance, color, contrast, and size) despite using visual stimuli (Lin et al., 2021). These practices undermine efforts to build a reproducible, cumulative science, as direct replications become cumbersome, the internal validity of the studied constructs may be threatened, and generalizability across stimulus properties is prematurely assumed, with its evaluation precluded in the first place. Building on previous efforts, here we present a software package—PsyCalibrator—that takes advantage of consumer hardware (SpyderX, Spyder5) and makes luminance/color measurement and gamma calibration accessible and flexible. PsyCalibrator promises to improve current practices in using and reporting the luminance/color and contrast of visual stimuli.

Display gamma and image appearance. The RGB value of a display (input voltage; x) jointly determines the output luminance level (y) with a parameter called gamma (γ), y = xγ. The value of gamma can have a dramatic impact on visual appearance. Reducing the gamma value increases image luminance, particularly at the lower end, and gives rise to a more washed-out appearance: Contrast at the lower end is enhanced, but contrast at the higher end is reduced (i.e., bright highlights are masked; left picture, γ = 1/2.2). Increasing the gamma value, on the other hand, reduces image luminance, particularly at the lower end, and gives rise to a darker appearance: Contrast at the lower end is reduced (i.e., details in shadows are masked), but contrast at the high end is enhanced (right picture, γ = 2.2). The original image was taken by author Z. Lin in Shenzhen, China.
We focus on luminance/color and contrast not least because at the phenomenological level, these properties determine the appearance of a stimulus (Fig. 1). Specifically, luminance—the luminous power of light detected by the human eye from a particular direction of view—is closely related to brightness perception. Likewise, color confers people with a rich, vibrant perceptual experience. And contrast—the difference between a stimulus and its background in luminance or color—dictates the visibility of the stimulus.
But beyond the phenomenological demonstration of the importance of luminance/color and contrast in determining appearance (Fig. 1), why should psychologists (and neuroscientists) concern themselves with measuring luminance/color and contrast? Clinical and developmental psychologists study how disorders and aging might manifest themselves in various processes using visual (and other) stimuli and materials. Visual properties have been shown to critically modulate various phenomena. For example, the perception of high-contrast motion direction is impaired when the size of the stimulus increases (Tadin et al., 2003)—and this size-dependent impairment is reduced in schizophrenia (Tadin et al., 2006), major depression (Golomb et al., 2009), and aging (Betts et al., 2005). Without measuring contrast, however, researchers might not be able to replicate each other; indeed, they might observe the opposite pattern because for low-contrast motion, the perception of motion direction improves—not deteriorates—when the size of the stimulus increases (Tadin et al., 2003).
The importance of luminance and contrast is not limited to perceptual processes but transpires in a suite of cognitive, affective, and social processes commonly studied in psychology and neuroscience. For instance, stimulus luminance and contrast modulate performance in visual search (Nasanen et al., 2001), Stroop-task interference (Dyer, 1973), and attention cuing (Hawkins et al., 1988; Zhao & Heinke, 2014). In affective processes, luminance has been shown to affect the judgment of emotion from facial expressions (Fotios et al., 2015), and contrast moderates emotion-identification deficits in schizophrenia (Butler et al., 2009). For example, schizophrenia and control participants show comparable accuracy in detecting emotion in low-contrast face images, but their performance diverges when the contrast of the face images increases (Butler et al., 2009). Thus, without measuring contrast, one might find similar emotion-detection accuracy between schizophrenia and control participants (if the face images happen to be of low contrast) or a deficit in schizophrenia (if the face images happen to be of high contrast).
Likewise, investigations of social processes at times rely on visual stimuli, making it important to measure luminance/contrast—a critical methodological requirement that may go underappreciated. For example, a recent study concluded that self-related information—self-face images—captures attention without one’s conscious awareness of that very information (Wojcik et al., 2019). But because of the failure to report the luminance and contrast of the face images in the original study, it is difficult to replicate this study: If the contrast of the target face image used in a replication study is too high, then the face may not be subliminal; yet if the contrast is too low, then the face image runs the risk of being too weak to evoke any relevant processes (i.e., a floor effect). In other words, because of the neglect to measure and report luminance and contrast, it is not at all clear what parameter values one should use to adequately replicate the original study. Still another (separate but equally important) issue is whether attention to the self-face images (vs. other-face images) reflects genuine self-specific information or potential low-level confounds, such as differences in luminance and contrast between the images being compared. Controlling for these low-level confounds requires measuring luminance and linearizing the display.
Therefore, without clear justification for otherwise (e.g., based on prior observations or theoretical rationales), it behooves researchers to measure and report visual properties. To measure luminance and color—on which contrast and gamma calibration (Fig. 2) are based—it requires access to specialized tools called photometers. Research-purpose photometers, however, are not only expensive (starting from thousands of U.S. dollars) but also complicated to operate. In the consumer market, low-cost photometers are available (e.g., SpyderX Pro is priced under $200; Datacolor, Inc., New Jersey, USA). Unfortunately, the official software (e.g., SpyderX or Spyder5 software)—or generic graphical tools such as DisplayCAL (https://displaycal.net/)—is not developed for scientific purposes, presenting at least three main limitations in a research context. First, options are limited to display adjustments. Second, the procedure is rigid, with predefined steps that cannot be skipped. Third, it is incompatible with a general programming language, thus making customization difficult. Likewise, current leading software packages that support gamma calibration—such as Psychtoolbox (Brainard, 1997; Kleiner et al., 2007; Lin et al., 2022; Pelli, 1997) and PsychoPy (Peirce et al., 2019)—were developed for research-purpose photometers and do not support consumer photometers such as the Spyder series.

Screen linearization. For a typical monitor, the relation between RGB (x) and luminance (y), y = xγ, is generally not linear but with a γ value of 2.2 (left). To linearize the relation, a gamma-correction function needs to be applied to the RGB values using a multiplication coefficient that is the reciprocal of the device gamma value (i.e., 1/2.2; middle). This process is known as “gamma calibration” or “display linearization.” A linear relation between RGB value and luminance is handy at times (e.g., to experimentally manipulate contrast; to measure the contrast of complex images) and even necessary in some situations (e.g., to match the luminance and contrast profiles between complex images).
A pressing need, then, is to harness the potential of consumer hardware to meet the demand of research in psychology and neuroscience, by making screen calibration and luminance/color measurement flexible and user-friendly through software development. A distinct advantage of software development is that it has no material or manufacturing cost and can be delivered remotely over the Internet. Here we take advantage of available consumer hardware and existing software to provide an integrated software solution for research purposes: PsyCalibrator. Below, we first briefly summarize the validation results of using SpyderX and Spyder5 with PsyCalibrator to measure luminance/color and calibrate displays. We then offer a detailed, step-by-step tutorial on how to use PsyCalibrator to measure luminance/color and calibrate displays. Finally, we provide reporting templates and discuss limitations and future directions.
Disclosures
PsyCalibrator is open-source and freely available for download at https://github.com/yangzhangpsy/PsyCalibrator. It builds on ArgyllCMS (Color Management System; https://www.argyllcms.com/) and uses functions from Psychtoolbox (http://psychtoolbox.org) and the Mcalibrator2 tool kit (Ban & Yamamoto, 2013) to show stimuli on the screen and fit the data (cubic spline), respectively. All analyses reported in the validation and the tutorial were conducted in MATLAB 2016b.
Supplementary materials are available at https://osf.io/shg3t/. They include (a) raw data and codes for all the figures and tables in the main text and supplemental materials (“dataCode” folder), (b) supplemental validation methods and results (“Validation.pdf”), (c) a quick-start guide to getting started with PsyCalibrator (“Quickstart guide.pptx”), (d) a detailed step-by-step photometer tutorial with screenshots and descriptions of driver installation for PsyCalibrator and other details (“Photometer tutorial.pdf”), (e) a video that illustrates the tutorial (“Photometer tutorial.mp4”), (f) supplemental materials regarding visual gamma correction (“Visual methods.pdf”), and (g) a supplemental step-by-step tutorial using visual methods instead of photometers (“Visual tutorial.pdf”).
Development of PsyCalibrator
PsyCalibrator was based on ArgyllCMS (https://www.argyllcms.com/) by using its hardware driver and the color/luminance reading file (spotread.exe). A limitation of spotread.exe for SpyderX is a 30-min measurement time-out. We identified and removed this limitation in the source file and recompiled it into an executable file so that measurement can now continue beyond 30 min. We further built m files to enable customized functions for psychological research, including luminance/color measurement and screen calibration, in the MATLAB/Octave environment (Octave is a free alternative to MATLAB; below, MATLAB/Octave will be referred to simply as MATLAB).
Validation: Summary of Results
The performance of Spyder5/SpyderX using PsyCalibrator was compared with professional photometers—ColorCAL MKII Colorimeter and Photo Research PR-670 SpectraScan. Validation was conducted on four key aspects: accuracy of linear correction, accuracy of luminance measurement, measurement variance (stability), and accuracy of color measurement (xy in CIE 1931 xyY coordinates). Results show excellent accuracy in linear correction using Spyder5/SpyderX. In luminance measurement, SpyderX performed similarly to MKII, and both were very close to PR-670 (Spyder5 underestimated luminance somewhat). Third, measurement variance was a little bit higher in Spyder than in MKII and in PR-670 but was very low for practical purposes. Finally, color-measurement accuracy (in CIE xy chromaticity) was high in the three color channels across different color intensities in SpyderX, as validated by PR-670. Considering the similar costs of SpyderX and Spyder5, we recommend SpyderX for research and educational purposes (for the detailed method and results, see the 15-page supplemental file “Validation.pdf” at https://osf.io/shg3t/).
To facilitate the use of the package in research and teaching, below we provide a tutorial on how to use this software package for luminance/color measurement and display calibration.
Tutorial: Using PsyCalibrator to Measure Luminance/Color and Calibrate Displays
The tutorial is divided into seven steps. For luminance/color measurement, follow Steps 1 to 4; for display correction (linearization), follow all the steps except Step 4. For quick reference, see the common commands summarized in Table 1. Supplementary materials are available at https://osf.io/shg3t/. These include a quick-start guide to getting started with PsyCalibrator (“Quickstart guide.pptx”), a full step-by-step tutorial (“Photometer tutorial.pdf”), and a video (“Photometer tutorial.mp4”). For estimating the gamma value and correcting the display—rather than measuring luminance and color—psychophysical methods that do not require photometers are also available, as implemented in PsyCalibrator (see supplemental files “Visual methods.pdf” and “Visual tutorial.pdf”).
Main Commands Used in PsyCalibrator to Measure Luminance/Color and Calibrate Digital Displays

Note: Command text is colored
Note that display correction (linearization) is optional except when a linear relation between RGB value and luminance is convenient or necessary for one reason or another. Two common situations are illustrated. The first situation is when a linear relation between RGB value and luminance makes experimental manipulation or measurement convenient. For example, if your study concerns detailed manipulation of luminance/contrast, then a linear relation allows you to figure out the exact relation between RGB and luminance—by measuring the luminance of just two points (e.g., [25, 25, 25] and [125, 125, 125])—such that luminance/contrast can be manipulated by simply changing RGB values. As another example, suppose your study concerns complex images such as faces and scenes and you would like to report image contrast. Contrast for complex images is typically defined as the standard deviation of luminance distribution. Linearization—or at least knowing the display gamma value—becomes very handy because it allows you to convert the image RGB distribution (which is readily available from common software) to the luminance distribution. Thus, you can obtain the image contrast without having to measure the entire luminance distribution, which is cumbersome.
The second situation is when a linear relation between RGB value and luminance is required, such as in software that processes images to control for luminance and contrast (Willenbockel et al., 2010). Suppose you would like to compare two types of images to address common questions such as whether self-face images attract attention compared with other-face images or whether seeing happy faces changes a person’s attitude (or behavior or some neural index) compared with neutral faces. To address this sort of question, researchers need to make sure that low-level confounds—such as luminance and contrast—cannot explain potential differences between the two types of images. A common approach is to use some software package to equate their mean luminance and contrast. But what is actually being manipulated in such software packages is not luminance values per se but RGB values. Equaling the mean RGB values and their standard deviation results in equal luminance and contrast only when there is a linear relation between RGB value and luminance. Below, we describe the steps involved in using PsyCalibrator to measure luminance/color and calibrate displays.
In addition, we also need a computer with the following software: (a) MATLAB (commonly subscribed to by many educational and research institutions) or its free alternative GNU Octave (https://www.gnu.org/software/octave/download), (b) Psychtoolbox (freely available at http://psychtoolbox.org), and (c) PsyCalibrator (freely available at https://github.com/yangzhangpsy/PsyCalibrator).
You need to do this only once—if you have already added the “PsyCalibrator” folder to MATLAB paths, you do not need to do it again.

MATLAB command window.
To measure the luminance/color of a stimulus on the monitor, simply open the cover and point the Spyder sensor closely to the target stimulus on the screen. For maximum accuracy and transparency, (a) make sure the sensor area is smaller than the stimulus, or else the measurement reflects not just the target stimulus but also the surrounding stimuli (if the target is too small, consider enlarging it), and (b) make sure the sensor touches the stimulus on the screen (note that distance negatively affects luminance values).
Then run “
The returned xyY values are the CIE 1931 xyY color coordinates of the stimulus: xy for the coordinates in the color space that specify the color and Y (the third value) for the luminance value. The returned xyY matrix has five rows (for five measurements) and three columns (for xyY). To obtain the averaged measurement of xyY, run “
Before calibration, make sure that no direct light shines on the monitor screen (e.g., with the lights off) and that the monitor is turned on for at least 60 min to allow time for warm-up. When ready, follow the steps below to begin the calibration process.

Photometer calibration window.

Begin the measurement process.

Automatic measurement starts within 10 s.

Uniform square images on the screen.

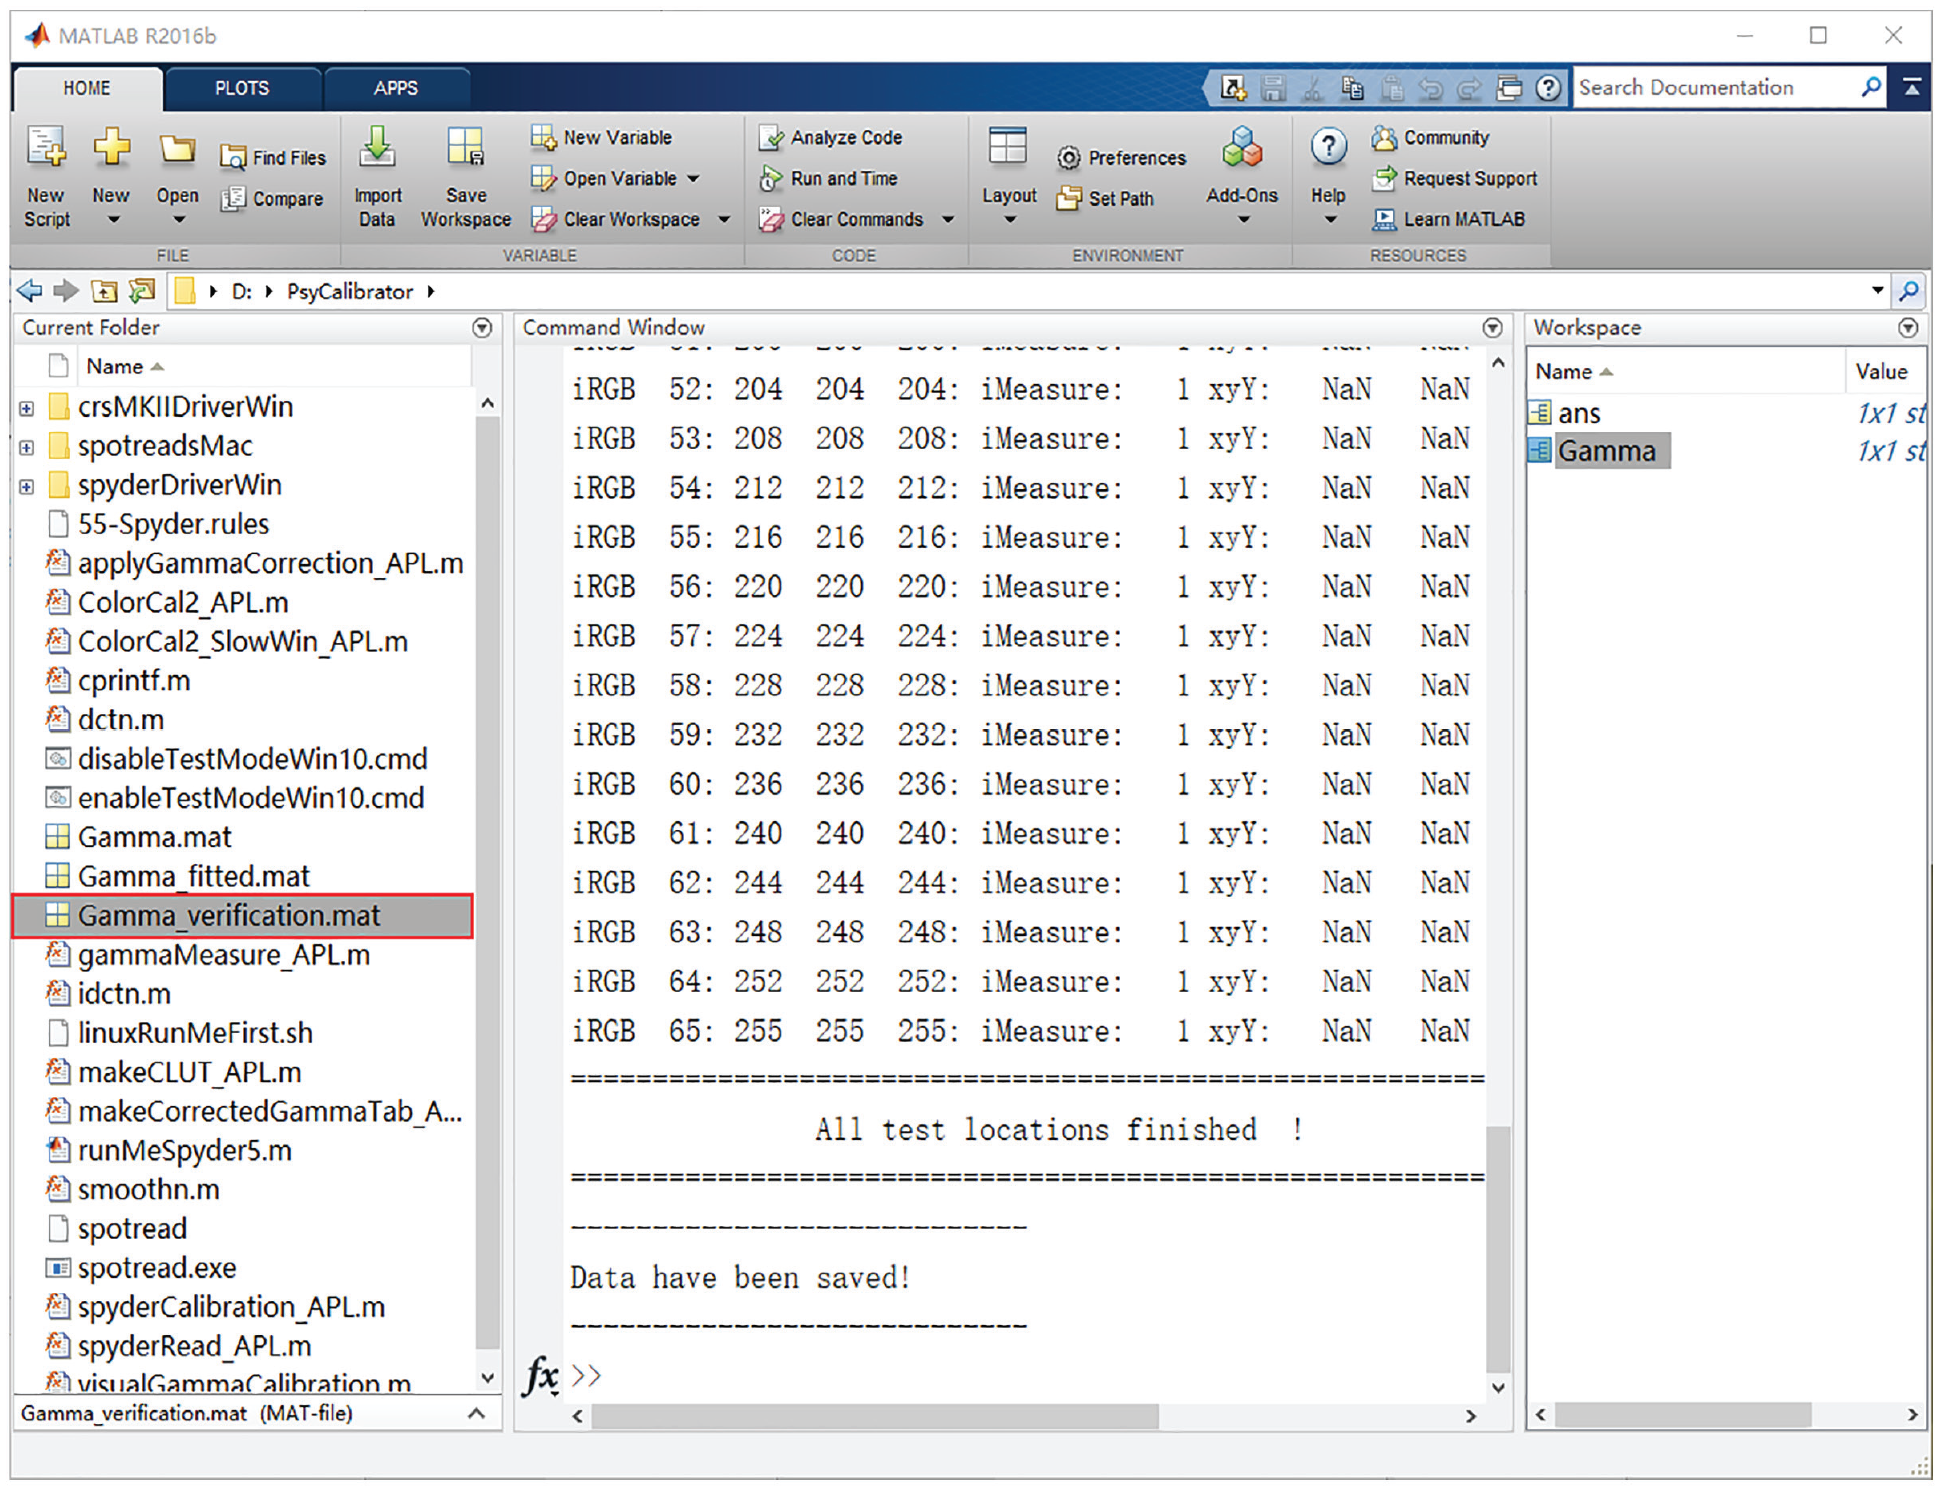
The calibration results are saved to the file named “Gamma.mat.”

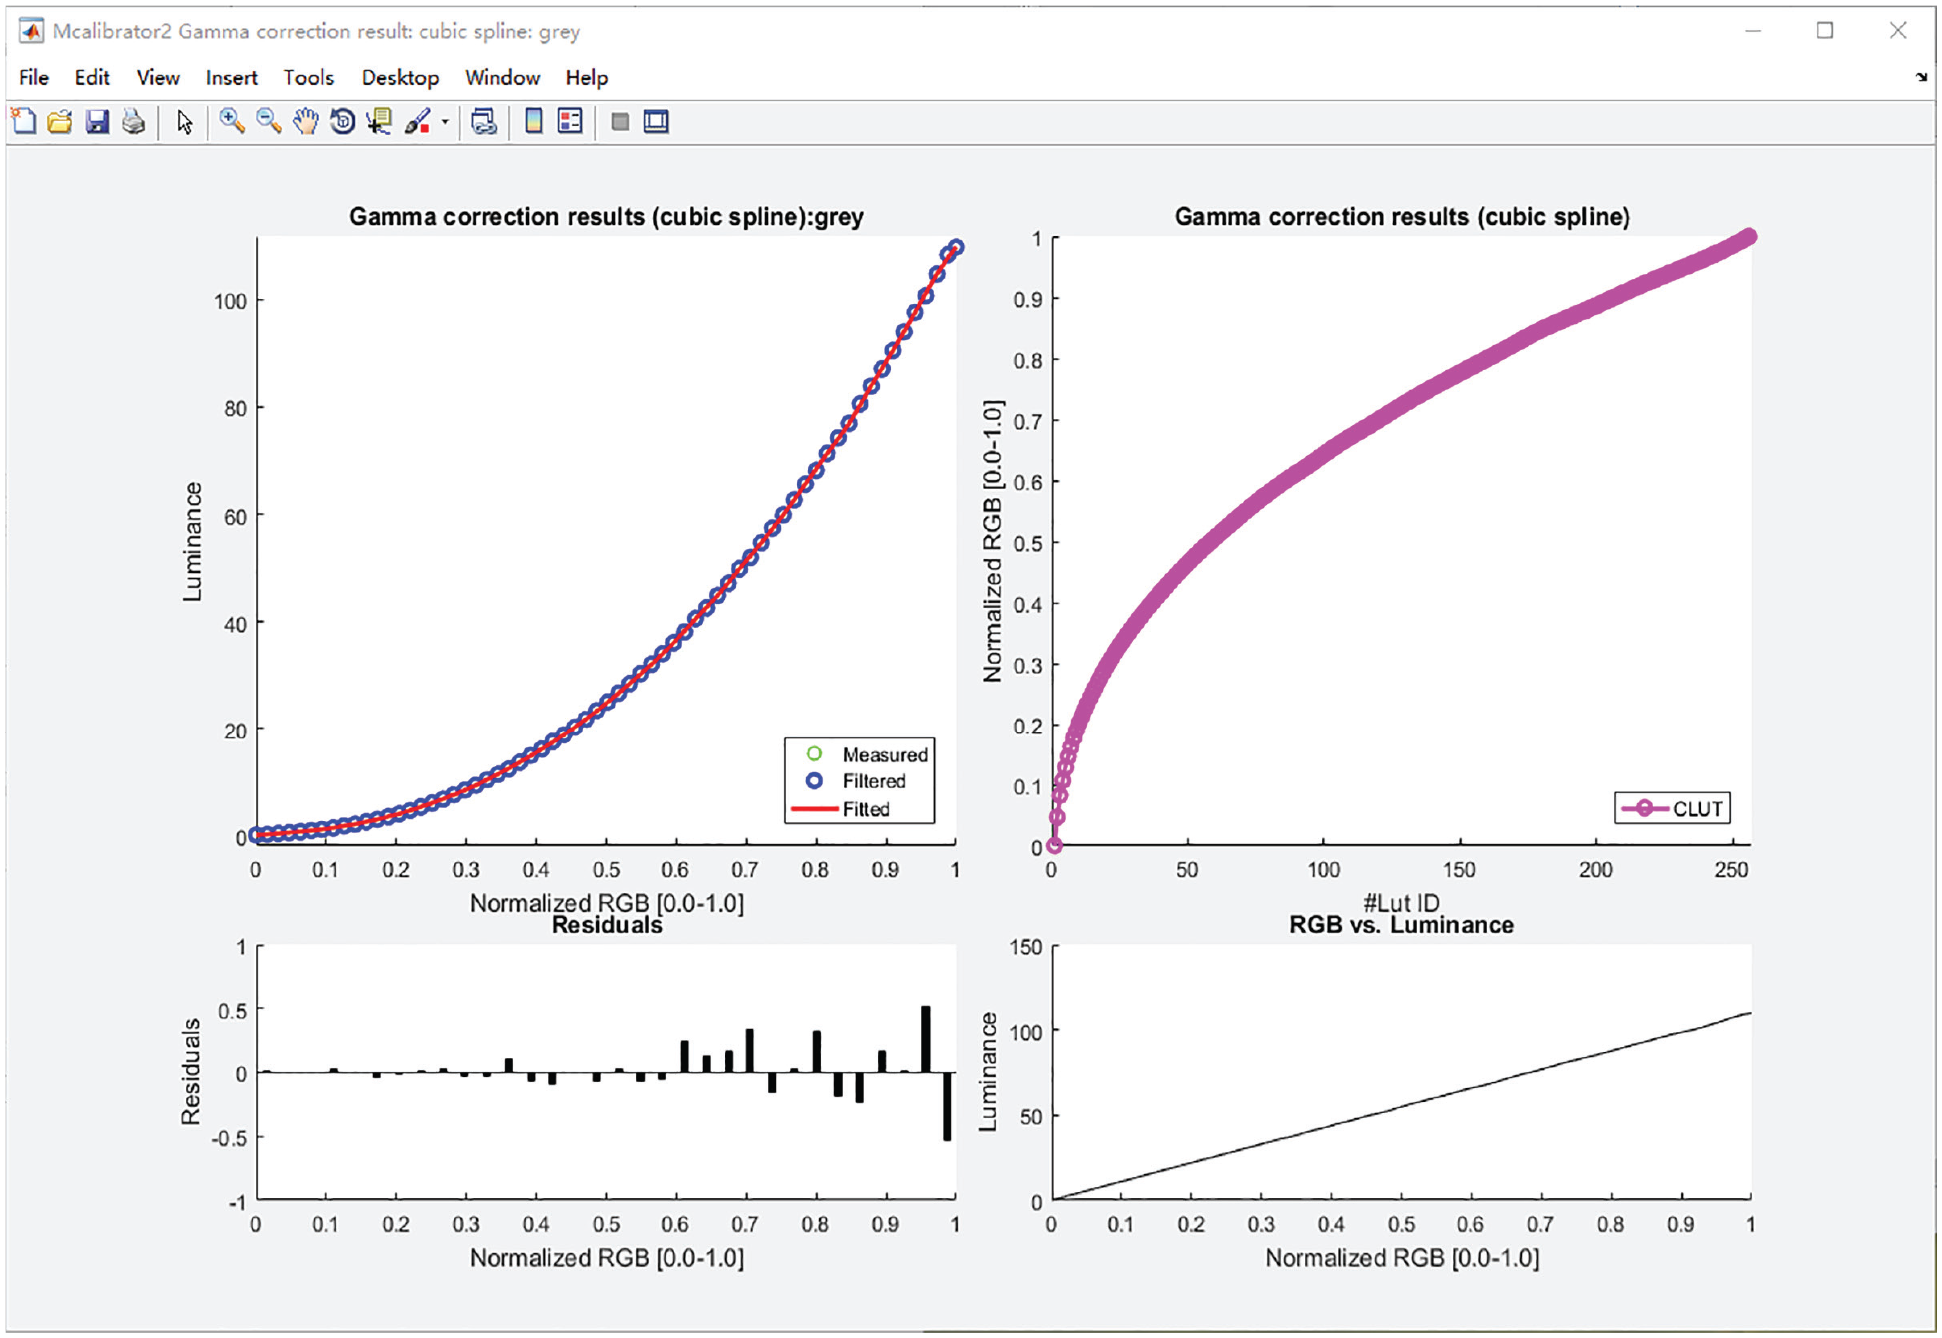
Data fitting and results.
Video input and luminance relation.

Verify the linearity of the display after applying the color-lookup table (CLUT).
Verification results are saved to the file “Gama_verification.mat.”
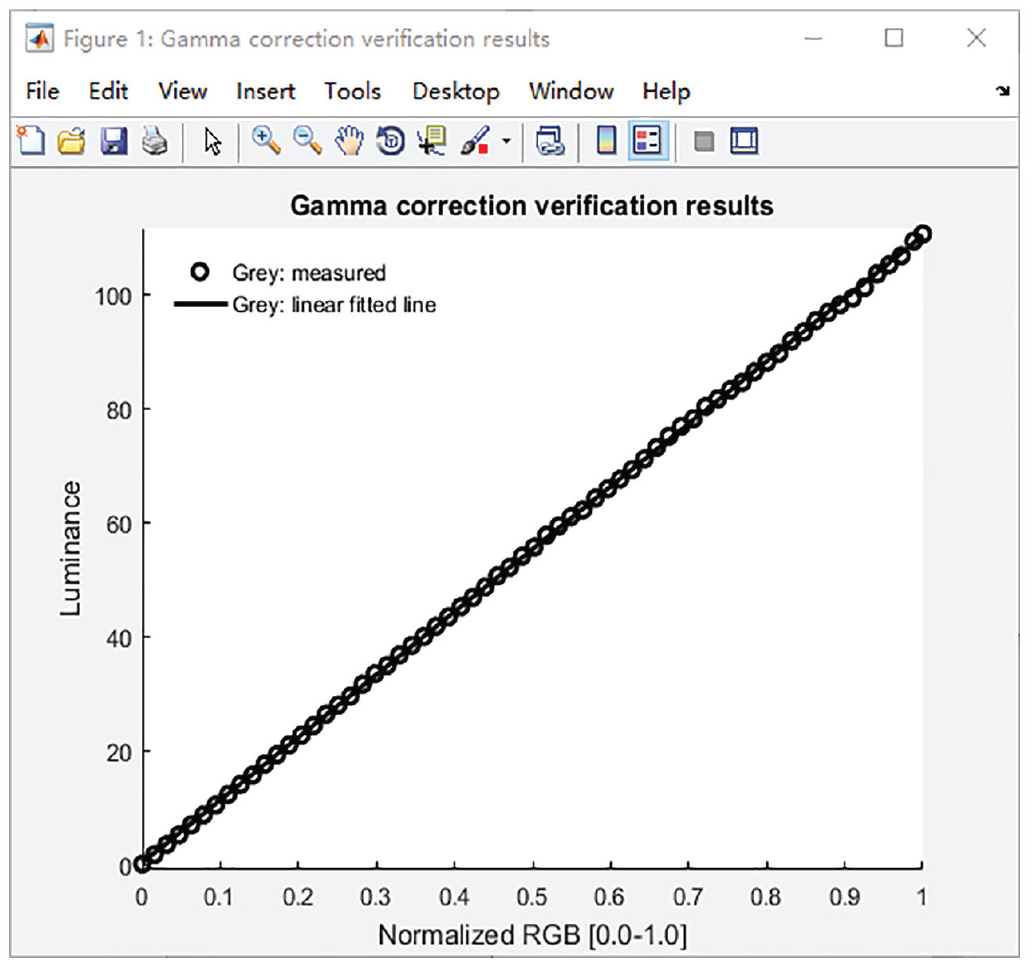
Visualization of the linearity of the display after applying the color-lookup table (CLUT).
Therefore, for example, to perform gamma correction for the monitor numbered 0 based on Gamma.gammaTable, execute the following command in MATLAB: “
Reporting
What are the best practices in reporting the luminance and contrast of stimuli and display linearization? To help users report these properties in a more transparent manner, we provide reporting templates below. Depending on the nature of the study, the reporting may involve specifying stimulus luminance, contrast, and display linearity, as illustrated in two scenarios.
In Scenario 1, a researcher presents simple shapes on an LCD screen. In this case, display linearity may not be crucial, and thus gamma correction is optional. But luminance values can be readily measured and should be specified. Accordingly, consider using the following reporting template:
a.
In Scenario 2, a researcher presents complex images (or videos) on an LCD screen. In this case, because of the large number of image pixels that vary in luminance, it may not be practical to specify the luminance values of all the pixels for each stimulus. For images such as faces and scenes, mean image luminance and contrast can be equalized across images and be reported accordingly. For videos, such specifications become impractical. To allow other researchers to reproduce the appearance of the stimuli, you should make the actual stimuli (e.g., images or videos) available and furthermore specify relevant display characteristics, including display gamma and minimum and maximum luminance values of the display. Accordingly, consider using the following reporting template.
b.
Note that other important properties, such as stimulus size, are not the focus of the current work and thus are not mentioned in the reporting templates above. To the extent that they are crucial to your research, they should be reported as well—reporting templates on these properties are available elsewhere (Lin et al., 2021).
Summary
Visual materials are widely used in research in vision, psychology, and neuroscience. Although basic stimulus properties such as luminance and contrast strongly affect visual appearance, these properties are often not reported in current practices. These practices present a roadblock to reproducible science, potentially threaten the internal validity of the studied constructs, and prematurely assume generalizability across stimulus properties. To improve research practices, efforts need to focus not only on raising awareness of this important issue but also on providing access to affordable, flexible, user-friendly tools that can help rectify problematic practices.
We present PsyCalibrator, an integrated software package that makes use of Spyder5 and SpyderX to measure luminance and color (in CIE 1931 xyY color space) and to conduct screen gamma correction. We provide (a) validation in luminance/color measurement and gamma calibration (see also the supplemental files “Validation.pdf”), (b) a tutorial on how to use the software (see also the supplemental files “Quickstart guide.pptx,” “Photometer tutorial.pdf,” and “Photometer tutorial.mp4”), and (c) reporting templates. The validation focuses on linear correction, luminance-measurement accuracy, measurement variation (stability), and color measurement. Color calibration—such as to reproduce a given color (xyY) on a target display—requires characterizing interactions among RGB color channels and is beyond the scope of the current study. For teaching and research demonstrations, in supplemental files (“Visual methods.pdf” and “Visual tutorial.pdf”), we have also described visual methods based on dithering and bisection (Lu & Dosher, 2013), with validation and a tutorial on a bisection method in PsyCalibrator.
PsyCalibrator takes advantage of Psychtoolbox, a widely used and free software package for stimulus presentation and response collection (Kleiner et al., 2007), with a graphical experiment builder that makes it intuitive to build experiments without coding (Lin et al., 2022). Note that PsyCalibrator works under both MATLAB and Octave, a free alternative to MATLAB. We are committed to maintaining and updating the software and supplementary materials on the basis of user feedback. For example, in collaboration with the support team of Psychtoolbox, we are actively developing innate support for Spyder photometers within Psychtoolbox. To pool community talent, we have also made our software open-source. This will facilitate the community to build on it and make adaptations for richer functionality and applicability, such as support for other platforms (e.g., Python). To report issues, get support, or contribute to it, users can contact us by using the “new issue” function in GitHub (https://github.com/yangzhangpsy/PsyCalibrator) or through the website for PsyBuilder (https://www.psybuilder.com/).
To conclude, PsyCalibrator is poised to help improve current research practices in measuring and reporting basic visual properties such as luminance, color, gamma, and contrast. PsyCalibrator may also be used for educational purposes to help illustrate the measurement of luminance/color and calibration of displays in lectures and tutorials. We hope that this and other tools can facilitate the building of a more transparent, reproducible psychological science.
Footnotes
Acknowledgements
We thank Xiangrui Li from the Ohio State University for helpful discussions on implementing the visual methods.
Transparency
Action Editor: Pamela Davis-Kean
Editor: David A. Sbarra
Author Contribution(s)