
Abstract
Psychtoolbox is among the most popular open-source software packages for stimulus presentation and response collection. It provides flexibility and power in the choice of stimuli and responses, in addition to precision in control and timing. However, Psychtoolbox requires coding in MATLAB (or its equivalent, e.g., Octave). Scripting is challenging to learn and can lead to timing inaccuracies unwittingly. It can also be time-consuming and error prone even for experienced users. We have developed the first general-purpose graphical experiment builder for Psychtoolbox, called PsyBuilder, for both new and experienced users. The builder allows users to graphically implement sophisticated experimental tasks through intuitive drag and drop without the need to script. The output codes have built-in optimized timing precision and come with detailed comments to facilitate customization. Because users can see exactly how the code changes in response to modifications in the graphical interface, PsyBuilder can also bolster the understanding of programming in ways that were not previously possible. In this tutorial, we first describe its interface, then walk the reader through the graphical building process using a concrete experiment, and finally address important issues from the perspective of potential adopters.
Experiments in behavioral and neural sciences often require generating and presenting precise visual or auditory stimuli and collecting responses from the participants. Over the last three decades, several open-source software packages have been developed—prominently, Psychtoolbox (Brainard, 1997; Klein et al., 2007; Pelli, 1997), PsychoPy (Peirce, 2007, 2009; Peirce et al., 2019; Peirce & MacAskill, 2018), and OpenSesame (Mathot et al., 2012). These packages serve as an interface between an interpretive programming environment (e.g., MATLAB, GNU Octave, and Python) and the hardware (e.g., graphics devices, sound devices, clocks, and keyboards). Psychtoolbox, for example, provides function calls in MATLAB or GNU Octave (a free and open-source alternative to MATLAB) to control hardware, with key routines written in C code. It enables users to access the display, timing, and response-collection hardware with submillisecond timing accuracy.
Despite its popularity (Fig. 1), Psychtoolbox is script based. Learning to code is challenging for many new users. Coding and debugging can also be time-consuming and error prone even for experienced users. This issue has been widely recognized as a major weakness of Psychtoolbox (e.g., Nuutinen et al., 2018; Schwarzbach, 2011). Indeed, although high timing precision is a key strength of Psychtoolbox, when not programmed well, Psychtoolbox scripts can lead unwittingly to poor timing accuracy (Bridges et al., 2020). Great efforts therefore have been spent toward improving its usability and efficiency. These improvements include (a) making a specific task paradigm—for example, continuous flash suppression (Tsuchiya & Koch, 2005)—easier to use by having users modify task parameters in text files with minimal requirement of MATLAB knowledge (Nuutinen et al., 2018); (b) providing a package to help transform user-provided text, image, and sound files to a multimedia slideshow that allows response collections (Schwarzbach, 2011); and (c) offering a modular organizational structure to facilitate code reuse, in which an abstraction interface helps to shorten and simplify the codes needed to run experiments (e.g., the Objective Psychophysics Toolbox; Hartmann & Weisz, 2020). Nevertheless, up until now, a comprehensive solution has been lacking.

Year-to-year citations of three major open-source software packages for stimuli presentation and response collection: Psychtoolbox (based on the total citations to Brainard, 1997; Klein et al., 2007; and Pelli, 1997), PsychoPy (based on the total citations to Peirce, 2007, 2009; Peirce et al., 2019; and Peirce & MacAskill, 2018), and OpenSesame (based on the total citations to Mathot et al., 2012). The year 2021 is partial, up to May 15 (data are represented by the open circles). Each dot represents a source article, aligned to the year of publication and the corresponding software package. Citations are based on Google Scholar recorded on May 15, 2021.
Over the past few years, we have gone much beyond prior attempts by developing the first general-purpose graphical builder for Psychtoolbox, called PsyBuilder (see Box 1). PsyBuilder is cross-platform and runs on macOS, Windows, and Linux. It is designed to greatly flatten the learning curve for new users without programming experience and to drastically cut the time needed to program an experiment, with built-in performance optimization for the output scripts. In particular, best coding practice to achieve optimal timing precision (Table 1) is automatically implemented in the output scripts of PsyBuilder.
PsyBuilder in a Nutshell

Best Practice to Optimize Timing Precision as Automatically Implemented in the Output Scripts of PsyBuilder

Note: RAM = random access memory.
This new tool provides the much needed builder environment for Psychtoolbox, with at least three important applications. First, the graphical user interface (GUI) of PsyBuilder is easy to use and potentially can replace proprietary software (e.g., E-Prime) in student training and research. Second, the drag-and-drop functionality coupled with optimized timing and detailed comments in the output codes can improve data-collection efficiency and accuracy in research. Third, as noted by an anonymous reviewer, this GUI could also lead to exponentially faster learning of programming skills. Specifically, users can make modifications in the GUI and see exactly how the code changes (e.g., by using document comparison tools, such as: https://prettydiff.com), which helps to bolster their understanding of the code. Thus, the ability to interact and build an experiment in a visual timeline and directly see the output in code form will help new learners understand programming in MATLAB Psychtoolbox in ways that were not previously possible.
To facilitate the dissemination of the experiment builder, in this tutorial, we first describe its interface, then walk the reader through the graphical building process using a Stroop task, and end with critical consideration of its key advantages and limitations for potential adopters.
Disclosures
PsyBuilder is freely available for download at https://www.psybuilder.com. Furthermore, we will make the source codes open soon at https://github.com/yangzhangpsy/PsyBuilder.
All supplementary materials used in this tutorial are available at https://osf.io/xcbav/, including (a) a summary document regarding the files and the address for downloading the software package (“README.pdf”); (b) the raw data for Figure 1 (“Figure 1 data.xlsx”); (c) a supplemental tutorial with detailed explanations of the menu bar and with a chapter on how to create stimuli in PsyBuilder (“PsyBuilder 0.1 A Brief Step by Step Tutorial.pdf”); (d) screenshots elaborating on the comparisons between PsyBuilder (Version 0.1), PsychoPy Builder (Version 1.90.2), and OpenSesame (Version 3.2.8) in key GUI features (“Screenshots comparing GUIs.pdf”); and (e) final MATLAB scripts for the tutorial Stroop task (“exampleOutputTutorial.zip”).
Tutorial
PsyBuilder interface
We begin the tutorial with an overview of the interface of PsyBuilder. PsyBuilder represents an experiment graphically using a horizontal timeline on the central panel (Timeline, as highlighted by ① in Fig. 2), along which you can drag, drop, and arrange various experimental events. Many event types are supported, including text instruction, stimuli presentation and response collection, and looped presentations of events. In the example in Figure 2, the main timeline has three major events: “introduction,” “blocksLoop,” and “goodbye.” Each event is simultaneously visualized in the vertical nested structure of the experiment on the upper left corner of Figure 2 (Structure, as highlighted by ②). To define, view, or edit an event in the experiment (e.g., “introduction,” “blocksLoop,” and “goodbye”), double-click on it either within the upper left Structure panel (②) or within the central Timeline panel (①). This will open the tab for that event within the central panel. Events embedded within a loop, however, are not visible on the main Timeline panel but can be accessed only through the upper left Structure panel (②). Double-click on it (e.g., “blockTimeline” within the Structure panel in Fig. 2), and it will open the associated tab for that event on the central panel.
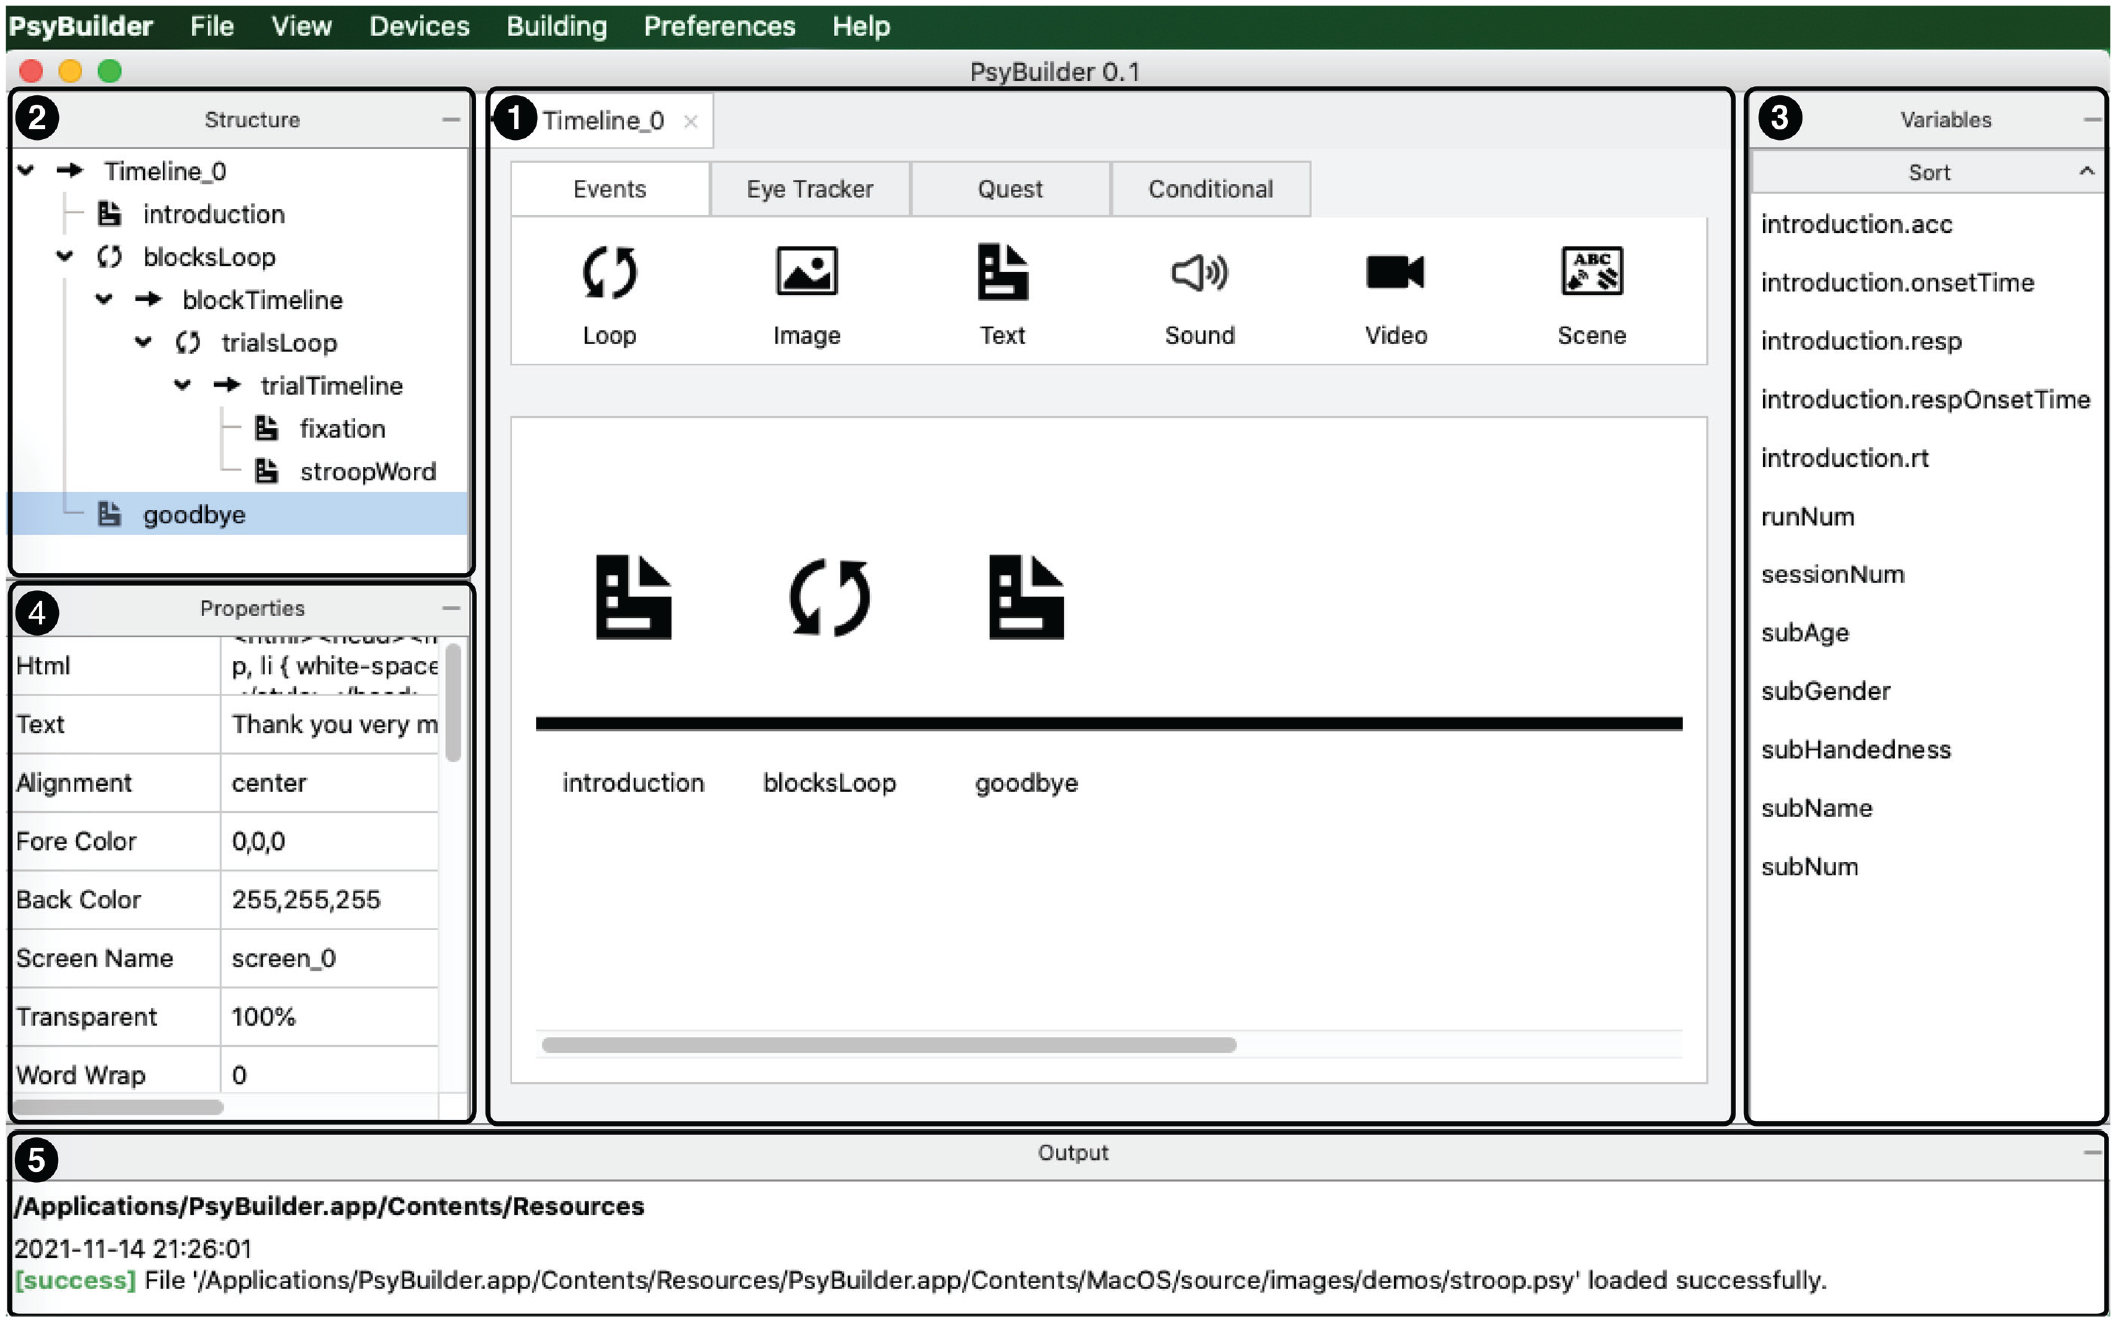
The interface of PsyBuilder features five main panels: (1) Timeline, (2) Structure, (3) Variables, (4) Properties, and (5) Output. PsyBuilder allows users to create a graphical representation of an experiment through drag and drop and then convert the graphical representation to a MATLAB (or Octave) script.
The event tab on the central panel (① in Fig. 2) allows you to access the detailed properties of that event. Click on the setting icon on the upper left, and it will open up a secondary, pop-out window (see Fig. 3). Depending on the event type, various parameters can be specified within this secondary window. You can input the values to the relevant variables. Note that these values do not have to be static, but can be dynamic, by using the variables available within the Variables panel (③ in Fig. 2). You can do so through drag and drop or by typing it in. The spatial layout of the event, where applicable, also appears on the tab for the event within the main window—in the current example, the text reads, “When you are ready, press any key to start!” The various variables associated with the event and their specifications are shown as a two-column list on the Properties panel (④ in Fig. 2). To generate the corresponding MATLAB script of the experiment, click on Compile option under the Building menu. The path of the script file—and error messages if any—will appear on the Output panel (⑤ in Fig. 2).

The event tab (titled “introduction”) appears on the central panel of the main window, with its associated setting as a pop-out window (titled “Text property”). The event tab visualizes the event and stores the details for that event, which are specified within the secondary, setting window.
Building a Stroop-task experiment from scratch
To illustrate the experiment-building process in PsyBuilder, we now turn to the implementation of a classic experimental task, the color-word interference task, commonly referred to as the Stroop task (Stroop, 1935). Demos of additional tasks—including a visual cuing task and a rapid series visual presentation (RSVP) task—can be found under the Help menu in PsyBuilder. Demos of stimuli creation are provided in Chapter 4 of the Supplemental tutorial (https://osf.io/xcbav/).
1. Preparation
Before proceeding, we need to download and install PsyBuilder on the computer first, from https://www.psybuilder.com. All major operating systems are supported, including Windows, Mac OS, and Linux. For Mac OS, we need to grant permission to the installed PsyBuilder before it can be used, by executing the following command in the Terminal window:
Although not necessary for building the experiment using PsyBuilder, to run the eventual scripts provided by PsyBuilder, you need MATLAB (or Octave) and Psychtoolbox. For installation instruction, please follow the following link: http://psychtoolbox.org/download.
2. Design of the task
To implement the Stroop task—any task for that matter—we first need to think through the experimental design and procedure. In the Stroop task, a different colored word is presented each trial. The task is to respond quickly and accurately to its ink color while ignoring the semantic meaning. Our task has one experimental manipulation, concerning the congruency between the ink color of the word and its semantic meaning. There are three different conditions: congruent, incongruent, and neutral. In the congruent condition, the ink color and the semantic color are the same (e.g., Red); in the incongruent condition, the ink color and the semantic color are of different colors (e.g., Red); in the neutral condition, the word itself is unrelated to colors (e.g., Cat). Let us have 12 trials for each of the three conditions (congruent, incongruent, and neutral), as distributed over two blocks. In total, the task contains two blocks, each with 18 trials (six for each condition).
With this design and procedure in mind, we can proceed to draw a conceptual representation of the overall flow of the experiment (Fig. 4a). The experiment starts with a greeting display (“introduction”) that explains the task and responses—to make a judgment regarding the ink color (which is randomly chosen from red, green, and blue) by pressing one of three keys on the main keyboard (“1,” “2,” or “3”). It proceeds to the two blocks (“blocksLoop”), each containing 16 trials (“trialsLoop”). In each trial, a fixation cross (“+”) is displayed at the center of the screen for 1,000 ms, and then a colored word appears at the same position until response but up to 1,500 ms. After the two blocks, the experiment ends with a goodbye display (“goodbye”).

Implementation of the Stroop task using PsyBuilder. (a) A conceptual representation of the design of the Stroop task shows the basic procedure of the task, including a loop for blocks and a loop for trials. (b) A graphic implementation of this basic procedure is accomplished through drag and drop in PsyBuilder using built-in Events, such as text and loop. Each event is associated with a corresponding MATLAB (Octave) script; together, they are automatically compiled to form the final scripts for the experiment.
3. Implementation of the task
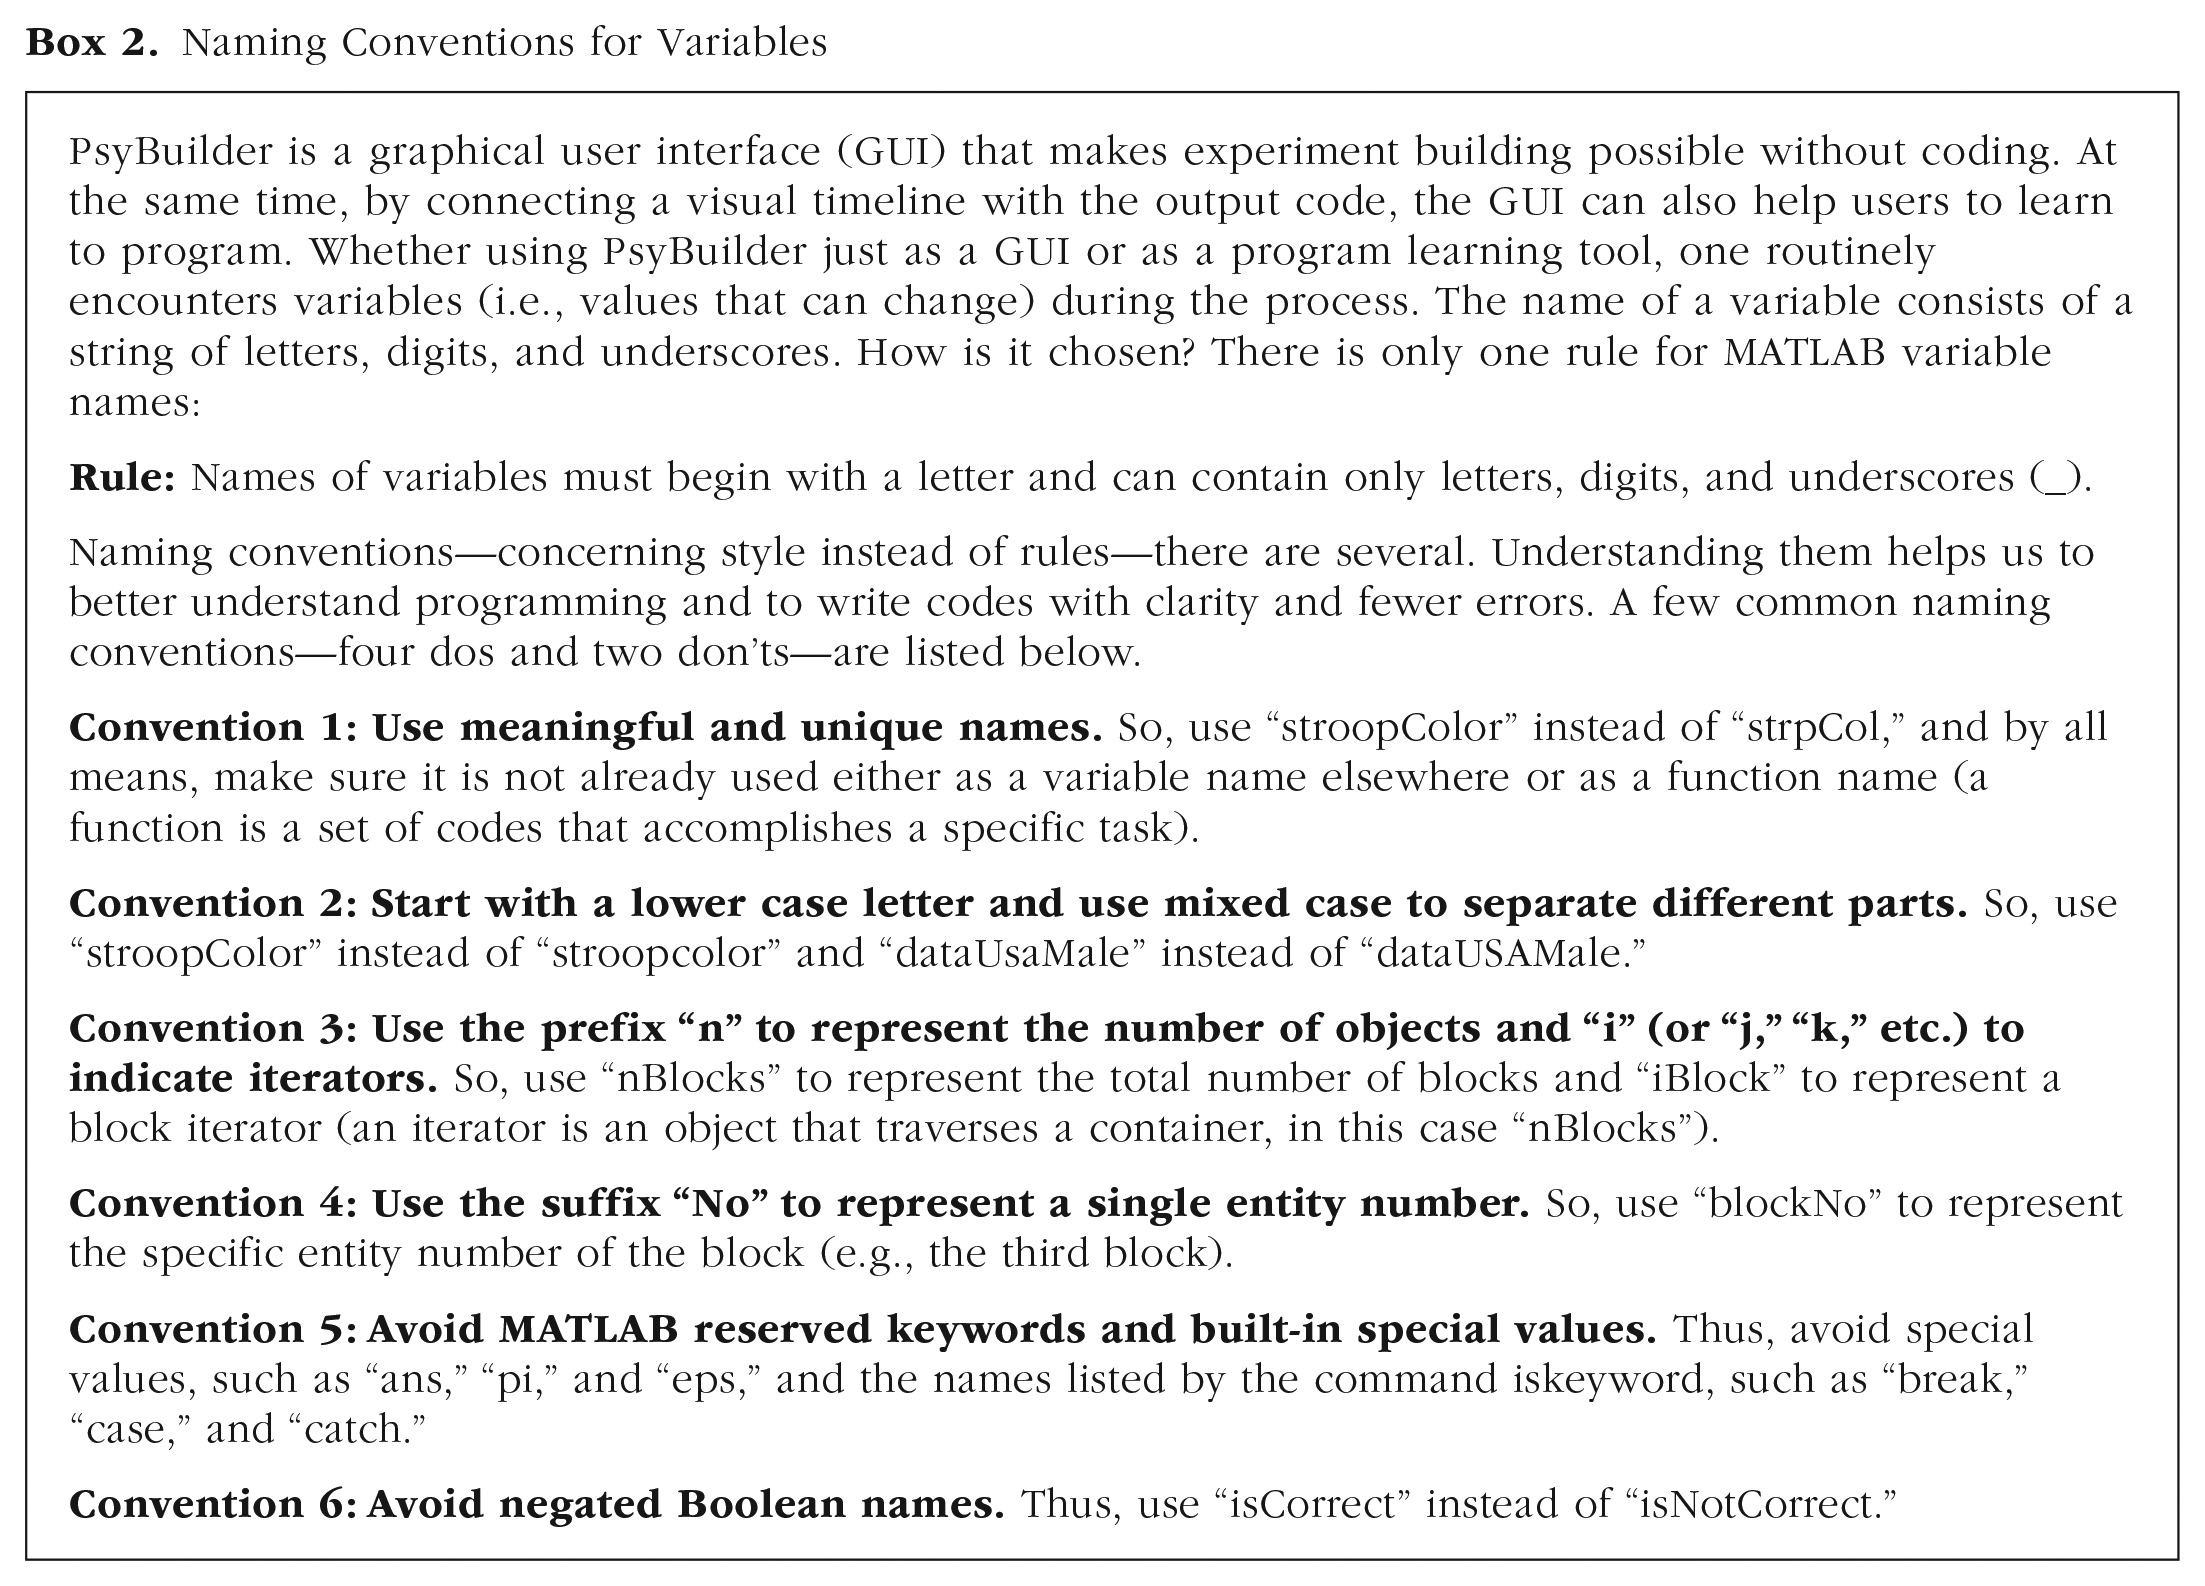
Let us first take a look at the overall implementation. This experimental procedure can be implemented in PsyBuilder through a graphical representation of a timeline (Fig. 4b). The events in the PsyBuilder timeline (named “timeline_0”; see Box 2 for naming conventions for variables) provides a natural correspondence with the events in the flow design described above (in Fig. 4a): The greeting and goodbye displays are implemented as text events (“introduction” and “goodbye”), and the experimental blocks are implemented as a loop event (“blocksLoop”). The loop event has two blocks (“blockTimeline”), each with its own loop of 16 trials (“trialsLoop”). Each trial is implemented as a timeline (“trialTimeline”) with two events: a fixation (“fixation”) and a colored word target (“stroopWord”). The properties of the trials—such as the ink color (“targetColor”) and the exact word (“targetString”)—are defined within the loop for the trials (“trialsLoop”), as illustrated by the table inserted on the left (Fig. 4b). Behind the scene, these graphical events are automatically converted to corresponding MATLAB/Octave codes, as illustrated by the examples at the bottom of Figure 4b.
Naming Conventions for Variables
The building process can be broken down into seven steps: (1) Set up a project, preferences, and input/output devices; (2) set up greeting display; (3) set up block loops in the main timeline; (4) set up trial loops in the block timeline; (5) set up trial events in the trial timeline; (6) set up goodbye display; and (7) save the file and convert it to an M file script. To make it easy to follow, we have included screenshots right next to the tutorial instruction below (Figs. 5a–5o).

Actions 1 to 3 in Step 1.

Actions 4 to 9 in Step 1.

Actions 1 to 5 in Step 2.
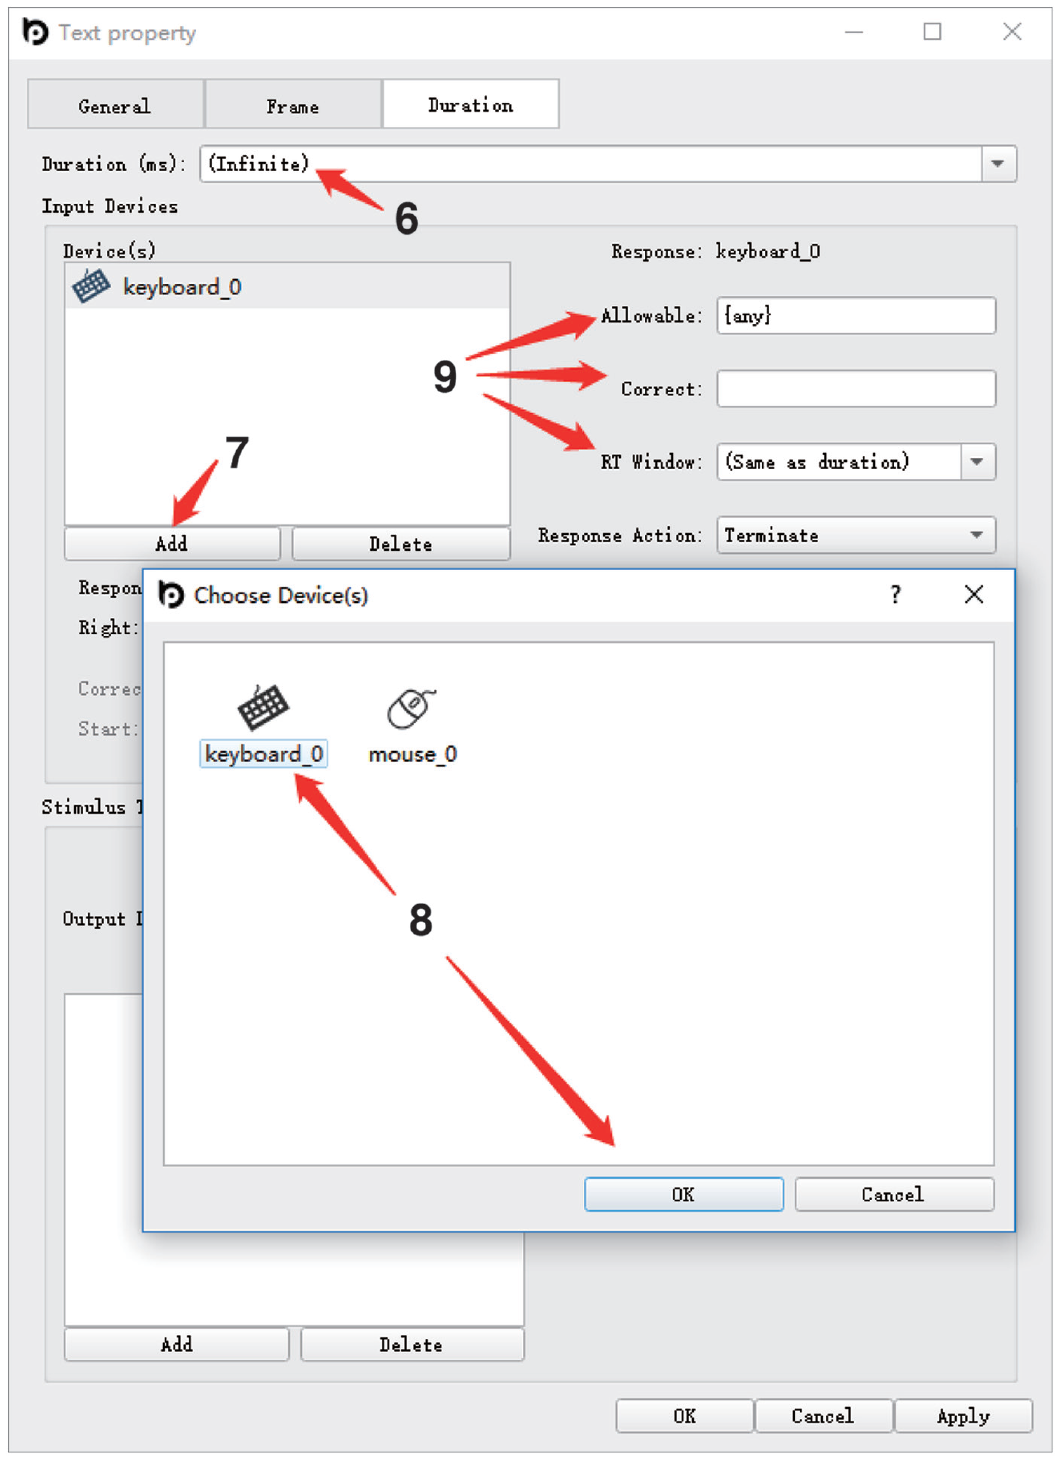
Actions 6 to 9 in Step 2.
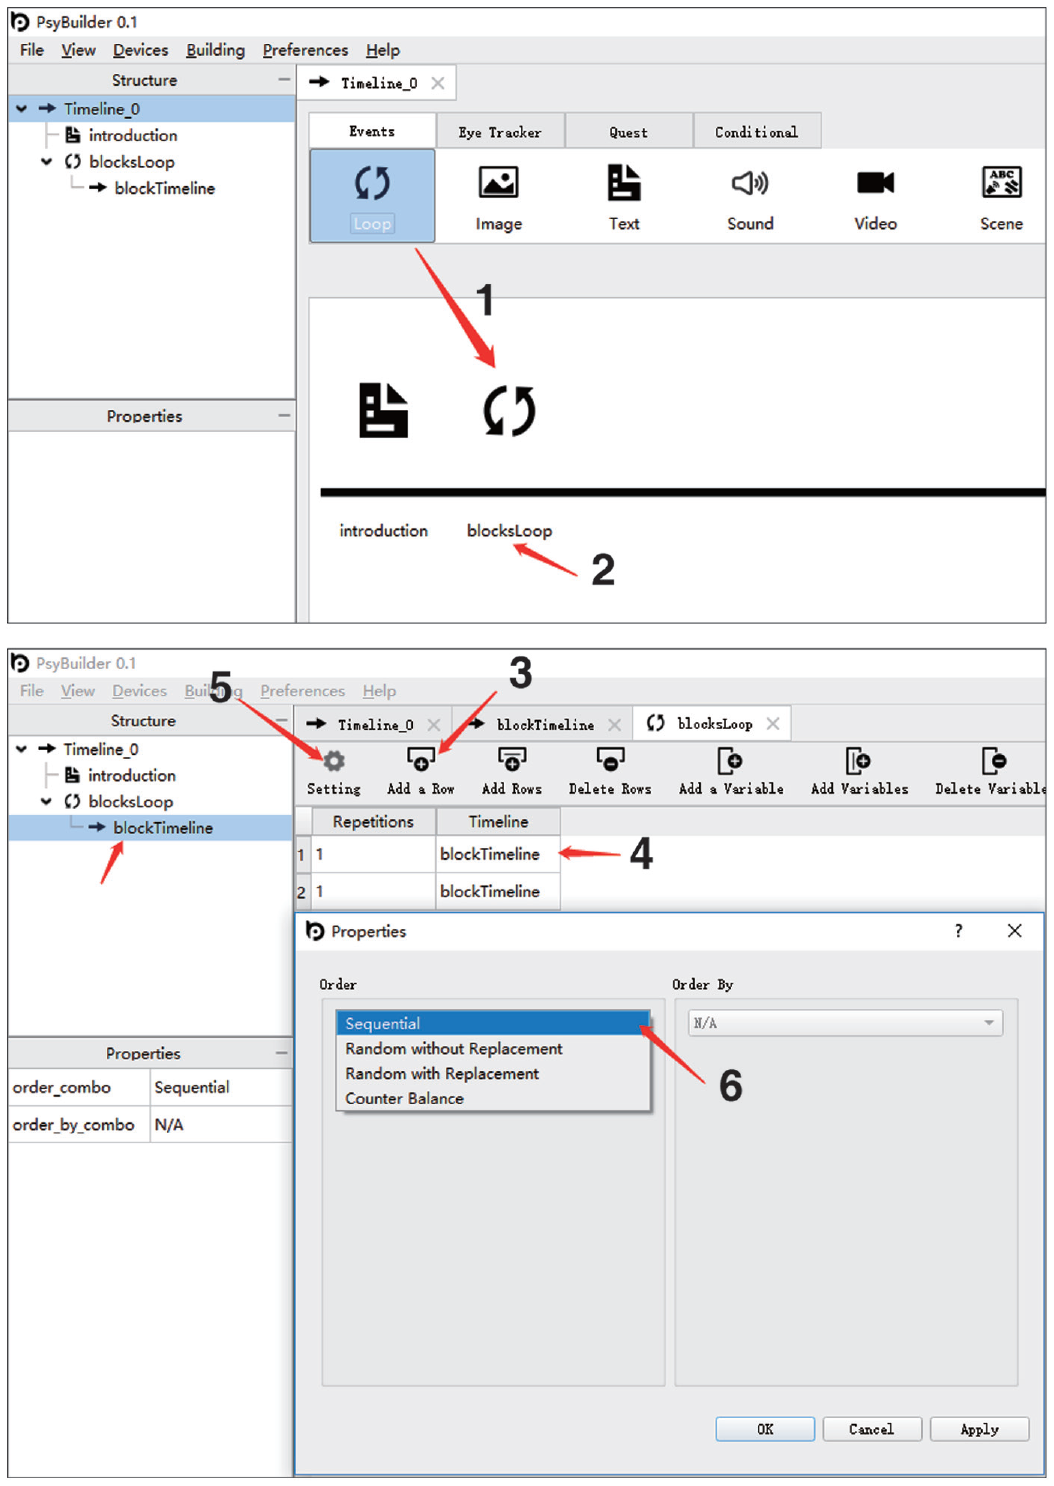
Actions 1 to 6 in Step 3.

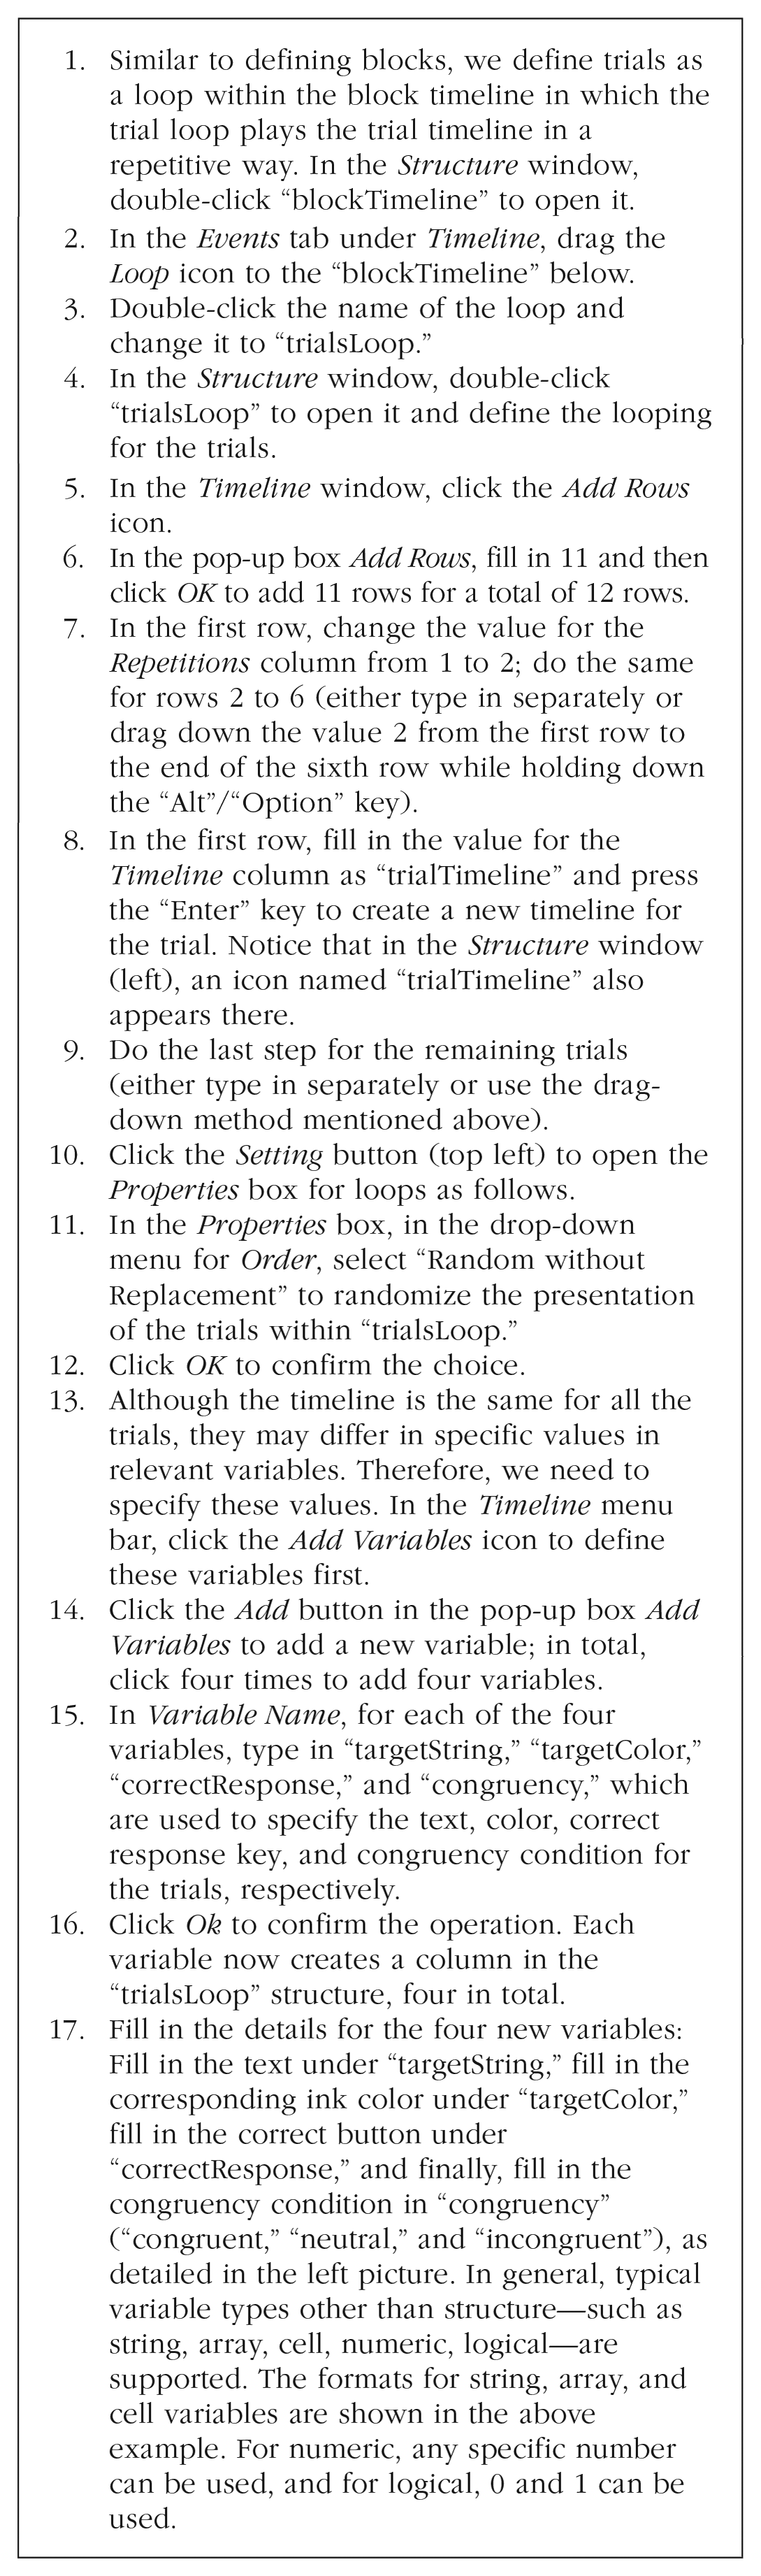
Actions 1 to 6 in Step 4.
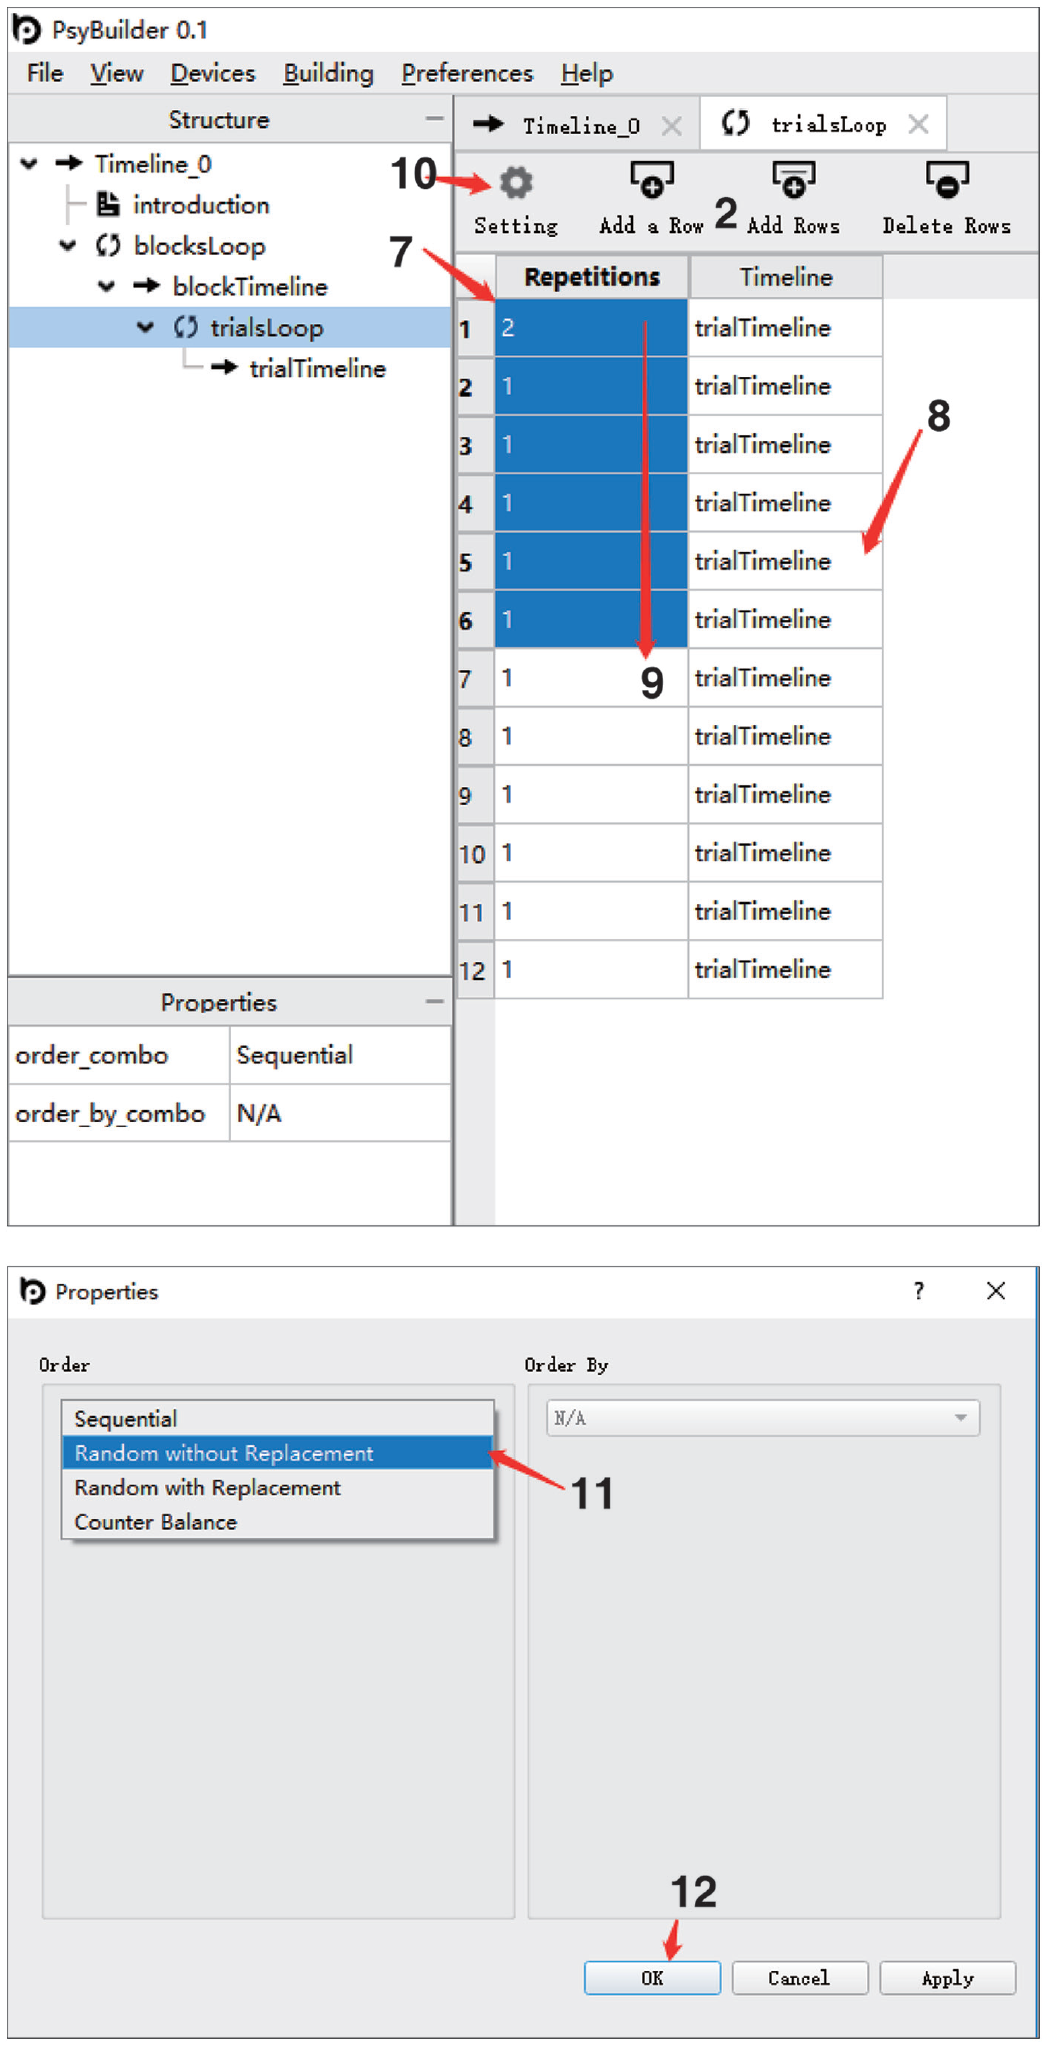
Actions 7 to 12 in Step 4.

Actions 13 to 17 in Step 4.

Actions 1 to 9 in Step 5.

Actions 10 to 16 in Step 5.

Actions 17 to 23 in Step 5.

Actions 24 to 32 in Step 5.

Actions 1 to 8 in Step 6.

Actions 9 to 10 in Step 6.

Actions 1 to 2 in Step 7.
In Step 1, we will give the project a name and define its directory—which is where the final MATLAB/Octave scripts will be saved to and where any external files (images, audio, etc.) needed for the experiment should be included.

In Step 2, we will define what the participant sees when he or she begins the study. It is generally good practice to provide the participant with some instructions about what to do during the study. In our example—the Stroop task—we will instruct the participant on which keys to press throughout the study and let them know how they can begin the task.

In Step 3, we will define the main structure of the experiment—the blocks—using a key feature called loops. Unlike a timeline, which plays a fixed sequence of events, a loop plays timelines repetitively, which is suitable for defining blocks and trials. Typically, an experiment has multiple blocks. Here, we have two blocks, and we will define them in Step 3.

In Step 4, we will define the main unit of the experiment—trials—using loops. Typically, each block has many trials. Here, we have 18 trials for each block, and we will define them in Step 4, including the specific word, ink color, and the correct response for each trial.
In Step 5, we will define the detail of each trial using a timeline. Typically, each trial starts with a fixation, followed by some stimuli and response. These events, timing, and response collection are defined here using the variables (and their values) created in Step 4.

In Step 6, we will define the goodbye display as the end of the experiment. The purpose is to indicate to the participant that the study has finished and to provide instructions if needed.

Now, we are ready to compile the script. These scripts are saved to the same folder as the PsyBuilder project set up at the beginning.

Choosing PsyBuilder Versus Other Software Packages
So far, we have described the interface of PsyBuilder and walked the reader through the graphical building process using a Stroop task. Here, we consider key advantages of PsyBuilder and its limitations from the perspective of a potential adopter.
Major advantages of PsyBuilder
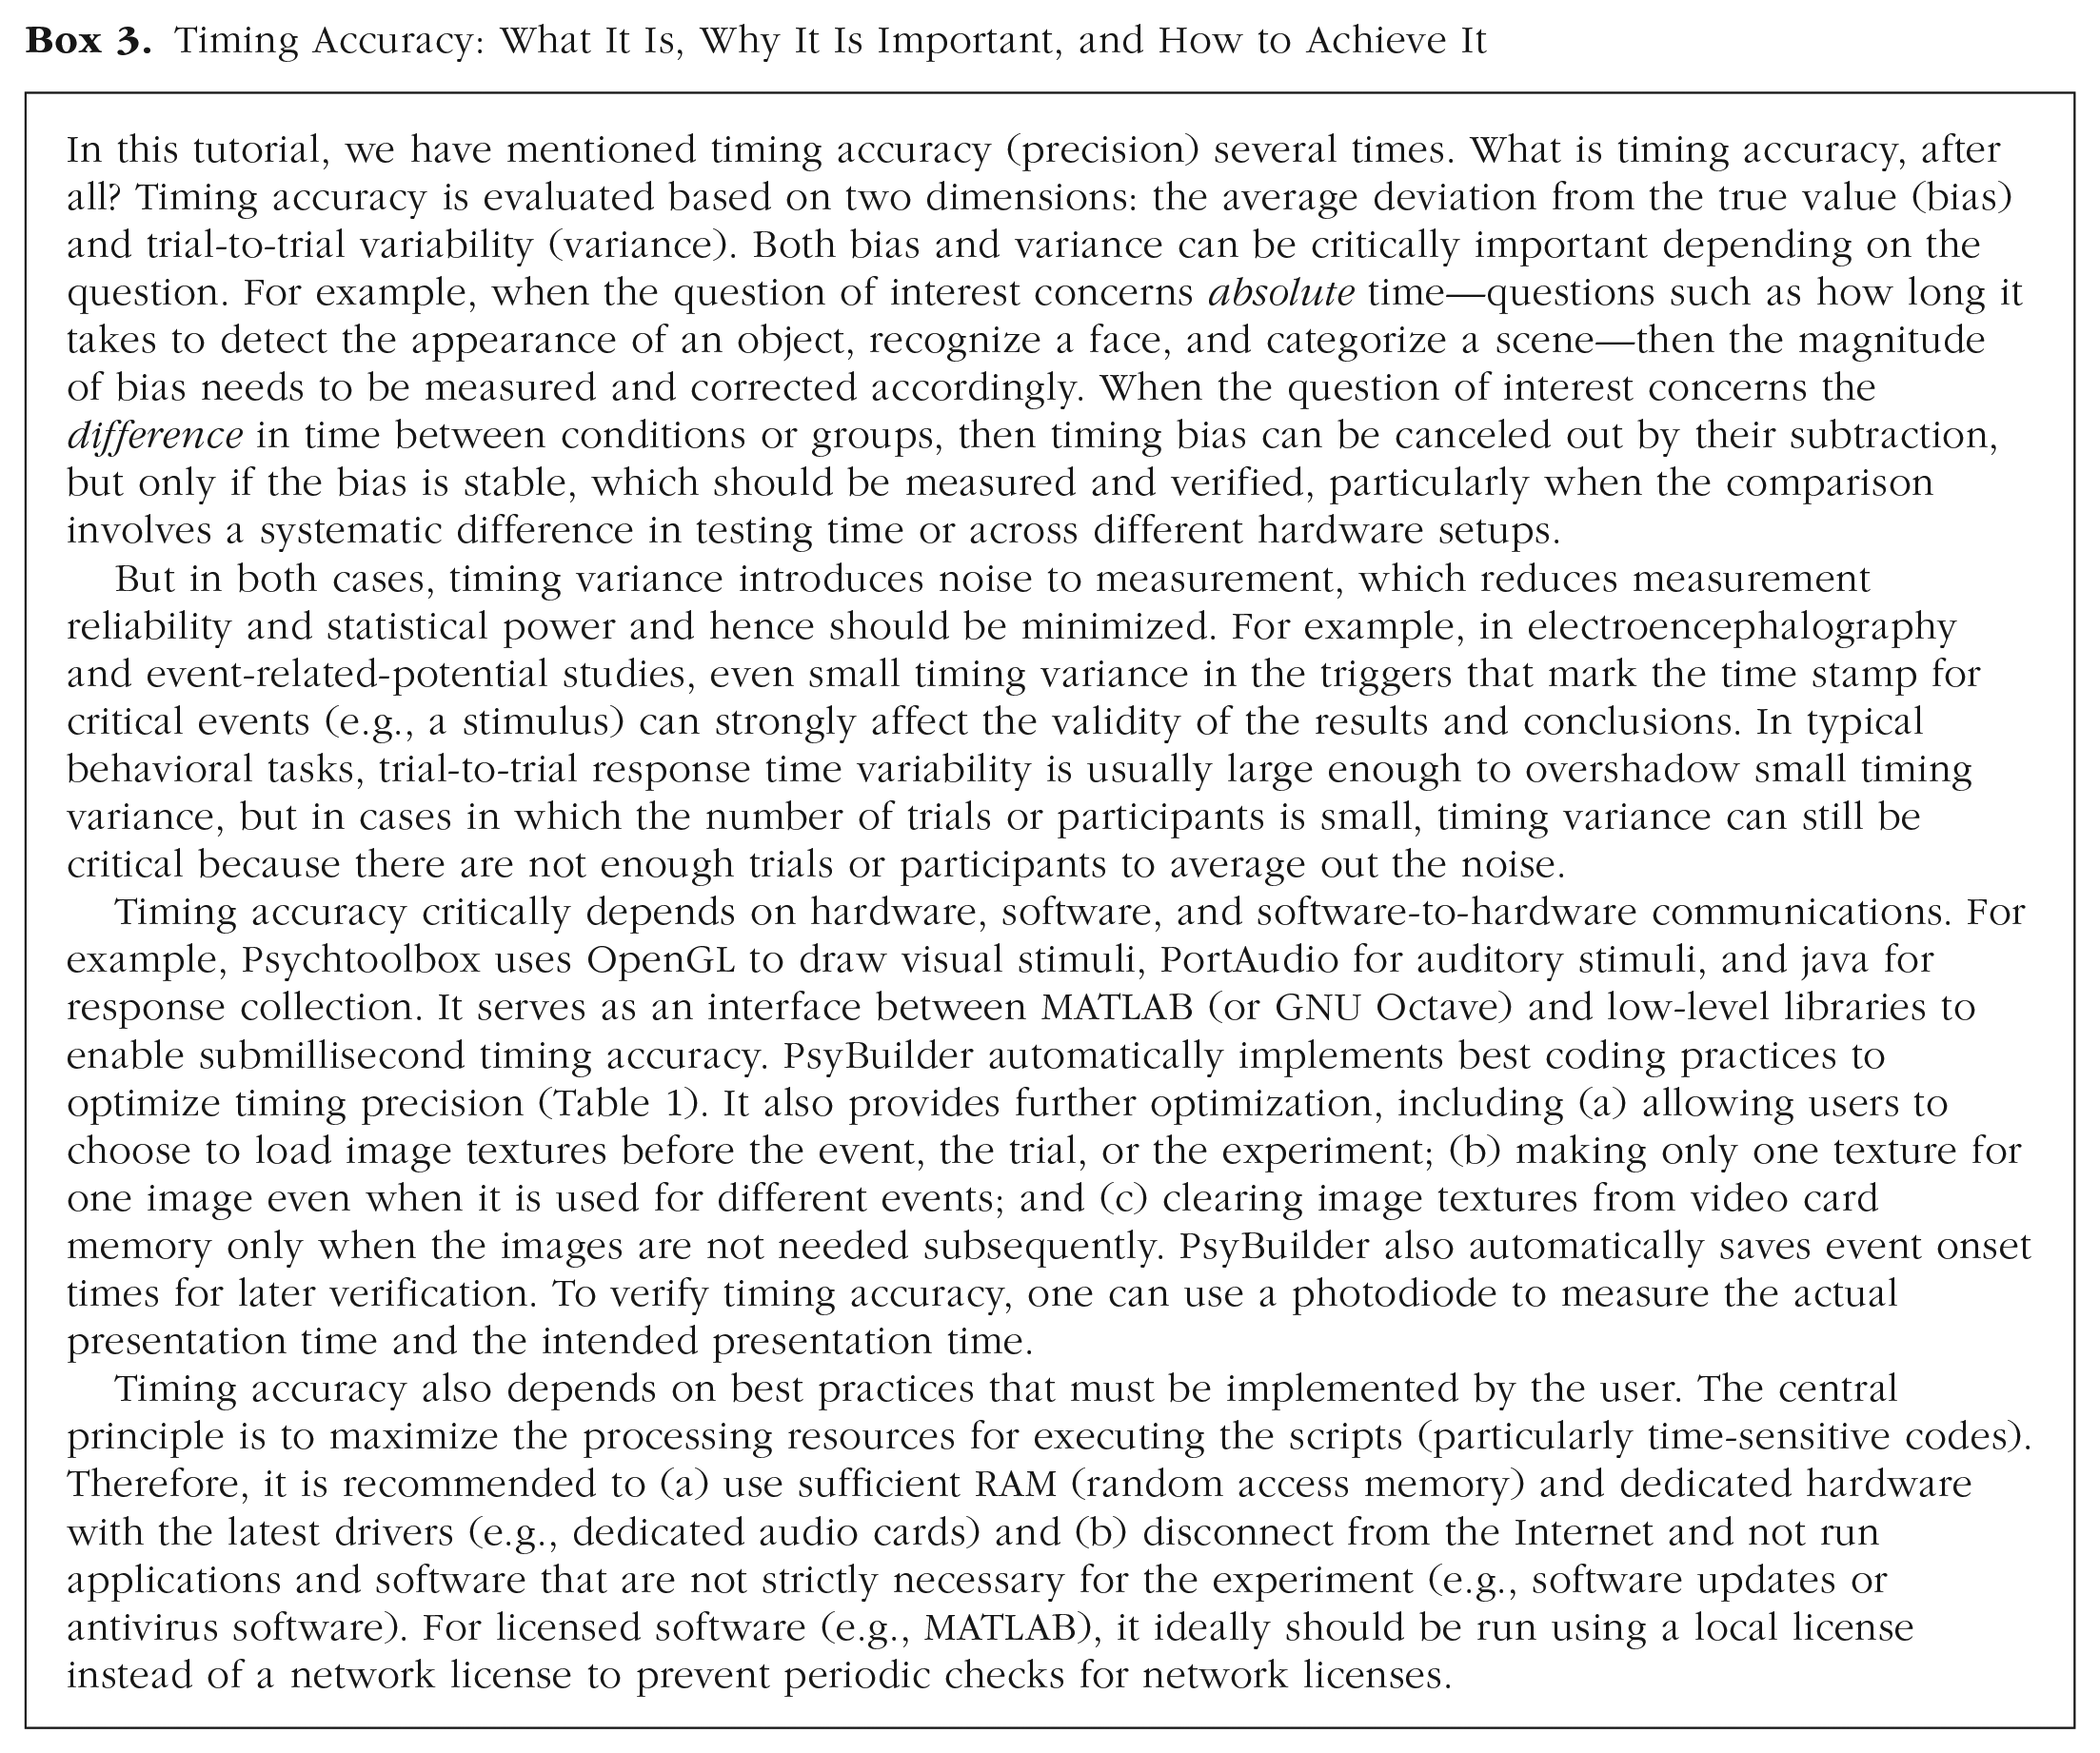
A key advantage of PsyBuilder is that by providing an easy-to-use GUI, it resolves the long-standing usability limitation of Psychtoolbox without compromising its power or flexibility. This makes PsyBuilder suitable for new users and can potentially replace proprietary software (e.g., E-Prime) in teaching and training. Moreover, because users can see exactly how the code changes in response to modifications in the GUI, this functionality can help bolster their understanding of programming in ways that were not previously possible. On the other hand, for intermediate and advanced users, the drag-and-drop functionality coupled with optimized timing (see Box 3) and detailed comments in the output codes can improve data-collection efficiency and accuracy in research. This is important because even experienced users are not immune to the proneness to unwitting mistakes in manual coding.
Timing Accuracy: What It Is, Why It Is Important, and How to Achieve It
Other major features include the following. First, most common stimuli are readily available in PsyBuilder, including images, text, sounds, videos, shapes, gratings, random-dot kinematograms, and any of their combinations (see Chapter 4 of the supplemental tutorial). These stimuli can be presented with any user-defined level of visual transparency as enabled by alpha blending. Second, various inputs are supported, including eye tracker (e.g., from EyeLink), gamepad, keyboard, mouse, and response box. Third, several modes of communications with external devices are available, including screen (with support for multiple displays), sound, network port, parallel port (e.g., for sending electroencephalography triggers to mark the time stamp for events), and serial port. Fourth, common complex procedures, such as Bayesian adaptive staircases (e.g., QUEST; Watson & Pelli, 1983), are supported. Fifth, experimental and event parameters can vary dynamically on every loop. Finally, the support of loops that use different timelines (e.g., for different trials), conditional statements (if and switch), and variables afford users the ability to create a wide range of procedures flexibly. In short, PsyBuilder can help new and experienced users to create experiments both simple and complex with fewer errors and higher efficiency compared with coding in Psychtoolbox.
Potential limitations of PsyBuilder
Potential limitations of PsyBuilder have to do with it being a GUI interface. That is, GUI interfaces are inherently limited in their functionality compared with full-fledged scripting. Although many sophisticated features are supported out of the box in PsyBuilder, it obviously cannot implement every possible stimulus and procedure. Fortunately, this limitation is mitigated by the fact that PsyBuilder outputs executable scripts that are well commented and optimized—users can readily modify them to suit the particular needs not fulfilled by PsyBuilder. Moreover, advanced features currently unavailable in PsyBuilder are being actively developed, including (a) the implementation of complex procedures such as multiple object tracking and stimulation to record steady-state visual-evoked potential, (b) support for more devices (e.g., currently only response boxes from Cedrus and eye trackers from EyeLink are supported), (c) improved support of texts, and (d) direct support for questionnaires and online (over the Internet) data collection.
Maintenance and development of PsyBuilder
Currently, PsyBuilder is being developed and maintained by the authors. With the large user base of MATLAB Psychtoolbox, we are excited for the community to contribute to the development of PsyBuilder. Indeed, one of the Demos provided in the Help menu—an RSVP task—was contributed by Wenfeng Chen from Renmin University of China during the testing phase of this software. We are committed to the success of PsyBuilder, and we have set up a forum to facilitate bug reporting, community connections, and collaborations. Users are welcome to ask questions and report potential bugs on this public forum for PsyBuilder: https://www.psybuilder.com.
MATLAB or Python?
Whereas Psychtoolbox and PsyBuilder use MATLAB (Octave), PsychoPy and OpenSesame, both with builder environments, rely on Python. MATLAB/Octave and Python are both popular programming languages, and Psychtoolbox and PsychoPy also enjoy a large user base. Ultimately, the choice of software packages is a personal one, depending on the purpose, circumstances, and personal preference.
Therefore, for the purpose of this tutorial, it might be useful to focus the comparison on the builder environment. Table 2 summarizes the comparisons of PsyBuilder, PsychoPy Builder (Peirce et al., 2019), and OpenSesame (Mathot et al., 2012) in a number of major features. Screenshots that elaborate on these comparisons are provided at https://osf.io/xcbav/. Therefore, for example, if you intend to use online data collection, then this feature is currently not supported in PsyBuilder (Psychtoolbox) but is available in PsychoPy and OpenSesame, although we do plan to work on this feature in future releases. In terms of timing (see also Box 3), in a recent evaluation of a range of popular free and commercial software packages—Psychtoolbox, PsychoPy, OpenSesame, E-Prime, Presentation—the lowest timing variability was obtained with Psychtoolbox in Ubuntu, with a mean intertrial standard deviation of 0.18 ms in various lab-based tests, including reaction times, visual durations, visual onset, audio onset, and audiovisual synchronization (Bridges et al., 2020). But generally, for most purposes, timing accuracy is adequate for modern software packages, including PsychoPy.
Comparisons of PsyBuilder (Version 0.1), PsychoPy Builder (Version 1.90.2), and OpenSesame (Version 3.2.8) in Key GUI Features

Note: The data for intertrial standard deviations are based on Bridges et al. (2020). See also supplementary screenshots at https://osf.io/xcbav/, titled “Screenshots comparing GUIs.pdf.” GUI = graphical user interface; WYSIWYG = what you see is what you get.
Summary
We have developed the first general-purpose graphical experiment builder for Psychtoolbox, PsyBuilder. PsyBuilder can be used as a tool to build experiments without the need to code. It can also be used to facilitate exponentially faster learning of programming. The output scripts are automatically optimized in timing precision and with detailed comments to facilitate customization. In this tutorial, we introduced its interface and walked the reader through a Stroop task as an example. We also considered its major advantages and limitations for potential adopters. By flattening the learning curve for new users, cutting the time needed for programming an experiment, and optimizing the performance of the output codes in terms of timing precision and detailed comments, we find that PsyBuilder represents a major new development for Psychtoolbox. It is poised to contribute to the open-science movement by facilitating the wide adoption of Psychtoolbox in student training and research in lieu of proprietary software (e.g., E-Prime). It can also help accelerate scientific progress by improving data-collection efficiency and accuracy in behavioral and neural sciences.
Supplemental Material
sj-docx-1-amp-10.1177_25152459211070573 – Supplemental material for PsyBuilder: An Open-Source, Cross-Platform Graphical Experiment Builder for Psychtoolbox With Built-In Performance Optimization
Supplemental material, sj-docx-1-amp-10.1177_25152459211070573 for PsyBuilder: An Open-Source, Cross-Platform Graphical Experiment Builder for Psychtoolbox With Built-In Performance Optimization by Zhicheng Lin, Zhe Yang, Chengzhi Feng and Yang Zhang in Advances in Methods and Practices in Psychological Science
Supplemental Material
sj-docx-2-amp-10.1177_25152459211070573 – Supplemental material for PsyBuilder: An Open-Source, Cross-Platform Graphical Experiment Builder for Psychtoolbox With Built-In Performance Optimization
Supplemental material, sj-docx-2-amp-10.1177_25152459211070573 for PsyBuilder: An Open-Source, Cross-Platform Graphical Experiment Builder for Psychtoolbox With Built-In Performance Optimization by Zhicheng Lin, Zhe Yang, Chengzhi Feng and Yang Zhang in Advances in Methods and Practices in Psychological Science
Footnotes
Transparency
Action Editor: Julia Strand
Editor: Daniel J. Simons
Author Contributions
Z. Lin and Z. Yang are joint first authors with equal contributions. Y. Zhang conceived and supervised the project, designed and implemented the compiler. Y. Zhang, Z. Yang, and Z. Lin designed the graphical user interface. Y. Zhang and Z. Yang implemented the graphical user interface and maintained the support website. Z. Lin and Y. Zhang wrote the tutorial and made the figures. Y. Zhang, Z. Yang, and Z. Feng provided managerial and financial support.
References
Supplementary Material
Please find the following supplemental material available below.
For Open Access articles published under a Creative Commons License, all supplemental material carries the same license as the article it is associated with.
For non-Open Access articles published, all supplemental material carries a non-exclusive license, and permission requests for re-use of supplemental material or any part of supplemental material shall be sent directly to the copyright owner as specified in the copyright notice associated with the article.