
Abstract
Twenty-nine teams involving 61 analysts used the same data set to address the same research question: whether soccer referees are more likely to give red cards to dark-skin-toned players than to light-skin-toned players. Analytic approaches varied widely across the teams, and the estimated effect sizes ranged from 0.89 to 2.93 (Mdn = 1.31) in odds-ratio units. Twenty teams (69%) found a statistically significant positive effect, and 9 teams (31%) did not observe a significant relationship. Overall, the 29 different analyses used 21 unique combinations of covariates. Neither analysts’ prior beliefs about the effect of interest nor their level of expertise readily explained the variation in the outcomes of the analyses. Peer ratings of the quality of the analyses also did not account for the variability. These findings suggest that significant variation in the results of analyses of complex data may be difficult to avoid, even by experts with honest intentions. Crowdsourcing data analysis, a strategy in which numerous research teams are recruited to simultaneously investigate the same research question, makes transparent how defensible, yet subjective, analytic choices influence research results.
In the scientific process, creativity is mostly associated with the generation of testable hypotheses and the development of suitable research designs. Data analysis, on the other hand, is sometimes seen as the mechanical, unimaginative process of revealing results from a research study. Despite methodologists’ remonstrations (Bakker, van Dijk, & Wicherts, 2012; Gelman & Loken, 2014; Simmons, Nelson, & Simonsohn, 2011), it is easy to overlook the fact that results may depend on the chosen analytic strategy, which itself is imbued with theory, assumptions, and choice points. In many cases, there are many reasonable (and many unreasonable) approaches to evaluating data that bear on a research question (Carp, 2012a, 2012b; Gelman & Loken, 2014; Wagenmakers, Wetzels, Borsboom, van der Maas, & Kievit, 2012).
Researchers may understand this conceptually, but there is little appreciation for the implications in practice. In some cases, authors use a particular analytic strategy because it is the one they know how to use, rather than because they have a specific rationale for using it. Peer reviewers may comment on and suggest improvements to a chosen analytic strategy, but rarely do those comments emerge from working with the actual data set (Sakaluk, Williams, & Biernat, 2014). Moreover, it is not uncommon for peer reviewers to take the authors’ analytic strategy for granted and comment exclusively on other aspects of the manuscript. More important, once an article is published, reanalyses and critiques of the chosen analytic strategy are slow to emerge and rare (Ebrahim et al., 2014; Krumholz & Peterson, 2014; McCullough, McGeary, & Harrison, 2006), in part because of the low frequency with which data are available for reanalysis (Wicherts, Borsboom, Kats, & Molenaar, 2006). The reported results and implications drive the impact of published articles; the analytic strategy is pushed to the background.
But what if the methodologists are correct? What if scientific results are highly contingent on subjective decisions at the analysis stage? In that case, the process of certifying a particular result on the basis of an idiosyncratic analytic strategy might be fraught with unrecognized uncertainty (Gelman & Loken, 2014), and research findings might be less trustworthy than they at first appear to be (Cumming, 2014). Had the authors made different assumptions, an entirely different result might have been observed (Babtie, Kirk, & Stumpf, 2014). In this article, we report an investigation that addressed the current lack of knowledge about how much diversity in analytic choice there can be when different researchers analyze the same data and whether such diversity results in different conclusions. Specifically, we report the impact of analytic decisions on research results obtained by 29 teams that analyzed the same data set to answer the same research question. The results of this project illustrate how researchers can vary in their analytic approaches and how results can vary according to these analytic choices.
Crowdsourcing Data Analysis: Skin Tone and Red Cards in Soccer
The primary research question tested in this crowdsourced project was whether soccer players with dark skin tone are more likely than those with light skin tone to receive red cards from referees. 1 The decision to give a player a red card results in the player’s ejection from the game and has severe consequences because it obliges his team to continue with one fewer player for the remainder of the match. Red cards are given for aggressive behavior, such as a tackling violently, fouling with the intent to deny an opponent a clear goal-scoring opportunity, hitting or spitting on an opposing player, or using threatening and abusive language. However, despite a standard set of rules and guidelines for both players and match officials, referees’ decision making is often fraught with ambiguity (e.g., it may not be obvious whether a player committed an intentional foul or was simply going for the ball). It is inherently a judgment call on the part of the referee as to whether a player’s behavior merits a red card.
One might anticipate that players with darker skin tone would receive more red cards because of expectancy effects in social perception: Ambiguous behavior tends to be interpreted in line with prior attitudes and beliefs (Bodenhausen, 1988; Correll, Park, Judd, & Wittenbrink, 2002; Frank & Gilovich, 1988; Hugenberg & Bodenhausen, 2003). In societies as diverse as India, China, the Dominican Republic, Brazil, Jamaica, the Philippines, the United States, Chile, Kenya, and Senegal, light skin is seen as a sign of beauty, status, and social worth (Maddox & Chase, 2004; Maddox & Gray, 2002; Sidanius, Pena, & Sawyer, 2001; Twine, 1998). Negative attitudes toward persons with dark skin may lead a referee to interpret an ambiguous foul by such a person as a severe foul and, consequently, to give a red card (Kim & King, 2014; Parsons, Sulaeman, Yates, & Hamermesh, 2011; Price & Wolfers, 2010).
Consider for a moment how you would test this research hypothesis using a complex archival data set including referees’ decisions across numerous leagues, games, years, referees, and players and a variety of potentially relevant control variables that you might or might not include in your analysis. Would you treat each red-card decision as an independent observation? How would you address the possibility that some referees give more red cards than others? Would you try to control for the seniority of the referee? Would you take into account whether a referee’s familiarity with a player affects the referee’s likelihood of assigning a red card? Would you look at whether players in some leagues are more likely to receive red cards compared with players in other leagues, and whether the proportion of players with dark skin varies across leagues and player positions? As these questions suggest, many analytic decisions are required. Moreover, for a given question, different decisions might be defensible and simultaneously have implications for the findings observed and the conclusions drawn. You and another researcher might make different judgment calls (regarding statistical method, covariates included, or exclusion rules) that, prima facie, are equally valid. This crowdsourced project examined the extent to which such good faith, subjective choices by different researchers analyzing a complex data set shape the reported results.
Disclosures
Data, materials, and online resources
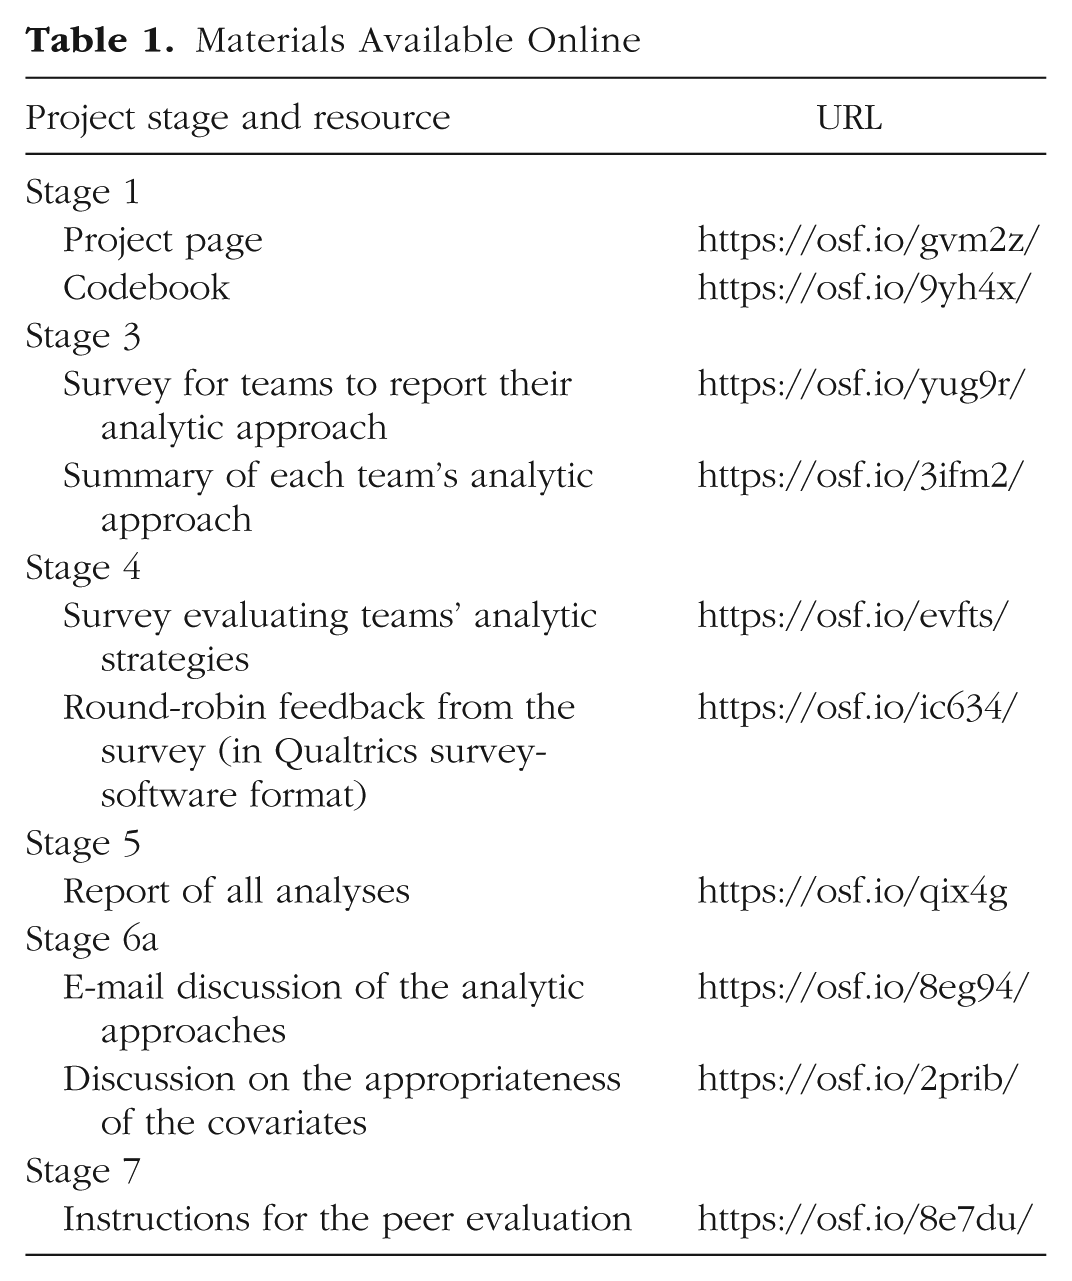
Further information on this study is available online as a project on the Open Science Framework (OSF). Table 1 provides an overview of the materials from each project stage that are available at OSF. The project’s main folder at OSF (https://osf.io/gvm2z) provides links to all files, which include the data set (https://osf.io/fv8c3/) and a description of the included variables (https://osf.io/9yh4x/), a numeric overview of results by the various teams at the various project stages (https://osf.io/c9mkx/), graphical overviews of results at the various stages (https://osf.io/j2zth/), and the scripts to obtain each plot (https://osf.io/rgqtx/). The main folder also includes the manuscript for this article and a subarticle by each team detailing its analysis (https://osf.io/qix4g/).
Materials Available Online
The Supplemental Material available online (http://journals.sagepub.com/doi/suppl/10.1177/2515245917747646) includes a project description, notes on the research process, and the complete text of the surveys sent to the analysis teams. Further, the Supplemental Material documents the analytic approach taken by each team and indicates how these approaches were altered on the basis of peer feedback. In addition, the Supplemental Material includes an overview of results for the primary research question as well as additional analyses (including results for a second research question that initially was part of this project but was not pursued further because the raw data were inadequate). The Supplemental Material also discusses the limitations of the data set and of including player’s club and league country as covariates and provides a link to an IPython notebook illustrating one team’s analysis. Finally, the Supplemental Material includes the text of the survey of the analysts’ familiarity with the different statistical techniques used and the survey of their assessment of other teams’ analytic choices, as well as results of an exploratory analysis undertaken to determine whether convergence regarding the results obtained depended on the analytic approach taken.
Ethical approval
This research was conducted using publicly available archival data and according to ethical standards.
Stages of the Crowdsourcing Process
The project unfolded over several key stages. First, the unique data set used for this project was obtained, documented, and prepared for dissemination to participating analysts (Stage 1). Then, analysts were recruited to participate in the project (Stage 2). The first round of data analysis (Stage 3) was followed by round-robin peer evaluations of each analysis (Stage 4). The second round of data analysis (Stage 5) was followed by an initial discussion of results and debate, which led to further analyses (Stage 6a). When we tried to decide on a common conclusion while writing, editing, and reviewing the manuscript (Stage 6b), further questions emerged, and an internal peer review was started. In this review, each team’s approach was evaluated by other analysts who were experts in that technique (Stage 7). The project then concluded with revision of this manuscript. During several of these stages, the analysts’ subjective beliefs about the hypothesis being tested were assessed using questionnaires. The timeline of the project is summarized in Figure 1.
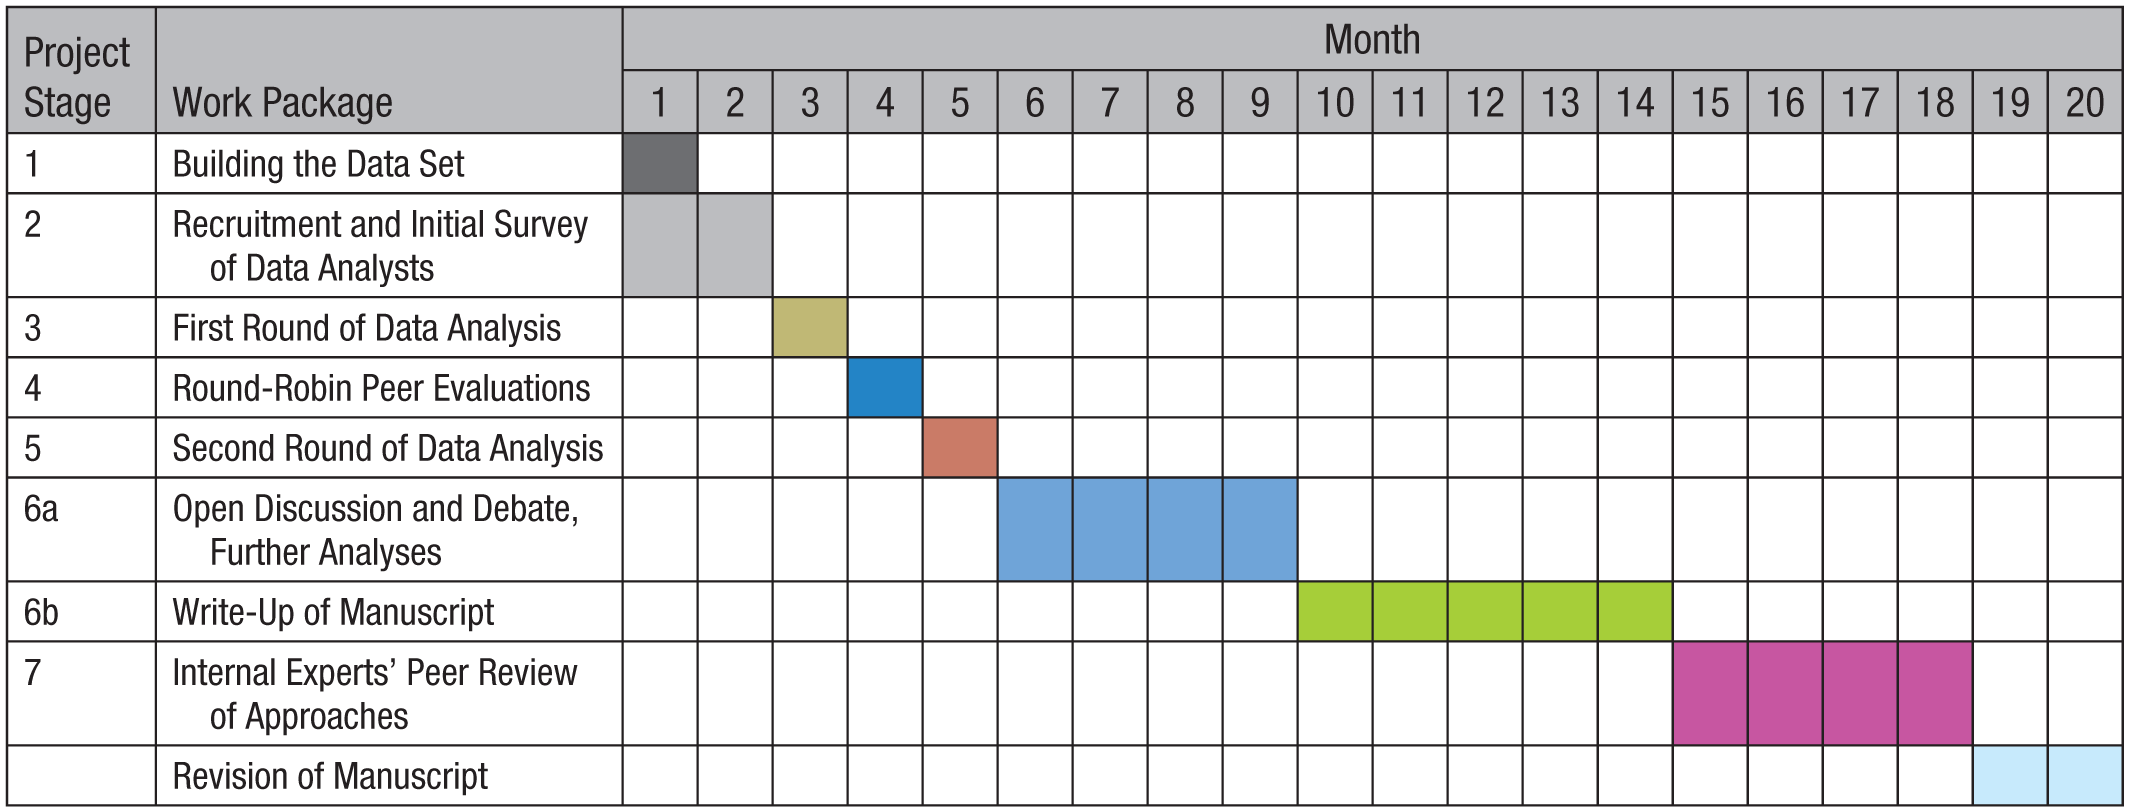
Overview of the project’s stages.
Stage 1: building the data set
From a company for sports statistics, we obtained demographic information on all soccer players (N = 2,053) who played in the first male divisions of England, Germany, France, and Spain in the 2012–2013 season. In addition, we obtained data about the interactions of those players with all referees (N = 3,147) whom they encountered across their professional careers. Thus, the interaction data for most players covered multiple seasons of play, from their first professional match until the time that the data were acquired, in June 2014. For players who were new in the 2012–2013 season, the data covered a single season. The data included the number of matches in which each player encountered each referee and our dependent variable, the number of red cards given to each player by each referee. The data set was made available as a list with 146,028 dyads of players and referees.
Photos for 1,586 of the 2,053 players were available from our source. Players for whom no photo was available tended to be relatively new players or those who had just moved up from a team in a lower league. The variable player’s skin tone was coded by two independent raters blind to the research question. On the basis of the photos, the raters categorized the players on a 5-point scale ranging from 1 (very light skin) to 3 (neither dark nor light skin) to 5 (very dark skin), and these ratings correlated highly (r = .92, ρ = .86). This variable was rescaled to be bounded by 0 (very light skin) and 1 (very dark skin) prior to the final analysis, to ensure consistency of effect sizes across the teams of analysts. The raw ratings were rescaled to 0, .25, .50, .75, and 1 to create this new scale.
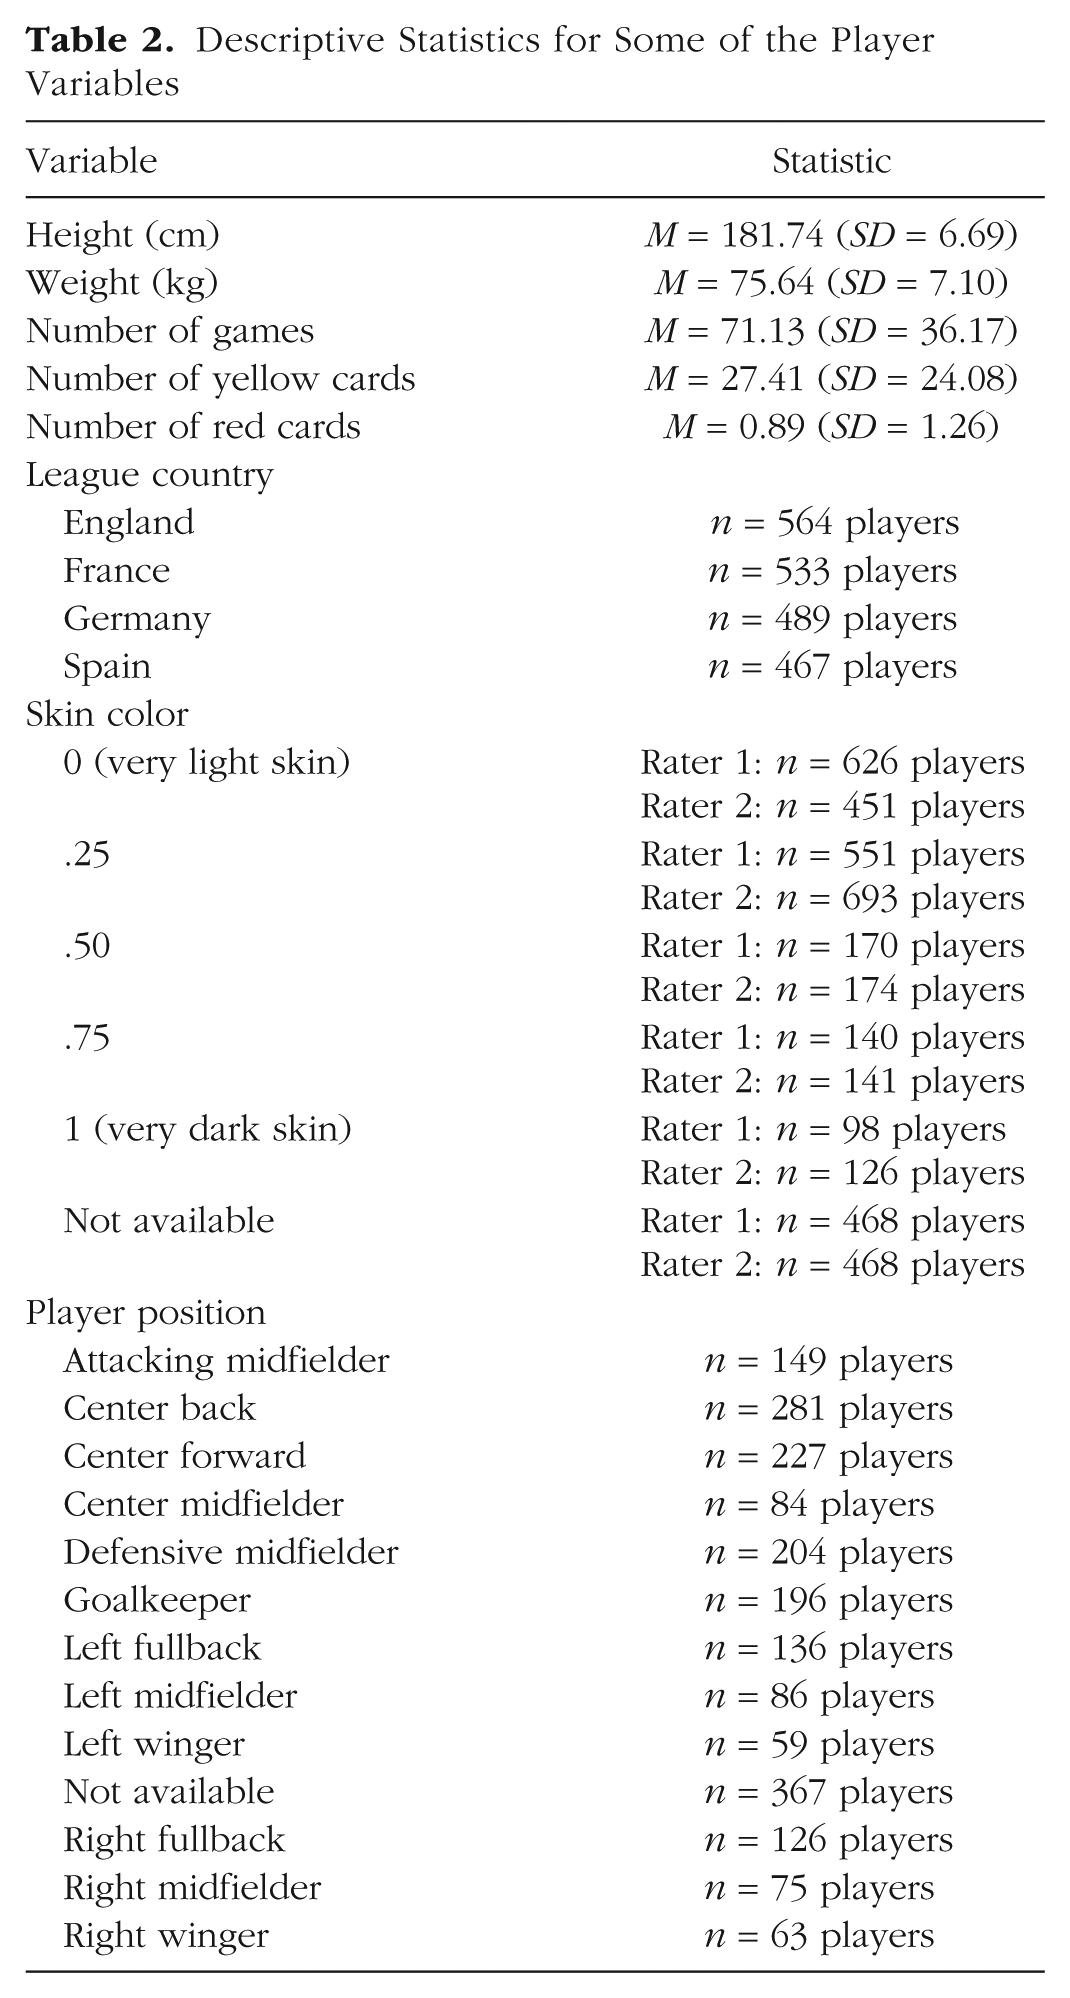
A variety of potential independent variables were included in the data set (for the complete codebook, see https://osf.io/9yh4x). The data included players’ typical position, weight, and height and referees’ country of origin. For each dyad, the data included the number of games in which the referee and player encountered each other and the number of yellow and red cards awarded to the player. The records indicated players’ ages, clubs, and leagues—which frequently change throughout players’ careers—at the time of data collection, not at the specific times the red cards were received (see Table 2 for a summary of some of the player variables). Given the sensitivity of the research topic, referees’ identities were protected by anonymization; each referee and each country of referees’ origin was assigned a numerical identifier. Our archival data set provided the opportunity to estimate the magnitude of the relationship between player’s skin tone and number of red cards received, but did not offer the opportunity to identify causal relations between these variables.
Descriptive Statistics for Some of the Player Variables
Stage 2: recruitment and initial survey of data analysts
The first three authors and last author posted a description of the project online (see Supplement 1 in the Supplemental Material available online). This document included an overview of the crowdsourcing project, a description of the data set, and the planned timeline. The project was advertised via Brian Nosek’s Twitter account, blogs of prominent academics, and word of mouth.
Seventy-seven researchers expressed initial interest in participating and were given access to the OSF project page to obtain the data. Individual analysts were welcome to form teams, and most did. For the sake of consistency, in this article we use the term team also for those few individuals who chose to work on their own. Thirty-three teams submitted a report in the first round (Stage 3), and 29 teams submitted a final report. The analysis presented in this article focuses on the submissions of those 29 teams. In total, the final project involved 61 data analysts plus the four authors who organized the project. A demographic survey revealed that the team leaders worked in 13 different countries and came from a variety of disciplinary backgrounds, including psychology, statistics, research methods, economics, sociology, linguistics, and management. At the time that the first draft of this manuscript was written, 38 of the 61 data analysts (62%) held a Ph.D. (62%), and 17 (28%) had a master’s degree. The analysts came from various ranks and included 8 full professors (13%), 9 associate professors (15%), 13 assistant professors (21%), 8 postdocs (13%), and 17 doctoral students (28%). In addition, 27 participants (44%) had taught at least one undergraduate statistics course, 22 (36%) had taught at least one graduate statistics course, and 24 (39%) had published at least one methodological or statistical article.
In addition to collecting data on the analysts’ demographic characteristics, we asked the team leaders for their opinion regarding the research question. For example, using a 5-point Likert scale from 1 (very unlikely) to 5 (very likely), they answered the question “How likely do you think it is that soccer referees tend to give more red cards to dark-skinned players?” This question was asked again at several points in the research project to track beliefs over time: when analysts submitted their analytic approach, when they submitted their final analyses, and after the group discussion of all the teams’ results.
Stage 3: first round of data analysis
After registering and answering the subjective-beliefs survey for the first time, the research teams were given access to the data. Each team then decided on its own analytic approach to test the primary research question and analyzed the data independently of the other teams (see Item 1 in Supplement 2 for further details). Then, via a standardized Qualtrics survey, the teams submitted to the coordinators structured summaries of their analytic approach, including information about data transformations, exclusions, covariates, the statistical techniques used, the software used, and the results (see Supplement 3 for the text of the survey materials sent to the team leaders; the Qualtrics files and descriptions of the individual teams’ analytic approaches are available at https://osf.io/yug9r/ and https://osf.io/3ifm2/, respectively). The teams were also asked about their beliefs regarding the primary research question.
Stage 4: round-robin peer evaluations of overall analysis quality
For the first three stages of the project, the teams were expected to work independently of each other. However, beginning with Stage 4, they were encouraged to discuss and debate their respective approaches to the data set. In Stage 4, after descriptions of the results were removed, the structured summaries were collated into a single questionnaire and distributed to all the teams for peer review. The analytic approaches were presented in a random order, and the analysts were instructed to provide feedback on at least the first three approaches that they examined. They were asked to provide qualitative feedback as well as a confidence rating (“How confident are you that the described approach below is suitable for analyzing the research questions?”) on a 7-point scale from 1 (unconfident) to 7 (confident). On average, each team received feedback from about five other teams (M = 5.32, SD = 2.87).
The qualitative and quantitative feedback was aggregated into a single report and shared with all team members. Thus, each team received peer-review commentaries about their own analytic strategy and the other teams’ analytic strategies. Notably, these commentaries came from reviewers who were highly familiar with the data set, yet at this point the teams were unaware of others’ results (for the complete survey and round-robin feedback, see https://osf.io/evfts/ and https://osf.io/ic634/, respectively). Each team therefore had the opportunity to learn from others’ analytic approaches and from the qualitative and quantitative feedback provided by peer reviewers, but did not have access to other teams’ estimated effect sizes. This phase offered the teams an opportunity to improve the quality of their analyses and, if anything, ought to have promoted convergence in analytic strategies and outcomes.
Stage 5: second round of data analysis
Following the peer review, the teams had the opportunity to change their analytic strategies and draw new conclusions (see Supplement 4 for a list of the initial and final approaches of each team). They submitted formal reports in a standardized format and also filled out a standardized questionnaire similar to that used in Stage 2. Their subjective beliefs about the primary research question were also assessed in this questionnaire. Notably, the teams were not forced to present a single effect size without robustness checks. Rather, they were encouraged to present results in the way they would in a published article, with formal Method and Results sections. Some teams adopted a model-building approach and reported the results of the model that they felt was the most appropriate one. The fact that not every team did this represents yet another subjective, yet defensible analytic choice. All the teams’ reports are available on the OSF, at https://osf.io/qix4g. Supplement 5 presents a brief summary of each team’s methods and a one-sentence description of each team’s findings, and Supplement 11 provides an illustration of one team’s process.
Stage 6: open discussion and debate, further analyses, and drafting a report on the project
After the formal analysis, the reports were compiled and uploaded to the OSF project. A summary e-mail sent to all the teams invited them to review the reports and discuss as a group the analytic strategies and what to conclude regarding the primary research question. Team members engaged in a substantive e-mail discussion regarding the variation in findings and analytic strategies (the full text of this discussion can be found at https://osf.io/8eg94/). For example, one team found a strong influence of five outliers on their results. Other teams performed additional analyses to investigate whether their results were similarly driven by a few outliers (interestingly, they were not). Limitations of the data set were also discussed (see Supplement 9). At this stage, a final assessment of subjective beliefs was conducted; this survey also presented a series of possible statements summarizing the outcome of this project and asked the analysts to rate their agreement with each one. The first three authors and last author then wrote a first draft of this manuscript, and all the team members were invited to jointly edit and extend the draft using Google Docs.
When the analysts scrutinized each other’s results, it became apparent that differences in results may have been due not only to variations in statistical models, but also to variations in the choice of covariates. Doing a preliminary reanalysis, the leader of Team 10 discovered that including league and club as covariates may have been responsible for the nonsignificant results obtained by some teams. A debate emerged regarding whether the inclusion of these covariates was quantitatively defensible given that the data on league and club were available for the time of data collection only and these variables likely changed over the course of many players’ careers (see the discussion at https://osf.io/2prib/). The project coordinators therefore asked the 10 teams that had included these variables in their final models to rerun their models without these covariates (see Supplement 10). Additionally, these teams were allowed to decide whether they wanted to revise their final models to exclude these covariates. 2 The results reported in this article reflect the teams’ choices of their final models.
Stage 7: more granular peer assessments of analysis quality
The discussion and debate about analytic choices motivated the project coordinators to initiate a more fine-grained assessment of each of the final analyses to identify potential flaws that might account for any variability in the reported results. Therefore, after the methods and results of all the teams were known, the analysts participated in an additional internal peer-review assessment. First, they indicated their familiarity with each approach used by each team, on a 5-point scale ranging from 1 (very unfamiliar) to 5 (very familiar; see Supplement 12). For some techniques, most of the analysts responded “familiar” or “very familiar” (e.g., 34 in the case of multiple regression). For other techniques, relatively few analysts did so (e.g., 3 in the case of Bayesian clustering with the Dirichlet process). On the basis of their expertise, the coordinators then assigned each analyst one to three analytic strategies to assess in greater depth (i.e., strategies involving techniques that the analyst reported being familiar or very familiar with). No researcher was assigned to review the approach of his or her own team.
From comments the analysts made in the earlier rounds of analysis (Stages 3–6), the coordinators derived a list of seven potential statistical concerns regarding analytic decisions that were made (see Supplement 13). For example, an analysis may have unnecessarily excluded a large number of cases or may not have adequately accounted for the number of games played. The analysts were asked to report whether the assigned analytic strategies had failed to take into account each of these seven issues (on a 5-point scale ranging from 1, strongly disagree, to 5, strongly agree). Note that lower scores indicated that more obstacles were avoided, and higher scores indicated that more issues were left unaddressed. For each assigned strategy, the survey also included an open-ended question asking whether there was an additional analytic issue that might have biased the results, and another item asked the analysts to rate their agreement that this additional issue affected the validity of the approach (same 5-point scale). The final question asked the analysts to rate how convinced they were that the approach in question successfully addressed most of the potential statistical concerns (1= very unconvinced, 5 = very convinced).
Main Findings From the Project
How much did results vary between different teams using the same data to test the same hypothesis?
Table 3 shows each team’s final analytic technique, model specifications for treatment of nonindependence, and reported effect size. 3 The analytic techniques chosen ranged from simple linear regression to complex multilevel regression and Bayesian approaches. The teams also varied greatly in their decisions regarding which covariates to include (see https://osf.io/sea6k/ for the rationales the teams provided). Table 4 shows that the 29 teams used 21 unique combinations of covariates. Apart from the variable games (i.e., the number of games played under a given referee, which was used by all the teams, just one covariate (player position, 69%) was used in more than half of the teams’ analyses, and three were used in just one analysis. Three teams chose to use no covariates, and another 3 teams included player position as the only covariate in their analysis. Four sets of variables were used by 2 teams each, and each of the remaining 15 teams used a unique combination of covariates.
Analytic Approaches and Results for Each Team
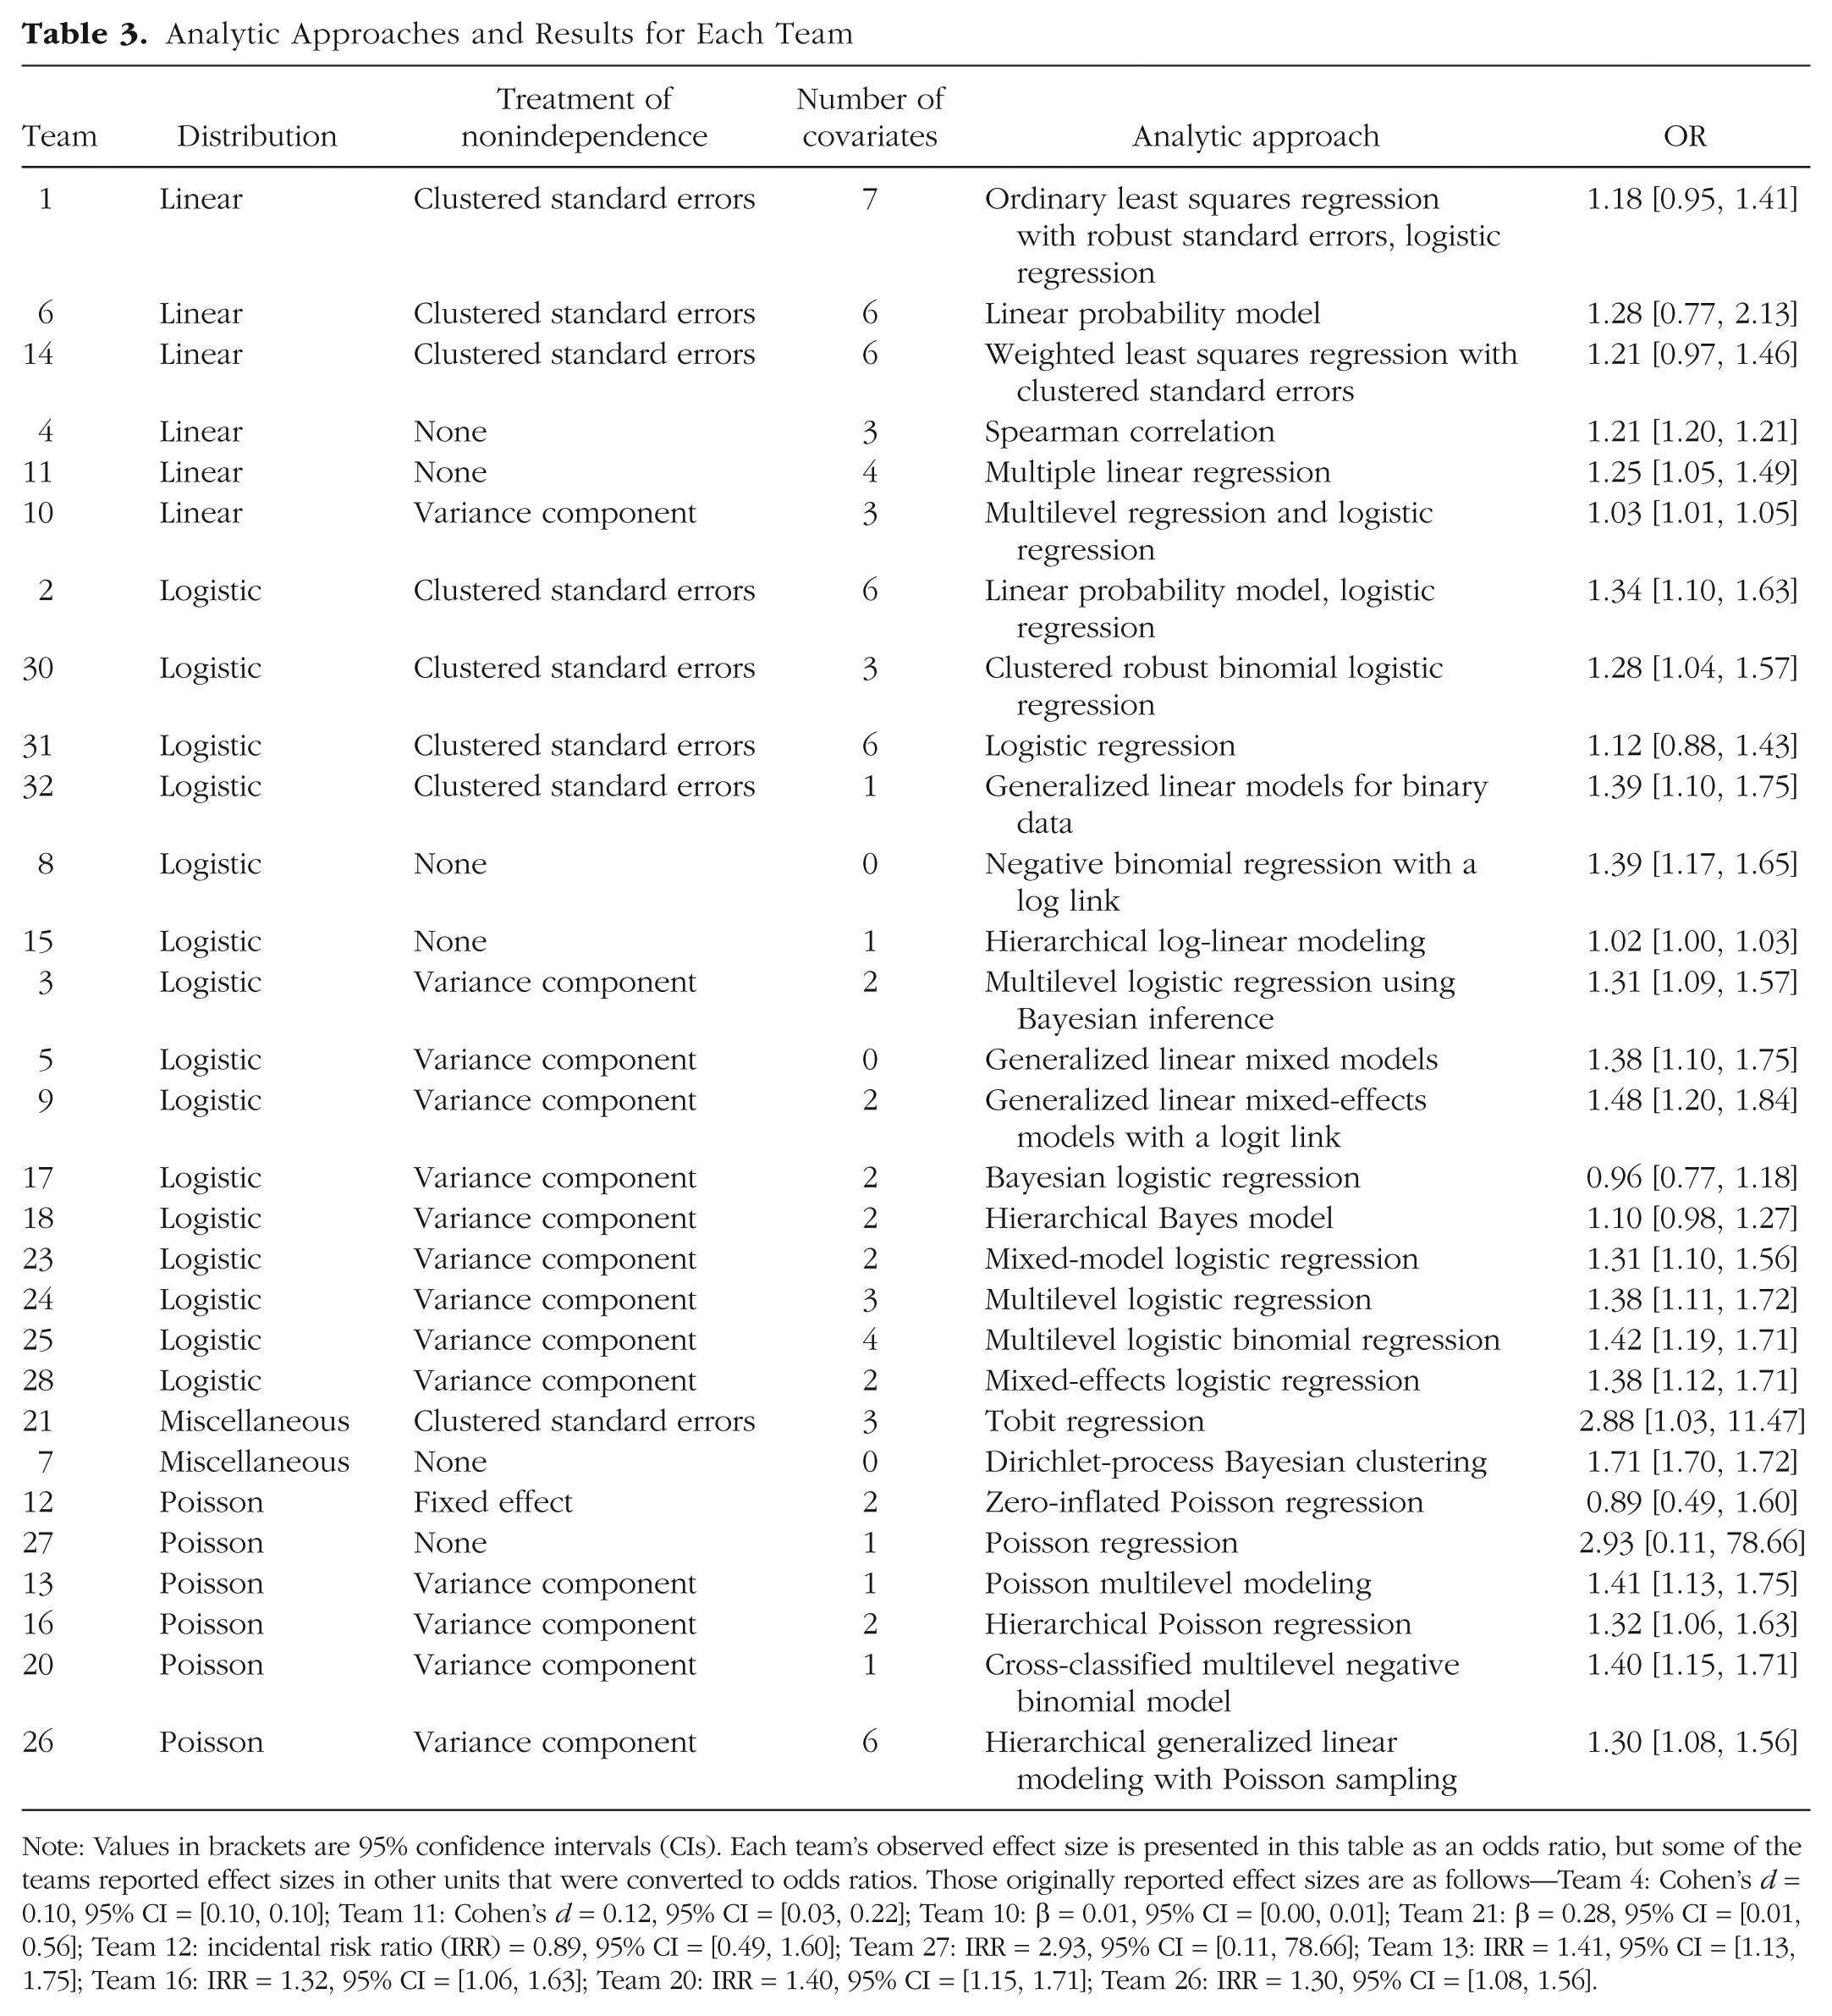
Note: Values in brackets are 95% confidence intervals (CIs). Each team’s observed effect size is presented in this table as an odds ratio, but some of the teams reported effect sizes in other units that were converted to odds ratios. Those originally reported effect sizes are as follows—Team 4: Cohen’s d = 0.10, 95% CI = [0.10, 0.10]; Team 11: Cohen’s d = 0.12, 95% CI = [0.03, 0.22]; Team 10: β = 0.01, 95% CI = [0.00, 0.01]; Team 21: β = 0.28, 95% CI = [0.01, 0.56]; Team 12: incidental risk ratio (IRR) = 0.89, 95% CI = [0.49, 1.60]; Team 27: IRR = 2.93, 95% CI = [0.11, 78.66]; Team 13: IRR = 1.41, 95% CI = [1.13, 1.75]; Team 16: IRR = 1.32, 95% CI = [1.06, 1.63]; Team 20: IRR = 1.40, 95% CI = [1.15, 1.71]; Team 26: IRR = 1.30, 95% CI = [1.08, 1.56].
Covariates Included by Each Team
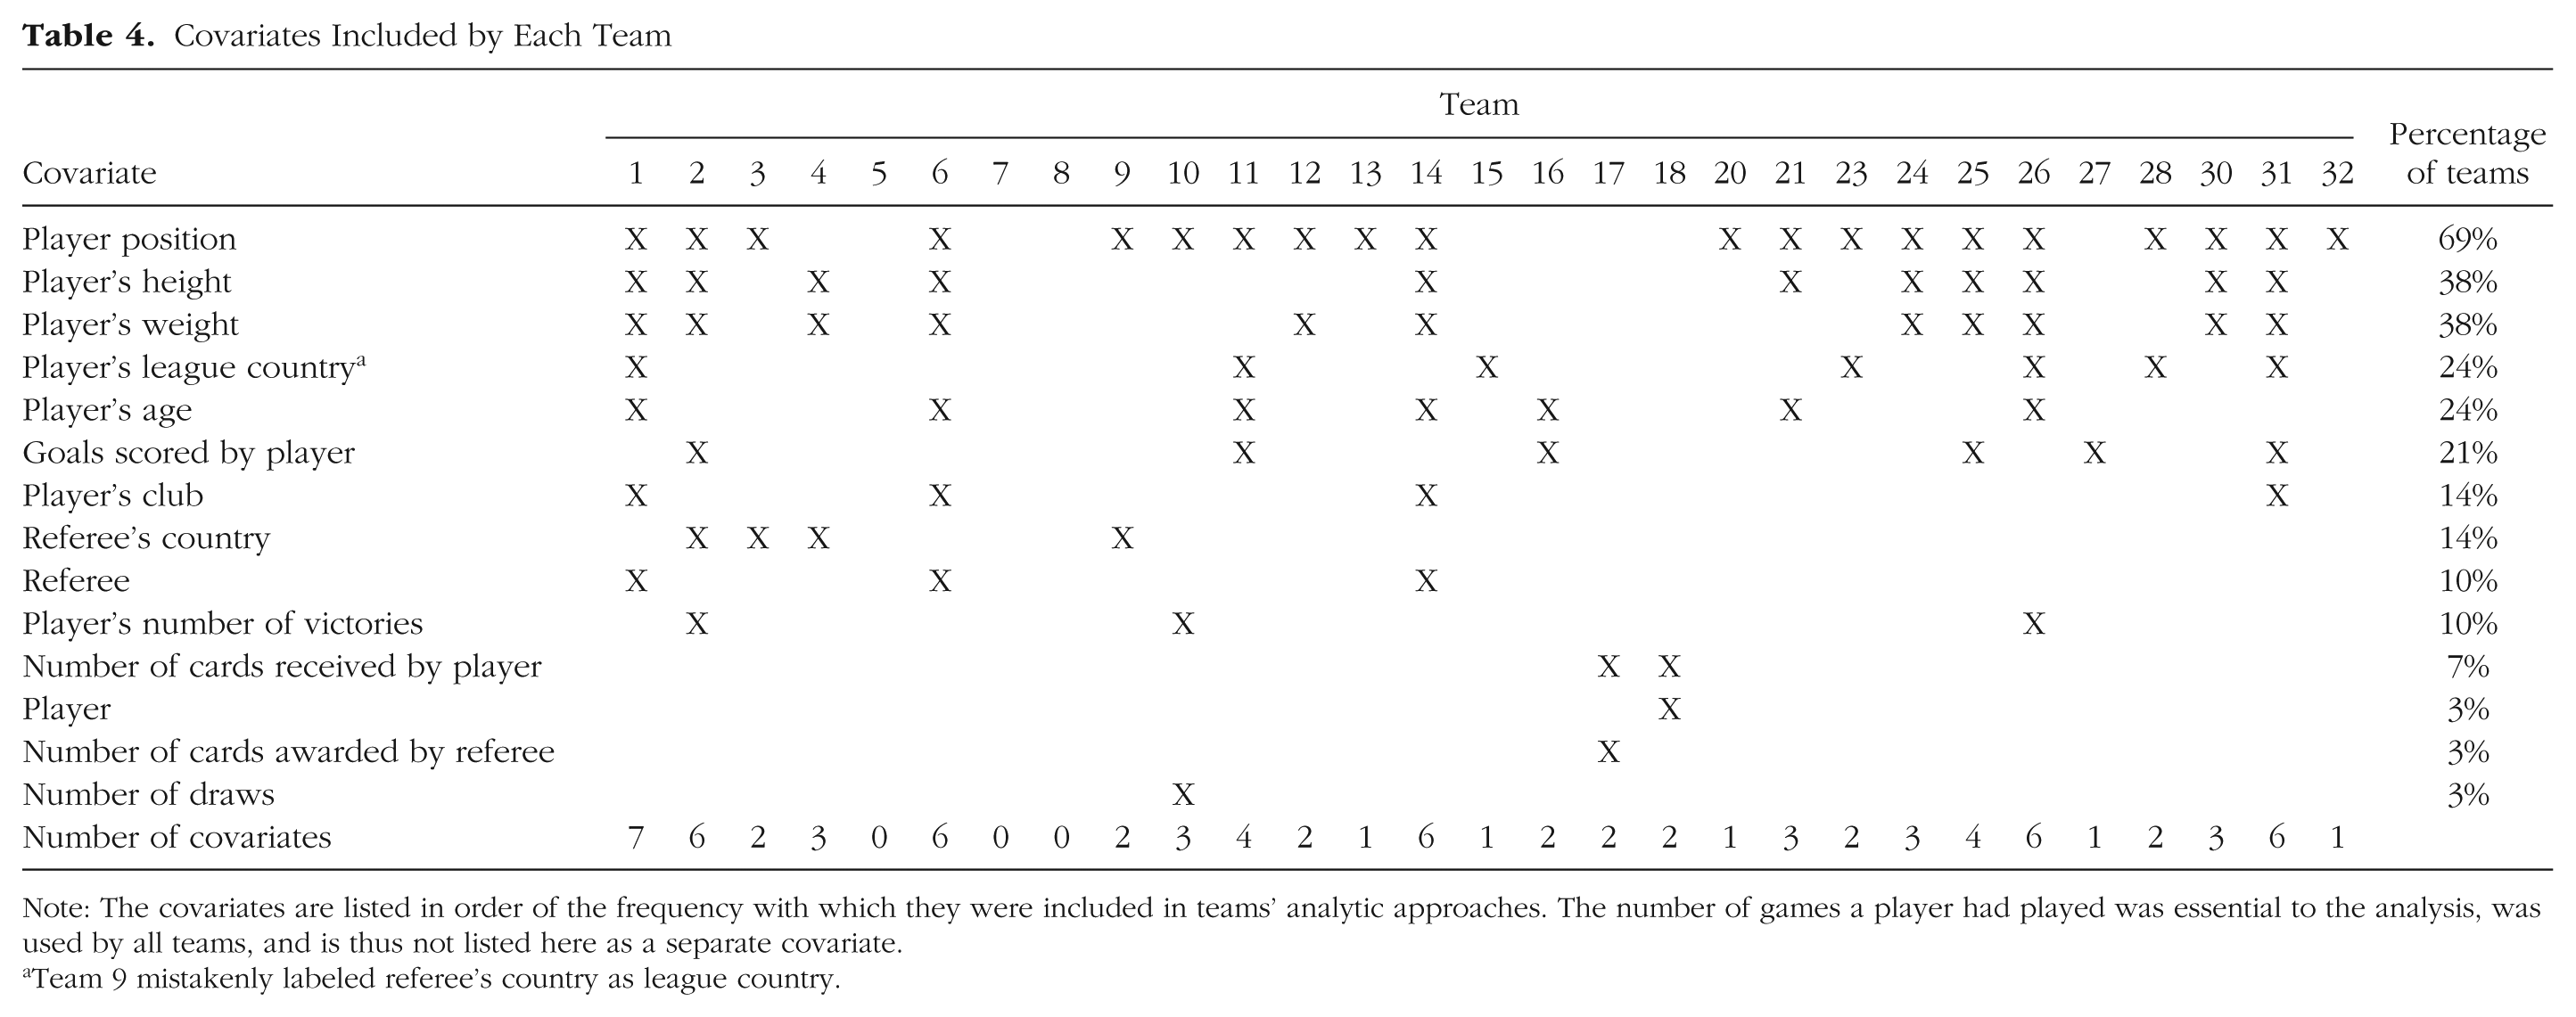
Note: The covariates are listed in order of the frequency with which they were included in teams’ analytic approaches. The number of games a player had played was essential to the analysis, was used by all teams, and is thus not listed here as a separate covariate.
Team 9 mistakenly labeled referee’s country as league country.
What were the consequences of this variability in analytic approaches?
Figure 2 shows each team’s estimated effect size, along with its 95% confidence interval (CI). As this figure and Table 3 show, the estimated effect sizes ranged from 0.89 (slightly negative) to 2.93 (moderately positive) in odds-ratio (OR) units; the median estimate was 1.31. The confidence intervals for many of the estimates overlap, which is expected because they are based on the same data. Twenty teams (69%) found a significant positive relationship, p < .05, and nine teams (31%) found a nonsignificant relationship. No team reported a significant negative relationship.
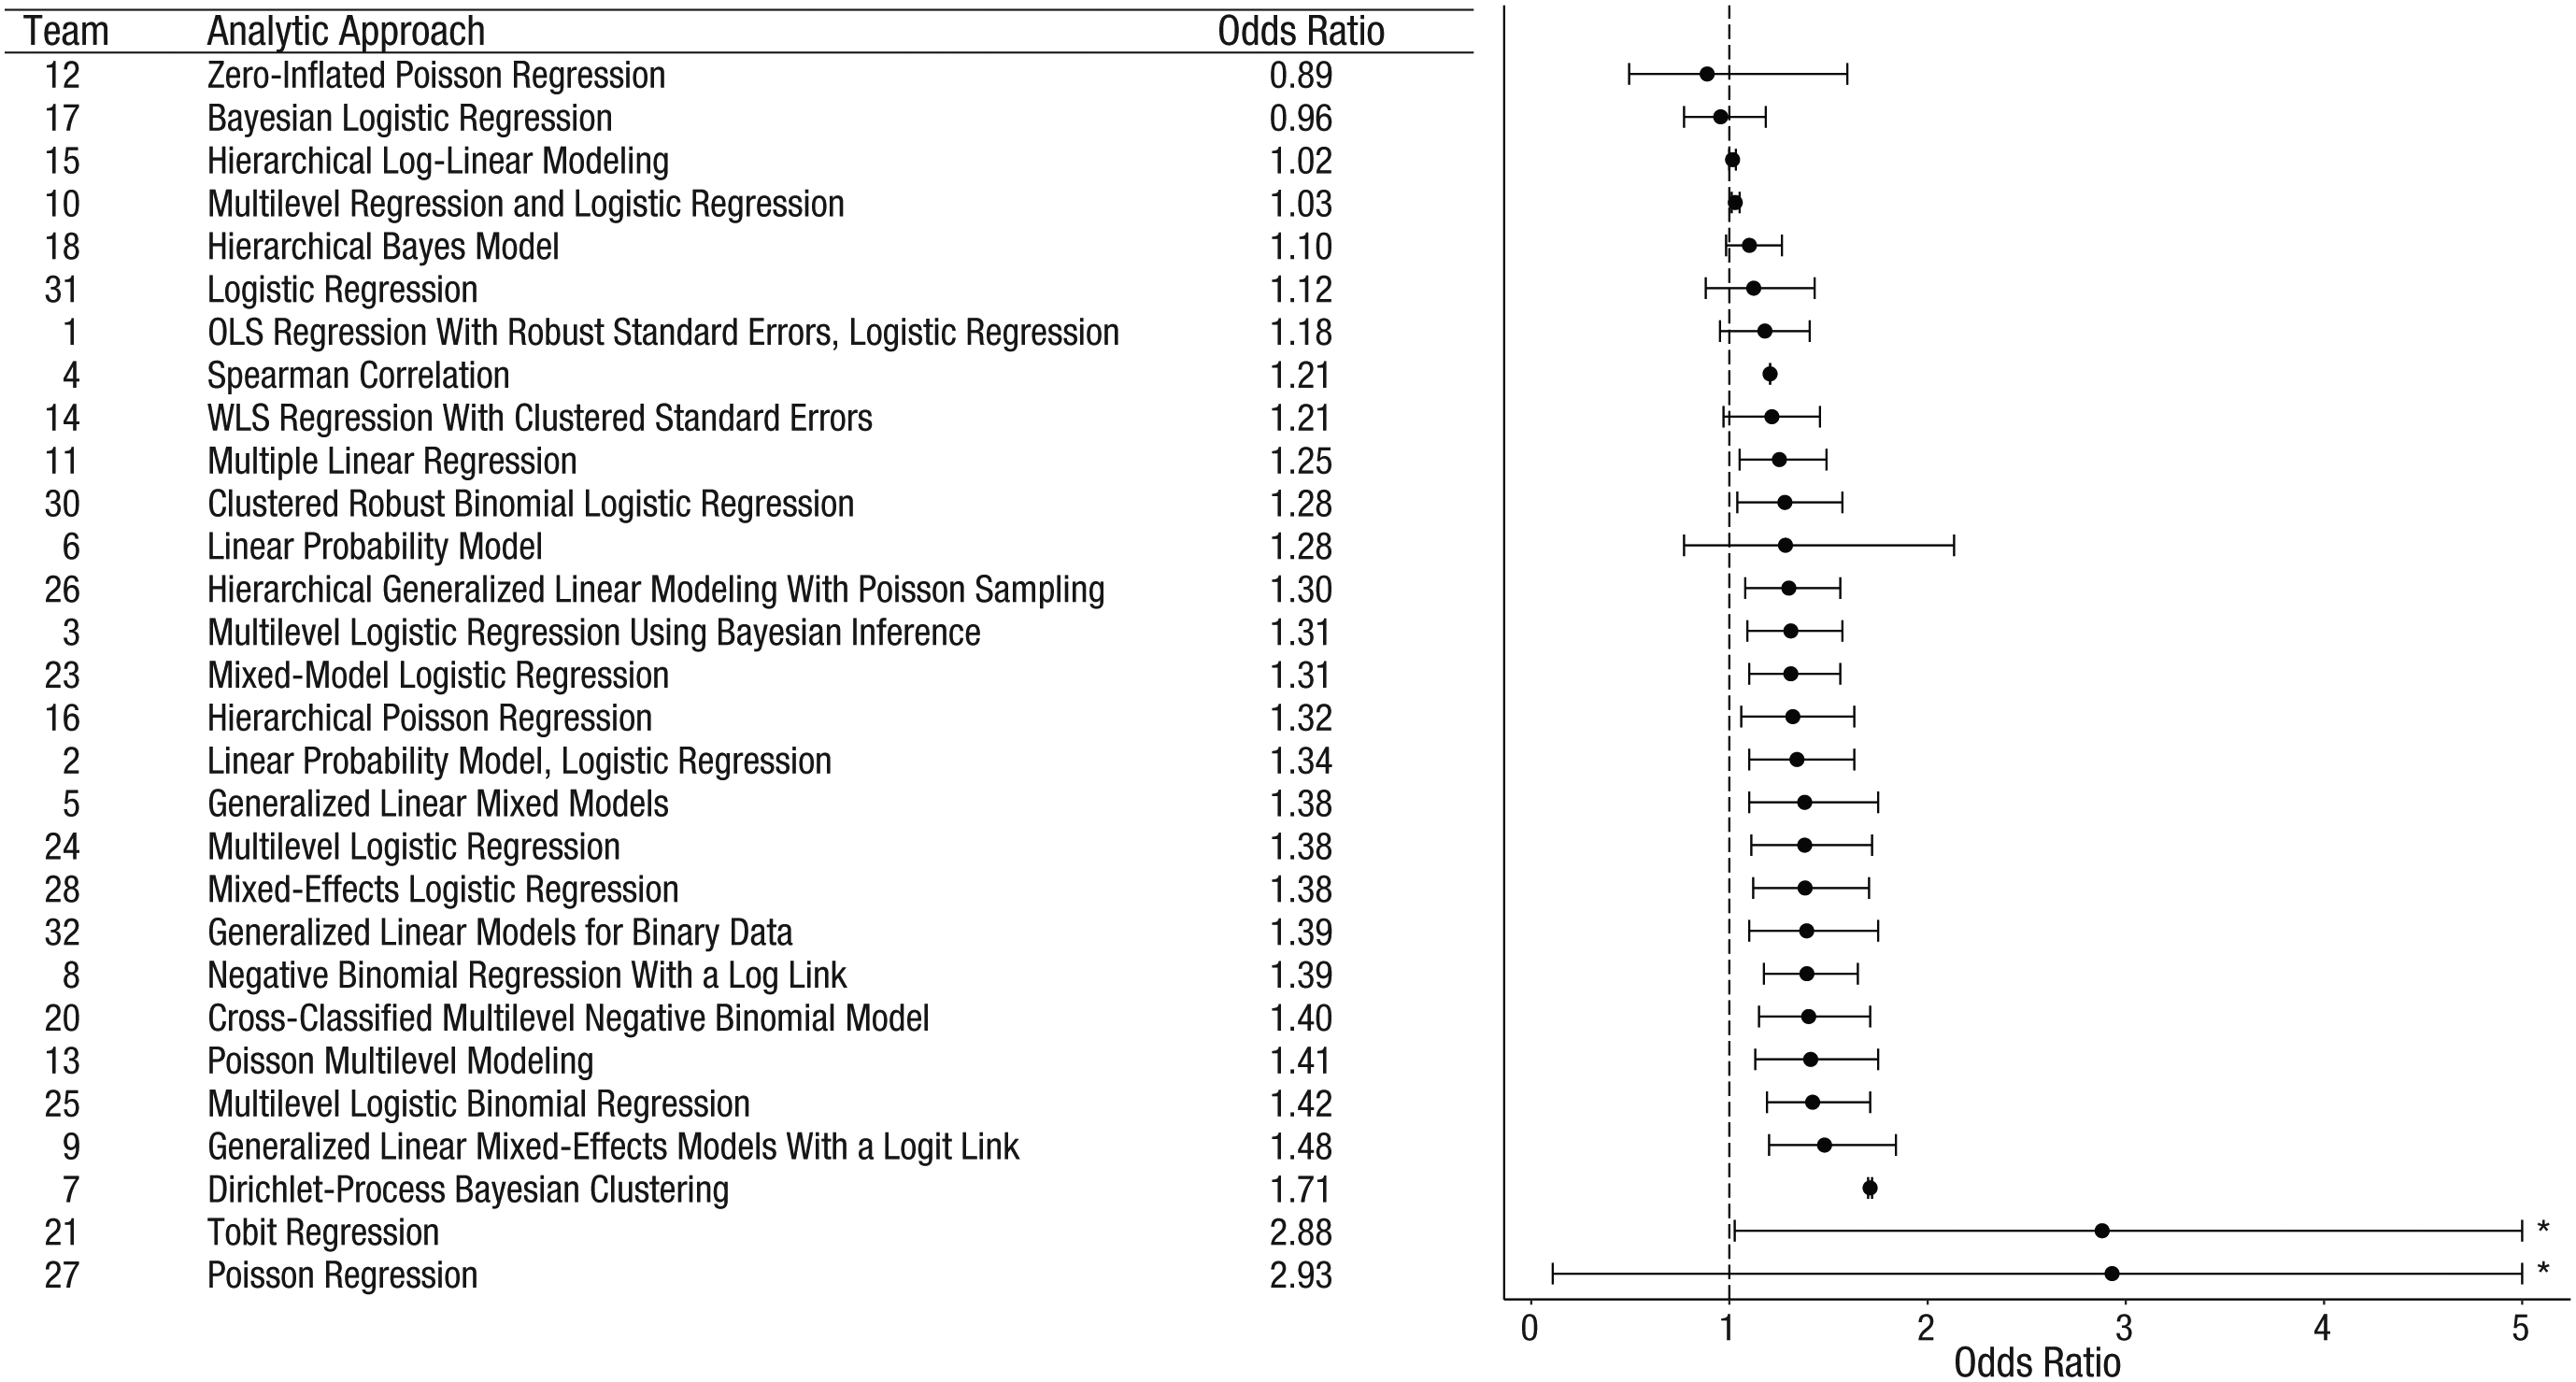
Point estimates (in order of magnitude) and 95% confidence intervals for the effect of soccer players’ skin tone on the number of red cards awarded by referees. Reported results, along with the analytic approach taken, are shown for each of the 29 analytic teams. The teams are ordered so that the smallest reported effect size is at the top and the largest is at the bottom. The asterisks indicate upper bounds that have been truncated to increase the interpretability of the plot; the actual upper bounds of the confidence intervals were 11.47 for Team 21 and 78.66 for Team 27. OLS = ordinary least squares; WLS = weighted least squares.
What were the results obtained with the different types of analytic approaches used?
Teams that employed logistic or Poisson models tended to report estimates that were larger than those of teams that used linear models (see the effect sizes in Fig. 3, in which the teams are clustered according to the distribution used for analyses). Fifteen teams used logistic models, and 11 of these teams found a significant effect (median OR = 1.34; median absolution deviation, or MAD = 0.07). Six teams used Poisson models, and 4 of these teams found a significant effect (median OR = 1.36, MAD = 0.08). Of the 6 teams that used linear models, 3 found a significant effect (median OR = 1.21, MAD = 0.05). The final 2 teams used models classified as miscellaneous, and both of these teams reported significant effects (ORs = 1.71 and 2.88, respectively).
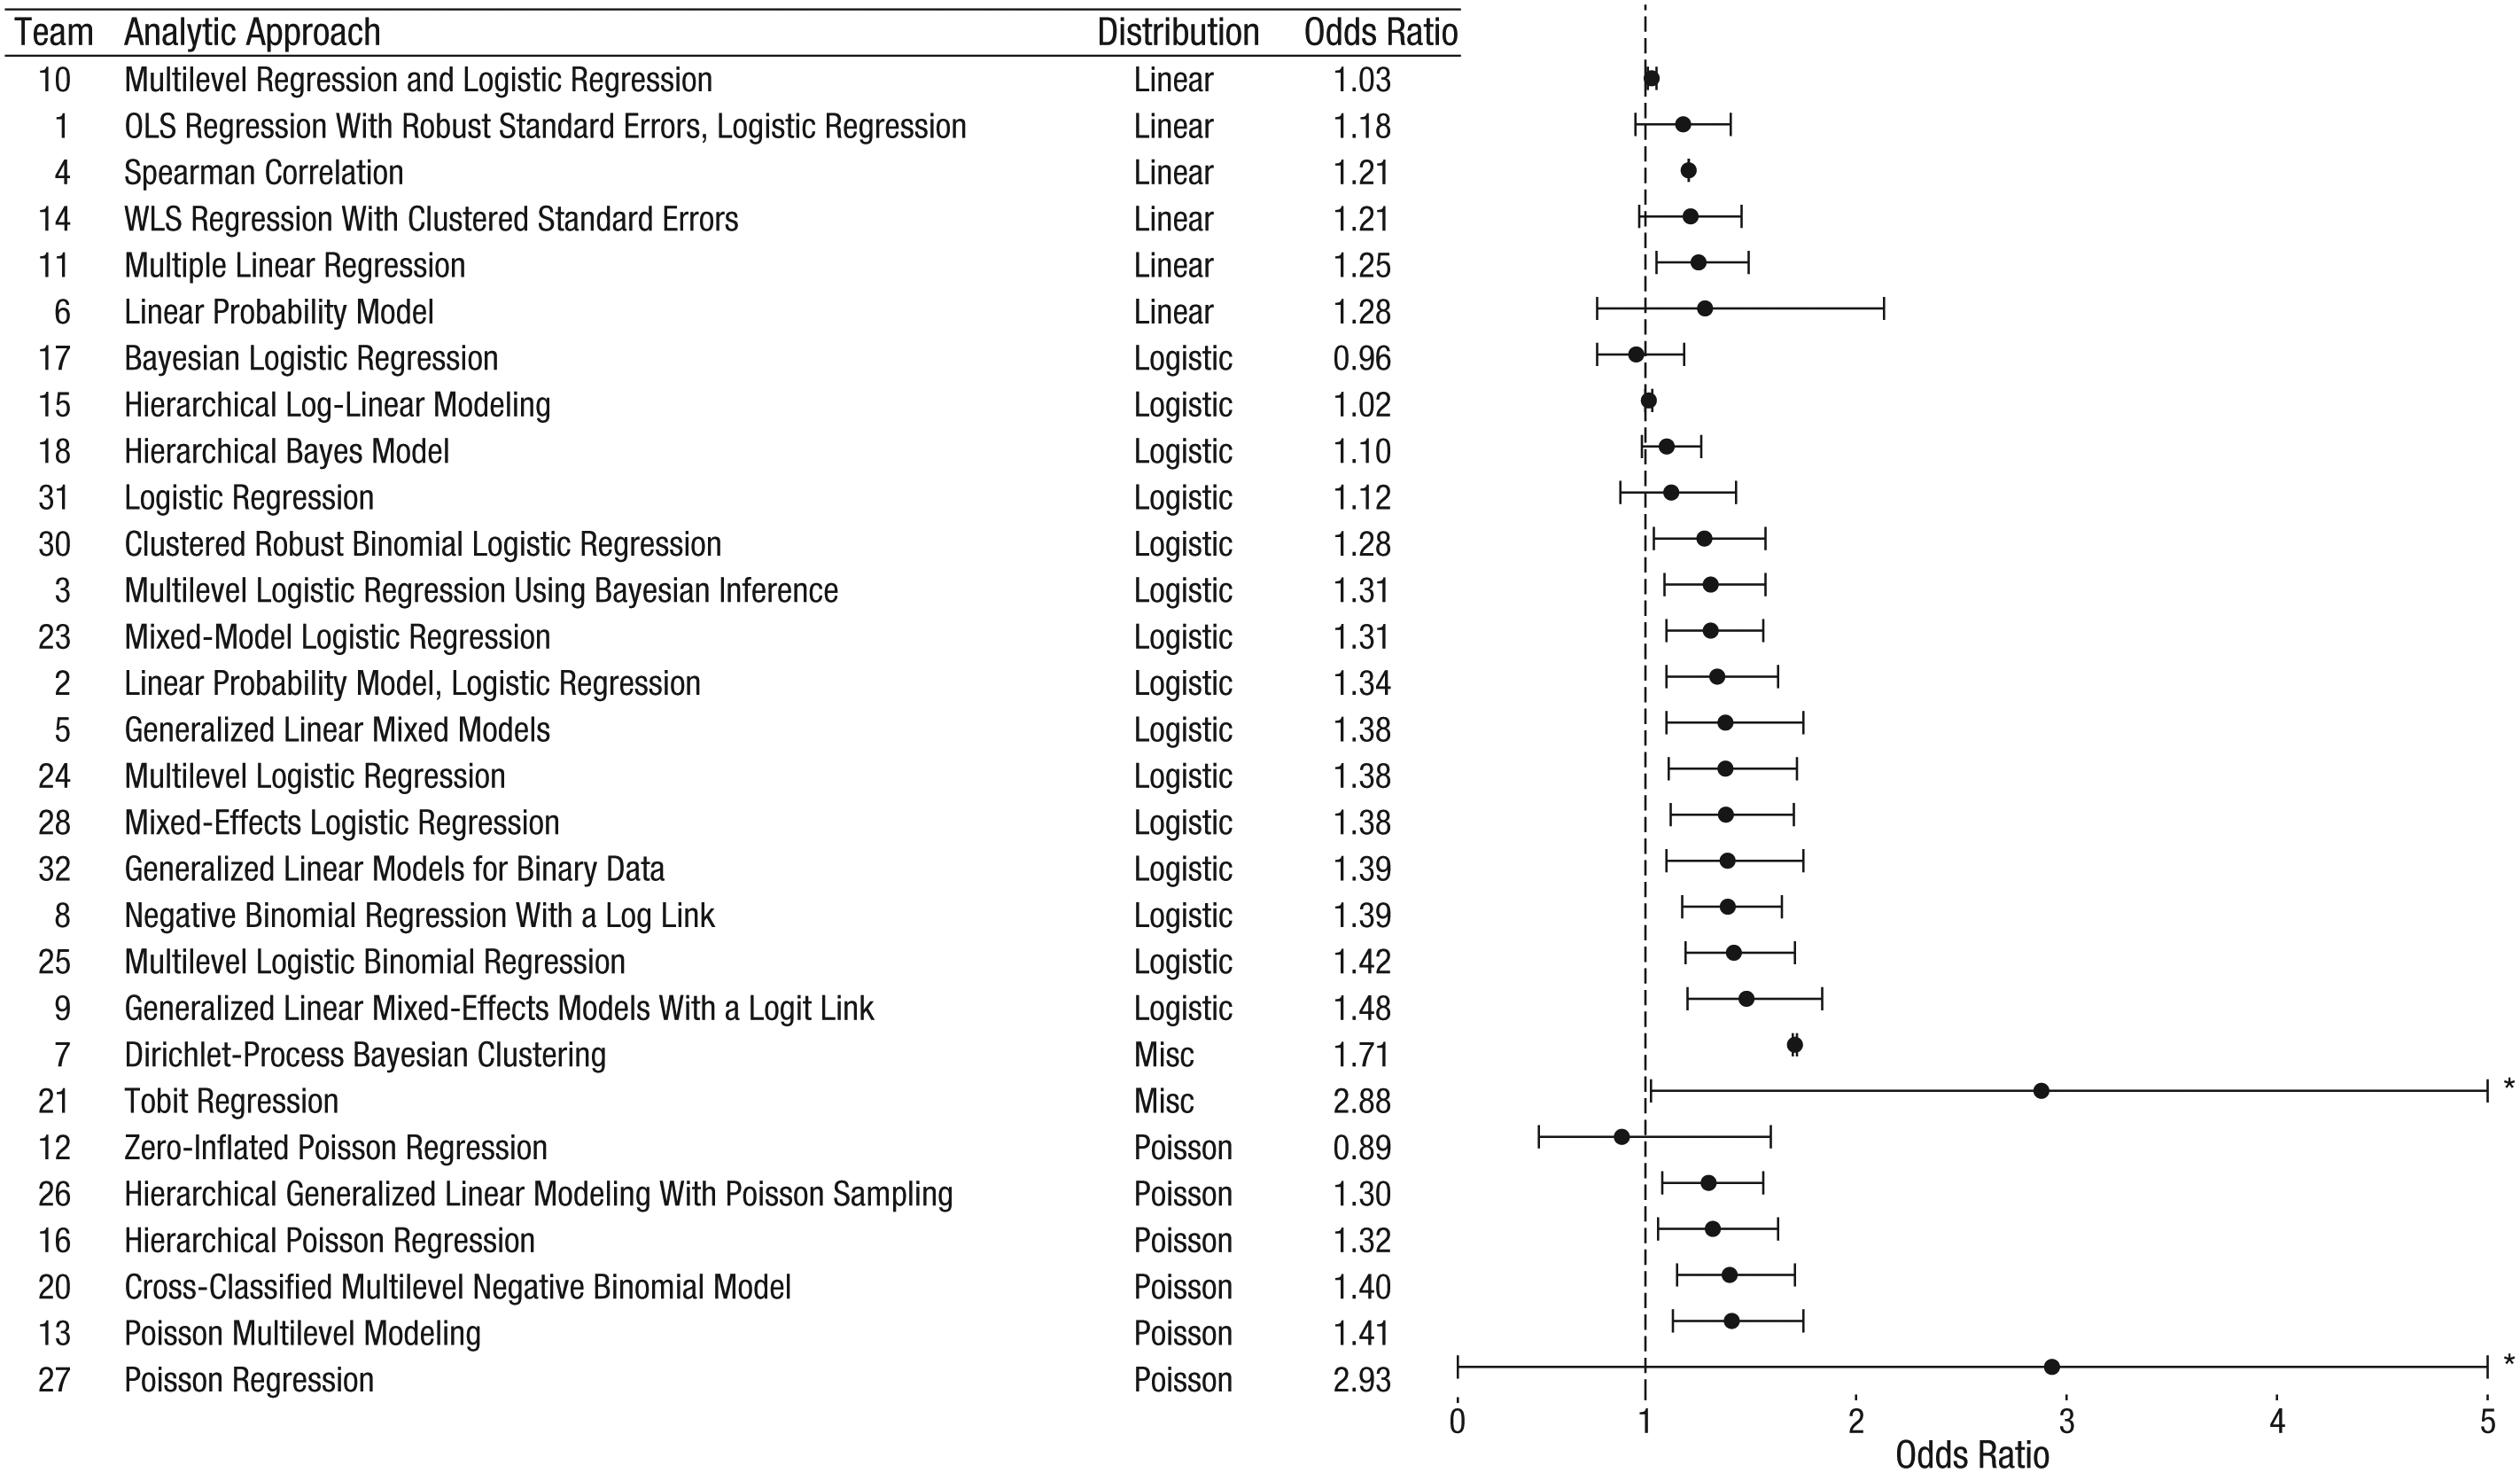
Point estimates (clustered by analytic approach) and 95% confidence intervals for the effect of soccer players’ skin tone on the number of red cards awarded by referees. Reported results, along with the analytic approach taken, are shown for each of the 29 analytic teams. The teams are clustered according to the distribution used in their analyses; within each cluster, the teams are listed in order of the magnitude of the reported effect size, from smallest at the top to largest at the bottom. The asterisks indicate upper bounds that have been truncated to increase the interpretability of the plot (see Fig. 2). OLS = ordinary least squares; WLS = weighted least squares; Misc = miscellaneous.
The teams also varied in their approaches to handling the nonindependence of players and referees, and this variability also influenced both median estimates of the effect size and the rates of significant results. In total, 15 teams estimated a fixed effect or variance component for players, referees, or both; 12 of these teams reported significant effects (median OR = 1.32, MAD = 0.12). Eight teams used clustered standard errors, and 4 of these teams found significant effects (median OR = 1.28, MAD = 0.13). An additional 5 teams did not account for this artifact, and 4 of these teams reported significant effects (median OR = 1.39, MAD = 0.28). The remaining team used fixed effects for the referee variable and reported a nonsignificant result (OR = 0.89).
Did the analysts’ beliefs regarding the hypothesis change over time?
Analysts’ subjective beliefs about the research hypothesis were assessed four times during the project: at initial registration (i.e., before they had received the data), after they had accessed the data and submitted their analytic approach, at the time final analyses were submitted, and after a group discussion of all the teams’ approaches and results. Responses were centered at 0 for analyses to increase interpretability (thus, the range was from −2, for very unlikely, to +2, for very likely). Subjective beliefs changed over time (see Fig. 4). At initial registration, there was slight agreement, on average, that the number of red cards was positively related to players’ skin tone, yet opinions varied greatly (M = 0.46, SD = 0.84). At the next assessment, the slight initial agreement had turned into slight disagreement (M = −0.61, SD = 0.88). When the teams submitted their final analyses, they again slightly agreed that there was a relationship; the magnitude of agreement was similar to what it had been initially, but again there was substantial variability (M = 0.61, SD = 1.20). Finally, after the group discussion, overall agreement increased slightly, and, notably, variability decreased (M = 0.75, SD = 0.70), which suggests some convergence in beliefs over time. The right-hand plot in Figure 4 shows the number of teams who endorsed each level of agreement at each of the four assessments. Beliefs converged over time, such that that toward the end of the project, more teams agreed that skin tone affected the number of red cards received.
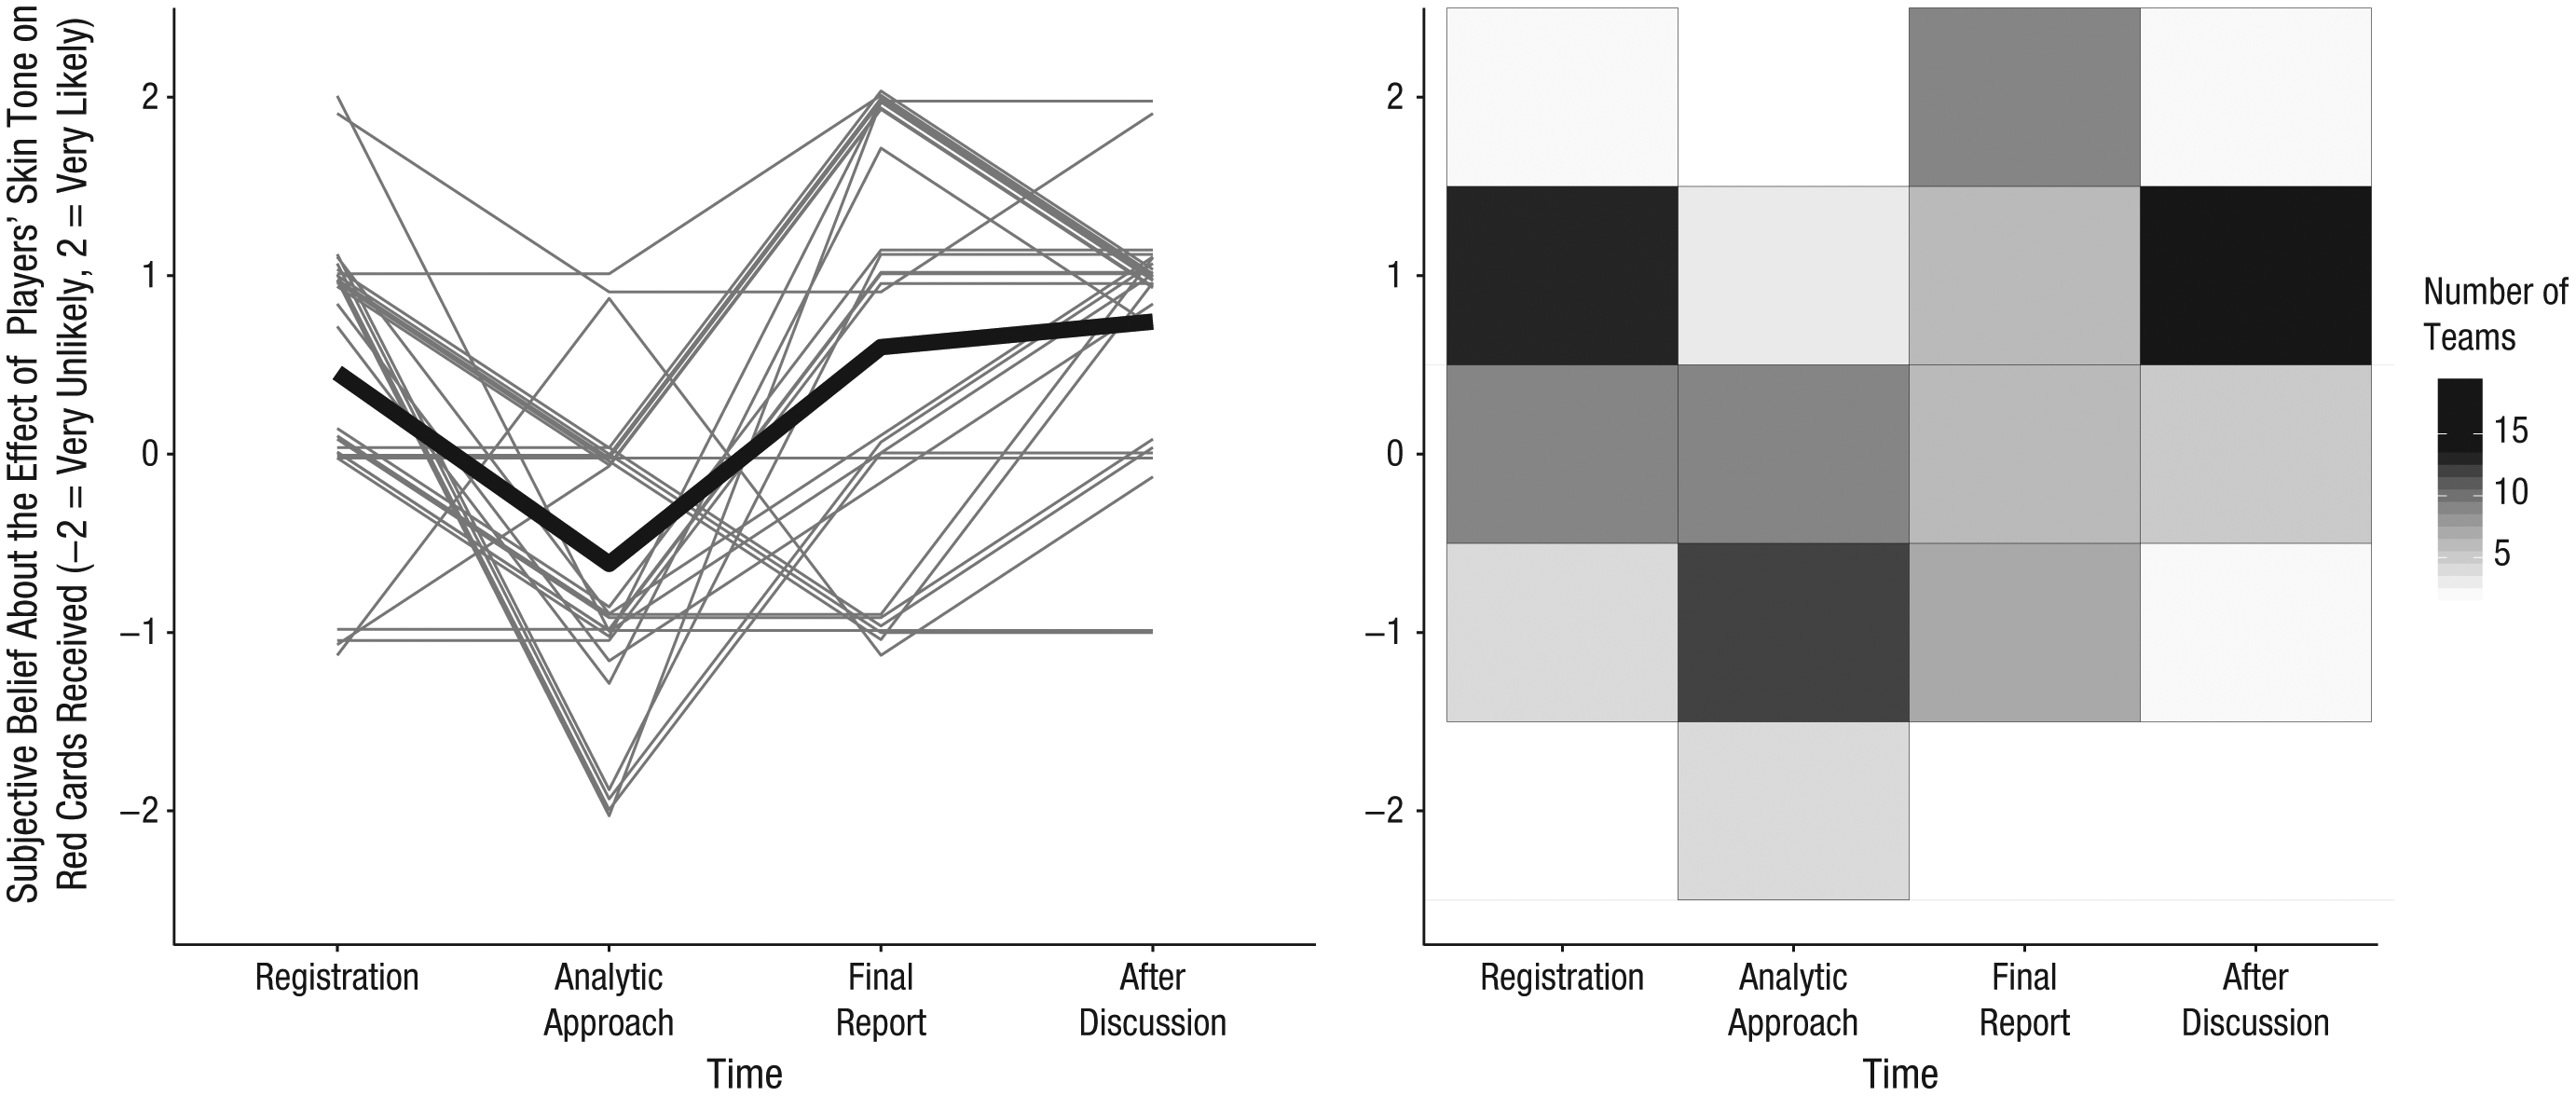
The teams’ subjective beliefs about the primary research question across time. For each of the four subjective-beliefs surveys, the plot on the left shows each team leader’s response to the question asking whether players’ skin tone predicts how many red cards they receive. The heavy black line represents the mean response at each time point. Each individual trajectory is jittered slightly to increase the interpretability of the plot. The plot on the right shows the number of team leaders who endorsed each response option at each time point.
The fourth and final survey assessed more nuanced beliefs about the primary research question. All the analysts were asked to respond individually to this survey. The new items included, for example, “The effect is positive and due to referee bias” and “There is little evidence for an effect.” The analysts responded to these items on scales ranging from 1 (strongly disagree) to 7 (strongly agree). Summary statistics for this survey are reported in Table 5. By the end of the project, a majority of the analysts agreed that the data showed a positive relationship between the number of red cards received and players’ skin tone but were unclear regarding the underlying mechanism. The level of agreement was highest (78%) for the statement “The effect is positive and the mechanism is unknown” (M = 5.32, SD = 1.47).
Analysts’ Mean Agreement With Potential Conclusions That Could Be Drawn From the Data
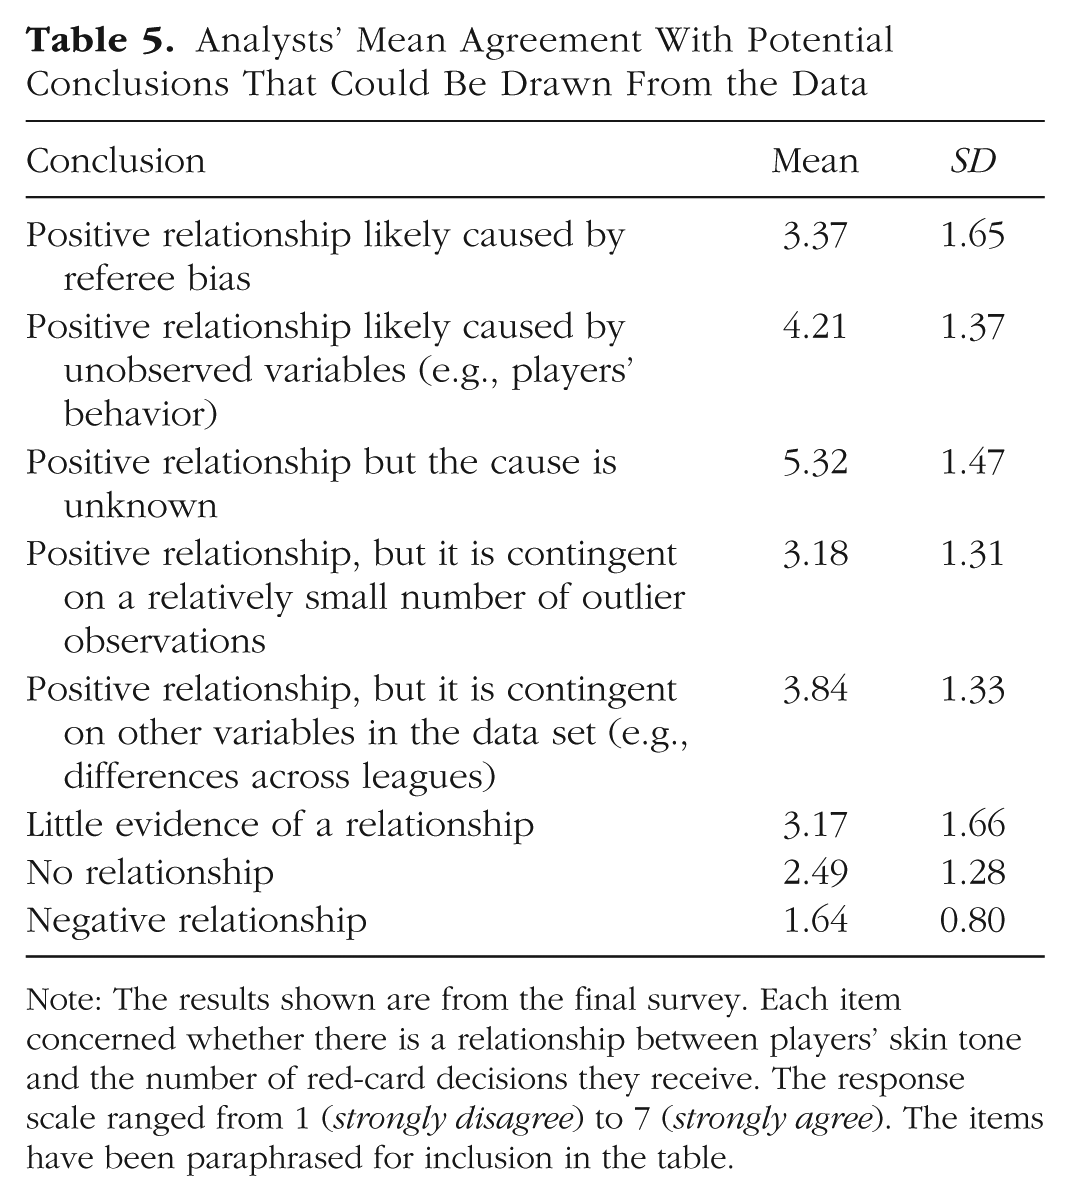
Note: The results shown are from the final survey. Each item concerned whether there is a relationship between players’ skin tone and the number of red-card decisions they receive. The response scale ranged from 1 (strongly disagree) to 7 (strongly agree). The items have been paraphrased for inclusion in the table.
What was the association between analysts’ subjective beliefs regarding the hypothesis and the results obtained?
Of particular interest was whether subjective beliefs about the truth of the primary research hypothesis were related to the results the teams obtained. One might anticipate a confirmation bias, that is, that the analysts found what they initially expected to find. Alternatively, they might have rationally updated their beliefs in response to the empirical results they obtained, even if those results contradicted their initial expectations.
The team leaders’ self-reports regarding the primary research question at each of the four assessments of beliefs were correlated with the final reported effect size, and the magnitude of this association increased across time: ρ = .14, 95% CI = [−.25, .49]; ρ = −.20, 95% CI = [−.53, .19]; ρ = .43, 95% CI = [.07, .69]; and ρ = .41, 95% CI = [.04, .68], respectively. Because both the magnitude of the estimated effect and the precision of the estimate varied by team, we also correlated the lower bound of the 95% CI and responses to this question and obtained the following correlations across the four time points: ρ = .29, 95% CI = [−.09, .60]; ρ = −.10, 95% CI = [−.46, .28]; ρ = .52, 95% CI = [.18, .75]; and ρ = .58, 95% CI = [.26, .78], respectively.
In short, the analysts’ beliefs at registration regarding whether players with darker skin tone were more likely to receive red cards were not significantly related to the final effect sizes reported, but beliefs changed considerably throughout the research project, and as a result, the analysts’ post-analysis beliefs were significantly related to both the reported effect-size estimates and the lower bounds of the 95% CIs for these estimates. These results suggest that there was some updating of beliefs based on the empirical results. Although the sample size was small (N = 29), the overall results are more consistent with rational updating of beliefs based on the evidence than with confirmation bias.
Does the analysts’ expertise explain the variability in results?
An important question is whether the variability in the analytic choices made and results found by the teams resulted from teams with the greatest statistical expertise making different choices than the other teams. A related question is whether teams whose members had more quantitative expertise showed greater convergence in their estimated effect sizes. To answer these questions, we dichotomized the teams into two groups using latent class analysis. The first group (n = 9) was more likely to have a team member who had a Ph.D. (100% vs. 53%), was a professor at a university (100% vs. 37%), had taught a graduate statistics course more than twice (100% vs. 0%), and had at least one methodological or statistical publication (78% vs. 47%). Seventy-eight percent of the teams in this first group reported effects that were statistically significant (median OR = 1.39, MAD = 0.13), whereas 68% of the teams with less expertise reported a significant effect (median OR = 1.30, MAD = 0.13). Analyses of the effects of the team’s quantitative expertise on their choice of statistical models is provided in Supplement 6. Note, however, that teams in both latent classes exhibited considerable variability in whether they found a significant effect, and the two classes had similar degrees of dispersion in their effect-size estimates. Thus, overall, statistical expertise may have had some influence on analytic approaches and estimated effect sizes, but does not explain the high variability in these choices or in the results obtained.
Do the peer ratings of overall analysis quality explain the variability in results?
We also examined whether the peer evaluations of the overall quality of each analytic approach were associated with the reported results. During the round-robin feedback phase, when the methods (but not results) for each team were known, the analysts rated their confidence in the suitability of other teams’ analytic plans. The final effect sizes reported by teams whose analytic approach received higher confidence ratings (no rating lower than 4; median OR = 1.31, MAD = 0.15) did not differ from the reported effect sizes of those teams that received lower confidence ratings (median OR = 1.28, MAD = 0.12). Thus, there was little evidence that the variability in estimated effect sizes observed across teams was attributable to a subset of analyses that were lower than the others in quality overall.
Do the peer assessments of specific statistical issues explain the variability in results?
Toward the end of the crowdsourcing process, each team’s final analytic approach was evaluated by other analysts who had particular expertise in that approach. These experts assessed the extent to which the assigned approaches addressed each of seven statistical issues and also rated their overall confidence in the approaches. On average, each approach was assessed by 2.55 experts; 16 were reviewed by 3 experts, and 13 were reviewed by 2 experts. The average rating of agreement that statistical issues had not been addressed was 2.18 (SD = 0.55) on a scale from 1 to 5 (lower numbers indicate fewer unaddressed analytic issues).
The experts tended to be more convinced by approaches in which fewer problematic issues remained, as indicated by a negative correlation between the average rating across the seven statistical issues and the experts’ rating of confidence (r = −.75, 95% CI = [−.60, −.86]). However, ratings for the analytic issues were unrelated to the OR for the relationship between darker skin tone and number of red cards received (r = .06, 95% CI = [−.35, .31]). Likewise, experts’ overall confidence in each analytic approach was unrelated to the OR for the relationship between skin tone and red cards (r = −.03, 95% CI = [−.39, .60]). Overall, analyses revealed relatively little evidence that analytic approaches with identifiable statistical problems accounted for the variability in results across teams (e.g. by producing abnormally large or small effect sizes). Supplement 14 reports exploratory analyses aimed at determining whether certain kinds of analyses exhibited more convergence across teams than others did.
Implications for the Scientific Endeavor
It is easy to understand that effects can vary across independent tests of the same research hypothesis when different sources of data are used. Variation in measures and samples, as well as random error in assessment, naturally produce variation in results. Here, we have demonstrated that as a result of researchers’ choices and assumptions during analysis, variation in estimated effect sizes can emerge even when analyses use the same data. The independent teams’ estimated effects for the primary research question ranged from 0.89 to 2.93 in OR units (1.0 indicates a null effect); no teams found a negative effect, 9 found no significant relationship, and 20 found a positive effect. If a single team, selected randomly from the present teams, had conducted the study using the same data set, there would have been a 69% probability of a positive estimated effect size and a 31% probability of a null effect.
This variability in results cannot be readily accounted for by differences in expertise. Analysts with high and lower levels of quantitative expertise both exhibited high levels of variability in their estimated effect sizes. Further, analytic approaches that received highly favorable evaluations from peers showed the same variability in final effect sizes as did analytic approaches that were less favorably rated. This was true for two different measures of quality: peer ratings of overall quality and experts’ ratings of whether specific statistical issues had been addressed.
The problem of analysis-contingent results is distinct from the problems introduced by p-hacking, the garden of forking paths, and reanalyses of original data
The main contribution of this article is in directly demonstrating the extent to which good-faith, yet subjective, analytic choices can have an impact on research results. This problem is related to, but distinct from, the problems associated with p-hacking (Simonsohn, Nelson, & Simmons, 2014), the garden of forking paths (Gelman & Loken, 2014), and reanalyses of original data used in published reports.
p-hacking
As originally defined by Simonsohn et al. (2014), p-hacking is either consciously or unconsciously exploiting researcher degrees of freedom in order to achieve statistical significance. For instance, they wrote that “researchers may file merely the subsets of analyses that produce nonsignificant results. We refer to such behavior as p-hacking” (p. 534). Thus, p-hacking is driven by the implicit or explicit goal to obtain statistically significant support for a particular conclusion. Although the specific decisions made in the process of p-hacking may be independently justifiable, it is not justifiable to choose an analytic strategy on the basis of whether it provides a desired result. Few editors would accept a manuscript, even one based on a series of prima facie defensible analytic choices, if the researchers admitted that they had made their analytic choices so as to reach the p < .05 criterion.
In the current crowdsourcing project, all the teams knew that their analyses would be shown to other analysts and made public, and the perceived need to achieve a significant result for publishability was lessened by the nature of the project. Although distinct from p-hacking, highly defensible analytic decisions made without direct incentives to achieve statistical significance can still produce wide variability in effect-size estimates. In the case of the hypothesized relationship between players’ skin tone and referees’ red-card decisions, the findings collectively suggest a positive correlation, but this can be glimpsed only through the fog of varying subjective analytic decisions.
The garden of forking paths
Gelman and Loken’s (2014) concept of a garden of forking paths focuses not on selection from among different analytic options in order to achieve significant results (as in p-hacking), but rather on testing for significance after patterns in the data have been observed. Such data-contingent analyses do capitalize heavily (perhaps unintentionally) on chance, because patterns that emerge randomly are subjected to significance tests whose validity requires a priori predictions. This practice leads to “researcher degrees of freedom without fishing, [and] consists of computing a single test based on the data, but in an environment where a different test would have been performed given different data” (Gelman & Loken, 2014, p. 460).
The analysis-contingent results we examined in the current project reveal an issue that is broader than the issue of forking paths: Variability in effect sizes can occur even when the researcher has not looked for patterns in the data first and tested for significance only after the fact. For example, the analysts were asked to test a specific relationship between players’ skin tone and referees’ red-card decisions. This arguably limited opportunities for a garden-of-forking-paths process, which might have taken the form of examining relationships between players’ various group-based characteristics (skin tone, ethnicity, per capita gross domestic product of country of origin), on the one hand, and various referee decisions (red cards, yellow cards, stoppage time, offside calls, disallowed goals), on the other, and then running formal significance tests only for the relationships that looked as if they might be meaningful.
Moreover, imagine if the 29 teams had been required to preregister their analysis plans before observing the data (Wagenmakers et al., 2012). Preregistration solves the problems of forking paths and p-hacking by removing the flexibility of data-contingent analyses and reducing the opportunity to present post hoc tests as a priori (Wagenmakers et al., 2012). However, preregistration would not have prevented the observed variability in effect-size estimates across the teams in this study. Outcomes can vary as a result of different, defensible analytic decisions whether they are made post hoc or a priori.
Reanalyzing data used in published reports
Mak-ing data from published reports more accessible to facilitate reanalyses and postpublication peer review (Hunter, 2012; Simonsohn, 2013; Wicherts et al., 2006) is important for science, but also does not make fully transparent the contingency of observed findings on analytic decisions. For example, few scientists would bother to write (and even fewer editors would publish) a commentary presenting new analyses and results unless they suggest a conclusion different from the one in the original publication. This creates perverse incentives for both original authors and commenters. Original authors have strong incentives to find positive results so that their work will be published, and commenters have strong incentives to find different (usually negative) results for the same reason. Thus, published commentaries will almost inevitably differ from original articles in their analytic approaches and conclusions, which introduces a strong selection bias.
In contrast, when data analysis is crowdsourced prior to publication, any individual analysis will not play a major role in the final publication decision, and the approach is collaborative rather than conflict oriented. The most obvious incentive may be to avoid making a public error analyzing an open data set. Thus, crowdsourcing data analysis may reduce dysfunctional incentives for both original authors and commenters, build connections between colleagues, and make transparent all approaches used and all results obtained. Crowdsourcing analysis can result in a much more accurate picture of the robustness of results and the dependency of the findings on subjective analytic choices.
Conclusions
In sum, our crowd of analysts had no incentive to try different specifications and choose one that supported the hypothesis (p-hacking), to first examine the data and test for significant patterns only after the fact (the garden of forking paths), or to confirm or disconfirm a finding to achieve publication. Even so, the variability in analytic choices led to variability in observed results. This illustrates the breadth of the challenge posed by the fact that analytic choices can influence observed outcomes.
How much variability in results is too much?
Scientists can have comparatively more faith in a finding when there is less variability in analytic approaches taken to investigating the targeted phenomenon and in results obtained using different methods. In a follow-up to this project, Crowdsourcing Data Analysis 2, a group of more than 40 analysts have independently analyzed a complex data set to test hypotheses regarding the effects of gender and status on intellectual debates. This new crowd of analysts are reporting radically dispersed effect sizes, and in some cases significant effects in opposite directions for the same hypothesis tested with the same data. In such extreme cases of little to no convergence in results, the crowdsourcing process suggests that the scientific community should have no faith that the hypothesis is true, even if one or two teams find significant support with a defensible analysis—results that might have been publishable on their own. In the present project on referees’ decisions, the degree of convergence in results was relatively high by comparison, as more than two thirds of the teams found support for the hypothesis and the vast majority of teams obtained effect-size estimates in the predicted direction.
There will almost always be variability in a measured effect depending on analytic choices. As transparency about this variability increases with data-posting requirements and additional crowdsourced projects, scientists and policymakers will need to make ultimately subjective decisions about how much consistency is enough (and not enough) to conclude an effect most likely exists. Similar subjective and continually debated decisions have had to be made about the cutoff for statistical significance (Benjamin et al., 2017; Johnson, 2013). Setting cutoffs may be particularly challenging for policymakers because it is their responsibility to make decisions, and the ideal information on which to base a decision would include both whether an effect exists and how large it is. For example, some economic interventions might have both societally positive and societally negative effects, and policymakers will want to have precise estimates of all these effects to evaluate the trade-offs. Policymakers and practitioners may require greater convergence in effect-size estimates than scientists, for whom establishing a directional effect is often sufficient for building theory. We believe that crowdsourcing data-analysis initiatives will help policymakers by improving estimation of confidence and uncertainty. Crowdsourced analysis, combined with preregistered investigations and replications, will provide more informed benchmarks regarding the contingency of observed findings on characteristics of the sample and setting, procedures followed, and analytic decisions.
Generalizability to other data sets
The results of the present crowdsourced initiative are striking because the research question, concerning the relationship between players’ skin tone and referees’ red-card decisions, was clear and, ostensibly, straightforward to investigate. Compared with many research questions in neuroscience, economics, biology, and psychology, this one is of relatively modest complexity. And yet the process of translating this question from natural language to statistical models gave rise to many different assumptions and choices that influenced the conclusions. This raises the possibility that hidden uncertainty due to the wide range of analytic choices available to researchers exists across a wide variety of research applications.
Of course, more than one such investigation is needed to determine how contingent research results are on analytic decisions more generally. This demonstration is thus limited to being a case example; its conclusions are plausible, but have untested generalizability. For example, the project coordinators framed a specific research question for the analysts (Does players’ skin tone correlate with referees’ red-card decisions?), which may have artificially reduced the variability in estimated effect sizes. The research question could have been posed more broadly (Is there evidence of bias against minority groups in referees’ decisions?), or the key outcome measure (e.g., number of yellow cards, number of red cards, stoppage time) could have been left up to each research team. This research question is being examined in Crowdsourcing Data Analysis 2, on the roles of gender and status in intellectual debates. In this follow-up project, analysts are also choosing how to operationalize each construct (e.g., is academic status best measured by citation counts, job rank, school rank, or some combination of these?). As noted earlier, the variability in effect-size estimates is even greater in this second project than in the present initiative. Systematic investigation via crowdsourcing will facilitate more general conclusions about how contingent research results are on analytic choices, and what characteristics of the research question, data set, and analyses serve as moderating variables.
There are also constraints on the useful application of crowdsourcing strategies. For example, the flexibility in analytic choices and thus their impact on estimated effect sizes is likely to be greatest when data sets are complex (e.g., longitudinal data sets with missing data, many potential covariates, levels of nesting). It remains an empirical question how contingent results are on analytic choices in the case of comparatively simple experimental studies with two to four conditions and few measured variables. There may still be enough choice points (outlier exclusions and statistical transformations, such as in the case of skewed data), even when researchers analyze a relatively simple data set, to introduce considerable variability in results based on those choices (Steegen, Tuerlinckx, Gelman, & Vanpaemel, 2016).
Notably, the robustness of experimental laboratory effects can also be assessed via replications repeating the same experimental design with new research participants (Ebersole et al., 2016; Klein et al., 2014). Crowdsourcing data analysis is particularly relevant for data sets that have many analytic choice points and that cannot easily be independently replicated with new observations. Crowdsourcing may also add a great deal of value when controversial research questions are being addressed or when there are many competing theoretical predictions to be adjudicated empirically.
Recommendations for individual researchers and teams
Because of practical constraints, most future scientific investigations will not involve crowds of researchers. For a lone analyst working without the benefit of a crowd, we recommend use of a specification curve (Simonsohn, Simmons, & Nelson, 2016) or multiverse analysis (Steegen et al., 2016). With these approaches, the analyst in effect tries to come up with every different defensible analysis he or she can, runs them all, and then computes the likelihood that the number of observed significant results would be seen if there really is no effect (Simonsohn et al., 2016).
Crowdsourcing the analysis of data has greatly reduced efficiency compared with attempting many specifications as an individual. However, when feasible, a crowdsourced approach adds value in a number of ways. A globally distributed crowdsourced project will leverage skills, perspectives, and approaches to data analysis that no single analyst or research team can realistically muster alone. In addition, a crowd of analysts has no perverse incentive to conduct a primary analysis or robustness check that produces statistically significant support for the research hypothesis. In contrast, a traditional research team seeking to publish in a top academic journal has a strong perverse incentive to select both a primary analysis and robustness checks that return publishable results, something that is relatively easy to do given the numerous possible specifications typically available to choose from. Further, crowdsourcing data analysis allows for different research teams to discuss and debate analytic concerns with a richness and depth not typically seen in the academic review process, in which reviewers and editors rarely have access to the data themselves, and often choose to focus on aspects of a manuscript other than the analytic approach chosen.
Conclusion
The observed results from analyzing a complex data set can be highly contingent on justifiable, but subjective, analytic decisions. Uncertainty in interpreting research results is therefore not just a function of statistical power or the use of questionable research practices; it is also a function of the many reasonable decisions that researchers must make in order to conduct the research. This does not mean that analyzing data and drawing research conclusions is a subjective enterprise with no connection to reality. It does mean that many subjective decisions are part of the research process and can affect the outcomes. The best defense against subjectivity in science is to expose it. Transparency in data, methods, and process gives the rest of the community opportunity to see the decisions, question them, offer alternatives, and test these alternatives in further research.
Supplemental Material
SilberzahnOpenPracticesDisclosure – Supplemental material for Many Analysts, One Data Set: Making Transparent How Variations in Analytic Choices Affect Results
Supplemental material, SilberzahnOpenPracticesDisclosure for Many Analysts, One Data Set: Making Transparent How Variations in Analytic Choices Affect Results by R. Silberzahn, E. L. Uhlmann, D. P. Martin, P. Anselmi, F. Aust, E. Awtrey, Š. Bahník, F. Bai, C. Bannard, E. Bonnier, R. Carlsson, F. Cheung, G. Christensen, R. Clay, M. A. Craig, A. Dalla Rosa, L. Dam, M. H. Evans, I. Flores Cervantes, N. Fong, M. Gamez-Djokic, A. Glenz, S. Gordon-McKeon, T. J. Heaton, K. Hederos, M. Heene, A. J. Hofelich Mohr, F. Högden, K. Hui, M. Johannesson, J. Kalodimos, E. Kaszubowski, D. M. Kennedy, R. Lei, T. A. Lindsay, S. Liverani, C. R. Madan, D. Molden, E. Molleman, R. D. Morey, L. B. Mulder, B. R. Nijstad, N. G. Pope, B. Pope, J. M. Prenoveau, F. Rink, E. Robusto, H. Roderique, A. Sandberg, E. Schlüter, F. D. Schönbrodt, M. F. Sherman, S. A. Sommer, K. Sotak, S. Spain, C. Spörlein, T. Stafford, L. Stefanutti, S. Tauber, J. Ullrich, M. Vianello, E.-J. Wagenmakers, M. Witkowiak, S. Yoon and B. A. Nosek in Advances in Methods and Practices in Psychological Science
Supplemental Material
SilberzahnSupplementalMaterial – Supplemental material for Many Analysts, One Data Set: Making Transparent How Variations in Analytic Choices Affect Results
Supplemental material, SilberzahnSupplementalMaterial for Many Analysts, One Data Set: Making Transparent How Variations in Analytic Choices Affect Results by R. Silberzahn, E. L. Uhlmann, D. P. Martin, P. Anselmi, F. Aust, E. Awtrey, Š. Bahník, F. Bai, C. Bannard, E. Bonnier, R. Carlsson, F. Cheung, G. Christensen, R. Clay, M. A. Craig, A. Dalla Rosa, L. Dam, M. H. Evans, I. Flores Cervantes, N. Fong, M. Gamez-Djokic, A. Glenz, S. Gordon-McKeon, T. J. Heaton, K. Hederos, M. Heene, A. J. Hofelich Mohr, F. Högden, K. Hui, M. Johannesson, J. Kalodimos, E. Kaszubowski, D. M. Kennedy, R. Lei, T. A. Lindsay, S. Liverani, C. R. Madan, D. Molden, E. Molleman, R. D. Morey, L. B. Mulder, B. R. Nijstad, N. G. Pope, B. Pope, J. M. Prenoveau, F. Rink, E. Robusto, H. Roderique, A. Sandberg, E. Schlüter, F. D. Schönbrodt, M. F. Sherman, S. A. Sommer, K. Sotak, S. Spain, C. Spörlein, T. Stafford, L. Stefanutti, S. Tauber, J. Ullrich, M. Vianello, E.-J. Wagenmakers, M. Witkowiak, S. Yoon and B. A. Nosek in Advances in Methods and Practices in Psychological Science
Footnotes
Action Editor
Daniel J. Simons served as action editor for this article.
Author Contributions
The first and second authors contributed equally to the project. E. L. Uhlmann proposed the idea of crowdsourcing data analysis and wrote the initial project outline. R. Silberzahn, E. L. Uhlmann, D. P. Martin, and B. A. Nosek developed the research protocol. R. Silberzahn and E. L. Uhlmann developed the specific research question regarding the influence of skin tone on referees’ decisions. R. Silberzahn and D. P. Martin collected the data on referees’ decisions and skin tone and prepared the data set for analysis. R. Silberzahn and D. P. Martin coordinated the different stages of the crowdsourcing process. All the other authors worked in teams to analyze the data, give feedback, and produce individual reports. A detailed list of contributions from each team is provided in Supplement 8 of the Supplemental Material. R. Silberzahn and D. P. Martin combined and analyzed the results of the different teams. E. L. Uhlmann outlined the manuscript and wrote the first draft of the abstract, introduction, and discussion of the implications of the findings. R. Silberzahn wrote the first draft of the description of the methods and the Supplemental Materials. R. Silberzahn and D. P. Martin wrote the first draft of the section reporting the main findings. D. P. Martin and R. Silberzahn created the figures and tables. B. A. Nosek heavily revised the manuscript, gave critical comments, and provided overall project supervision. All the authors reviewed the manuscript, and many provided crucial comments and edits that were incorporated.
Declaration of Conflicting Interests
The author(s) declared that there were no conflicts of interest with respect to the authorship or the publication of this article.
Funding
D. P. Martin was supported by the Institute of Education Sciences, U.S. Department of Education (Grant No. R305B090002). The contribution of R. D. Morey and E.-J. Wagenmakers was supported by a grant from the European Research Council (Grant No. 283876). M. Johannesson received funding from the Jan Wallander and Tom Hedelius Foundation (Grant No. P2015-0001:1), as well as from the Swedish Foundation for Humanities and Social Sciences (Grant No. NHS14-1719:1). S. Liverani was supported by a Leverhulme Trust Early Career Fellowship (Grant No. ECF-2011-576). C. R. Madan was supported by a Canadian Graduate Scholarship, Doctoral-level, from the Natural Sciences and Engineering Research Council of Canada (Grant No. CGSD2-426287-2012). T. Stafford was supported by a Leverhulme Trust Research Project Grant (Grant No. RPG2013-326).
Open Practices
All data and materials have been made publicly available via the Open Science Framework and can be accessed at https://osf.io/47tnc/ and https://osf.io/gvm2z/. The complete Open Practices Disclosure for this article can be found at http://journals.sagepub.com/doi/suppl/10.1177/2515245917747646. This article has received badges for Open Data and Open Materials. More information about the Open Practices badges can be found at ![]() .
.
Notes
References
Supplementary Material
Please find the following supplemental material available below.
For Open Access articles published under a Creative Commons License, all supplemental material carries the same license as the article it is associated with.
For non-Open Access articles published, all supplemental material carries a non-exclusive license, and permission requests for re-use of supplemental material or any part of supplemental material shall be sent directly to the copyright owner as specified in the copyright notice associated with the article.