
Abstract
Stroke has become an absolute emergency that is treated by additional endovascular means or by replacing pharmacological options. Modern neuroradiological techniques such as computed tomography (CT) allow us to examine multiple parameters of the diseased brain. These focused on the parenchyma and hemodynamics for pretherapeutic decisions. However, it has become evident that the clot is the current target for interventional measures. Clot length is established as a marker for recanalization. The dense artery sign is known as an acute CT sign of stroke that is readily visible on acute nonenhanced CT. The rationale behind our study was to study if clot density might represent clot vulnerability or resistance to treatment. We conducted a prospective study of all consecutive stroke patients admitted to our hospital over 1 year, who presented with signs of acute middle cerebral artery stroke within the therapeutic window, and who underwent either intravenous or combined intravenous and intra-arterial thrombolysis. All patients were evaluated with a complete stroke CT protocol, transcranial color-coded duplex sonography monitoring, and clinical evaluation with the National Institutes of Health Stroke Scale (NIHSS) score. We measured clot length using planimetry on unenhanced CT and measured Hounsfield units in the clots on the same images. A total of 31 patients were included in the study (19 men, 12 women, aged 35–90 years). We found that patients with a longer clot on the unenhanced CT had a higher NIHSS score, confirming previous literature. However, we found that patients with a lower clot density recanalized to a more marked degree and had a better clinical outcome. Patients who did not recanalize had a higher clot density (49 Hounsfield units) than those who did recanalize (23 Hounsfield units). Overall, measuring the clot seems to be an important additional parameter to be taken into account. In our study, CT clot density seems to correlate with clinical outcome and recanalization. The higher density seems to represent a higher red blood cell content. This is evidence that clot composition could play a much more important role in acute stroke than thought until now and characterizing it with imaging may help in choosing the adequate treatment modality. Higher density seems to reflect erythrocyte content. Therefore, patients with a longer and denser clot may necessitate direct thrombectomy.
Introduction
Since the introduction of thrombolysis and thrombectomy, acute stroke has become a treatable emergency. Thus, over the last few years, we have seen a strong change in paradigm from intravenous pharmacological treatment to more direct mechanical approaches to the clot. While clinical symptoms are the first indication of an acute event, neuroimaging plays an increasingly important role in diagnosis. In almost all studies, whether based on computed tomography (CT) or magnetic resnance imaging (MRI), 1 –3 there has been an emphasis on the one hand on tissue integrity and viability and on angiography but not on the occluding clot itself. Thus, most studies of the efficacy of any treatment modality in acute stroke patients simply rely on the absence of bleeding in order to initiate treatment, 4 which, given the possibilities currently available and the treatment proposed, is clearly insufficient. Evidence has been growing that on the one hand thrombectomy is more and more indicated, even in some cases directly and not just as an additional supplement to pharmacological therapy 5 but also that depending on the type of occlusion, therapy, and outcome may differ. Depending on its origin, the thrombus may have a different composition 6 and thus have a different reaction to the type of treatment chosen. Therefore, it has become probable that the type of thrombus may affect the type of treatment due to its composition of blood cells, fibrin, or other debris. Therefore, harder and longer clots may benefit less from pharmacological therapy but very often this is only noted when treatment has begun. As has been recently shown, most cerebral emboli are fresh and thus will represent the source of the embolus and thus be visualized differently. Based on imaging techniques, it has become increasingly possible to visualize the occlusion site with angio-CT. This however shows the end of the open vascular lumen and not the occluding clot itself. Using either CT or MR, it has been possible to observe the clot directly or indirectly. The dense artery sign being the visible clot on unenhaced CT has been known for decades 7 –10 to be a predictor of stroke 11 and recent evidence points to it as being reversible. 11– 15 Recent studies have already shown that clot length is well established as a predictor of recanalization. 16,17 It would therefore be important 18 to to characterize the type of occlusion and clot prior to treatment. Indeed, it may be possible that clots composed more of fibrin may respond better to thrombolysis and clots composed of blood cells more to mechanical interventions; it may also mean that even when patients arrive ultra-early, if the clot is more “red” (i.e. Contaning more red blood cells) it may be necessary to go directly for an intervention, In this study, we observe the relationship between clot density and length and potential recanalization.
Materials and methods
Design
This is a prospective study of consecutive patients admitted to our hospital over a 1-year period, with signs and symptoms of acute middle cerebral artery stroke. The diagnosis of acute stroke was established on the basis of the clinical status and CT findings. Only patients who fulfilled the criteria of (1) acute stroke (<3 h within onset of symptoms) of the middle cerebral artery (MCA) territory, (2) complete stroke CT protocol, (3) transcranial color-coded duplex (TCCD) sonography monitoring, (4) intravenous therapy, (5) follow-up CT and/or MRI, (6) 3 months modified Rankin Scale evaluation were included. The aim of our study was to evaluate the value of CT measurements of the clot. On the one hand, the length of the thrombus was measured longitudinally in its longest axis. Then, Hounsfield unit measurements were performed in the affected vessel in selecting patients who would benefit from thrombolysis.
Clinical assessment
Informed consent was obtained for each patient and the protocol was approved by the local ethics committee (Protocol: 08-049R (NAC 08-012)). Thirty-one patients met the inclusion criteria (age range 35–90 years; 20 males and 11 females) and were admitted to our hospital within 3 h of onset of symptoms. The neurological impairment on admission was evaluated using the National Institutes of Health Stroke Scale (NIHSS) score by a neurologist in the local stroke center, who was specialized in the evaluation of patients with acute ischemia.
Imaging protocol
The stroke CT included successively a nonenhanced, perfusion, angiography and delayed images on a 16-Section Multidetector CT Scanner (Mx 8000 IDT Family; Philips Medical Systems [Philips Healthcare, Best, the Netherlands]). Contrast injections were performed using Accupaque 300 injected though 18-G canula placed in an antecubital vein. The non enhanced CT (NECT) was performed using the following parameters: 140 kV, 250 mAs, slice thickness 3 mm, slice acquisition interval 3 mm, starting at the occiput to the vertex. The CTA covered a scanning range extending from the aortic arch to the vertex with 100 ml of contrast media injection at a rate of 4 ml/s with a threshold of 150 HU placed over the aortic arch. The parameters were as follows: 120 kV, 250 mAs, slice thickness 1.5 mm, slice acquisition interval 0.7 mm, and pitch 2.5. Finally a 2-minute delayed cerebral CT with the same acquisition parameters as the NECT was obtained.
TCCD sonography
All patients were monitored by an experienced neurologist using transcranial color-coded duplex sonography on a Acuson Sequoia equipment (2–3.7 MHz). Thrombolysis in brain ischemia (TIBI) grades were assessed prior to and at the end of thrombolysis to diagnose residual middle cerebral arterial flow. Recanalization was considered complete in case of normalized or elevated values of peak systolic flow velocity, partial when the signal improved by at least 1 TIBI grade, and persistent occlusion was considered in the other cases.
Thrombolysis protocol
All patients underwent intravenous (tissue plasminogen activator, 0.9 mg/kg, 90 mg maximum, 10% of total dose as a bolus over 1 min, then 90% at 1-h perfusion rate) or combined intravenous and intra-arterial thrombolysis. After 30 min of intravenous thrombolysis, either the total dose was continued intravenously, in case of partial or complete recanalization evaluated by TCCD, or intra-arterial thrombolysis was initiated with the remaining dose of tPA in case of persistent occlusion
Image analysis
The initial CT images were reviewed by an experienced neuroradiologist blinded to any clinical information, except for diagnosis of stroke, follow-up imaging, and clinical outcome on an OsiriX workstation. On the NECT, the usual early stage features of acute ischemia were evaluated, such as the hyperdense vessel sign, the insular ribbon sign, and the obscuration of the lentiform nucleus. In addition, the side of the acute ischemia was recorded. Hemorrhagic complications as well as the extent of the final infarct, using the same classification system as on the initial CT, were identified on the follow-up imaging. CT attenuation values were measured in the clot by planimetry using a region of interest (ROI). The clot length was measured based on the angio-CT with OsiriX also. Recanalazation was measured by the TIBI score on the Doppler.
We performed statistical analysis using a Mann U test (Wilcoxon), with analysis for a correlation between clot density and recanalization (change in TIBI) and between clot length and recanalization.
Results
A total of 31 patients were included (19 men, 12 women, aged 35–90 years of age).
Clot density
Patients with an NIHSS score of 7 (n = 21) and higher had a higher mean clot density (Figure 1) (mean: 34 Hounsfield units) than those who had a lower NIHSS score (n = 10) (Figure 2) (mean: 25 Hounsfield units) (Figure 3).
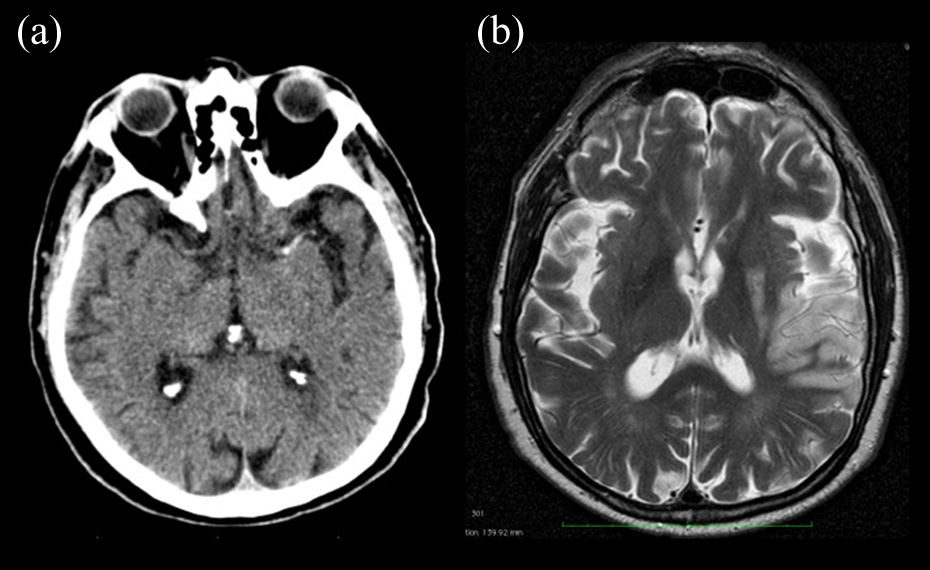
A 68-year-old male, with symptoms since 120 min, NIH score of 24 with TIBI of 2 before and 2 after thrombolysis. CT scan in this patient showed a high density clot of the MCA (65 Hounsfield units) (a). This patient would not reperfuse after thrombolysis. CT: computed tomography; NIH: National Institutes of Health; MCA: middle cerebral artery; TIBI: Thrombolysis in brain ischemia.
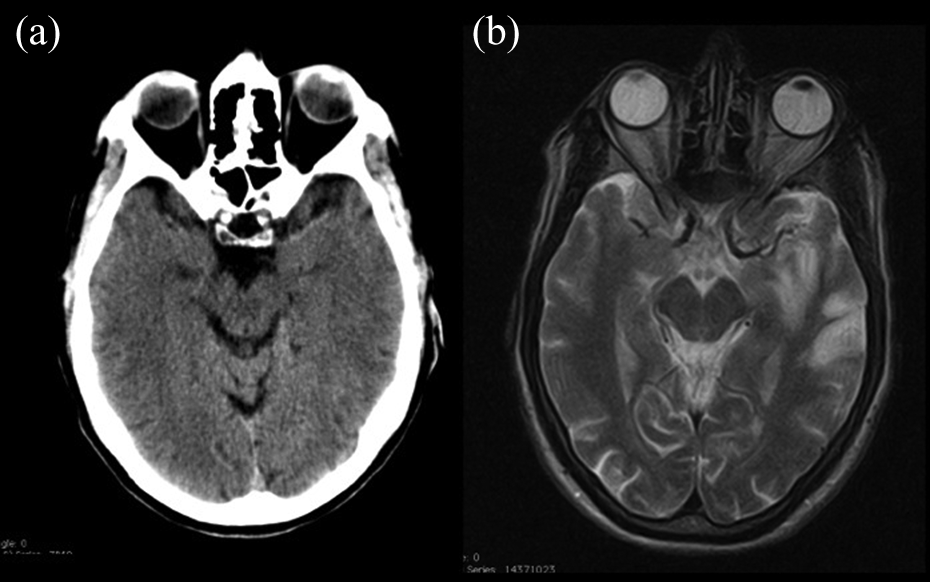
A 63-year-old male, arriving within 1 min after onset of symptoms. This patient had a lower density clot in the MCA (37 Hounsfield units) (A). This patient would reperfuse after thrombolysis. Initial NIH at 12. TIBI of 2before and of 3 after thrombolysis. NIH: National Institutes of Health; MCA: middle cerebral artery; TIBI: Thrombolysis in brain ischemia.

Box plot figure showing the correlation between higher clot density and lower recanalization rates.
Patients who had an improvement in NIH score (more than 4 points) had lower densities (mean: 27 Hounsfield units) than those who did not improve (no NIH change) (mean: 46 Hounsfield units).
Patients who did not recanalize (n = 10) had a higher density (mean: 49 Hounsfield units) than those who did recanalize (n = 21) (mean: 23 Hounsfield units).
Clot length
Patients with a longer clot had a higher NIHSS score (box plot Figure 4). Patients who had an improvement in NIHSS score had a statistically nonsignificant difference in clot length (mean length: 10 mm) compared to those who did not improve (mean length: 11 mm).
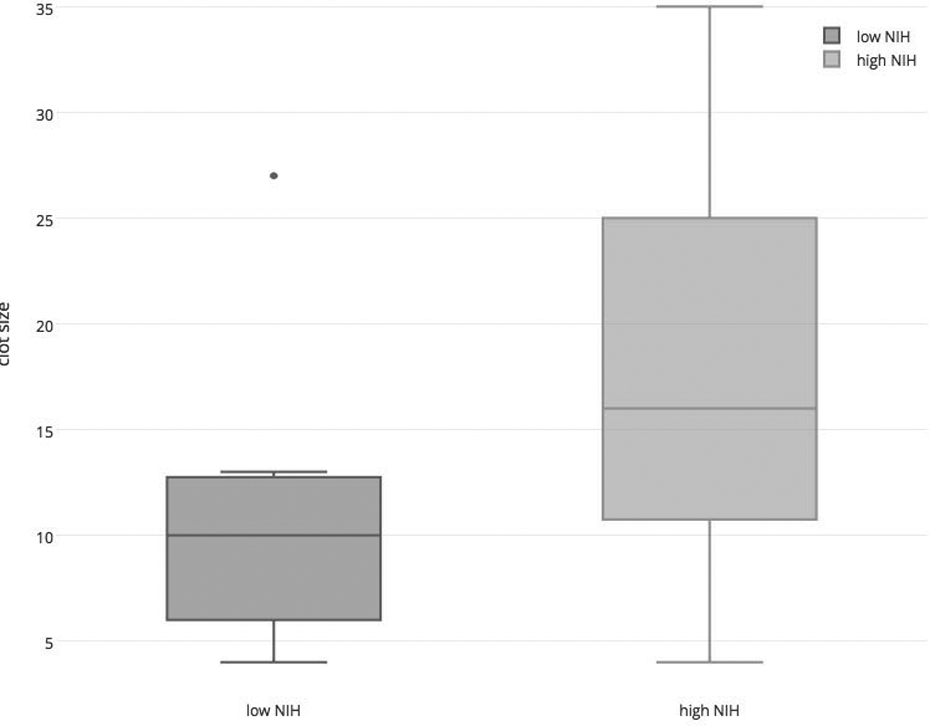
Box plot figure showing the correlation between longer clots and higher NIH Stroke Scale scores. NIH: National Institutes of Health.
Patients who did not recanalize (n = 10) (no change in TIBI) had a longer mean clot length (mean length: 17 mm) compared to those who did recanalize (n = 21) (mean length: 8 mm).
We saw a clear correlation between clot length and clot density since there is a correlation between between shorter clots and recanalization (p = 0.0889) and less dense clots and recanalization (p = 0.0034). These correlations were also positive after performing a Bonferroni correction.
Discussion
In this study, we found that clot density seems to predict anatomic recanalization and improvement in clinical outcome. Indeed, patients with a lower clot density have a better vascular recanalization rate as well as an improved clinical outcome. This may be due to the fact that those less dense clots have less red blood cells, less calcification and debris, and more fibrin and may thus be more amenable to fibrinolytic therapy, even in combination with later thrombectomy. The literature seems to demonstrate that most acute clots are fresh with a higher percentage of “red” clots 19,20,21 ; these red clots will tend to have specific radiological signatures both on CT and MRI; on MRI we have the so-called susceptibility vessel sign (SVS) and on CT the dense artery sign we investigate here; the SVS 22,23 is already known to be related to clots with a higher concentration of erythrocytes and to predict a better response to thrombectomy. 24 While other pharmacological therapies would be preferable, at the moment only rTPA has shown itself to be of efficacy 22 and the translation of promising neuroprotective drugs into clinical practice still has to take place. 25,26 However, more dense clots may be more resistant to the currently available pharmacological therapies due to this high red blood cell composition. This may be of prime importance since recent trials point to a clear superiority of thrombectomy in selected cases. 7,8,19 In agreement with previous literature we also found that clot length is associated with a higher NIHSS 1 : We know already that these longer clots may necessitate endovascular therapy from the start since the longer the clot, the lesser the pharmacological penetration. Another important finding is that clot density seems to be associated with an impact on outcome and revascularization. Additionally, based on unenhanced CT alone we are able to detect vessel occlusion characteristics that may help us to direct treatment. This is of extreme importance now that we have effectively entered the era of not just thrombolysis but of thrombectomy after many years of evolution since the initial clinical interventions. 27 Indeed, we know from experience that not all thrombectomy devices have been equally successful and that they have had to be adapted to be able to extract the clot optimally. 28 By adjusting the stentriever to the length and the hardness of the clot, we will be able to extract it more easily and safely. This should not just have an increased clinical effect but also an economic one since the stents will give better outcomes the more they are adapted to the patient’s situation. The effects are multiple: longer clots may need extraction as well as more hyperdense clots. Indeed, it is believed that the hyperdensity observed in the clots is at least due to the presence of more red blood cells compared to less hyperdense clots that may be more fibrin laden. Thus, the more dense clots again may be more easily treatable with stentrievers, 29 as was seen in cases with SVS. Also, more dense clots seem in our series to be associated with a more severe acute deficit, which may also point to a more aggressive therapy in these cases to their composition. This points to a more important role of imaging than previously believed in the diagnosis of acute ischemia. Traditionally, imaging even in the large trials has not gone much beyond simple exclusion of hemorrhage or even demonstration of large areas of ischemia, for the decision to include patients or not. This clearly has to change now. Indeed, the tools that we now have at our disposal have been demonstrated to function well in the setting of acute stroke and can be adapted to the given situation. While the concomitant use of perfusion imaging and even some kind of collateral imaging is undisputed, 3 it is also very obvious that we need to image the pathology that is to be treated: the vessel and the clot that occludes it. 30 –34
Footnotes
Declaration of conflicting interests
The author(s) declared no potential conflicts of interest with respect to the research, authorship, and/or publication of this article.
Funding
The author(s) disclosed receipt of the following financial support for the research, authorship, and/or publication of this article: Study supported by a grant from the Swiss National Science foundation (SNF): SNF 320000-121565.