
Abstract
Background:
The purpose of this study was to assess how well manual and visual assessment of foot type agree with radiographic assessment. We hypothesized that quantitative measures would have better interrater reliability than qualitative measures, and that visual assessment of foot type would be strongly correlated with radiographic assessment.
Methods:
Bilateral foot photographs, radiographs, and physical examination were acquired on 92 participants to assess Radiographic Arch Type, calcaneal pitch, Meary angle, Arch Index, Photo Arch Type, Radiographic Foot Posture, Foot Posture Index, and Photo Foot Posture by 5 reviewers. Correlations between measures, interrater reliability, and sensitivity/specificity were assessed using calcaneal pitch as the reference standard.
Results:
Interrater reliability of the photographic and radiographic measures were moderate to good (intraclass correlation coefficient 0.52-0.83). However, agreement between methods was poor, with significant variability in classification (kappa < 0.40). Overall, Radiographic Arch Type had the greatest sensitivity and specificity for identifying planus, normal, and cavus feet. Among nonradiographic parameters, photographs had the greatest sensitivity and specificity for identifying normal feet, the greatest sensitivity for identifying planus feet, and the greatest specificity for identifying cavus feet.
Conclusion:
Agreement between methods varied widely, suggesting that classification is dependent on methodology and cutoff values selected to discriminate among foot types. Specifically, nonradiographic methods failed to consistently classify foot type compared with calcaneal pitch and Meary angle.
Level of Evidence:
Level II, prospective cohort study.
Introduction
Foot pain is a common problem, with one large population-based study reporting a prevalence of 17.4% in the community, 1 and foot morphology is known to be a contributor to foot and ankle disorders.2-4 Patients with pes planus may be at greater risk of acute ankle or knee injury,2,4 or may be at increased risk for progressive collapsing foot deformity in comparison to a neutral foot alignment; however, this is also multifactorial.2,4,5 Patients with pes cavus may be at higher risk of fifth metatarsal stress fracture 6 and typically have varus hindfoot alignment, which may predispose them to lateral ankle instability 3 and peroneal tendon tears. 7 Additionally, variations in the longitudinal arch and hindfoot alignment have been associated with multiple pathologic conditions in other anatomic locations, including intermittent low back pain, 8 spinal degenerative disk disease, 9 and anterior knee pain. 8 Thus, evaluation of foot morphology is a key component of clinical assessment.
However, reliable classification of foot type has remained elusive. Foot type has been assessed both radiographically10-13 and nonradiographically.14-17 Patient’s feet can be characterized radiographically using calcaneal pitch, 18 Meary angle,11-13 talar head uncoverage, 13 and many other methods. 10 Nonradiographic foot type measures can be further separated into more manual or visual inspection, such as Foot Posture Index 17 and quantifiable measures such as Arch Index 16 and Tripod Index. 19 A recent systematic review assessed nonradiographic methods of foot type classification and noted that despite generally good reliability and validity, significant variability in measurement systems and heterogeneity of reliability assessment methods limited the authors ability to compare foot type evaluation methods. 15
With the interest in foot type and its potential implications on injury risk, researchers and clinicians should be aware of the reliability of common foot typing methods, the agreement between methods, and the sensitivity/specificity of nonradiographic methods. Therefore, the purpose of this study was to assess the agreement between radiographic, manual, and visual measures of foot typing and assess their ability to accurately characterize foot type. We hypothesized that the quantitative measures would have better interrater reliability compared with qualitative measures, and that visual and manual assessment of foot type and posture would have a strong correlation with radiographic assessment.
Materials and Methods
This is a secondary analysis of data collected to examine the effect of age and foot type on regional foot loading during gait. 20 Thus, our sample was composed of 2 distinct age groups based on our previously evaluated population. Ninety-two participants provided informed consent before participating in this IRB-approved study (Institutional Review Board Protocol STUDY19110080). Inclusion criteria were (1) age between 20 and 35 or 55 and 70 years; (2) foot size between US women’s 5.5 and US men’s 14.5; (3) BMI between 18 and 30; and (4) the ability to walk a half-mile without stopping. Participants were excluded if they met any of the following criteria: (1) pregnant females, (2) prior history of severe musculoskeletal injury or lower extremity disorder, (3) prior history of foot/ankle surgery or chronic foot-related pathology, or (4) serious medical comorbidities.
Data Collection
Each participant received weightbearing lateral and hindfoot alignment view radiographs of their feet. Additionally, weightbearing photographs were taken of the medial arch, lateral foot border, and hindfoot bilaterally. Finally, a manual examination of each foot was conducted to determine Foot Posture Index (FPI) as previously described. 17
Five orthopaedic surgery residents (PGY-2 through PGY-5) assessed radiographs and photographs using a customized MatLab application (MathWorks) that randomized the order of images for evaluation. Each resident was blinded from patient information as well as each other’s scores. Hindfoot alignment radiographs were used to assess Radiographic Foot Posture as varus, valgus, or neutral, and Radiographic Arch Type as cavus, planus, or neutral (Figure 1) by qualitative visual assessment of radiographs. Calcaneal pitch and Meary angle were measured on lateral radiographs. Calcaneal pitch was measured by identifying the most inferior portion of the calcaneocuboid joint, the most inferior aspect of the calcaneal tuberosity and then any point along the horizontal plane. Meary angle was measured as the angle between a line drawn from the most posterior point of the talar dome to the center of the talonavicular joint and a line drawn from the center of the first metatarsophalangeal joint to the center of the first tarsometatarsal joint (Figure 2). Photographs were used to visually assess photographic arch type and photographic foot posture (Figure 3). Arch Index (AI) was measured automatically on lightbox images of the plantar surface of the feet while aligning the foot to the second metatarsal head (Figure 3) as reported previously. 16

Radiographic assessments of arch type and foot posture. (A) Radiographic arch type (XAT) was assessed qualitatively on lateral radiograph. A planus arch is demonstrated in this image. (B) Radiographic foot posture (XFP) was assessed qualitatively on hindfoot alignment radiographs. Valgus hindfeet are demonstrated in this image.

Radiographic measurements on lateral radiograph. (A) Calcaneal pitch was determined by the intersection of a line drawn from the most inferior aspect of the calcaneocuboid joint to the point where the calcaneal tuberosity contacted the ground, and a line drawn parallel to the ground. (B) Meary angle was determined by the intersection of a line drawn from the most posterior point of the talar dome to the center of the talonavicular joint and a line drawn from the center of the first metatarsophalangeal joint to the center of the first tarsometatarsal joint.

Photographic assessment of arch type and foot posture. (A) Photograph of the medial arch used to assess photographic arch type (PAT) demonstrating pes planus. (B) Hindfoot photograph used to assess photographic foot posture (PFP) demonstrating bilateral valgus hindfoot posture.
Reliability Assessment
Intraclass correlation coefficients (ICCs) for continuous variables, and Kendall coefficient of concordance (Kendall W) for categorical variables, were calculated to determine the interrater reliability of the assessments. Kendall W was interpreted using previously published thresholds: weak (0.11-0.30), moderate (0.31-0.50), strong (0.51-0.70), and extremely strong (0.71-0.90). 21 ICC values were interpreted according to previously established standards: poor (less than 0.5), moderate (between 0.5 and 0.75), good (0.75 and 0.9), and excellent (greater than 0.9). 22
Correlation Analysis
Continuous variables, such as calcaneal pitch and Meary angle, were averaged across the 5 raters. Categorical variables, such as Radiographic Arch Type, were assigned numerical values (eg, 1 = planus, 2 = neutral, 3 = cavus) and then averaged across all raters. Correlations between all measures of arch type and foot posture were assessed using Spearman rank correlation. Strength of correlation was assessed as previously described based on the correlation coefficient: negligible (0.0-0.3), low (0.3-0.5), moderate (0.5-0.7), high (0.7-0.9), or very high (0.9-1.0). 23 Given the sample of 184 feet, this study was powered to detect correlations as small as 0.2.
Sensitivity, Specificity, and Accuracy
Calcaneal pitch served as the reference standard for all measurements, with calcaneal pitch ≥26° classified as cavus feet and calcaneal pitch ≤19° classified as planus.14,24 A Meary angle >4° was classified as cavus and <−4° was classified as planus. 25 An Arch Index of ≤0.21 was considered cavus and ≥0.26 considered planus (Figure 4). Prior to sensitivity, specificity, and accuracy analysis, the average grades of the categorical scores were converted into categorical variables using ≤1.5 as the cutoff for pes planus and ≥2.5 for pes cavus. Sensitivities and specificities were then calculated using the cutoffs above and calcaneal pitch as the reference.

Arch Index. Arch Index (AI) was determined using footprints obtained using a lightbox system. Arch index was calculated as the ratio of B/(A + B + C), where A = hindfoot, B = midfoot, C = forefoot.
As part of a secondary analysis, we completed a receiver operating characteristic (ROC) analysis to evaluate how changing classification cutoffs affects sensitivity and specificity. For the ROC analysis, we again used calcaneal pitch as our reference to evaluate the classification ability of Radiographic Arch Type, Photographic Arch Type, Meary angle, and Arch Index. Area under the curve (AUC) thresholds were interpreted as <0.6 poor discrimination, 0.6 to 0.75 possibly helpful discrimination, and >0.75 useful discrimination. 26 Optimal cutoffs for Meary and Arch Index were determined from the ROC analysis using Youden index. 27 All statistical analysis was performed using SPSS, version 24 (IBM).
Results
The total number of feet analyzed was 184. Participants included 27 men (mean age 27.0 ± 4.7 years) and 23 women (mean age 26.8 ± 4.1years) in the younger group and 15 men (mean age 63.3 ± 4.2 years) and 29 women (mean age 62.6 ± 5.0 years) in the older age group. Neutral foot was the most common classification using calcaneal pitch, Meary angle, Foot Posture Index, and radiographic posture. In contrast, pes cavus was the most common foot type using Arch Index and Photo Posture Type (Table 1). The mean calcaneal pitch for pes planus, neutral and pes cavus were – 15.59°, 21.98°, and 28.16°, respectively. The mean Meary angle for pes planus, neutral, and pes cavus were −9.45°, −0.88°, and 7.63°, respectively (Table 2).
Foot Posture Categorization Based on Radiographic and Clinical Measurements of 184 Feet. a

Calcaneal pitch scoring was characterized as ≥26 for cavus and ≤19 for planus. Meary score was characterized as ≤−5 as planus and ≥5 as cavus. Arch Index scoring included ≤0.21 for cavus and ≥0.26 for planus. Foot Posture Index scores are scored supinated (≤−1) to pronated (≥6) thus pronated was assumed to be planus and supinated was assumed to be cavus. Radiographic Posture Type and Photo Posture Type were defined as average rater scores ≥1.5 for planus and ≤2.5 for cavus.
Mean, Minimum, Maximum, and 95% CIs for Calcaneal Pitch and Meary Angle for Each Foot Type.

Interrater reliability of Radiographic Foot Posture (W = 0.522), Radiographic Arch Type (W = 0.676), Photographic Arch Type (W = 0.831), and Photographic Foot Posture (W = 0.612) ranged from strong to extremely strong. Overall interrater reliability of calcaneal pitch (ICC = 0.804) and Meary angle (ICC = 0.711) ranged from moderate to good. Pairwise ICC testing averaged 0.893 for calcaneal pitch (range 0.841-0.954) and 0.840 for Meary angle (range 0.744-0.891).
Correlations between foot arch measurements of Radiographic Arch Type, calcaneal pitch, Meary angle, Photographic Arch Type, and Arch Index ranged from low to high (Table 3). The strongest correlation was identified between Radiographic Arch Type and calcaneal pitch (r = 0.855, P < .001; Table 3 and Figure 5). All measures were positively correlated, except for Arch Index, which was inversely correlated with other assessments because of the AI scoring system, which is the reverse of all others: higher AI values correspond to lower arches. Low correlations were identified between foot posture measurements of Radiographic Foot Posture, Foot Posture Index, and Photographic Foot Posture (Table 4). Radiographic Foot Posture and Photographic Foot Posture demonstrated the strongest correlation among the foot posture measurements (r = 0.442, P < .001).
Correlations Between Assessments of Longitudinal Arch Type. a

Abbreviations: AI, Arch Index; CP, calcaneal pitch; MA, Meary angle; PAT, Photographic Arch Type; XAT, Radiographic Arch Type.
Spearman correlation coefficients are provided for each pair of arch measurements. Agreement between measures is color coded as darker shades representing stronger correlations towards the same classifications. Quantitative measures are identified by red text, whereas qualitative measures are signified by black text.
P < .001.

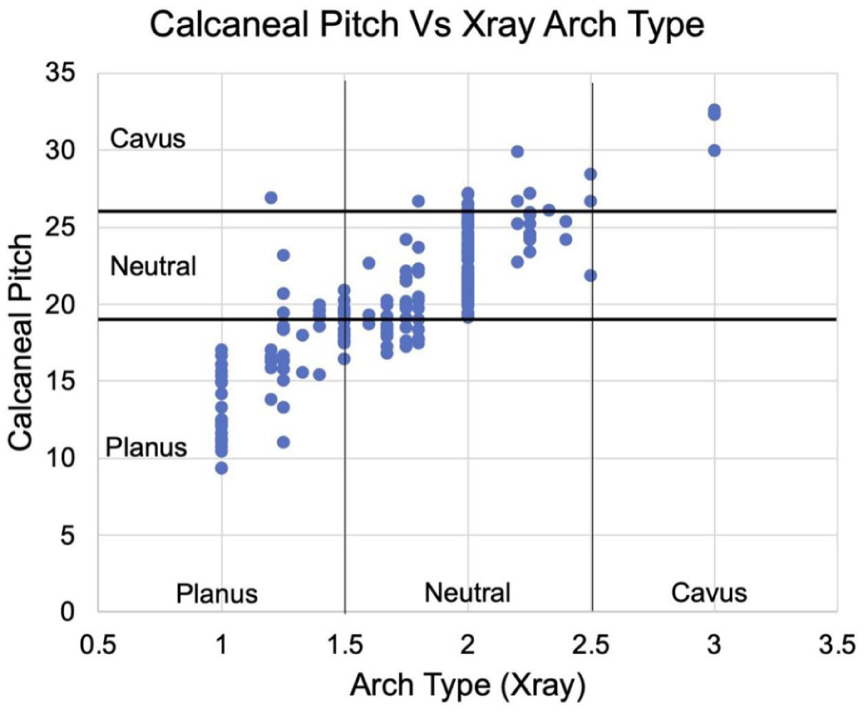
Correlation between Radiographic Arch Type (XAT) and calcaneal pitch (CP). Radiographic Arch Type values represent the average assessments of all reviewers. Planus feet were given a score of 1, neutral feet a score of 2, and cavus feet a score of 3.
Correlations Between Assessments of Foot Posture a

Abbreviations: FPI, Foot Posture Index; PFP, Photographic Foot Posture; XFP, Radiographic Foot Posture.
Spearman correlation coefficients are provided for each pair of arch measurements. Agreement between measures is color coded as darker shades representing stronger correlations toward the same classifications. Quantitative measures are identified by red text, whereas qualitative measures are signified by black text.
P < .001.
Radiographic Arch Type had the greatest sensitivity and specificity for planus (0.68 and 0.93, respectively) and normal (0.92 and 0.62, respectively) arches, and the greatest sensitivity for cavus arches (0.45) (Table 5). Photographic Arch Type had the highest specificity for cavus feet (0.95). Of the nonradiographic parameters assessed, photographs had the greatest sensitivity and specificity for identifying normal arches (0.73 and 0.47, respectively) and planus arches (0.54 and 0.83, respectively), and the greatest specificity for cavus arches (0.95). Arch Index had the greatest sensitivity for cavus feet (0.41) (Table 5).
Sensitivity and Specificity of Foot Arch Measurements.

Abbreviations: AI, Arch Index; MA, Meary angle; PAT, Photographic Arch Type; XAT, Radiographic Arch Type.
The area under the curve (AUC) to evaluate Meary angle was 0.72 for planus feet and 0.71 for cavus feet (Figure 6A). The AUC to evaluate Arch Index was 0.77 for planus feet and 0.64 for cavus feet (Figure 6B). The optimal cutoff values to identify foot postures utilizing Meary angle were −3.8 for planus and −0.4 for cavus (Figure 6C). The optimal cutoff values to identify foot postures utilizing Arch Index were 0.21 for planus and 0.25 for cavus (Figure 6D).

(A) Receiver operating characteristic (ROC) curve analysis for the diagnostic performance of Meary angle to evaluate planus and cavus feet as defined by calcaneal pitch. (B) ROC curve analysis for the diagnostic performance of Arch Index (AI) to evaluate planus and cavus feet as defined by calcaneal pitch. (C) Optimal cutoff curve for planus and cavus feet utilizing the Meary angle ROC curve. X is the peak value for each curve, thus denoting the optimal cutoff value. (D) Optimal cutoff curve for planus and cavus feet utilizing the AI ROC curve. X is the peak value for each curve thus denotes the optimal cutoff value. AUC, area under the curve.
Discussion
Although the interrater reliability was good for calcaneal pitch and Meary angle, the highest reliability was found in Photographic Arch Type, contrary to our first hypothesis. Contrary to our second hypothesis, correlations between radiographic and manual or visual arch type was moderate at best, suggesting that visual or manual assessment of foot type is not a good proxy for radiographic assessment. Using calcaneal pitch as a reference standard, Radiographic Arch Type was the most sensitive and specific for identifying planus and normal arches and had the greatest sensitivity for identifying cavus arches whereas Photographic Arch Type had the highest specificity for identifying cavus feet. Photographs have poor sensitivity for identifying cavus feet. Photographic and radiographic assessment of hindfoot alignment using hindfoot alignment view also were poorly correlated, suggesting that visual assessment of the hindfoot orientation is poorly associated with underlying bone orientation. The radiographic posture had only moderate interrater reliability, consistent with prior research demonstrating that the hindfoot alignment view is less reliable than the long axial view. 25 These findings highlight the discrepancies among common foot type and foot posture measurements and the need to improve measurement reliability and accuracy.
Multiple previous studies have attempted to characterize foot type, using methods including radiographic19,28,29 and nonradiographic measures,15,30,31 and advanced imaging. 32 The reliability of radiographic assessments of foot type has been previously investigated in several studies.28,29 Hohmann et al 28 assessed the reliability of several measures, including calcaneal pitch, across 3 observers, and determined that the interrater reliability of calcaneal pitch was 0.83, which is very similar to the result obtained in the present study (0.804). Saltzman et al 29 investigated the correlation between multiple foot radiographic measures—talar height/foot length, calcaneal–first metatarsal angle, and calcaneal pitch—and several nonradiographic measures of arch height, and reported similar moderate correlations for calcaneal pitch to those identified in the present study. Together with the data presented in this present study, this previous literature supports the good reliability of calcaneal pitch measurements. Also, these studies highlight the need for a thoughtful approach to selecting foot typing methods in research because of the variability between radiographic and nonradiographic methods.
More recently, attempts have been made to define novel radiographic measures that account for the multiplanar components of foot deformity. Arunakul et al 19 reported a novel radiographic foot typing measure, the Tripod Index, measured on anteroposterior (AP) radiographs, which demonstrated excellent interrater reliability (ICC = 0.98), and excellent sensitivity and specificity for the detection of symptomatic flatfoot and symptomatic cavovarus foot in comparison to hindfoot alignment, AP talonavicular uncoverage, Meary angle, and calcaneal pitch, among other measures. The process of calculating the Tripod Index is notably more complex than the Meary angle and calcaneal pitch parameters assessed in our study, which may limit its utility as a standard clinical measurement. Nevertheless, given its excellent sensitivity and specificity, the Tripod Index may be a useful measure in the assessment of asymptomatic, but suspected, cavovarus feet, for which the measures used in our study demonstrated limited utility.
In addition to radiographic assessment, several previous studies have sought to assess the validity of different nonradiographic methods of assessing foot type.15,30,31 A recent systematic review assessed 26 studies and recommended that Arch Height Index, Foot Posture Index, and the Staheli Arch Index be used to classify foot type on the basis of interrater reliability and presence of normative values; however, the authors noted that variability of measurements used and heterogeneity in assessments of reliability limited their conclusions. 15 Shultz et al 31 used canonical regression analysis to determine structural, flexibility, and function variables that discriminated between clinical foot type in 61 asymptomatic healthy adults; of the 30 initially included variables, 5 variables ultimately correctly predicted 80.7% of foot types—malleolar valgus index, arch height index while sitting, first metatarsophalangeal joint laxity while standing, pressure time integral, and maximum contact area of the medial arch. However, although measures such as the malleolar valgus index and arch height index have been shown to vary with foot type, foot type was defined through manual examination, 33 which the present study has shown may not accurately represent the structure of the foot.
Although clinical examination and radiographic studies are widely accessible, there is still a push toward using more advanced imaging such as computed tomography (CT) to evaluate foot type and posture. Weightbearing traditional CT studies have shown that radiographic measurements such as calcaneal pitch and Meary angle can change with increasing weightbearing. 32 Cone-beam CT studies have highlighted similar results with 3-dimensional models having less variation compared with 2-dimensional models such as simulated radiographs pulled from the same scan. 34 Improvements in automated segmenting and measurements may lead to a transition of advanced imaging becoming the standard for evaluating static foot morphology in a quantitative manner.
Chuckpaiwong et al 30 conducted a study with members of the American Orthopaedic Foot & Ankle Society (AOFAS) to determine how clinicians determine foot type. The majority of the respondents (69.9%) stated that clinical assessment (ie, visual examination) was the most important means of determining foot type; standing radiographs (17.8%), followed by footprint measurements (11.6%), were the next most commonly used methods. 30 Additionally, the authors asked the participating AOFAS members to assess multiple nonradiographic foot measurement parameters. The authors determined that rearfoot angle, footprint index, and truncated arch index predicted clinically defined foot type; the combination of these 3 measures accounted for 87.8% of the variance in clinically defined foot type, and respondents nearly unanimously recommended using more than 1 measure to characterize foot type. 30
Similarly, no single measure of foot type was clearly superior in our study, and the sensitivity for detection of cavus feet was particularly limited, indicating that more than 1 measure is likely needed to accurately characterize cavus feet. Despite the widespread use of visual examination, the discrepancy between radiographic and nonradiographic methods in our study call into question the transferability of methods used clinically into the research setting. Future research studies that use multiple foot typing methods may prove to be of higher quality.
Ideal cutoff values of specific foot type classifications is an unresolved challenge in the literature. Calcaneal pitch cutoff values for planus feet have been reported as <12.3°, 35 <15°, 36 and ≤19°. 14 In contrast, the neutral foot types based on Meary angle have been reported as −4° to 4°,25,36 0° to 4°, 37 and −5° to 8°. 14 In our study, Meary angle was possibly helpful for identifying planus and cavus feet. The optimal cutoff for Meary angle calculated based on our data set fell into the ranges listed above but did not specifically match other literature. This may be partially due to only having 17 cavus feet as defined by our reference measurement, calcaneal pitch.
Interpretation of the sensitivity and specificity of Arch Index, Photographic Arch Type, and Meary angle in the assessment of cavus feet may be limited by our small sample of cavus feet. Low to high correlation was identified among foot typing methods, which suggests classification is highly dependent on the method used and the cutoff values selected for classification. Use of a radiographic parameter, calcaneal pitch, as the reference standard, may have biased the sensitivity and specificity results in favor of radiographic arch type, which is also a radiographic parameter.
Conclusion
This study demonstrates that although manual and visual assessments of foot posture possess moderate to strong interrater reliability, they exhibit poor agreement with radiographic reference standards. Specifically, nonradiographic methods failed to consistently classify foot type compared with calcaneal pitch and Meary angle. Radiographs in combination with other nonradiographic methods may be necessary to comprehensively classify foot type.
Supplemental Material
sj-pdf-1-fao-10.1177_24730114261432621 – Supplemental material for Manual and Visual Assessment of Foot Type and Posture Correlate Poorly With Radiographic Assessment: A Cross-Sectional Study
Supplemental material, sj-pdf-1-fao-10.1177_24730114261432621 for Manual and Visual Assessment of Foot Type and Posture Correlate Poorly With Radiographic Assessment: A Cross-Sectional Study by Steve Bayer, Elizabeth Plakseychuk, Kenzo Cotton, Clarissa LeVasseur, Dukens LaBaze, Alexandra Gabrielli, Gillian Kane, Maria A. Munsch, Stephen Chen, Christopher Murawski, Conor Murphy, William Anderst and MaCalus V. Hogan in Foot & Ankle Orthopaedics
Footnotes
Ethical Considerations
Ethical approval for this study was obtained from University of Pittsburgh Institutional Review Board (STUDY19110080).
Funding
The authors disclosed receipt of the following financial support for the research, authorship, and/or publication of this article: This project was funded in part by the Albert B. Ferguson, Jr., M.D. Orthopaedic Fund of The Pittsburgh Foundation.
Declaration of Conflicting Interests
The authors declared the following potential conflicts of interest with respect to the research, authorship, and/or publication of this article: Christopher D. Murawski, MD, reports disclosures of Acumed, travel support; Beyond Physician, stock; BoneSupport, consultant; Celling Biosciences, consultant; DJO/Enovis, one-time consultant fee in 2024; Greymont, consultant; Marrow Access Technologies, stock options; Pressio, stock; Reselute, stock; restor3d, stock; RMR Ortho, stock; surgeon advisory board; Smith & Nephew, consultant; and VuMedi, stock. William Anderst, PhD, reports disclosures of Smith & Nephew for unrelated project; Wright Medical, access to implant models for unrelated project; and Arthrex, access to implant models for unrelated project. MaCalus Hogan, MD, MBA, reports disclosures of Albert B. Ferguson, Jr., M.D. Orthopaedic Fund of The Pittsburgh Foundation Grant and general disclosures of Board of Directors: AOFAS, JARGOS, OFAF, Zimmer Bionet, ISAKOS (leg, ankle, foot committee), AAOS (board of specialty societies); advisory board: NIH; and research funding (not specific for this project): NIH/DoD. Disclosure forms for all authors are available online.
References
Supplementary Material
Please find the following supplemental material available below.
For Open Access articles published under a Creative Commons License, all supplemental material carries the same license as the article it is associated with.
For non-Open Access articles published, all supplemental material carries a non-exclusive license, and permission requests for re-use of supplemental material or any part of supplemental material shall be sent directly to the copyright owner as specified in the copyright notice associated with the article.