
Abstract
Background:
The rising prevalence of obesity among American adults has disproportionately affected Black adults and women. Furthermore, body mass index (BMI) has historically been used as a relative contraindication to many total joint arthroplasty (TJA) procedures, including total ankle arthroplasty. The purpose of this study was to investigate potential disparities in patient eligibility for total ankle arthroplasty based on race, ethnicity, sex, and age by applying commonly used BMI cutoffs to the American College of Surgeons National Surgical Quality Improvement Program (ACS-NSQIP) database.
Methods:
Patients in the ACS-NSQIP database who underwent TAA from 2011 to 2020 were retrospectively reviewed in a cross-sectional analysis. BMI cutoffs of <50, <45, <40, and <35 were then applied. The eligibility rate for TAA was examined for each BMI cutoff, and findings were stratified by race, ethnicity, sex, and age. Independent t tests, chi-squared tests, and Fisher exact tests were performed to compare differences at an α = 0.05.
Results:
A total of 1215 of 1865 TAA patients (65.1%) were included after applying the exclusion criteria. Black patients had disproportionately lower rates of eligibility at the most stringent BMI cutoff of <35 (P = .004). Hispanic patients had generally lower rates of eligibility across all BMI cutoffs. In contrast, Asian American and Pacific Islander patients had higher rates of eligibility at the BMI cutoffs of <35 (P = .033) and <40 (P = .039), and White non-Hispanic patients had higher rates of eligibility across all BMI cutoffs. Females had lower eligibility rates across all BMI cutoffs. Ineligible patients were also younger compared to eligible patients across all BMI cutoffs.
Conclusion:
Stringent BMI cutoffs may disproportionately disqualify Black, female, and younger patients from receiving total ankle arthroplasty.
Level of Evidence:
Level III, retrospective cross-sectional study.
Introduction
Obesity is a health epidemic and one of the leading causes of preventable death in the United States. 24 Data from the Centers of Disease Control and Prevention estimate that 41.9% of the US population are currently obese with a body mass index (BMI) ≥30, 56 and obesity trends are projected to increase by approximately 1% per year over the next 10-30 years. 53 Obesity is a well-documented risk factor for osteoarthritis,22,26 and obese individuals constitute a substantial proportion of patients requiring joint arthroplasty.22,32 The rising prevalence of obesity seems ripe to drastically affect arthroplasty eligibility as BMI remains a commonly used screening criterion for arthroplasty. 52 Approximately 57% to 62% of US arthroplasty surgeons use BMI screening for total knee (TKA) and hip arthroplasty (THA) eligibility. 20
Preoperative BMI screening has been shown to optimize patient outcomes by minimizing complications following surgery.4,30 Several studies have reported on postoperative complications in obese patients. Following TKA, obese patients were found to have higher rates of early revision, malalignment, dislocation, wound infection, and lower patient function.3,26 Obese patients undergoing THA had a 3-fold higher wound infection and complication rate. 22 The US Food and Drug Administration does not list obesity as an absolute contraindication for total ankle arthroplasty (TAA). 19 However, several studies have identified obesity as an independent risk factor that increases the risk of 90-day perioperative complications following TAA, including aseptic loosening, deep vein thrombosis, infections, and revisions.27,55 With the projected rise in obesity and BMI screening utilization, there is potential for obese patients to be limited in their access to arthroplasty procedures. Issues of patient eligibility for obese individuals may reveal consequences of denied or delayed orthopaedic care, including joint damage, increased severity of osteoarthritis, and increased risk of arthro-fibrosis. 29 Furthermore, these consequences may exacerbate preexisting disparities within the obese patient population. Obesity disproportionately affects Black adults and women, and this disparity is projected to become more significant as morbid obesity (BMI > 40) is expected to become the most common BMI category among Black adults and women by 2030.53,54 Additionally, BMI cutoffs are based on data from White individuals and may not be applicable to other racial ethnic groups. This may further exacerbate the challenges in accessing orthopaedic care for non-White patients. 23,51 Thus, using BMI screening to determine patient eligibility may limit access to arthroplasty and hinder health outcomes for already vulnerable populations.
There is extensive literature on BMI screening for TKA and THA; however, there remains a paucity of data on the relationship between obesity and surgical options for end-stage ankle arthritis. Ankle osteoarthritis is estimated to affect 3.4% of the general population and is a leading cause of chronic disability in the United States. 25 There has been an upward trend in the utilization of total ankle arthroplasty over ankle arthrodesis (AA).35,40 TAA patients report lower pain levels, improved range of motion, and higher American Orthopaedic Foot & Ankle Society (AOFAS) scores than AA patients. However, patient outcomes are mixed.35,45 Some studies have shown that TAA patients have higher complication and revision rates than AA patients, whereas other studies suggest that AA patients have higher overall complication rates. 28 , 45 Some studies have looked at the impact of obesity on TAA outcomes. Although obese patients report improved pain and functional outcomes following TAA, they still experienced lower functional scores and increased risk of TAA failure compared with their nonobese counterparts.43,44,50 Using BMI criteria to minimize poor outcomes may limit access to TAA and disproportionately affect vulnerable populations, including Black adults and women.
This study aimed to examine national trends in the treatment of end-stage ankle arthritis via total ankle arthroplasty with respect to BMI. By stratifying patients into groups based on BMI at the time of surgery and applying commonly used BMI cutoffs (<50, <45, <40, <35), we aimed to elicit potential race, ethnicity, sex, and age differences that exist among those undergoing TAA. We hypothesized that there would be no difference in patients’ sex, race, ethnicity, or age at the least rigid BMI cutoff (<50).
Materials and Methods
Our institutional review board granted this study a human subject research exemption. We retrospectively reviewed data from the American College of Surgeons National Surgical Quality Improvement Program (ACS-NSQIP) database from 2011 to 2020. Patients undergoing total ankle arthroplasty were identified in NSQIP using the common procedural code 27702. Collected data included patient age, race, ethnicity, sex, height, and weight. BMI was calculated from height and weight measurements. Exclusion criteria for TAA patients in NSQIP included the absence of race, ethnicity, height, weight data, nonelective or emergent surgery, active chemotherapy or radiation, history of disseminated cancer, preoperative wound infections, preoperative sepsis, nonclean wound class, and patients who received a revision TAA. Patients with a BMI of <10 or >80 were excluded because these likely represent erroneous measurements.15,58 The overall inclusion rate for TAA in NSQIP was 65%.
Designations of race and ethnicity were standardized with the following categories: Asian American and Pacific Islander (AAPI), Black, Hispanic, White non-Hispanic (WNH), and Other (American Indian and Alaska Native). BMI cutoffs of <50, <45, <40, and <35 were applied to the NSQIP TAA cohort to model the rate of surgical eligibility for TAA if BMI cutoffs had been applied for all patients. These BMI cutoffs were selected based on the World Health Organization (WHO) classification for BMI (class I, II, and III obesity), which has been used across orthopaedic studies performing the same data analyses.10,56 Patients were deemed eligible for surgery if their BMI was less than each modeled BMI cutoff and ineligible if their BMI was equal to or greater than the cutoff. The relative rate of eligibility was defined as the rate of eligibility minus the rate of ineligibility. Positive values for the relative eligibility rate represent disproportionately higher eligibility, whereas negative values represent disproportionately lower eligibility for each BMI cutoff. The relative rates of eligibility by race, ethnicity, and sex were determined for each BMI cutoff. The mean age for eligible and ineligible cohorts was also compared. Continuous variables were evaluated for normality using the independent t tests. Categorical variables were compared using chi-square or Fisher exact tests. Statistical significance was set to P <.05. Statistical analyses were performed using IBM SPSS statistics (version 28.0.1.0).
Results
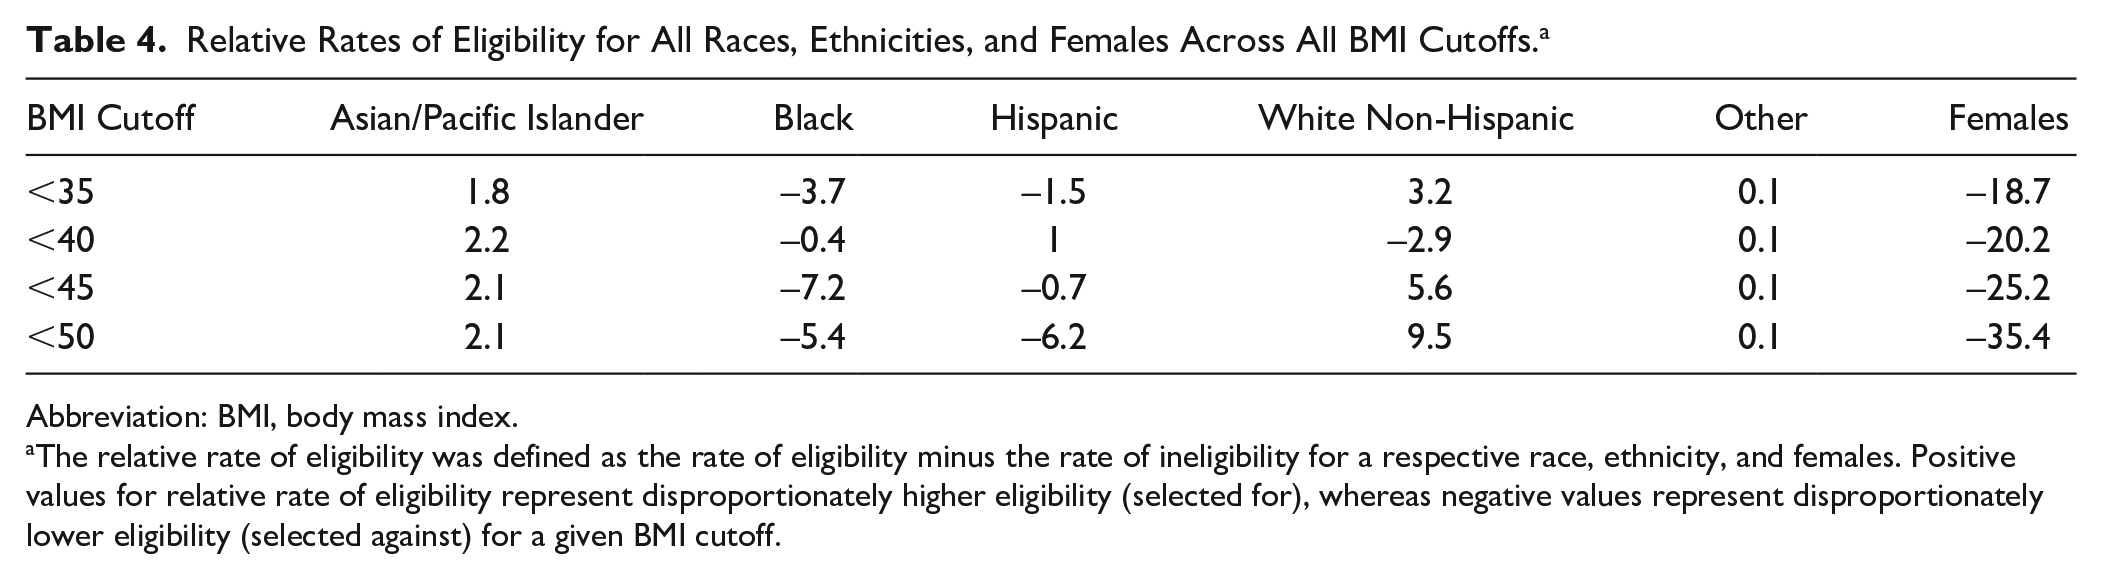
In total, 1215 NSQIP TAA patients were analyzed. Cohort demographic data are present in Table 1. NSQIP TAA patients had a mean age of 64 ± 10 years, were 46.7% female, a mean BMI of 31 ± 6, and were predominantly White non-Hispanic (91.2%). AAPI patients had higher rates of eligibility across all BMI cutoffs (Tables 2 and 3, Supplemental Tables 1 and 2), with relative rates of eligibility ranging from 1.8% to 2.2% (Table 4, Figure 1). AAPI patients were also disproportionately eligible for TAA at the BMI cutoffs of <35 (P = .033) (Table 2) and <40 (P = .039) (Table 3). In contrast, Black patients had lower rates of eligibility across all BMI cutoffs (Tables 2 and 3, Supplemental Tables 1 and 2), with relative rates of eligibility ranging from −7.2% to −0.4% (Table 4, Figure 1). Black patients were also disproportionately ineligible for TAA at the most stringent BMI cutoff of <35 (P = .004) (Table 2). Hispanic patients had generally lower rates of eligibility across all BMI cutoffs (Tables 2 and 3, Supplemental Tables 1 and 2), with relative rates of eligibility ranging from −6.2% to 1% (Table 4, Figure 1). At the BMI cutoff of <40, Hispanic patients had higher rates of eligibility for TAA; however, this finding was not statistically significant (Table 3). WNH patients had higher rates of eligibility across all BMI cutoffs (Tables 2 and 3, Supplemental Tables 1 and 2), with relative rates of eligibility ranging from −2.9% to 9.5% (Table 4, Figure 1). At the BMI cutoff of <40, WNH patients had lower rates of eligibility for TAA; however, this finding was not statistically significant (Table 3). For Other patients, the relative eligibility rate remained the same across all BMI cutoffs (Table 4, Figure 1). Greater proportions of females were ineligible for TAA across all BMI cutoffs (Tables 2 and 3, Supplemental Tables 1 and 2), with relative rates of eligibility ranging from −35.4% to −18.7% (Table 4, Figure 2). However, further study on a larger patient population is necessary to elucidate specific race-based differences among females. Ineligible patients were also younger compared to eligible patients across all BMI cutoffs (Tables 2 and 3, Supplemental Tables 1 and 2).
TAA Cohort Demographics (N = 1215; 65.1%) a .

Abbreviations: BMI, body mass index; TAA, total ankle arthroplasty.
Corresponds to percentage of TAA patients included in the study after exclusion criteria was applied.
Values are expressed as mean ± SD, percentage, or number (percentage).
Rates of Eligibility at BMI Cutoff of <35. a

Abbreviation: BMI, body mass index.
Patients are deemed eligible for surgery if they are below the BMI cutoff and deemed ineligible for surgery if they are at or above the BMI cutoff.
The reported P value represents comparison between eligible and ineligible for age, sex, race, and ethnicity stratifications.
Rates of Eligibility at BMI Cutoff of <40. a

Abbreviation: BMI, body mass index.
Patients are deemed eligible for surgery if they are below the BMI cutoff and deemed ineligible for surgery if they are at or above the BMI cutoff.
Relative Rates of Eligibility for All Races, Ethnicities, and Females Across All BMI Cutoffs. a
Abbreviation: BMI, body mass index.
The relative rate of eligibility was defined as the rate of eligibility minus the rate of ineligibility for a respective race, ethnicity, and females. Positive values for relative rate of eligibility represent disproportionately higher eligibility (selected for), whereas negative values represent disproportionately lower eligibility (selected against) for a given BMI cutoff.

Line graph demonstrating the relative rate of eligibility for all races and ethnicities at BMI cutoffs <35, <40, <45, and <50. The relative rate of eligibility was defined as the rate of eligibility minus the rate of ineligibility for a respective race, ethnicity, and females. Positive values for relative rate of eligibility represent disproportionately higher eligibility (selected for), whereas negative values represent disproportionately lower eligibility (selected against) for a given BMI cutoff. The figure depicts that Asian and Pacific Islander and White non-Hispanic patients have higher rates of eligibility across all BMI cutoffs. Black and Hispanic patients have lower rates of eligibility across all BMI cutoffs.

Line graph demonstrating the relative rate of eligibility for females and males. The relative rate of eligibility was defined as the rate of eligibility minus the rate of ineligibility for a respective race, ethnicity, and sex. Positive values for relative rate of eligibility represent disproportionately higher eligibility (selected for), whereas negative values represent disproportionately lower eligibility (selected against) for a given BMI cutoff. The figure depicts that females have lower rates of eligibility across all BMI cutoffs compared with males.
Discussion
Ankle osteoarthritis (AOA) significantly depresses mobility and quality of life metrics in most of the population.39,41,44 Although ankle arthrodesis has historically served as the gold standard for managing AOA, TAA has risen in popularity over the past 2 decades as new implant systems have been associated with superior patient-reported pain, functional scores, total ankle range of motion, and lifetime health care savings.17,37,38,41 However, arthrodesis has remained a mainstay of AOA treatment in medically complex patients as increased rates of TAA failure and poor outcomes have been reported in patients with various medical comorbidities.12,16,35 To limit the complication associated with these comorbidities—similar to other joint replacement procedures—many surgeons use screening criteria to decide whether or not a patient meets surgical candidacy. 10 One such comorbidity—obesity—has been linked to inferior TAA outcomes and possible increased subsidence risk, though these findings are controversial and not universally established.5,7,12 -14,16,21,34,35,42,43,49,50,57 Notably, obesity has been well documented to disproportionately affect women and Black individuals, opening the door to unforeseen care rationing.1,2,11,18,31,33,36,46,47 Therefore, this study aimed to examine if a strict BMI cutoff for TAA disproportionately excludes patients from surgical candidacy based on sex or race and ethnicity.
Patients who underwent TAA over the queried period were predominantly White and had a mean BMI meeting WHO class I obesity (>30), in line with previous studies.2,14,46,47,56 We found that as BMI cutoffs increased (most notably at BMI >50), patients who failed to meet surgical criteria were significantly younger than those who did meet criteria. Across all BMI cutoffs, the population that did not meet the criteria was composed of significantly more women. This finding was perhaps most notable at the BMI cutoff of 35, where nearly 32% of all women who received a TAA during the study period would have been deemed ineligible for surgery. Additionally, at the BMI cutoff of 35, Black patients made up a significantly greater proportion of the ineligible group. However, this effect disappeared when BMI cutoffs of 40, 45, and 50 or greater were applied. Across all BMI cutoffs, AAPI patients had higher rates of eligibility whereas Hispanic patients had relatively lower rates of eligibility. These data are consistent with known BMI trends in AAPI and Hispanic populations and further demonstrate the potential disparities in using BMI cutoffs.54,57
Obesity—typically as defined by a patient’s BMI on clinical intake—has long been regarded as a relative contraindication to TAA, given biomechanical concerns of aseptic loosening and implant subsidence associated with increased implant loads.16,42,50 However, associations between TAA complications, failure rates, and obesity have yielded conflicting findings over the last decade. Small sample studies from Bouchard et al 7 (39 patients) and Barg et al 5 (118 patients) noted no differences in TAA revision rates in patients with BMI >40 and no differences in TAA survivorship at 6 years in patients with a BMI ≥30, respectively. More extensive studies of TAA and obesity from Gross et al 21 (455 patients, 266 obese) and Cody et al 13 (533 patients) agree with these findings, again demonstrating no difference in complication rate or overall revision rate. Conversely, in a small series of 100 TAA patients, Noelle et al 34 found increased rates of aseptic loosening and deep infection among their obese population. Another small retrospective analysis of 49 obese and 48 nonobese patients undergoing TAA with 5 years of follow-up from Schipper et al 43 found an increased risk of implant failure at final follow-up when controlling for confounding factors. A recent analysis of a large national cohort of nearly 3000 TAAs from Suh et al 49 reaffirmed these adverse outcomes, noting increased rates of TAA failure—defined as revision arthroplasty—in patients with a BMI >30. With such conflicting evidence surrounding TAA survivorship in the obese population, it is understandable that surgeons may shy away from TAA in these patients when ankle arthrodesis provides a tested, reliable treatment avenue. Similar durability concerns in obese populations have been raised in total joint arthroplasty (TJA) literature, though the substantial postoperative pain and mobility benefits tend to supersede the increased risk of revision.6,8 With the considerable pain and mobility benefits found in newer TAA systems, these treatment differences in obese populations must be scrutinized when obesity disproportionately affects women and Black individuals. 9
Sex- and race-based differences in orthopaedic pathology and surgical care are well documented.2,18,31,33,36,46 -48 Multiple studies in the TJA literature have noted a higher prevalence of degenerative and inflammatory arthropathies in women, increased preoperative pain, and lower preoperative physical function scores relative to their male counterparts.18,36,48 Differences in the overall surgical treatment of various foot and ankle pathologies between men and women have also been well documented. 31 Across all BMI cutoffs, the present study noted that women would be disproportionately excluded from TAA eligibility based on weight. These findings are particularly notable in the context of work from Fletcher et al, 18 who found that despite having no difference in failure or revision rates, women had significantly more symptoms and physical deficits than men prior to TAA. Fletcher’s observation is echoed throughout TJA literature, where women have been noted to present in significantly worse disease states relative to men. 48 Perhaps more concerning findings extend to Black populations, who have been historically offered TJA at lower rates than White populations.2,32,45 In total hip (THA) and knee arthroplasty (TKA), Nelson 33 found significantly lower rates of primary THA and TKA among Black populations after accounting for socioeconomic, medical comorbidity, geographic region, and insurance status. This finding has been reaffirmed in several follow-up studies, noting decreased primary and revision THA and TKA rates among Black patients with no narrowing of the utilization gap over time.2,46 Along with inferior complication and readmission rates, Singh et al 46 also noted that Black populations undergoing TJA had significantly higher BMIs than their White counterparts. Our results show that when using a BMI cutoff of 35, Black patients disproportionately failed to meet surgical candidacy criteria for TAA.
Interestingly, previous work from Singh and Ramachandran 47 seems to support our findings, noting that from 1998 to 2011, White patients experienced a 2-fold increase in TAA utilization relative to Black patients (2× more frequent utilization in 1998, 4× in 2011). They also noted that these differences in TAA utilization could not be explained by disease burden or prevalence of absolute TAA contraindications. Given these symptom and utilization differences and expected obesity trends within the United States, our findings suggest a renewed urgency for establishing a consensus on BMI and TAA contraindication to minimize growing TAA disparities among female and Black populations.1,53,54
Recognizing and addressing disparities in the distribution of health resources are imperative in combating systemic care rationing. Although surgical eligibility criteria exist to protect patients from interventions that put them at unacceptable risk, these criteria are not uniformly distributed across populations and must be meticulously studied for unintentional and unnecessary exclusions. In the case of arthroplasty (specifically TAA), BMI is commonly used as an exclusion criterion despite a complete understanding of its associated morbidity in TAA.10,39 The findings presented within this study highlight the pitfalls of such a cutoff and another potential source of disproportionate inability to access TAA among women and Black individuals. Given the well-documented, expected increases in the obese population of the United States, the safety of performing TAA in patients with elevated BMIs must be further elicited to confirm or deter the use of strict BMI cutoffs. These findings appear most necessary in the lower bounds of the BMI class threshold—WHO class II—where these racial and sex-based disparities appear to have the most significant potential impact. At a minimum, we recommend that physicians recognize obesity as a modifiable risk factor prior to TAA and emphasize preoperative weight loss. 14 Further, it is imperative to understand sex-based and racial differences contributing to obesity and the multidisciplinary approach that should be taken to adequately address obesity. 9
Although the present study has many strengths, we recognize the inherent limitations of a retrospective database study. This study’s retrospective nature leaves it at risk of response and recall bias, though the procured data points did not rely on patient-reported outcomes. Additionally, the ACS-NSQIP database has been previously noted to be composed primarily of prominent academic institutions, potentially decreasing the generalizability of our findings. 10 Further, this database can only provide a glimpse into the eligibility of patients who eventually received surgical care. We recognize that not all surgeons use a hard BMI cutoff as a part of their surgical practice, and here use patients in the NSQIP database as a surrogate representing all patients that may present of consideration of TAA. Also, studies using the same database have noted the presence of oversampling in cohorts (particularly, the elderly, Black, and Hispanic persons) to accrue large pools of data. 10 Finally, we were unable to perform a well-powered subset analysis to identify specific race-based differences among female patients undergoing TAA. We recognize that we are only able to draw broad conclusions regarding sex-based differences in TAA, and further study on a larger sample of female patients undergoing TAA is needed.
Conclusion
In conclusion, if strict BMI cutoffs are applied to determine a patient’s eligibility for TAA, Black adults and women will be disproportionately excluded. In the Black adult population, this effect disappears with more significant levels of obesity. Interestingly, patients who would be deemed ineligible at all BMI cutoffs are also significantly younger than their eligible counterparts. Given these data and the rising obesity epidemic, additional highly powered studies are needed to determine the negative effect of BMI on TAA outcomes. Only then will we be able to determine BMI cutoffs in a race- and sex-based manner to ensure that at-risk populations are not disproportionately excluded from potentially mobility-improving surgery.
Supplemental Material
sj-pdf-1-fao-10.1177_24730114231184189 – Supplemental material for Body Mass Index (BMI) Cutoffs and Racial, Ethnic, Sex, or Age Disparities in Patients Treated With Total Ankle Arthroplasty
Supplemental material, sj-pdf-1-fao-10.1177_24730114231184189 for Body Mass Index (BMI) Cutoffs and Racial, Ethnic, Sex, or Age Disparities in Patients Treated With Total Ankle Arthroplasty by Myra Chao, Wesley J. Manz, Juliet Fink, Michelle M. Coleman, Rishin J. Kadakia and Jason T. Bariteau in Foot & Ankle Orthopaedics
Footnotes
Appendix
Rates of Eligibility at BMI Cutoff of <50. a

| Variable | Eligible (n=1204) | Ineligible (n=11) | P Value |
|---|---|---|---|
| Age, y, mean ± SD | 64 ± 10 | 55 ± 9 | .005 |
| Sex, n (%) female | 559 (46.4) | 9 (81.8) | .019 |
| Race and ethnicity, n (%) | |||
| Asian / Pacific Islander | 25 (2.1) | 0 (0) | .498 |
| Black | 44 (3.7) | 1 (9.1) | .341 |
| Hispanic | 35 (2.9) | 1 (9.1) | .283 |
| White non-Hispanic | 1099 (91.3) | 9 (81.8) | .27 |
| Other | 1 (0.1) | 0 (0) | >.99 |
Abbreviation: BMI, body mass index.
Patients are deemed eligible for surgery if they are below the BMI cutoff and deemed ineligible for surgery if they are at or above the BMI cutoff.
Ethical Approval
Ethical approval was not sought for the present study because it was conducted from retrospective review of a publicly available, deidentified dataset.
Declaration of Conflicting Interests
The author(s) declared no potential conflicts of interest with respect to the research, authorship, and/or publication of this article. ICMJE forms for all authors are available online.
Funding
The author(s) received no financial support for the research, authorship, and/or publication of this article.
References
Supplementary Material
Please find the following supplemental material available below.
For Open Access articles published under a Creative Commons License, all supplemental material carries the same license as the article it is associated with.
For non-Open Access articles published, all supplemental material carries a non-exclusive license, and permission requests for re-use of supplemental material or any part of supplemental material shall be sent directly to the copyright owner as specified in the copyright notice associated with the article.