
Abstract
Many laboratories struggle with mycoplasma contamination and cell line misidentification when growing cells in culture. These well-documented issues affect the scientific research community and have detrimental downstream effects. Research published with suspect cultures can produce misleading results. There is increasing pressure to verify the integrity of experimental and established cell lines before publishing. Therefore, laboratories need to define how and when to perform these critical tests, analyze the results, and determine action plans if disparities exist. Our laboratory is committed to producing cell lines of the highest quality for use in experiments; thus, we created a surveillance strategy for these potential problems. We developed processes for both testing and tracing cell line authentication and mycoplasma detection data. Using these methods, we can protect the integrity of our patient and commercial cell lines, maintaining reliable cultures for our research.
Introduction
Ensuring cell culture integrity is a difficult task and requires constant vigilance. Mycoplasma contamination can occur from numerous factors and can be difficult to eliminate once introduced. When cell line misidentification occurs, it is often through lack of diligence in the laboratory, 1 and the integrity of cell lines can be lost. In both cases, frequent testing, proper laboratory technique, and tracing can circumvent these risks.
Mycoplasma is known to cause numerous changes to cultured cell lines, including at the genomic level. Mycoplasmas can cause oxidative stress and nuclear DNA damage and alter the repair pathway. 2 These issues can cause variation in the results of functional assays performed on contaminated cell lines. Mycoplasmas are also known to survive in liquid nitrogen despite their inability to proliferate;3–5 therefore, cryopreservation cannot be relied upon to eliminate them. Contamination can occur from exposure in the liquid phase as mycoplasma has been found in ice inside nitrogen storage tank lids and in debris at the bottom of storage tanks. 5 Mycoplasmas can be resistant to treatment, making eradication difficult, and treatments can be harsh, potentially killing cell lines. 6
Short tandem repeat (STR) testing is considered the standard method for cell line authentication due to the accuracy, speed, and reliability of the assay, 7 whereas multiple dependable techniques exist for mycoplasma detection, including PCR and bioluminescence. 8 These verifications are increasingly necessary among research labs due to the continued use of suspicious cell lines during culture.1,9 A growing number of journals require cell lines to be tested for mycoplasma and cell line authentication before manuscript publication 10 due to numerous reports of publications using misidentified or contaminated cell lines. 11 Contamination and misidentification concerns are well documented, along with methods for prevention; however, the traceability of samples over a period of time is not. Our laboratory contains multiple research areas that share cell lines and cell culturing equipment, including biological safety cabinets (BSCs), incubators, centrifuges, microscopes, and nitrogen storage. Because of this, it was imperative that we develop a universal strategy for testing and tracing over time in our shared space.
Traceability refers to the ability to follow something from its origin through the course of its existence. To understand the quality of cell lines from a particular laboratory, tests must be performed and then compared with each other. Without comparison, the results of these tests reflect a specific point in time and do not represent the overall quality of a cell line. Traceability provides this comparison; unfortunately, tracing tools for mycoplasma and STR are difficult to find. This prompted us to develop our own tracing system. Our laboratory traces tissue samples from surgical acquisition through the culturing life cycle of cells. These cell lines are deidentified at acquisition through an honest broker within our Biorepository and Specimen Resource Center (BSRC) before they are transported to our laboratory. We developed methods to house, report, analyze, and trace the STR and mycoplasma information reported internally and externally in order to detect concerns in a timely manner. We also developed ad hoc visual representations to accompany both sets of data.
Materials and Methods
STR Traceability
Performing STR Testing
We extract DNA from our samples using the AllPrep DNA/RNA kit (QIAGEN 80204, Germantown, MD) for cell culture pellets, DNeasy Blood & Tissue kit (QIAGEN 69504) for tissue, or the QIAamp DNA FFPE Tissue kit (QIAGEN 56404) for formalin-fixed paraffin-embedded (FFPE) samples (QIAGEN). Amplification during STR requires DNA fragments to be larger than 100 bp. If FFPE samples are old or stored improperly, the DNA resulting from extraction may be heavily degraded; therefore, some FFPE samples pose a challenge. We have fragment analysis performed by an external provider prior to STR on potentially degraded samples to determine fragment size in these cases. This lets us avoid the time and cost of performing standard STR if the samples are not suitable.
We employ external service providers to perform STR on our samples, as it is more cost-efficient rather than performing the assay in-house. We have used two providers in our lab, switching to a more cost-effective provider within the last 2 years. Both providers use versions of the PowerPlex 16 System (Promega, Madison, WI) to amplify and detect 16 loci for each sample. The accuracy of the Promega kits used by our vendors is well documented,12–14 providing assurance that we receive reliable results. We receive electropherograms and allele reports from these sources, comparing data to cell lines in databases such as the American Type Culture Collection (ATCC), German Collection of Microorganisms and Cell Cultures (DSMZ), and Japanese Collection of Research Bioresources (JCRB), and our own previous results.
Storing STR Result Sets
We needed one electronic location to store and analyze all metadata and allele information from our samples after we received STR testing results. After searching for software to assist us, we identified that a Microsoft Excel spreadsheet would be suitable for our needs at no additional cost. The data are stored on a restricted-access network drive so laboratory staff can access data from any networked computer with a valid login. Columns we included were the date the sample was isolated, the technologist responsible for the sample, the facility performing the test, the report number, the date the report was received, cell line name, sample identifiers, passage number, patient-derived xenograft (PDX) number and animal identifier (if applicable), genetic modifications (if any), the disposition of the sample sent (cell pellet, DNA, etc.), and second technologist initials verifying data entry. Each row of the spreadsheet contains information from one sample. We add information as it is acquired; for example, the date the sample was isolated, the technologist responsible, and the cell line are entered at the time of collection, whereas the date reported and the number of repeats for each allele are entered when we obtain results from the vendor. Each allele has a set of columns designated for the number of repeats present ( Fig. 1 ), and a second technologist verifies the allele entry input. If an error is found, the document is not initialed by the verification technologist and the technologist responsible for the culture reviews the data a second time, correcting any errors. The verification technologist performs another review and initials the document if correct. The process repeats if necessary.
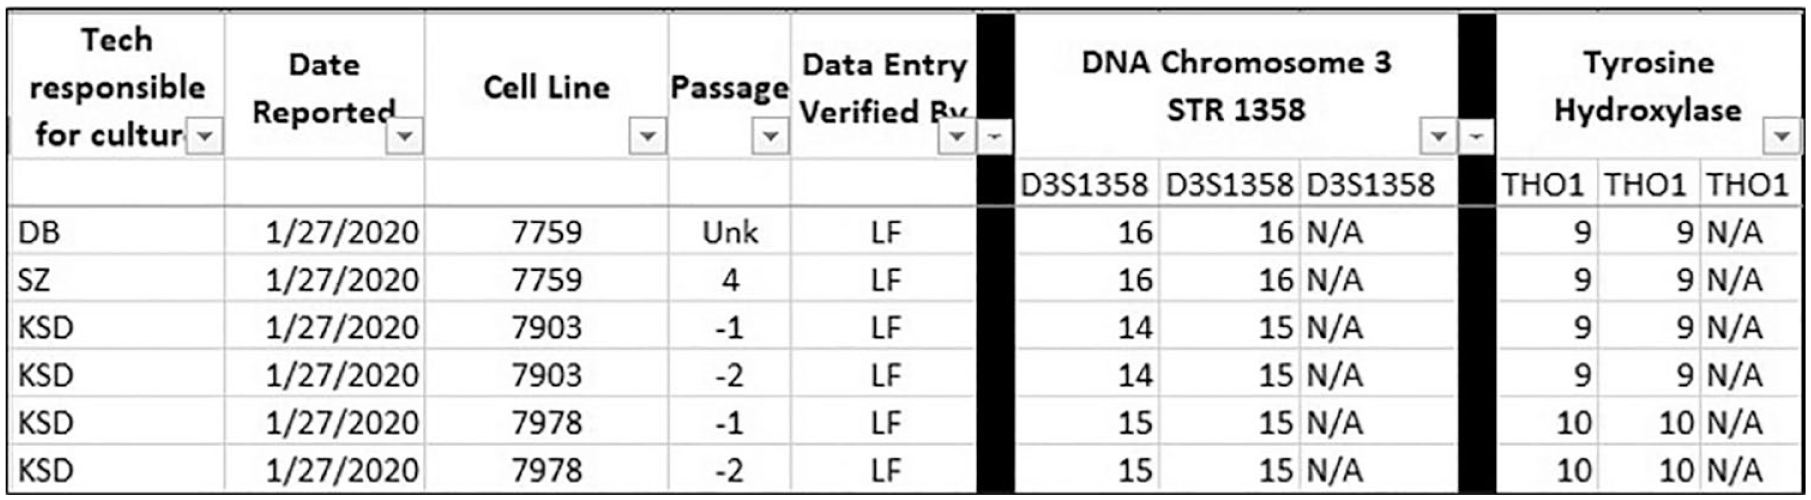
“STR Results” tab. Example of data entry for testing on a specified date.
Analysis
We assess each cell line for uniqueness by comparing the STR allele values to all other cell line results from our laboratory, which we house in the “STR Results” tab of our spreadsheet. We choose one allele first, such as amelogenin; then we filter out cell lines that do not match. We then choose the next allele in the list and compare it to the remaining cell lines with the amelogenin filter in place. We repeat this until it appears that a pattern is being seen or none of the alleles match. Since pattern recognition can be subjective, we use another tool to verify or dismiss our findings when they are ambiguous. If we suspect a match, we fill out an International Cell Line Authentication Committee (ICLAC) Match Criteria Worksheet (iclac.org) for a side-by-side comparison. We modified this document to include all 16 loci should we discover an indeterminate result with 9 loci. If we do not find a match among cell lines, we consider the cell line under scrutiny unique and we label it as such in the spreadsheet. We document additional information, including the number of cell lines we identified in one sample and if we find a trisomy. If no trisomy is identified, “no” is entered in the “Trisomy” column; otherwise, the chromosome number is indicated. If a cell line is contaminated, we document the matching cell line and the report identifier. All of these items have individual columns for sorting and filtering purposes. All laboratory staff are notified immediately if a match is discovered. Likewise, if two samples from the same patient do not match, this is noted in the appropriate columns and the staff is notified. According to ICLAC, a match is indicated when 80% of the alleles are the same. This allows for subtle changes in STR profiles from one patient over time, or multiple cell lines isolated from a single patient. The BSRC notifies laboratory staff when an additional sample is isolated from the same deidentified patient. This allows us to trace all cell lines from the same patient and identify if any profile changes exist.
PivotTable
We created a PivotTable to streamline the data from the “STR Results” tab for our desired visualization. Attempting to chart all data from the “STR Results” tab would be impractical, indecipherable, and unnecessary, as we want to compare uniqueness, not each allele. We chose specific fields: “Cell Line,” “Passage,” “Date Reported,” “Tech Responsible,” “Sample Name,” and “Unique.” We created a new column to prepare the data for the PivotChart called “Unique Binary.” The “Unique Binary” column takes the data from the “Unique” column and converts “yes” to “0” and “no” to “1.” When converting to a PivotTable, MS Excel updates this column to “Sum of Unique Binary” to summarize values but is not necessary in our case ( Fig. 2 ). Our data can now be mapped into a chart easily, using numerical values.
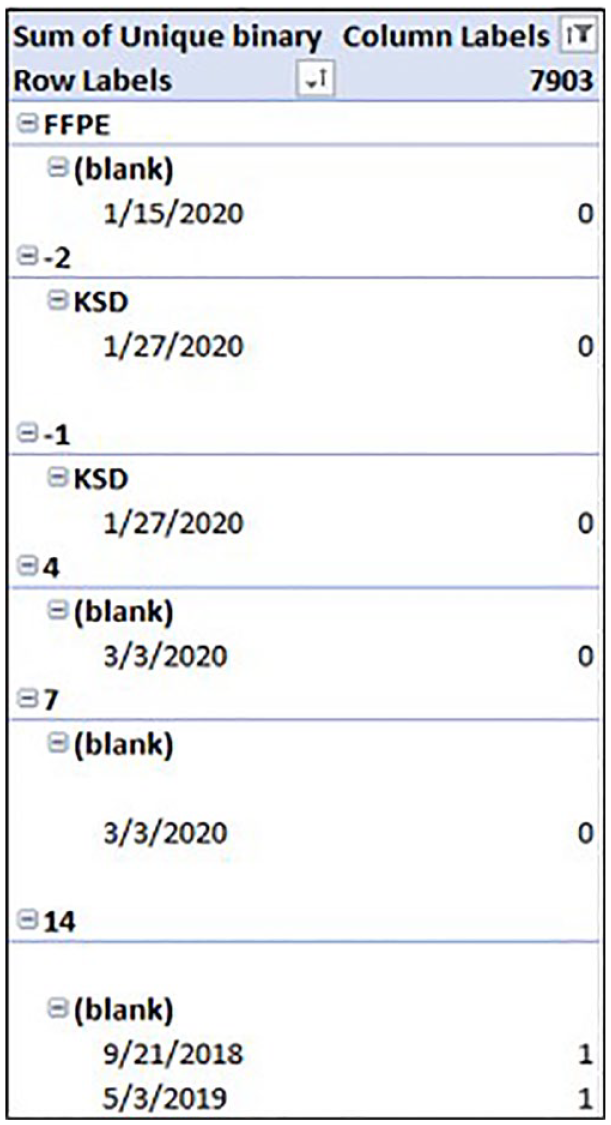
STR PivotTable. Example of samples filtered for cell line 7903, showing passage number, technologist initials, date, and unique value (0 or 1).
PivotChart
We designed a PivotChart to trace cell line uniqueness throughout the life of the culture. The chart is meant to be a living document, where we can change the data included ad hoc. We can filter “Cell Line,” “Passage,” “Tech Responsible,” and “Date” fields to view desired information ( Fig. 3 ) by clicking on the buttons at the bottom and right side of the chart. We can check or uncheck the boxes inside the button next to each value to remove unneeded data. A funnel icon appears on the button to indicate we have filtered a field. In this manner, we can view the STR data of one cell line in one place, and interpretation is simple, showing the date and passage number where the uniqueness value changes. We provide documentation for preparing and sending out samples, testing frequency, traceability, and compromised sample guidelines.
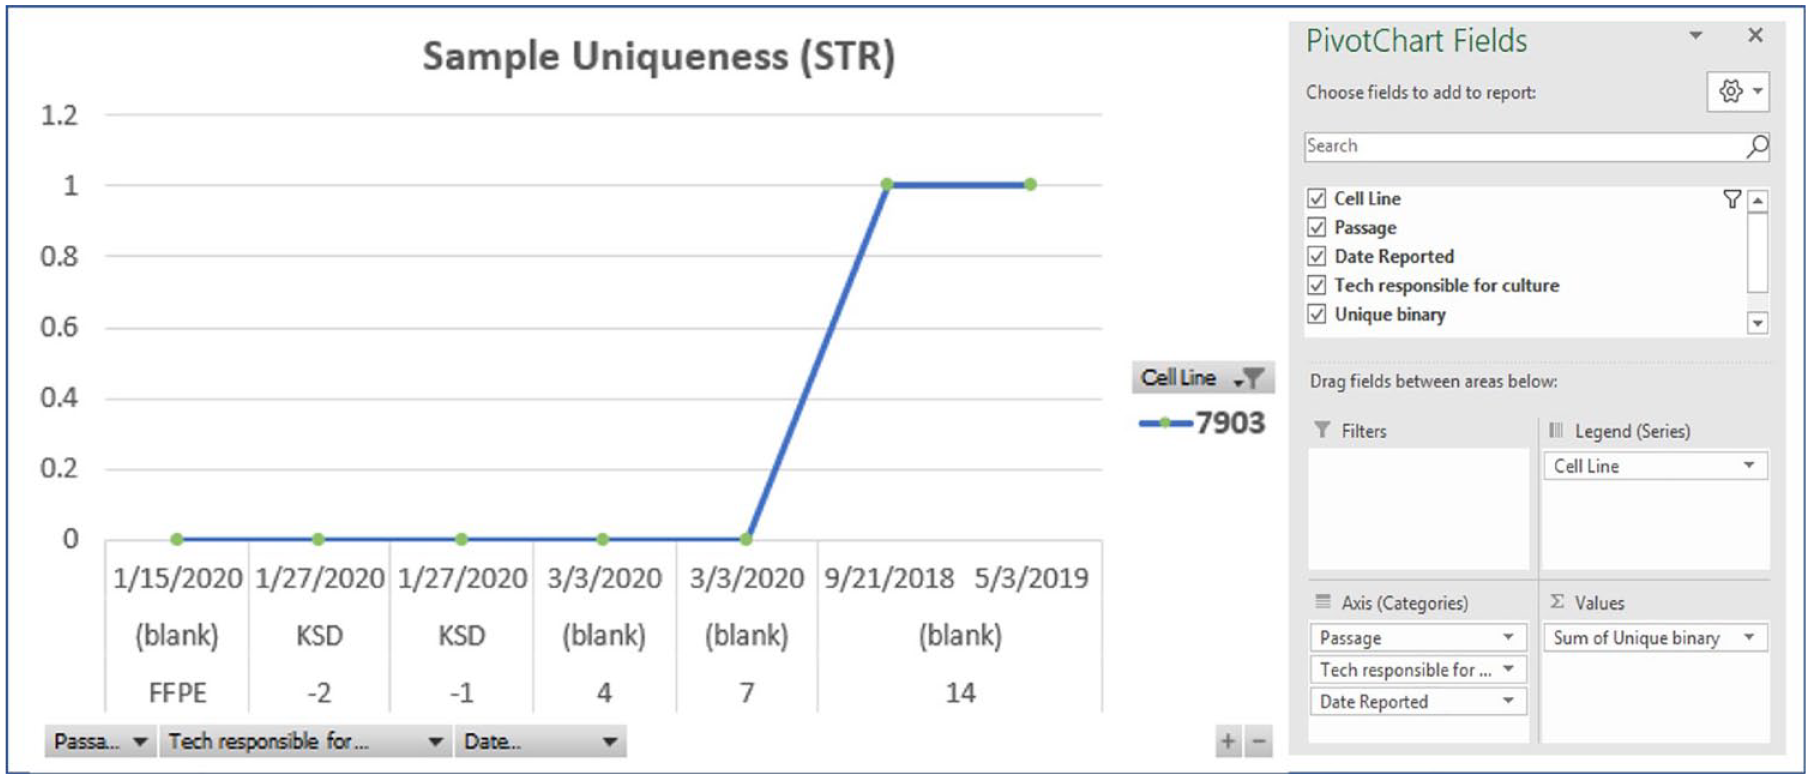
STR PivotChart and fields. Ad hoc representation of sample uniqueness for cell line 7903 over time and multiple passages.
Action Plan
If we determine a cell line is not unique, we perform an investigation to determine how it occurred, which cell line is being represented, and what downstream effects need to be addressed. If we isolated DNA at culture initiation or from original tissue, we consider it as source material and therefore it is used as our standard for comparison. In many cases, we obtain FFPE samples directly from patient tissue for verification if necessary. If the cell line in question matches an original sample from another cell line, we consider it compromised. We reference the traceability PivotChart to ascertain how many passages we tested and when the change occurred based on the results. For instance, if passage 3 had the same profile as the tissue sample and then at passage 4 the profile matched a different cell line, a problem occurred between passages 3 and 4. If we use cells from the compromised line for experiments, we relabel data with the correct cell line and update any additional documentation. If this is not appropriate based on our results, we may need to remove data from the experimental data set, reanalyze, or perform additional experiments. For example, if the compromised cell line were derived from a melanoma tumor and the profile matches glioblastoma tissue, this would alter the analysis of data used for melanoma experiments and must be indicated or removed from the analysis.
Mycoplasma Traceability
Performing Mycoplasma Testing
In order to find a unified process for testing samples for mycoplasma contamination, we decided to validate four mycoplasma detection kits to determine one that was cost-effective and most consistent. We chose these kits based on current usage in our laboratory and kit usage across industrial mycoplasma detection services. We included kits that test using various methods, such as PCR, luminescence, enzyme-linked immunosorbent assay (ELISA), and Visual-PCR (GM Biosciences, Frederick, MD), which does not require gel electrophoresis. We performed repeated testing with known positive and negative controls, which resulted in two kits performing with the most consistency. We performed a cost comparison between these two kits, and the MycoAlert Plus Luminescence kit (Lonza, Morristown, NJ) was less expensive per sample than the LookOut PCR kit (Sigma-Aldrich, St. Louis, MO). Other components, such as controls, 96-well plates, and DNA polymerase, added cost for their respective kits, but these were minimal. We can perform the MycoAlert kit in 20 min, which is an added benefit, considering the PCR kit takes approximately 2 h. We dilute the MycoAlert kit positive control 1/10 to reduce signal. This prevents light spillover, which can lead to erroneous results. Dilution of the control also reduces the cost of testing with this kit.
We screen cell cultures at the first passage following culture initiation. This includes frozen stocks, tissue samples, or samples received from an external source. We designate one technologist to run the assay for any samples accumulated on a weekly basis; however, we trained multiple technologists to perform the test. As an alternative to running tests internally, external providers exist to run samples for labs. We found it cost-effective and prompt to run them internally, considering we had the staff to perform the assays.
PivotTable
We enter all mycoplasma results into a “Data Entry” tab in an MS Excel spreadsheet. We use these data to create a PivotTable of valuable information, namely, the date the sample was isolated, testing date, cell line, passage number, mycoplasma value, and the technologist responsible for the sample ( Fig. 4 ). We use conditional formatting for the “Result” column to change the color of the field if the value is not negative. Borderline samples appear yellow, while positive samples appear red. The value remains visible in the field so the user can interpret results if the colors are difficult to see, and a key with kit ranges exists at the top of the spreadsheet for reference. This tool immediately alerts the person entering data to an undesirable result.
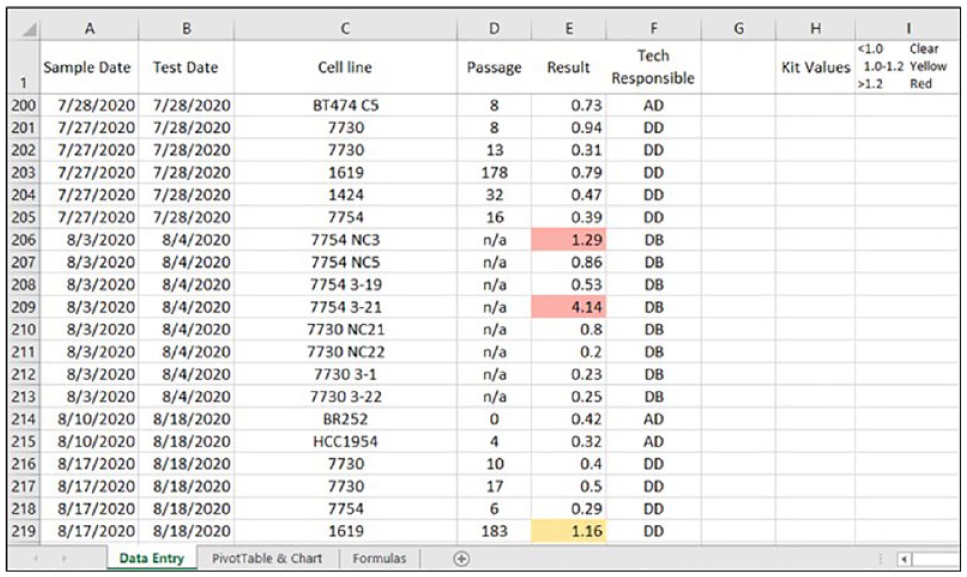
“Data Entry” tab. Structure of the “Data Entry” tab used to create a PivotTable.
We automatically divide the mycoplasma values from the “Data Entry” tab into groups based on the Lonza kit ranges for negative (<1.0), borderline (1.0–1.2), and positive (>1.2) results using a calculated field matrix in the PivotTable ( Table 1 ). A value in one column will negate values in the other columns.
Calculated Fields.
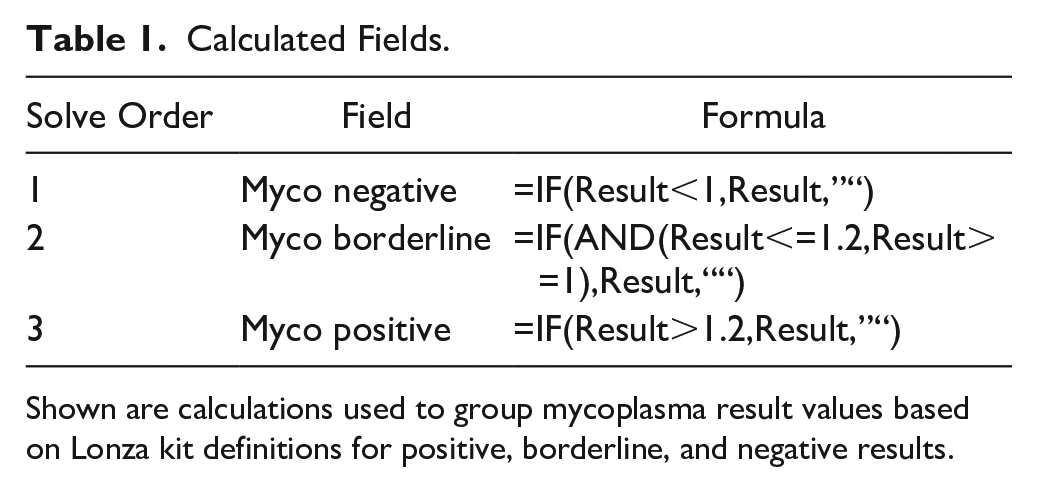
Shown are calculations used to group mycoplasma result values based on Lonza kit definitions for positive, borderline, and negative results.
PivotChart
We designed the PivotChart to show mycoplasma results obtained in our laboratory over time using the Lonza kit. We can click buttons that appear below the chart to select our desired data. We can filter each column provided from the PivotTable in the PivotChart. The values of mycoplasma results are represented as bars in three colors: red for positive, yellow for borderline, and green for negative. The values are also shown above each bar for clarity. The information directly below the chart is listed in order from bottom to top in conjunction with the buttons along the bottom from left to right (“Cell Line” is the far-left button and is listed as the bottom data set). A button will show a funnel icon to the right when we filter the data ( Fig. 5 ).
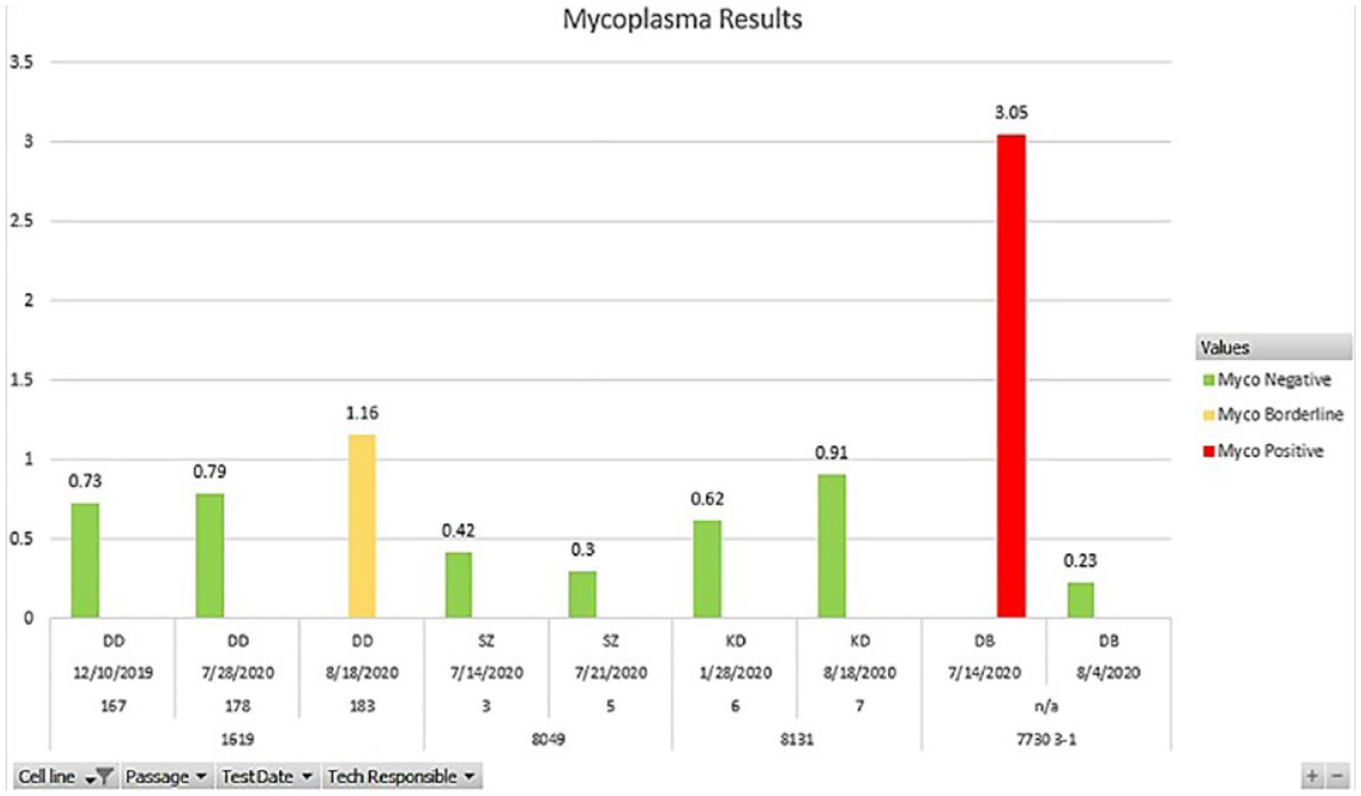
Mycoplasma PivotChart. An example of multiple cell lines, their passage numbers, testing dates, and technologists responsible for these cultures. Here one sample is borderline, one is positive, and the rest are negative. The “Cell Line” category has been filtered as represented by the funnel icon on the “Cell Line” button.
Analysis
Once we enter data into the document, the technologists that provided samples are notified of the results immediately. We continue to screen cell cultures considered negative for mycoplasma contamination monthly while they are in active culture. We also screen cell cultures at time points we consider critical for the culture, such as vial thaw from nitrogen, cryopreservation, drug treatment experiments, gene expression manipulation, and transfection. Cell cultures we consider borderline or positive for mycoplasma contamination are subject to our action plan. This plan is written in a laboratory-wide policy containing kit instructions, guidelines for testing frequency, positive sample treatment, and traceability documentation.
Action Plan
We discard mycoplasma-positive cell cultures whenever possible, such as when we can thaw a mycoplasma-negative, cryopreserved sample as a replacement. We quarantine samples we consider borderline and retest them according to kit guidelines.
Though it is extremely rare, some irreplaceable cultures may not be discarded if they are mycoplasma-positive due to their value as patient-derived cell lines. The investigator responsible for the culture may choose to treat it with commercially available antimycoplasma treatment reagents. We label cell cultures considered positive or borderline for mycoplasma and move them to our quarantine incubators located in the adjacent room to our culture suite. We designate one cell culture incubator for mycoplasma-positive cultures and another for untested and borderline cultures. We treat contaminated cultures and screen at every passage until they are considered negative for contamination. We manipulate these cell lines in a BSC designated for quarantined or untested cultures during this time period. Cell lines manipulated in this BSC are addressed in a specific order (untested, borderline, then mycoplasma-positive) when multiple cultures require attention. We do not consider treated cultures to be “cured” or mycoplasma-negative until we have screened cultures in the absence of treatment reagents with two consecutive results of less than 1.0.
Results
Devising a plan for testing and tracing mycoplasma and cell line authentication provides valuable information regarding the quality and integrity of our cell lines. Now that we have created and implemented a traceability platform with a central location for our data, we trust our experimental data more than ever. Of the 69 unique cell lines we tested for STR since 2016, six lines had cross-contamination issues that could be traced to specific date ranges and passage numbers. Most of these we could link to one aggressively growing cell line used widely in the laboratory. These passages were discarded. Of the 108 unique cell lines we tested routinely for mycoplasma since November 2019, 90 were negative and 8 were borderline, with 2 testing positive when the assay was repeated. Fifteen additional cell lines were positive, 6 of which were terminated. These were commercial lines, and replacements were purchased. The remaining nine were patient-derived cell lines, five of which had a mycoplasma-negative, cryopreserved vial to replace them. The remaining cultures were treated.
The charts we created are simple visual representations of our data that are easily understood and implemented by our laboratory staff. These tools provide a practical framework for our laboratory staff to follow, which increases the probability of finding issues if they exist. We provided training documents and education to ensure the continued quality of our data and that our entire lab is now performing routine verification. We can disseminate information quickly, making decisions before further contamination occurs, experiments are compromised, and resources are wasted.
Discussion
STR is a robust assessment for cell line authentication; however, it has some constraints that should be noted. Some cell cultures show changes in their DNA profiles after prolonged culture due to possible mutations during subcloning or exposure to passaging reagents and antibiotics. 15 Despite being from the same cell line, the STR profiles may differ slightly. This shows the value of repeat testing over time to discover slight changes, indicating mutation versus misidentification. We can see mismatches and when they occurred by selecting all the cell lines isolated from one patient and viewing the PivotChart. These mismatches are annotated in the columns provided after the allele section.
We can use tools similar to these in other processes in research, such as cell culture viability tracing, culture doubling time, functional testing, and phenotype screening. Microsoft Excel can pose problems with date conversion upon data entry, specifically with genes containing names of months. We have not encountered this issue, as our patient cell lines are strictly numeric. Commercial cell lines, however, are often alphanumeric and genetic modifications noted in the STR traceability document could be affected in the future. To address this, an apostrophe can be used in front of the text to prevent conversion. It is also worth noting that the HUGO Gene Nomenclature Committee (HGNC) has published new guidelines on human gene nomenclature to avoid problems with symbols that affect data handling and retrieval. 16
In an effort to integrate our data, our laboratory is developing additional database tables and queries linking the tools mentioned here to our cell line inventory, which was recently developed. 17 Providing a relationship between testing, tracing, and associating vials in nitrogen storage will be valuable if investigation is needed or purging must occur ( Fig. 6 ).
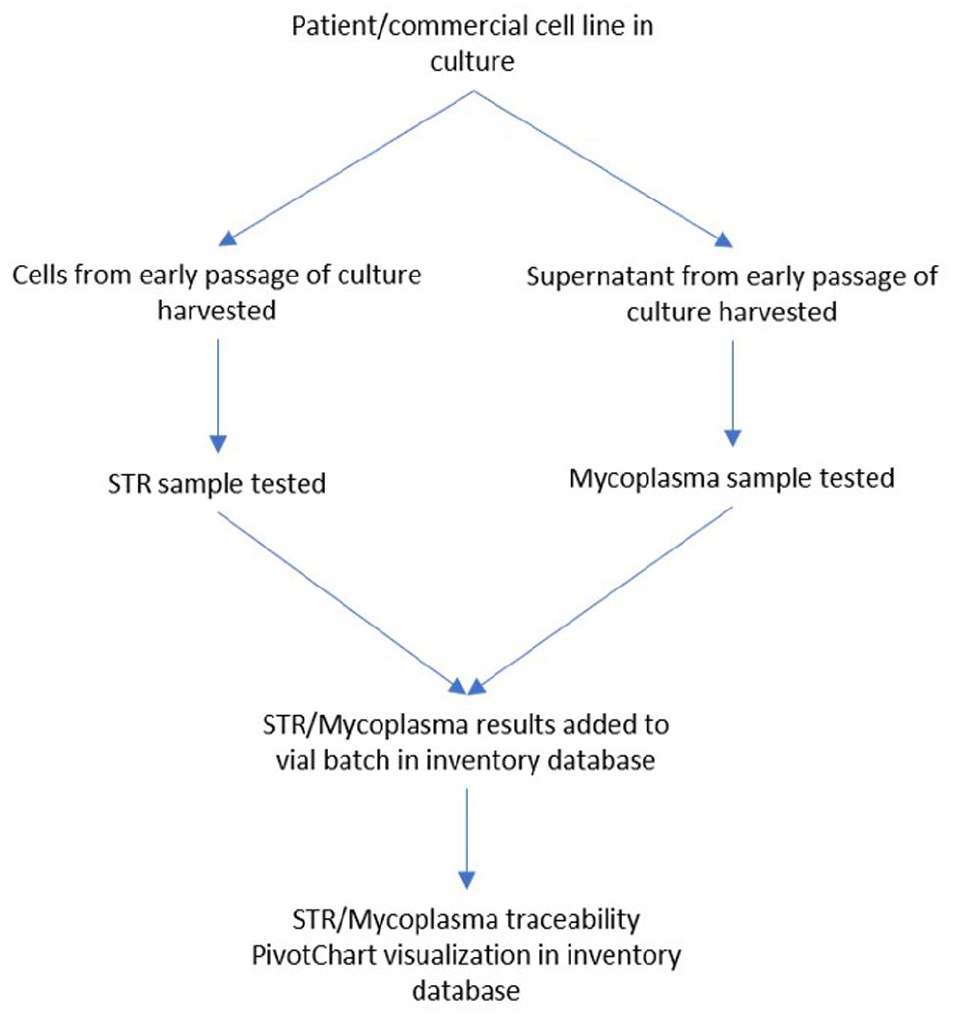
Traceability flowchart. Process incorporating traceability visualizations in inventory database.
Other data may be added, such as genetic modifications, sequencing information, and organoid development progress. This will also provide a better practice for security, as the back end of the database is password protected (tables and queries), while the front end can be used by all staff with shared network access (forms and reports).
Testing and tracing cell lines routinely for mycoplasma and uniqueness provide valuable information for laboratories using cultures for experiments. Trusting the identity and functionality of your cell lines is imperative for quality assay output. Multiple forms of testing exist, providing options for most laboratories, even if they do not have the equipment needed to run them. Each laboratory must determine how to effectively test their cultures without sacrificing time for experiments. By providing a simple tracing tool, we hope this encourages laboratories to perform testing and discover issues before resources are wasted. In addition, there is a growing trend of journals requiring cell line verification, which further supports the practice of testing and tracing. In order to stop the influx of contaminated and misidentified samples in publications, research laboratories must take responsibility for their cell lines, staff, and equipment, and tracing should be included to maintain the integrity of research.
Footnotes
Acknowledgements
Logan Friedrich, BS, participated in the writing and technical editing of the manuscript.
Declaration of Conflicting Interests
The authors declared no potential conflicts of interest with respect to the research, authorship, and/or publication of this article.
Funding
The authors received no financial support for the research, authorship, and/or publication of this article.