
Abstract
Sharing physical laboratory space optimizes resource use among research departments, improves collaboration, and reduces costs. Universal inventory management is essential to successful space sharing, item tracking and availability, and data mining; therefore, our lab was interested in a tool for these purposes. Different research groups have differing needs, priorities, and considerations. We investigated prebuilt inventory management programs, and we found a custom Microsoft (MS) Access reference database to be optimal. We designed a custom MS Access abstract inventory data model around previously established needs with information gathered in staff interviews and meetings. We performed a physical inventory of all cryopreserved samples to allow uniform data entry when migrating to the database. We created manuals and protocols, and the staff was trained on entering data. Using a universal inventory system allows for quick report generation of physical inventory, which in turn preserves sample quality by reducing redundancy as well as time locating vials. Users can run queries to report a wide range of sample characteristics. Storage information can be easily analyzed for statistically significant trends, samples have reliable traceability, and data are auditable for accuracy.
Introduction
Many small laboratories have homegrown methods for tracking asset inventory out of necessity. The chosen methods can vary widely due to lack of resources, including money and knowledgeable staff, and may include digital or paper methods, or both. There are many commercial options available, ranging from free cloud-based applications to expensive proprietary databases. Some are more suitable than others depending on the needs of each laboratory, such as whether maintaining molecular sequences, strains of yeast, chemicals, animals, or all of the above is involved. 1 Security restrictions also limit some institutions, as in our case. We are part of a very large healthcare organization; thus, cloud- or web-based services were not an option due to user rights restrictions, firewalls, and shortage of information technology (IT) support. Selecting a system takes time and thought, and should involve multiple stakeholders to increase the opportunity for success.
In our institution’s translational research laboratory, we receive, process, and culture de-identified tissues from consenting surgical patients to create stocks for experimental purposes. We also purchase commercial cell lines for research purposes. As is typical of many labs, cell lines are frequently cryopreserved throughout the culturing process. Our laboratory serves multiple research areas (representing various clinical service lines, such as cardiovascular, oncology, and neuroscience research) and principal investigators whose methods of cryopreservation and sample tracking differ. Accumulation led to a storage capacity shortage. Budget restrictions and lack of available lab footprint prohibited adding storage space, requiring reallocation of samples in the current capacity. Historical variations among departments and tracking methodologies had produced inaccurate records, misallocations, and other difficulties, such as storing excess vials, purchasing unneeded cell lines, and retaining ambiguous or suspicious vials. This created added challenges for the success of this project.
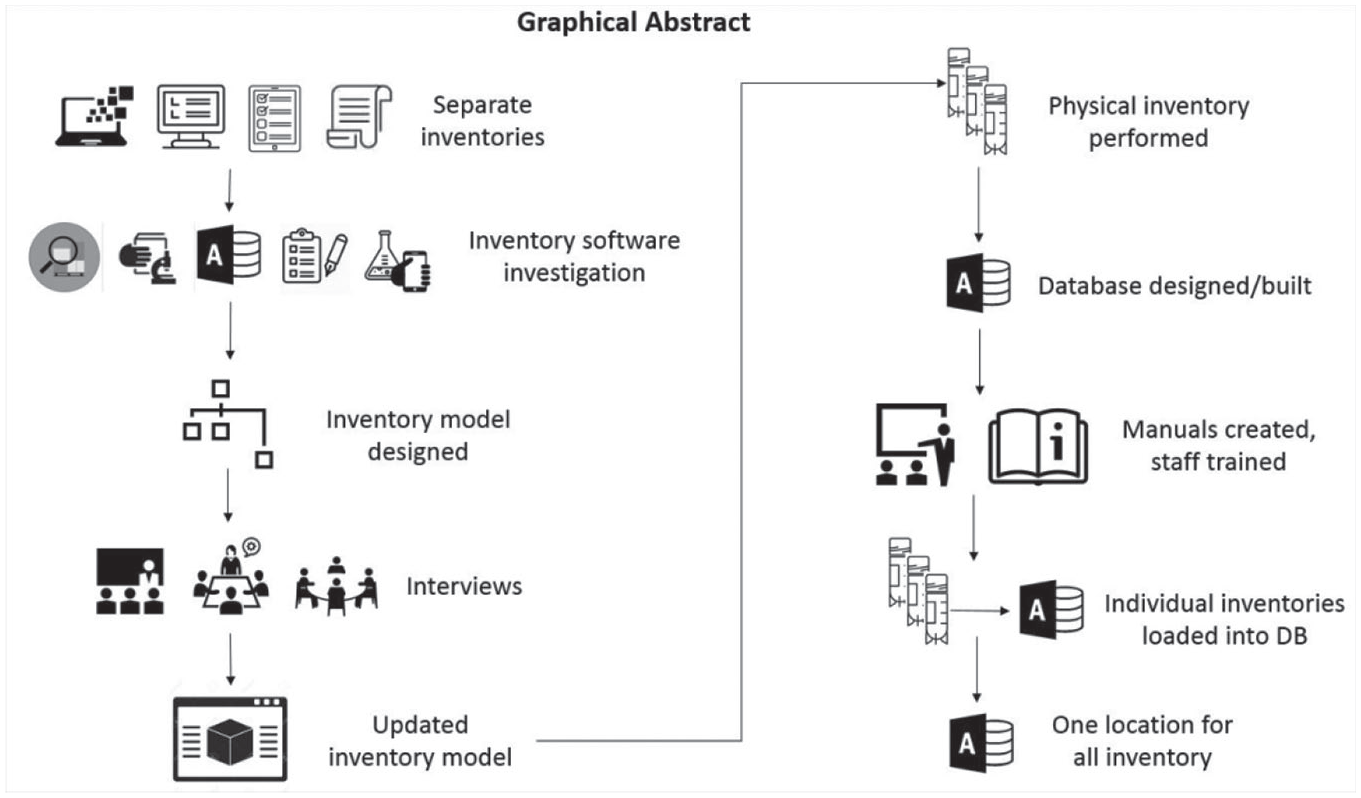
Graphical depiction of manuscript abstract.
To rectify these problems, it was necessary to perform a physical re-inventory of all samples. This helped us better understand what was being stored as well as individual department needs, allowing a purge of excess samples. This also provided insight into possible areas of improvement to build into this storage system (
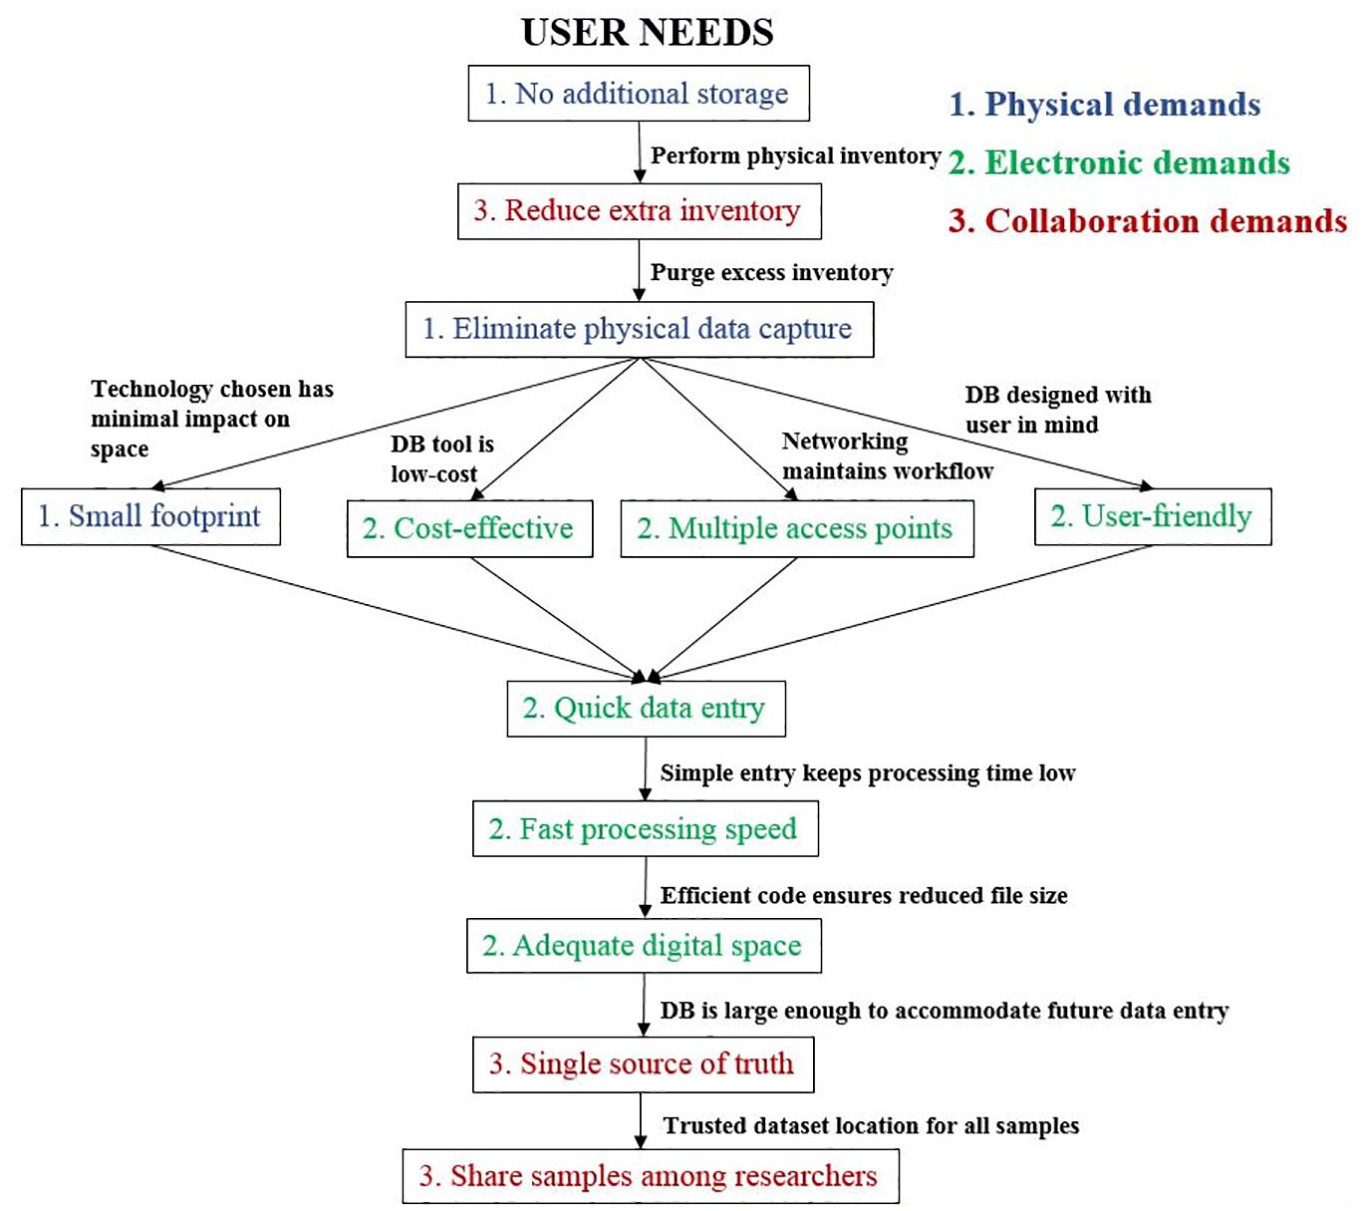
Flow chart representing user needs identified in the planning phase of development. Needs were addressed in the order shown here and are organized by the type of demand established.
Database User Needs: Requirements Proposed by Users for the Inventory Management System in Three Categories: Physical, Electronic, and Collaboration Demands.
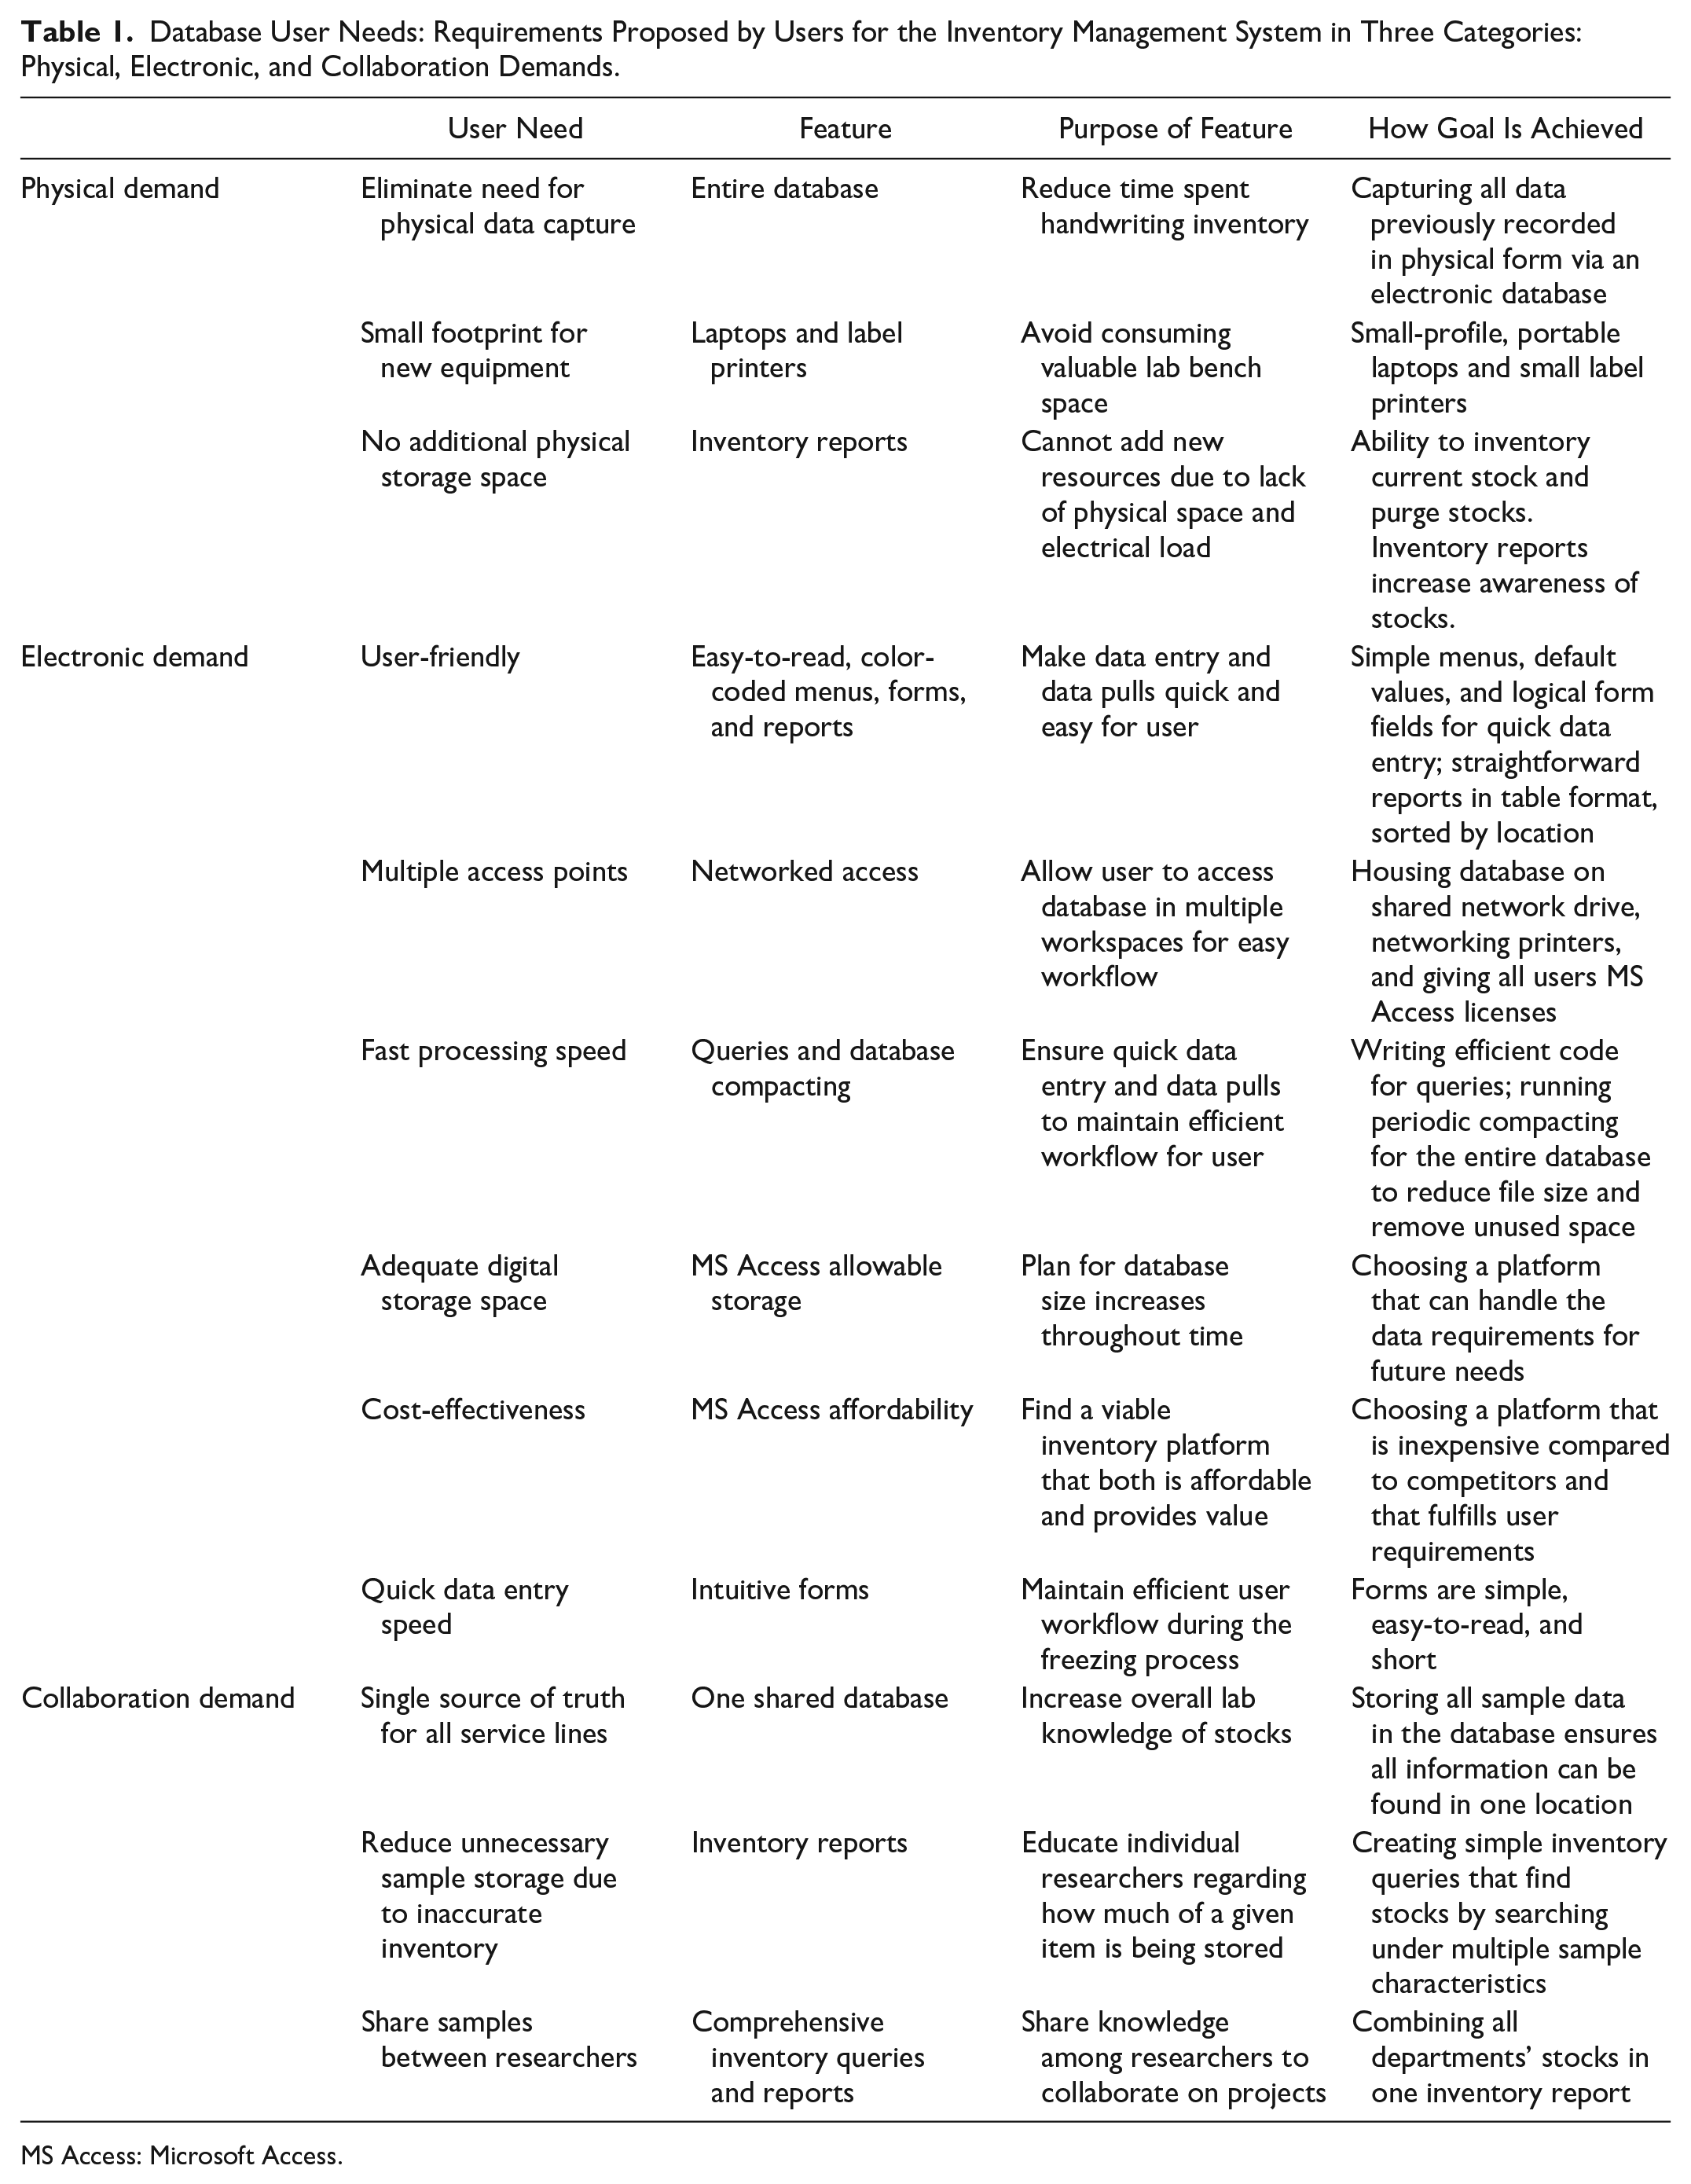
MS Access: Microsoft Access.
Materials and Methods
Database Model Design
To provide a framework for development, we followed general software development life cycle (SDLC) concepts throughout the database-building process. 2 These concepts assist with assigning all requirements, estimating timelines and deliverables, providing thorough user training, and boosting user engagement, all of which increase the possibility of success. The phases in many SDLC modeling paradigms include planning, defining (requirement analysis), designing, building, testing, and deployment, with some models including a maintenance phase. 2 Typically, there are multiple iterations of the designing, building, and testing phases. Some models combine steps, such as the feature-driven development (FDD) model, which combines designing and building into one phase.
We did not strictly adhere to any specific SDLC model, but our process loosely followed the FDD method. This is an iterative process that is used for each feature of the project that is identified in the initial modeling stage. 3 We chose this model over a traditional iterative model because it focuses on developing each feature desired by the users as an entity, because some of these are complex. This model also requires frequent communication with users as they review each iteration, providing transparency. Quality is enhanced because of frequent testing and user input. Examples of features include adding multiple vials to the database, removing vials, and viewing vial inventory. Users identified valuable features that were used to create a master list for future planning and design. 4 We then planned, designed, and developed each major feature individually. We identified major and minor features by their effect on the system. We defined major features as those having downstream effects on queries or tables, whereas a minor feature had a small impact on the system, such as an update required to a form or report. We performed thorough testing after each feature was built, then the next feature was selected and processed. We repeated this cycle until all features were developed and tested, then we performed system testing to ensure proper integration among features. We conducted additional interviews to demonstrate current development as well as identify new ideas and needs of the users. A few more minor features were determined, so the process was repeated to add them. We repeated this process until only minor features were identified by users, which in our case was four times. We updated the system with these last features, then deployed it. Our team had the advantage of working in proximity, with frequent communication, which kept the process moving and gave us the ability to quickly address concerns and questions when they occurred.
Planning and Initial Modeling
The first phase is used to identify needs and gather information. To map out the structure and use of this inventory database, we identified key stakeholders, and we performed interviews to identify goals.5,6 The designer created an initial logical design of the database to use while conducting interviews. We conducted meetings with potential users both as one group and divided by individual service lines. A list of basic features to design and develop was created from this process, including adding vials, removing vials, and displaying inventory and available space.
Inventory System Definition and Requirement Analysis
This phase identifies much greater detail required for the development. To define the data management system, several major components needed to be determined: workflow, scope, requirements, system limitations, users, and model views.
6
General concepts were established from the larger group in multiple interviews, then these items were discussed in detail during service line interviews. Needs differed among groups, and this process allowed for customization to address them individually. In addition, a vial-freezing workflow was created to understand the overall features of the system. The movement of one sample was tracked and mapped to represent the overall process (
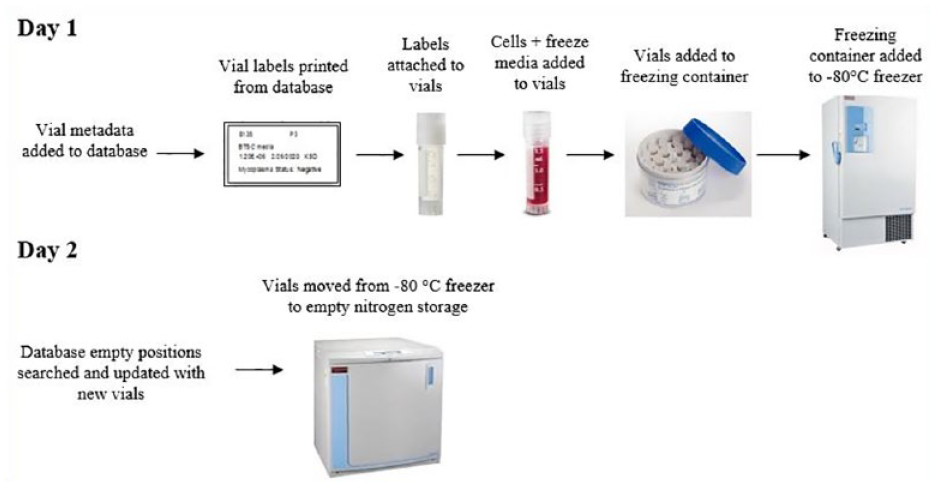
Vial-freezing workflow. Shows the pathway a single vial takes during the cryopreservation process in the lab as well as critical data entry timepoints.
Physical Requirements
Key stakeholders identified the following physical requirements for this database: multiple networked label printers in strategic locations, shared drive access, and several laptops with MS Access licenses.
Networking components allowed database accessibility and adherence to a vial-freezing workflow. Each user gained a license for MS Access to enter data from their computer. We added multiuser, networked laptops and label printers near culture rooms for data entry prior to freezing, and the MS Access database was placed on a shared network drive to which all users had access. Storing the database as a file on a shared drive provided a good balance between having the power of a database without having to provide the support for a web application. This also encouraged best practices for data management due to accessibility and backup ability from which many labs would benefit.
Feature Requirements
The database features that were required and were of equal importance included: service line–specific menus, batch vial entry, vial tracing and tracking, vial removal and relocation, inventory reports, storage location reusability, available space identification, historical vial master data storage, search capabilities, auditability, and entry error prevention measures. Vial tracing follows the metadata of vials—such as the technologist freezing a vial, the passage number of the vial, and the cell line—for investigative purposes. Vial tracking follows where the vial has been and where it is located currently.
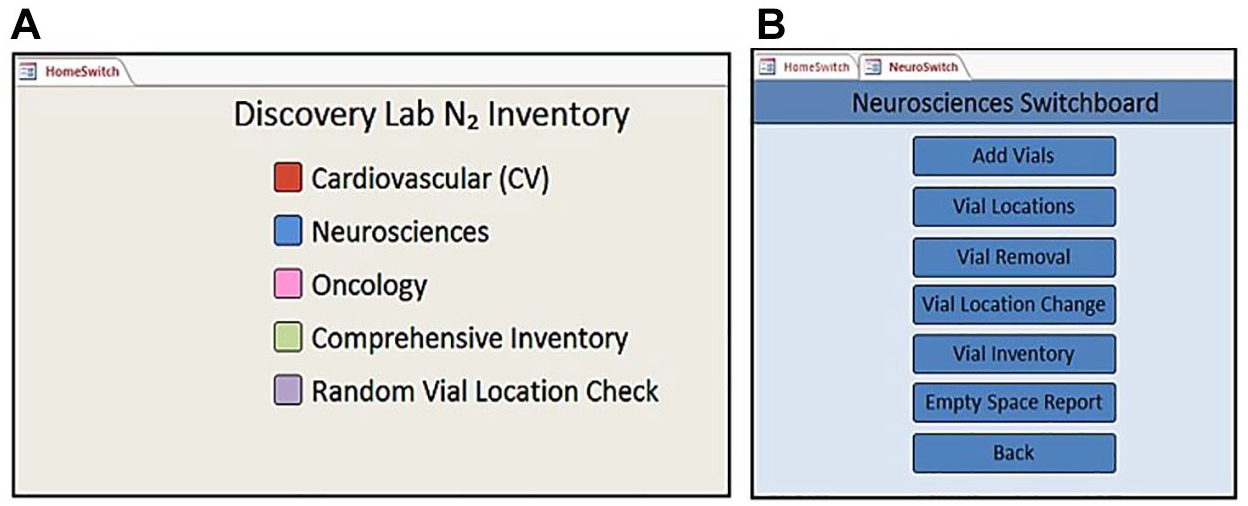
We kept service line vial data separate from each other to assist with traceability. Samples can change hands multiple times in our lab; thus, separating menus also provides accountability. All menus and forms are labeled by service line and color-coded to introduce control to the system. These are used as visual cues for users to adhere to their designated areas in the system. Prohibiting access to different service lines was deemed unnecessary.
We used multivial (batch) entry to trace freezing of multiple vials (containing the same master or essential data about the vials) at one time. This is critical, because the time to enter individual vials would be tedious, error-prone, and detrimental to the cells. At this timepoint in the workflow, a final concentration of 10% DMSO has already been added to the sample(s). DMSO is toxic to cells at room temperature; therefore, vials must be frozen quickly. When a single entry of master data is added to the Add Vials form, an append query runs to create multiple instances of the data based on the value entered (see
We traced vial-freezing dates to study emergent trends, such as comparing the effect of time between initial freeze (−80 °C) and transfer to nitrogen against cell viability after thawing. This may highlight improvements needed in cell-freezing manipulation. In addition, if contamination occurs, this could be traced to a batch of vials frozen at the same time, alerting investigators to the possibility of affected samples.
We accounted for consolidation of inventory when vial removal occurs; otherwise, empty space would be randomly available and difficult to discern. To easily remove or change the location of vials in the database without re-entering vial master data, we designed separate forms and queries for each service line to update the location of one or multiple samples. Consolidation is still done manually, but this tool aids the user to expedite the process.
Our reports needed to be capable of showing all master data of vials and their locations. Inventory needed to be searchable by service line or comprehensively as a lab, with many attributes of a vial searchable within the report, such as vial name, tumor type, primary diagnosis, passage, date the sample was received, date the sample was frozen, and vial location.
After removal of a vial from the physical inventory, that position had to become available for new vials. We created a removal query and form to search for a vial being removed and to update the vial’s active status (see
Locating empty positions within the freezers optimizes the freezing workflow, avoiding a physical search. This increased efficiency and preserved freezer temperature integrity, in turn reducing supplied nitrogen use, lessening environmental impact, and saving financial resources.
To ensure traceability for later analysis, such as when tracing contamination, historical data are not deleted from the database when a vial is removed. This information is searchable, but access to the table is hidden to protect its integrity.
To give the user options if basic information is not known (e.g., location, passage number, and freeze date), we made most attributes of an individual vial searchable. We built fields in inventory search forms to be “unbound” to query the entered data comprehensively and without using a lot of processing power (see
We put several audits in place to help maintain the integrity of the database structure and the vial master data. For example, a “random vial check” query was designed to be performed on a routine basis. In this check, the database chooses a vial with a random number algorithm, the vial is displayed in the database with all connected information, and a physical check of nitrogen storage is done by the user to confirm the location of the vial. If the vial is present, no further action is taken. If the vial is not present, a physical inventory of that box is performed (
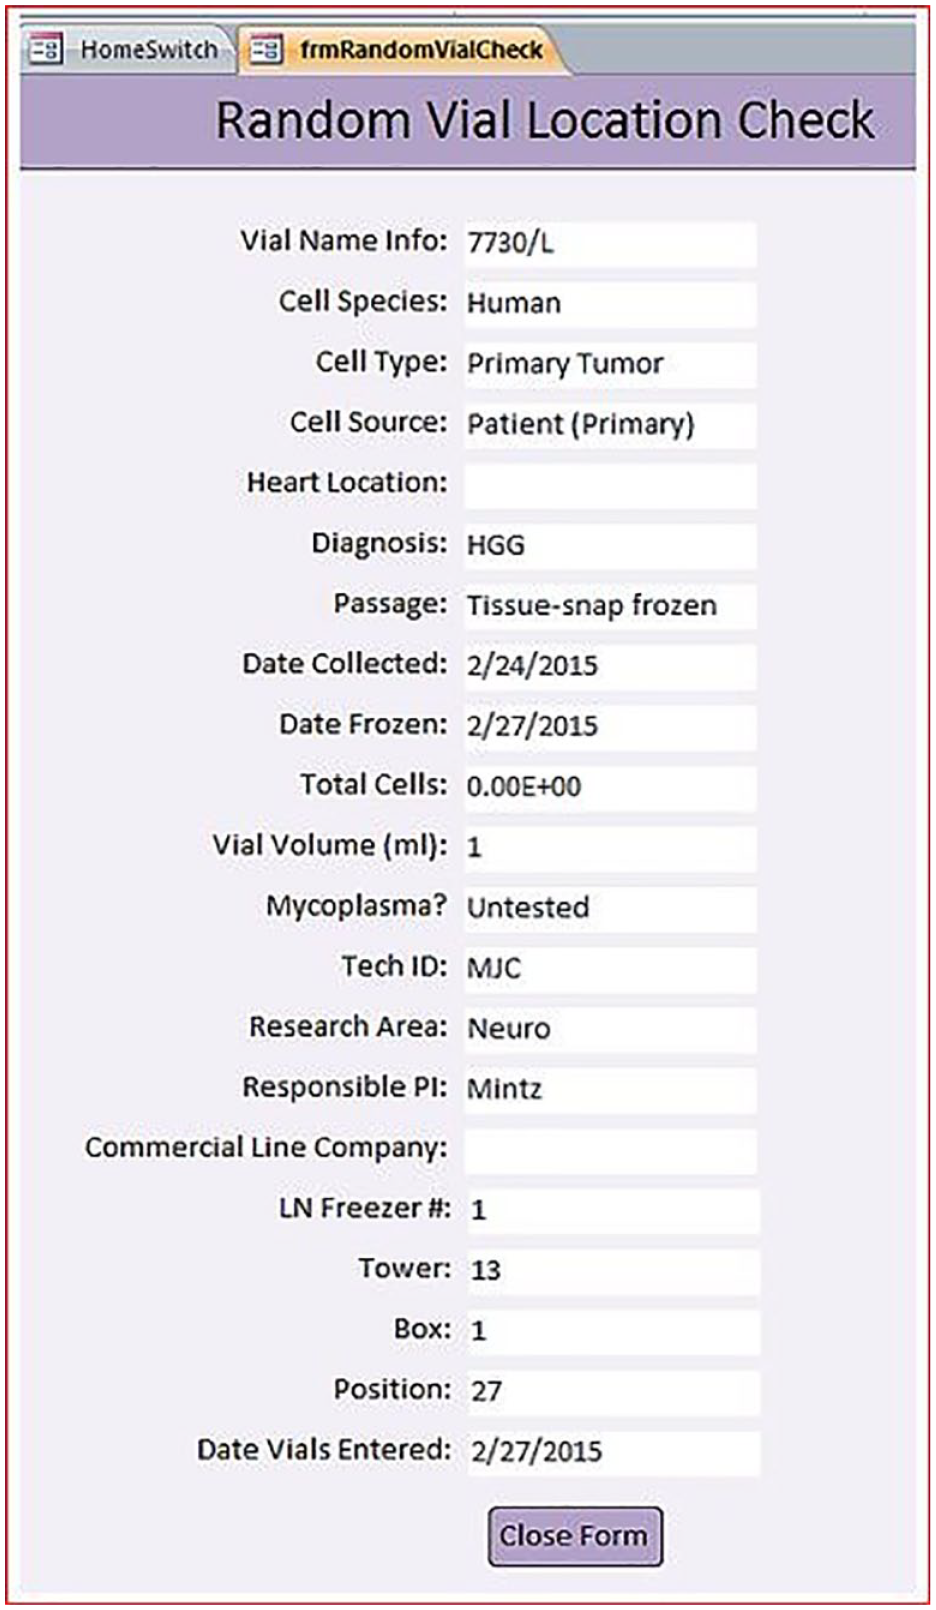
Random vial location check report. An example of a random vial queried by the database for auditing purposes. The freezer location is checked for the vial listed to determine whether the database information is accurate.
We identified mandatory fields in each form during the interview process. Required fields were designated by an asterisk for quick data entry. We added parameters to field definitions to ensure error checking would occur after entry, such as when characters are entered in a numeric field. This ensures popup error boxes will appear so that the user can correct the error. Free-text boxes provide little structure, making searches difficult, so they were included only as exceptions when necessary: If we could not break down information into pieces using dropdowns or other automated fields, we used a free-text field.
After we identified user requirements, the granularity of each table in the database was determined. Key concepts were standardized vial information, storage attributes, vial removal date and justification, and empty-storage position identification. Based on these needs, we identified the following tables (see
VialInfo: Contains all metadata about a set of vials with identical attributes.
Numbers: Replicates the number of vials in a set to populate the storage table.
Storage: Lists each vial from a set to identify individual freezer box positions.
Removal: Contains information for a vial when it is taken from the freezer.
Inventory: Combines tables above to provide a template for the Empty Space table.
Empty Space: Locates available space in the freezers.
Designing and Building
Database Structure
We created the structure of the database using most objects available in MS Access: tables, relationships, forms, queries, and reports.
We designed tables to accommodate the vial-freezing workflow, which required identifying information (date, tech ID, etc.) to be entered into the database at the first timepoint (day of −80 °C freeze). This involved creation of one table and the location information to be entered in the database at the second timepoint (liquid nitrogen entry). Other tables were required to identify empty space in the nitrogen freezer, vial removal information, and batch vial entry. Relationships were used to link key fields in tables without creating redundancy. We created tables and their relationships based on the vial-freezing workflow as well as requests from users and other key stakeholders (see
We used forms to input data or navigate the system. A “HomeSwitch” was designed to appear when the database is opened, which is the first switchboard menu seen by the user (see
(
We used queries to link data, perform specific functions, and build reports. Each service line has similar queries, but each caters to their needs by presenting tailored information. Structured Query Language (SQL) was used for most of the queries due to the complexity required.
2
Reports contain database information that permits sharing knowledge about its contents. We built information needed by each service line into individual reports. Examples include general inventory, empty space in each box in the nitrogen freezers, and labels added to vials during the freezing process. The empty-space report is used to find empty positions in a 9×9 (81-position) cryovial box, thereby preventing searching through the freezer to locate space. We designed the search tool by filtering a query to find locations that do not have an active status and are tailored to each service area (see
In addition to the objects available in MS Access, we considered other components to maintain integrity, such as system constraints, execution (translation of design to build), control, and usability.
System Constraints
We added integrity constraints during the design process to keep users from creating errors, reduce processing time, and prevent duplicates from entering the system, all of which can cause undesirable downstream effects. Simply put, there are many types of rules enforced on the data. In this database, we address field constraints, entity integrity, and nulls specifically, but more complex constraints may be necessary for a new database depending on the needs of the system, such as UNIQUE, domain, participation, and mapping constraints. 2 “UNIQUE” constraints prevent duplicate values in specified columns, which was not required in this system. Domain constraints used were standard: defining the data type of a field, such as an autogenerated number, and assigning it as a primary key. Participation and mapping constraints are used traditionally in this database; the relationships created between tables did not require much complexity.
We used field constraints to determine what limits are mandated by each type of field. We also asked users to identify limitations they would impose for their purposes, and a consensus was reached based on commonly desired constraints. An example of constraints placed for this lab’s purposes is prohibiting more vial entries than a freezer cryovial box can store. If any number outside this range or any non-number character is typed into the “Position” field in the Storage table, an error popup appears. Another imposed constraint we used was to limit free text whenever possible. Dropdown menus were used throughout the database to avoid typing errors, so when queries are performed, searches will be more accurate. 9
Entity integrity ensures that no primary key within any record is null, 2 meaning each record has an autogenerated number. In this database, we used an autogenerated number in the primary key field. We designed this to take the burden of creating a unique value from the user.
Nulls are not considered zero and are used when there is no value present, or the value is unknown. 2 We used nulls here to designate when a vial has been removed. The vial location and the active status are combined to create a unique record; therefore, the active status cannot be binary, or the position can only be used twice (one active vial and one non-active vial). The active status must be null when a vial is removed so that the position can be used repeatedly. The vial information from a removed vial still exists in the database, and its data can still be retrieved, but that vial will no longer be included in searches pertaining to “active” vials. We chose this setup to allow data storage of legacy vials for traceability purposes as well as reuse of a position in a given box. Typically, in this database, dropdown menus included “unknown” as part of the list, so an entry must be chosen to avoid nulls.
Execution
We translated the layout and mockups into MS Access first by creating tables and building table relationships, then by creating forms, followed by generating queries and reports. Each feature required several of these components. To manage change, we built multiple versions of this database as changes were made and features were developed. 6 Each version was identified with a version number and was saved on the assigned network drive to preserve it if a change or addition caused functional problems.
Control
We included multiple elements to add control to the system and avoid unnecessary input. For example, the backend of the database was password-protected to safeguard data in the tables. Also, to reduce errors, we hid the navigation bar at the frontend of the database to keep users from editing objects. All objects in the system are visible in the navigator, including tables, which can be altered only by the administrator in the backend. We provided an administrator manual that included instructions for “unhiding” the navigation bar should editing be necessary. We created a user manual and administrator manual to help new users learn the database and allow designated administrators to edit the system when needed, provided a backup was created immediately prior. The backend is password-encrypted and known to administrators only. This was intended to reduce errors in the system and allow for changes should errors occur.
The backend of the database was placed on a secure network drive provided by our institution, which is backed up every 2 weeks. Because our lab receives 1–4 samples per week, which are then processed and cultured for weeks prior to cryopreservation, this was deemed an acceptable frequency for backup. Should a dataset need to be backed up more often, the administrator can maintain a copy on the network, or a copy could be stored on a shared, encrypted USB drive.
We placed a copy of the frontend of the database on each computer in the lab. Users are validated in the system by their network credentials and access to an MS Access license, which requires manager approval. Their tech ID is also entered in forms when adding or removing vials from the system. Users are also associated with their respective research areas by selective dropdowns in each of the service line forms.
Usability
We wrote an administrator manual for several designated individuals who were given special training on backend concepts. If changes need to be made to the database, these administrators are the only people who are trained to implement them. A user manual was also created for the general use of the database. This includes step-by-step instructions for each task that a user will need, as well as screenshots of menus and all database objects the user requires.
For ease of use and to maintain database integrity, we assigned each service line a color to designate its respective menus, forms, and reports (see
We used macros and Visual Basic for Applications (VBA) throughout the database to increase usability.
10
Macros were used to create buttons to open and close forms and initiate simple queries. VBA was used to initiate popup boxes as reminders for users after certain button clicks (see
Due to occasional high-quantity vial entry, we created a special table to allow multiple vials to be entered at once. If a user needs to freeze 50 vials with the same content (cell concentration, passage number, date, etc.), it is not efficient to enter each vial individually, so we designed batch entry. When the batch is frozen at −80 °C, it is given an autogenerated number when entered into the database, so each batch is unique in the VialInfo table. The Numbers table we created takes the number of vials entered in the “Add Vials” form and creates the appropriate number of rows in the “Inventory” table using an append query. These entries are not unique at this point, because they have not entered nitrogen storage yet. The location in the freezer consists of a composite index (Freezer, Tower, Box, and Position) to make the location and the vial unique when combined. This occurs when the vials are moved from −80 °C storage to nitrogen. We created the Inventory table to house all data regarding each vial, including location. This accelerates performance when running queries and reports.
We added default properties when they were felt to add value,
7
such as using the current date for the “date sample frozen” field in the “Add Vial” form. This is achieved by working in the design mode of the form, clicking on the “date sample frozen” field, and adding the default value in the property sheet as “Date (MM/DD/YYYY)” (
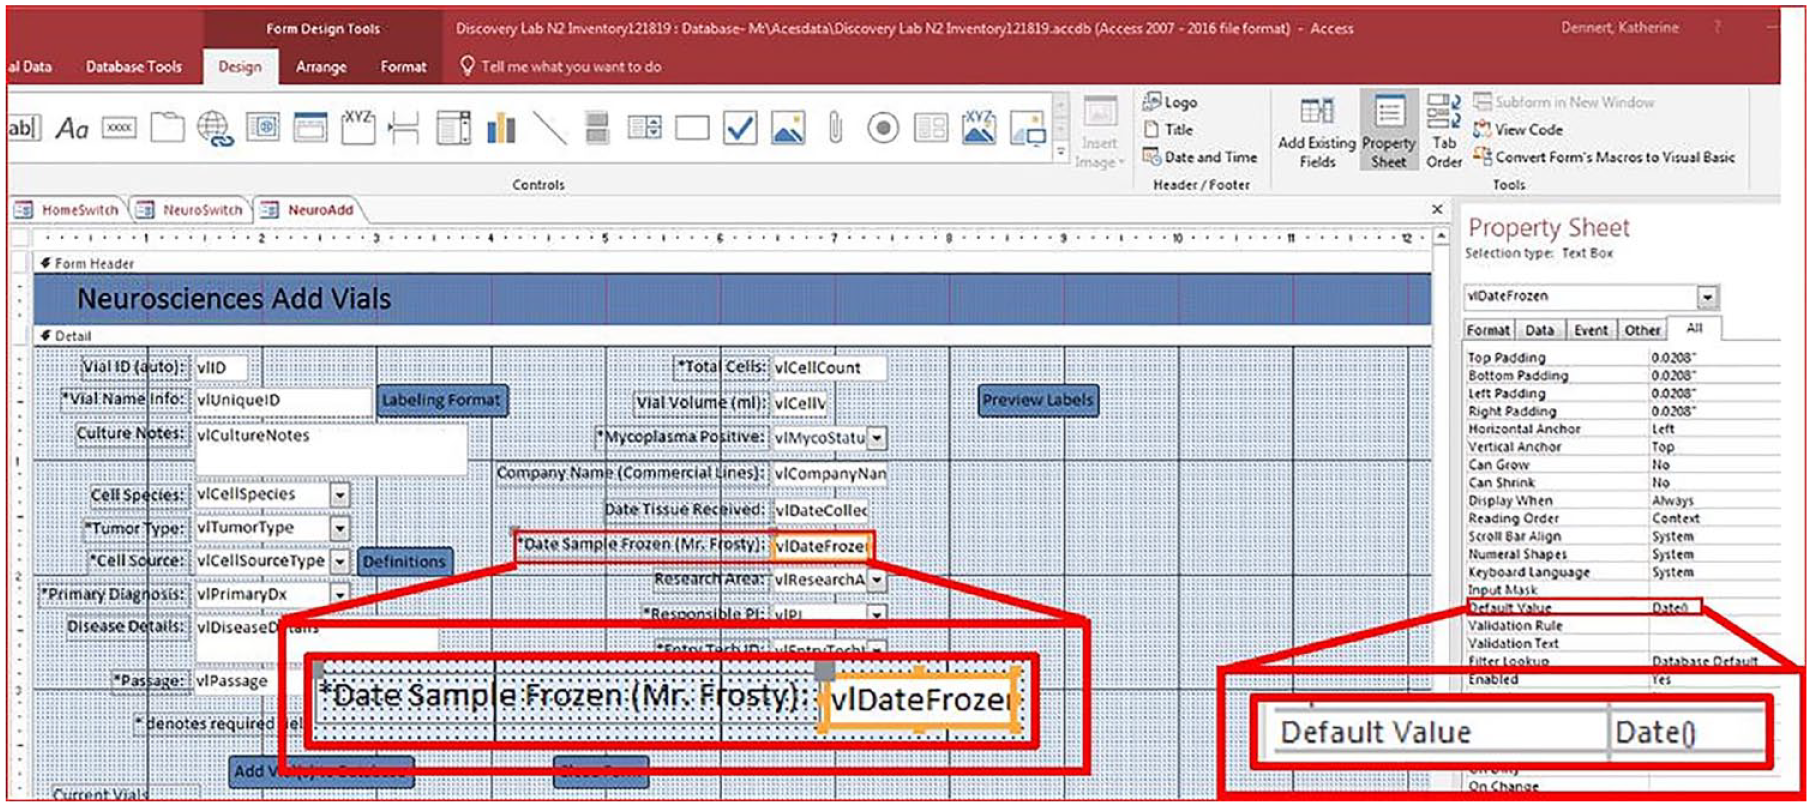
Adding default values. Design view of the Add Vials form for the Neurosciences service line. A “date” default property is shown in a red box in the form and set in the Property Sheet. Using a default value such as a date picker allows the user to be consistent with input and simplifies entry by providing a calendar next to the field.
When entering vials into the database prior to −80 °C storage, labels can be printed in the form of a report to add to the vials. Once the “Add Vials” form is filled out and data are added to the database, a “Labels” button can be clicked to generate labels on liquid nitrogen–proof stickers. We use the number entered in the “Number of Vials” field to generate the number of labels. This number can be bypassed if extra (or fewer) labels are needed (
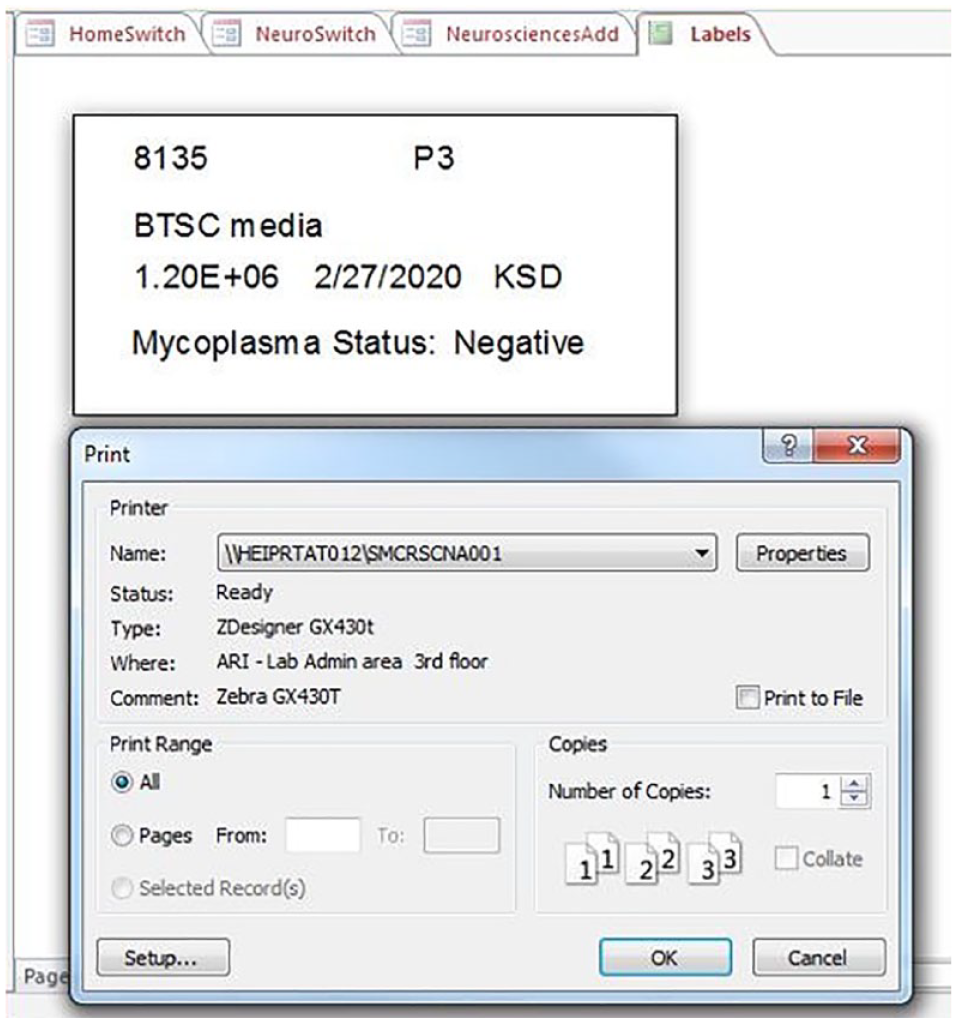
Label report. An example of a 0.75×1.5-in. label autopopulated by the data entered from the Add Vials form. Once the “Preview Labels” button is clicked in the form, the label report appears with the “Print” menu to select the appropriate label printer. The query is written to print the number of labels associated with the number of vials being entered.
Testing
Functionality
The testing phase provided a structured approach to discovering functional problems within the database. We tested functionality throughout the build-and-design process and during implementation. We rigorously tested each iteration of the database after a new feature was added or a major change was made to validate the integrity of the system. At least five examples of test master vial data were entered in each service line of the Add Vial and Vial Locations forms, then VialInfo and Inventory tables were checked for updates. We added mock locations to these entries, including locations already in use. This tested the empty space query integrity and popup error boxes. The test entries went through location changes, vial deletions, and inventory searches, including confirming which research area showed vials in their inventory. Empty space was confirmed again. We tested each non-free text field in all forms with an incorrect value to determine if error checking was functioning. If we found errors during testing, we made changes, and testing was repeated.
Once all the features identified from the initial interview process were designed, built, and tested, we introduced the most recent version of the database during additional meetings, and the key stakeholders were encouraged to critique it. We discovered additional features as a result, and we repeated the design-build-test process for each of them. When only minor features were identified by users, we stopped the design-and-build phase and prepared for deployment. We cataloged any additional features for future deployments.
Deployment
Database Release
Once all features of the database were designed and built, and passed each testing phase, we released the system for use. Users were not given the opportunity to use the database in stages, as some SDLC models allow, due to dependencies and overall complexity of the database. We gave the manual to users, and they were trained in small groups to address individual questions. Any issues during training were identified as quickly as possible to ensure user confidence in the system, and one-on-one training was provided as needed.
Maintenance
Production Environment
We also incorporated maintenance of the database into the model, which includes repairs and upgrades to the system. The designer monitored the usage of the system to identify issues. Any known bugs were fixed, and users were encouraged to communicate any concerns. If a user error occurred, we made a determination to retrain the individual, update the manual, or make a change to the database, depending on the problem. We made small enhancements to assist the user or quicken processing time, such as writing more efficient queries to make searches run faster. Documentation was updated if changes were made.
When we need to make changes to the system, a backup is created that will be used for design and testing. Once changes are made and tested, we notify staff, and, if changes affect the backend, the backend of the database is pulled down from the network drive. Upgrades are migrated to the database in use, and the backend is reloaded to the network drive. If changes affect the frontend, we give all staff the new version for their PCs, and the old version is removed. Adding new or changing service lines requires a few additional forms but very few changes to tables by updating a small number of lists. We capture different vial sizes via the vial volume field in the Add Vials form, and new fields can be added if new data need to be captured.
The cost to maintain the system is low. Licenses for MS Access are about $100 a year per user, and because we are a smaller lab, this was affordable. Skills required to maintain the system include some basic VBA and SQL experience, along with exposure to MS Access. Our IT department has experience in these areas, but in addition, several users were trained as administrators to perform maintenance and make changes to the system.
Results
The efficiency, traceability, and cost savings of building this database produced significant improvements to our overall workflow and outcomes. The consolidation of inventory has reduced storage needs, which decreased our nitrogen use and prevented additional storage purchases ($10,000–15,000), leaving room in our budget for future investments. Buying additional resources such as duplicate cell lines ($5,000–10,000) has been replaced with sharing available inventory. We can locate inventory much faster; thus, we spend less time searching for items and filling out paper documentation. The database is accessible from multiple locations, increasing the efficiency of workflow. Generating printed nitrogen- and alcohol-safe labels for use on cryovials (
Discussion
This custom-built MS Access database can be used for nitrogen sample storage and, due to its versatility, can also store myriad other items at various temperatures in a variety of small laboratories. With minor changes in design to accommodate lab-specific workflows, this tool can be used to track chemicals, liquid reagents, biological samples, consumables, and equipment, depending on the users’ needs.
There are limitations to this database, including box and cryovial size requirements, scalability (because the desktop version has a 2 GB size maximum 11 ), and the difficulties posed by working with a new custom database. Currently, data regarding one vial use less than 1 KB of space. Some additional improvements may be implemented, such as barcoding, additional report generation, queries to aid in future utility, and possible upgrades to an SQL server if space becomes a concern.
Using a process that was similar to an FDD model was the best fit for this project because some of the requirements from the users were complex and distinct. Even though this is not considered new software for which SDLC is relevant, the model fit fairly well with our needs because it is considered iterative and modular.3,4 In the future, we might benefit from more structure during the interview process to increase productivity and a more definitive timeline designation to accelerate development, but overall, we are satisfied with the result—a more collaborative environment that increases accountability and efficiency of the entire lab.
An MS Access inventory database is a cost-effective solution to unify sample storage, organization, and tracking while simultaneously addressing department-specific material needs and generating a wide array of additional benefits. Although our laboratory database is used primarily for nitrogen storage, its versatility indicates it could accommodate similar types of storage needs in most laboratories.
Supplemental Material
sj-pdf-1-jla-10.1177_2472630320973594 – Supplemental material for Creating an Affordable, User-Friendly Electronic Inventory System for Lab Samples
Supplemental material, sj-pdf-1-jla-10.1177_2472630320973594 for Creating an Affordable, User-Friendly Electronic Inventory System for Lab Samples by Kate Dennert, Logan Friedrich and Rajeev Kumar in SLAS Technology
Footnotes
Supplemental material is available online with this article.
Declaration of Conflicting Interests
The authors declared the following potential conflicts of interest with respect to the research, authorship, and/or publication of this article: All authors are employed by Advocate Aurora Health, and their research and authorship of this article were completed within the scope of their employment with Advocate Aurora Health.
Funding
The authors received no financial support for the research, authorship, and/or publication of this article.
References
Supplementary Material
Please find the following supplemental material available below.
For Open Access articles published under a Creative Commons License, all supplemental material carries the same license as the article it is associated with.
For non-Open Access articles published, all supplemental material carries a non-exclusive license, and permission requests for re-use of supplemental material or any part of supplemental material shall be sent directly to the copyright owner as specified in the copyright notice associated with the article.