
Abstract
Thermo Fisher Scientific released the Precision ID Ancestry Panel, a 165-single-nucleotide polymorphism (SNP) panel for ancestry prediction that was initially compatible with the manufacturer’s massively parallel sequencer, the Ion Torrent Personal Genome Machine (PGM). The semiautomated workflow using the panel with the PGM involved several time-consuming manual steps across three instruments, including making templating solutions and loading sequencing chips. In 2014, the manufacturer released the Ion Chef robot, followed by the Ion S5 massively parallel sequencer in late 2015. The robot performs the templating with reagent cartridges and loads the chips, thus creating a fully automated workflow across two instruments. The objective of the work reported here is to compare the performance of two massively parallel sequencing systems and ascertain if the change in the workflow produces different ancestry predictions. For performance comparison of the two systems, forensic-type samples (n = 16) were used to make libraries. Libraries were templated either with the Ion OneTouch 2 system (for the PGM) or on the Ion Chef robot (for the S5). Sequencing results indicated that the ion sphere particle performance metrics were similar for the two systems. The total coverages per SNP and SNP quality were both higher for the S5 system. Ancestry predictions were concordant for the mock forensic-type samples sequenced on both massively parallel sequencing systems. The results indicated that automating the workflow with the Ion Chef system reduced the labor involved and increased the sequencing quality.
Keywords
Introduction
Normally, in cases involving human identification of unknown persons, physical characteristics and DNA genotyping are used in the analysis. The resulting DNA profile is used to probe missing persons’ databases or to compare with profiles of families involved. However, sometimes there is no DNA profile or family available, and other novel DNA markers may be helpful. Single-nucleotide polymorphisms (SNPs) can provide information on a person’s biogeographical ancestry or phenotypic characteristics, such as eye, skin, and hair color,1,2 that cannot be gleaned from traditional DNA analysis using short tandem repeats (STRs). Sets of SNPs are available that may be useful for providing information on identity,3,4 lineage, 5 and ancestry.6,7 Since SNPs can be analyzed from low quantity and small fragments of DNA, they have potential to provide information even from environmentally compromised or degraded DNA samples.8,9 Thus, SNP analysis should be useful in forensic and anthropological investigations of unidentified human remains or skeletal items, as well as in the generation of investigative leads from these types of evidence collected by law enforcement agencies.
Historically, typing of SNPs was completed using large-scale microarray technology,10,11 TaqMan technology on a quantitative PCR (qPCR) instrument, 3 or detection through capillary electrophoresis (CE). 12 Using these approaches, only a limited number of SNPs or samples could be analyzed simultaneously. However, with the introduction of massively parallel sequencing (MPS), it is now possible to type hundreds of SNPs from numerous samples together, making it both time- and cost-effective. With targeted MPS, specific regions of the genome are amplified via PCR and the resulting amplicons are prepared into “libraries” by ligation of sequencing adaptors and indices. Multiple libraries can subsequently be pooled for concurrent sequencing on an MPS instrument. Thermo Fisher Scientific (Waltham, MA) released two MPS multiplex SNP panels that provide primers for amplifying DNA segments for (1) human identity, the Precision ID Identity Panel, which consists of both autosomal and Y chromosomal SNPs, and (2) inference of ancestral origin, the Precision ID Ancestry Panel, which consists of 165 ancestry-informative autosomal SNPs. The ancestry panel SNPs have been reported as informative for inferring linkage of the sample to the populations of one or several global regions: Europe, Oceania, America, Africa, East Asia, South Asia, and Southwest Asia.6,7
Manually prepared libraries prepared for Thermo Fisher Scientific SNP panels were initially sequenced on the original MPS instrument, the Ion Torrent Personal Genome Machine (PGM). The workflow for the semiautomated process to provide a chip ready for sequencing involved six steps (depicted in Fig. 1 ), requiring ~6 h of hands-on time. Briefly, this involved the dilution and pooling of libraries to an optimal concentration to permit overnight templating of ion sphere particles (ISPs) using the semiautomated Ion OneTouch 2 instrument (Thermo Fisher Scientific). Templated ISPs were subsequently enriched using the semiautomated Ion OneTouch ES (Thermo Fisher Scientific) and combined with sequencing primers and polymerase that are included in the Ion PGM Sequencing Kit v2 (Thermo Fisher Scientific) before being manually loaded onto a sequencing chip ( Fig. 1 ). Next, several manual operations were involved in preparing the PGM instrument for sequencing ( Table 1 ), including instrument cleaning, wash solution preparation along with instrument initialization with dNTP solution, preparation, and loading (all solutions included in the Ion PGM Sequencing Kit v2) ( Fig. 1 ). The complete operation, including the automated steps, takes ~22.5 h.
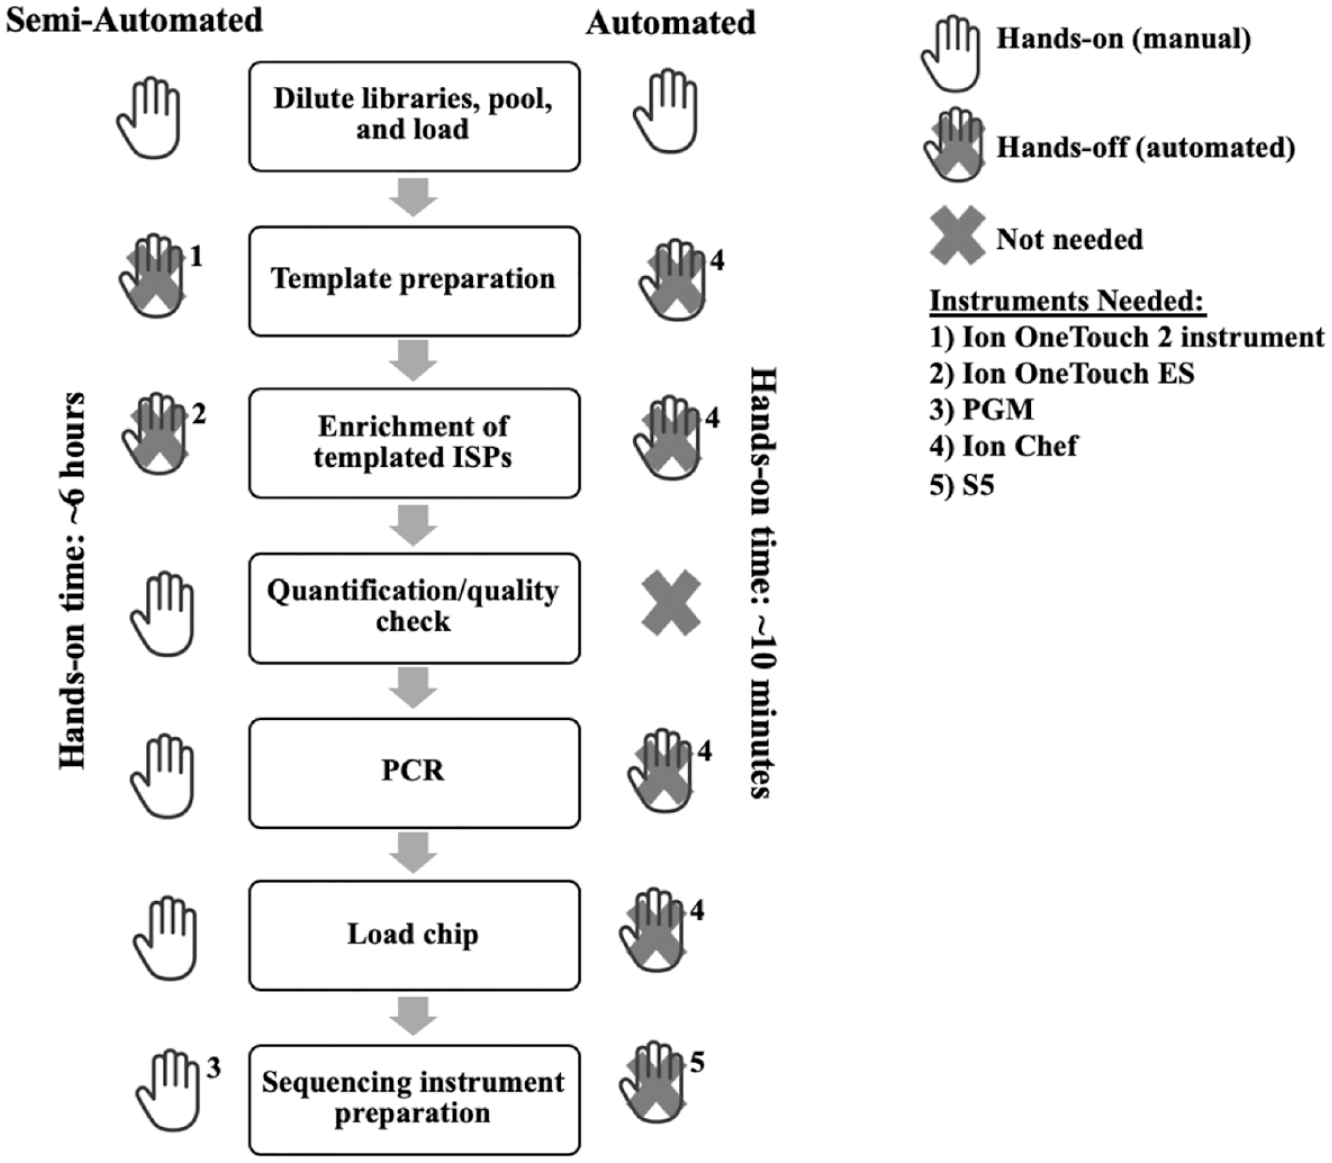
Comparison of the expected hands-on time spent preparing the samples for sequencing using either the automated (Ion Chef/S5) or semiautomated (Ion OneTouch 2/Ion OneTouch ES/PGM) workflows. The total times for the fully automated Ion Chef run and the semiautomated procedure using the Ion OneTouch 2 and Ion OneTouch ES system were ~13 and 22.5 h, respectively.
Differences between the Semiautomated PGM and Fully Automated S5 Sequencing Platforms.
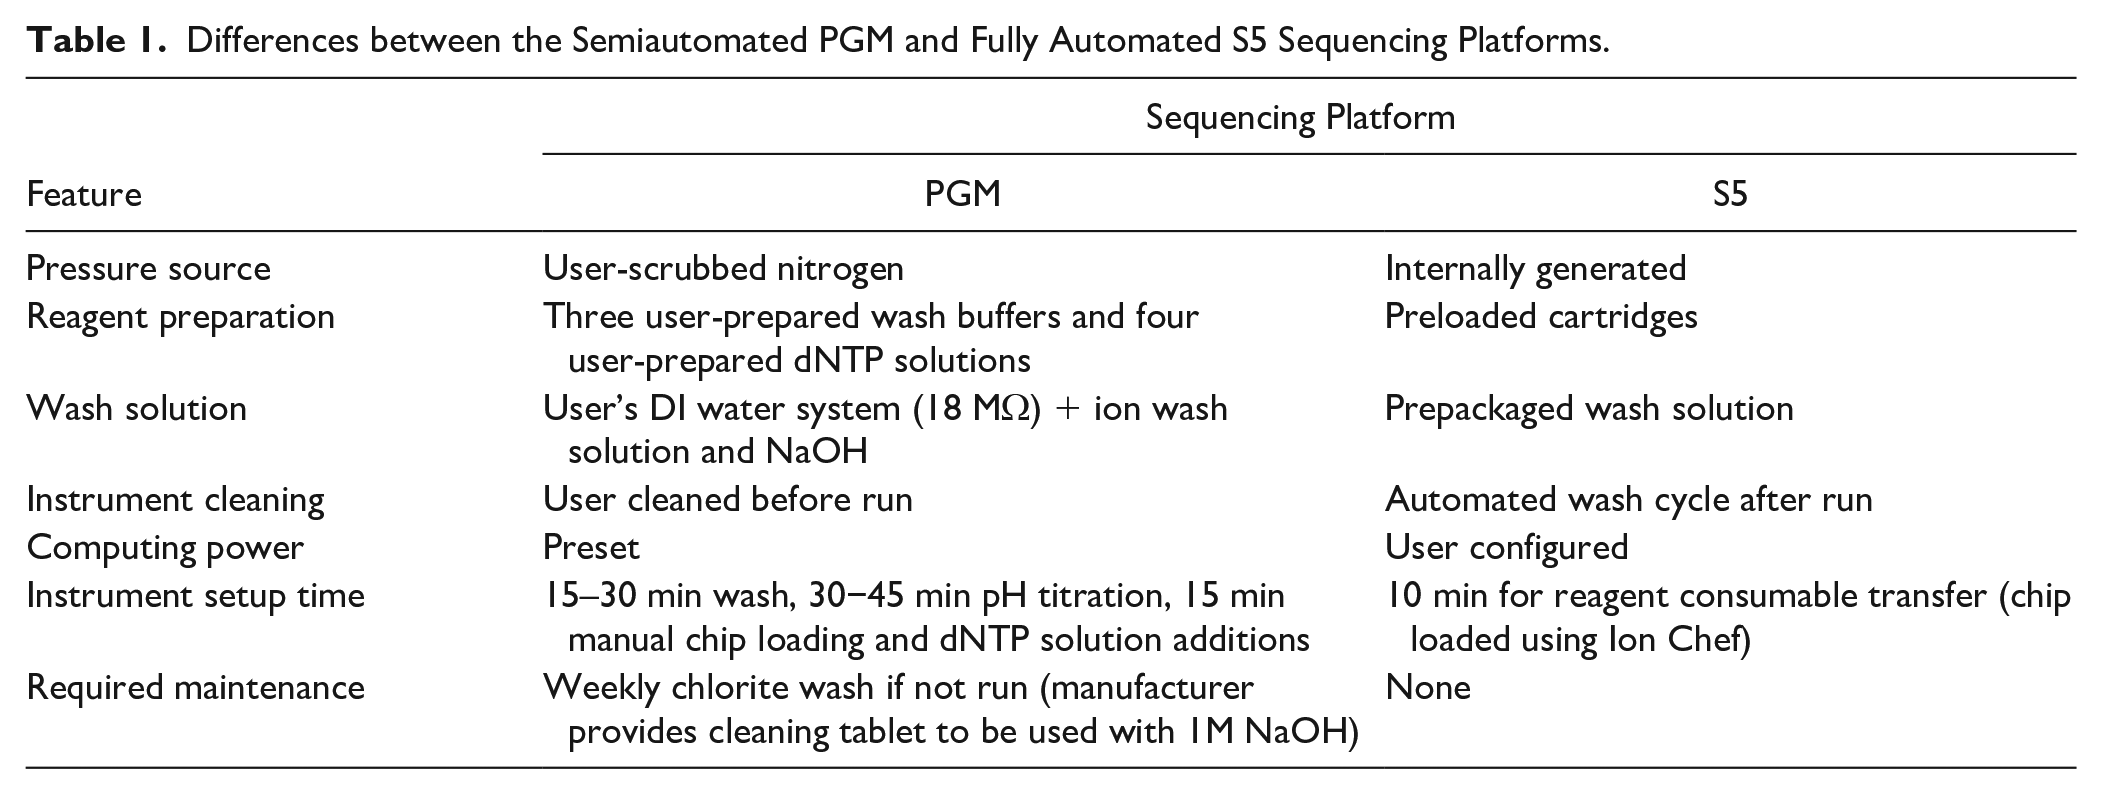
To make the sequencing operation easier, Thermo Fisher Scientific released in late 2015 the Ion S5 MPS system (S5). When used in combination with their Ion Chef robot, these systems eliminate most of the manual, hands-on steps required to prepare libraries for sequencing ( Fig. 1 ). To prepare a chip for sequencing using the automated workflow, the library pool is diluted and then loaded into library sample tubes in the reagent cartridge that is loaded inside the Ion Chef. The Ion Chef completes the ISP templating and enrichment, along with chip loading, which takes ~13 h from start to finish. Automated procedures of the S5 and preloaded reagent cartridges reduce the hands-on instrument setup time to ~10 min ( Table 1 ). Another cost and time advantage for the S5 is the larger number of wells available on the compatible chips, permitting a higher throughput of samples per sequencing run (84 and 362 Precision ID Ancestry Panel samples for an Ion PGM 316v2 chip and Ion S5 520 chip, respectively).
The goal of this study was to determine if there were differences in the sequencing results between the PGM and Ion Chef and S5 MPS instruments when the semiautomated preparation steps were replaced with a fully automated system. The goal is to address this difference between the two systems as a whole, as it is likely that forensic laboratories will purchase the Ion Chef robot and the S5 as a combined system. To assess the two systems, the quality of the sequencing data, resulting SNP genotypes, and ancestry inferences were compared. Ancestry concordance was determined by comparing the self-reported ancestry to that inferred using the Precision ID Ancestry Panel (admixture prediction to one of seven global population regions). To provide a stringent evaluation, the focus was on forensic-type samples that one might collect at a crime scene, rather than on reference samples such as bodily fluids. Reference samples were used in this study to define the lower limit of sensitivity for genotyping success. ISP performance metrics, including prealignment (e.g., bead loading and ISP density) and alignment (e.g., read and filtering) information for the overall sequencing success, were measured for both MPS systems and compared for possible trends. Additionally, the ancestral inferences were compared between the MPS systems for evaluation of accuracy and concordance.
Materials and Methods
DNA Samples
To serve as reference samples, blood, saliva, and sexual fluid were collected from one male and one female donor (in accordance with the FBI Institutional Review Board approved protocols). Two groups of forensic-type samples, mock and anonymous, were collected to test the stringency and sequencing limits of the two platforms. The mock forensic-type samples comprised items or samples from donors (including the two donors who provided the reference samples) with self-reported ancestry (male [European, EU] and female [Hispanic, HI]), including water bottles, toothbrushes, nail clippings, cigarette butts, and freshly shed hairs with root, and from other subjects, beard hair from a razor blade (male [EU]) and bone samples (male [Asian, AS] and female [EU]) (n = 13) ( Table 2 ). For the cigarette butt, water bottle, and soda can, donors simulated either smoking (cigarette placed against lips) or drinking for 1 min. Following this, the mock evidence items were dried in a dead-air cabinet at room temperature for 24 h before they were swabbed and extracted. The anonymous forensic-type samples consisted of discarded soda cans and chewing gum of unknown ancestry collected from a sidewalk (n = 3) ( Table 2 ).
Summary Results for the Mock and Anonymous Forensic-Type Samples Analyzed in This Study. a
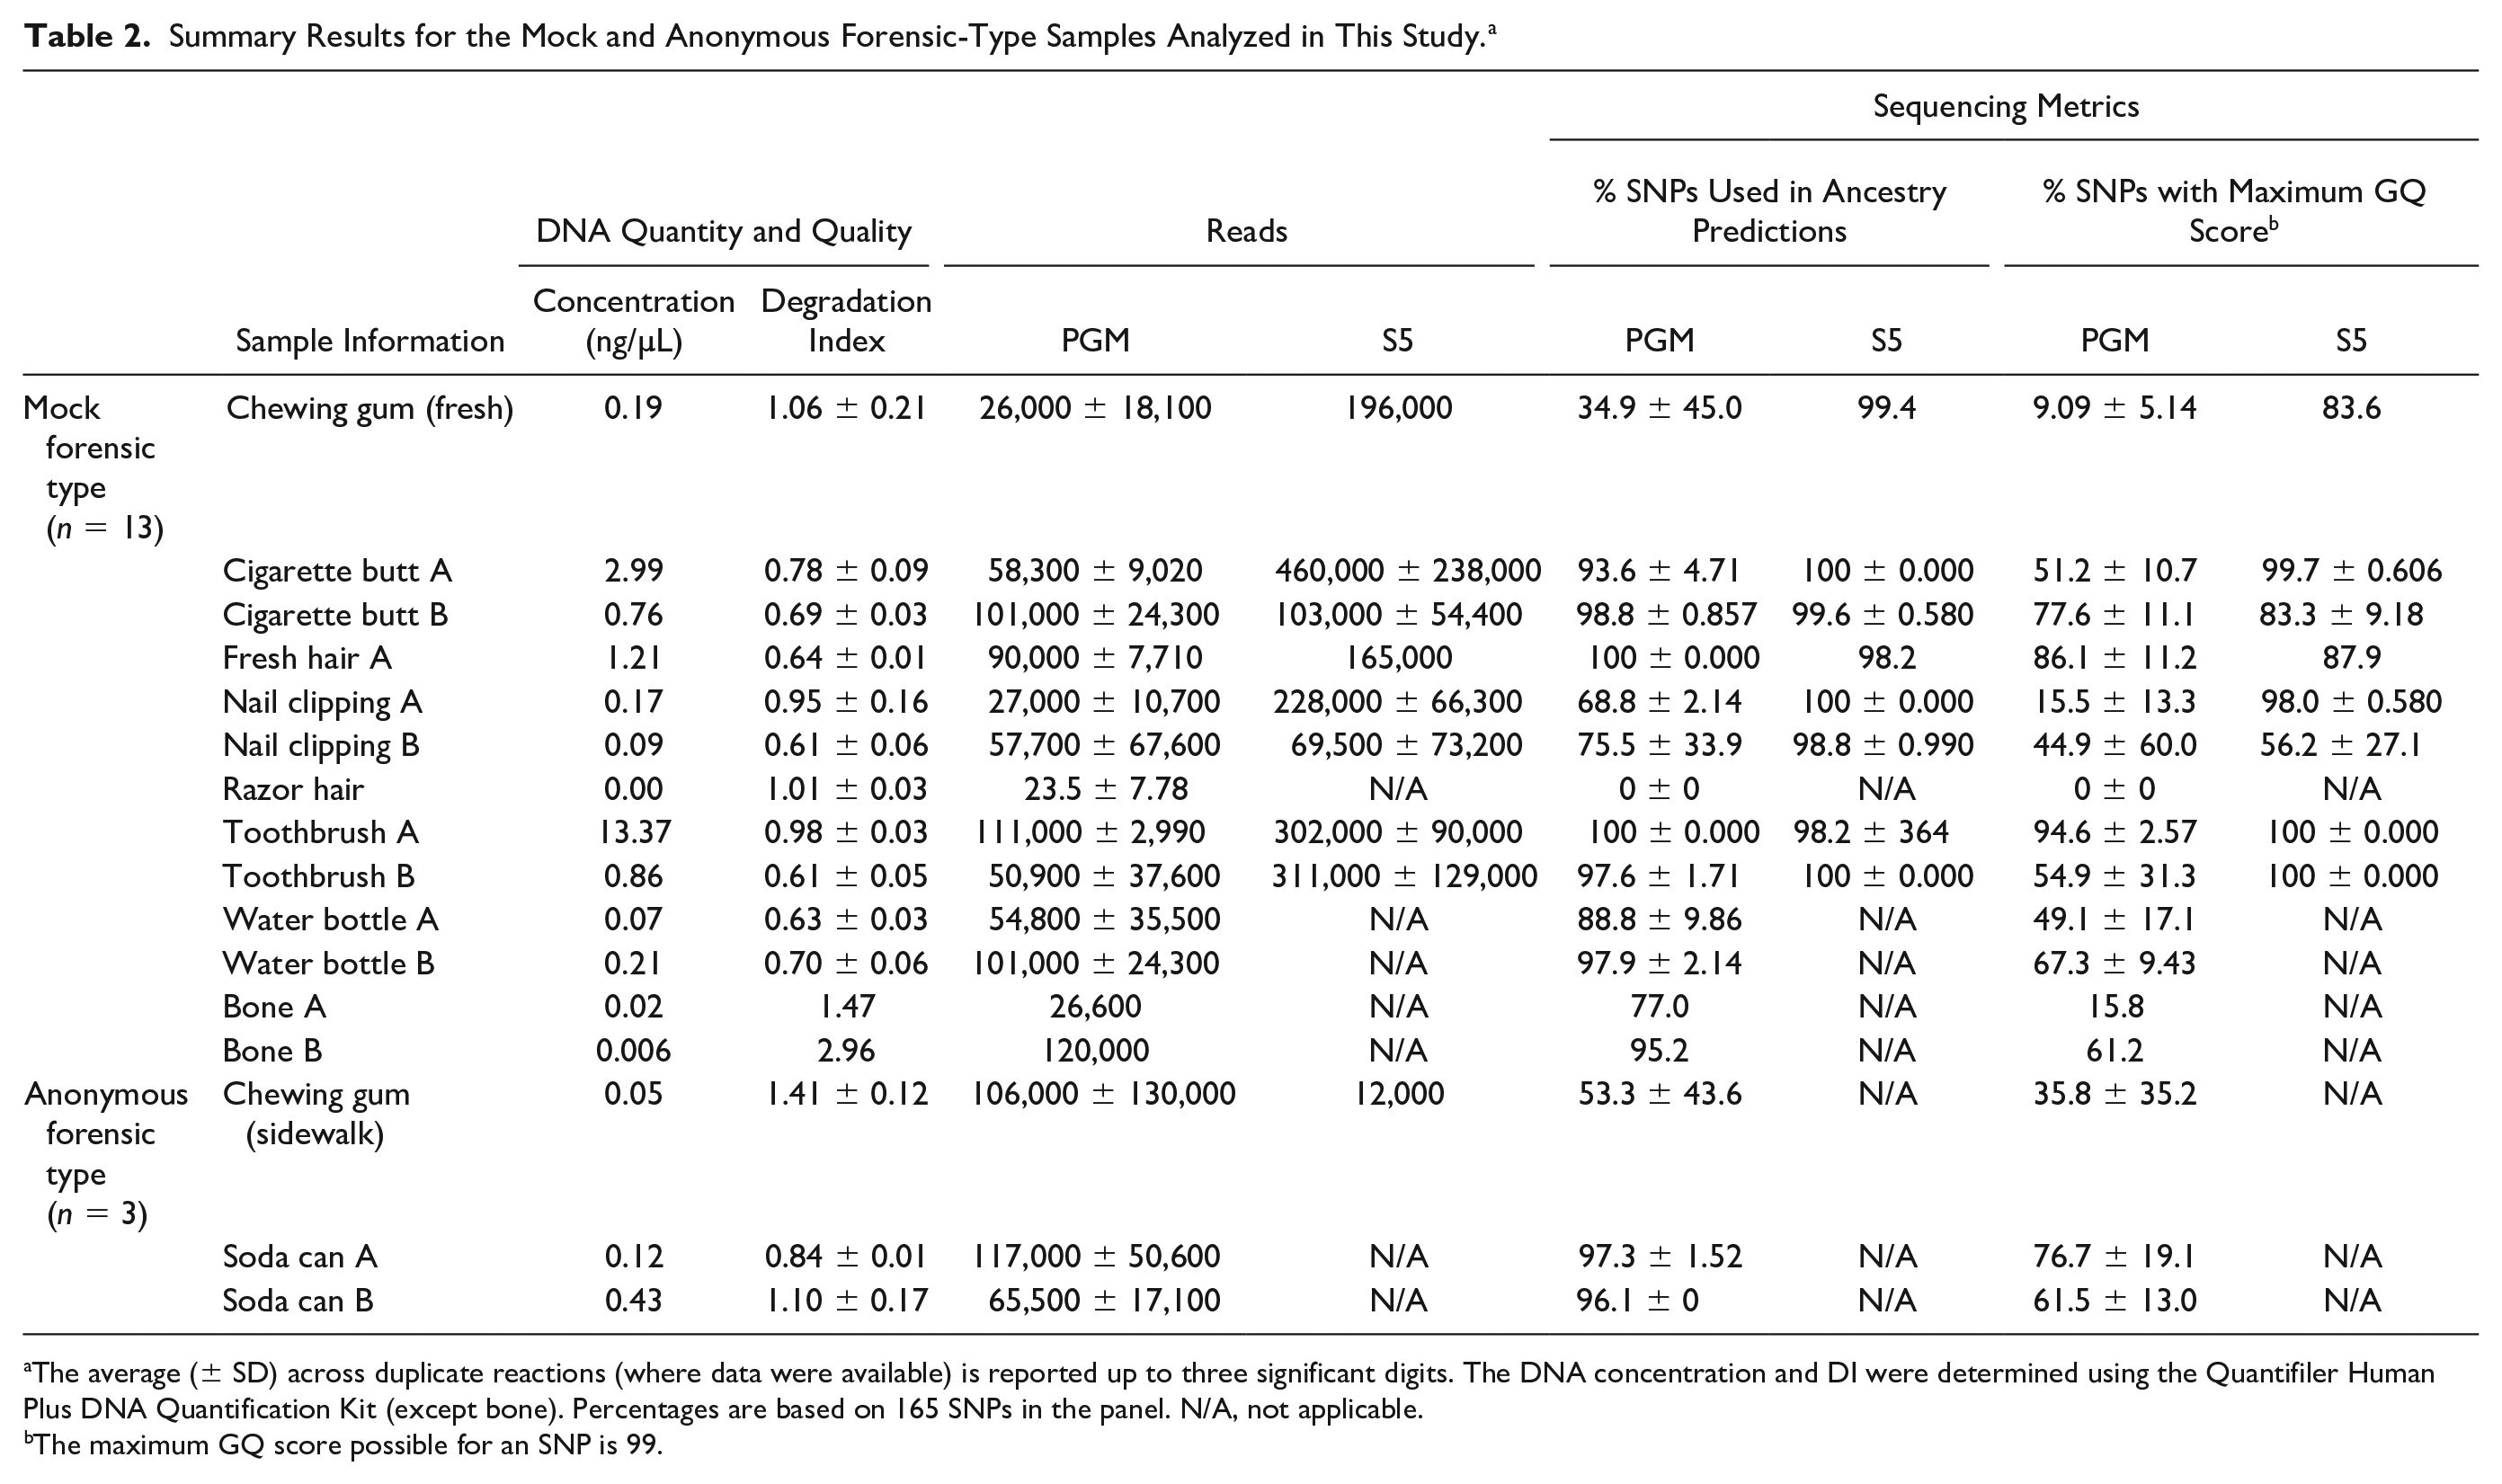
The average (± SD) across duplicate reactions (where data were available) is reported up to three significant digits. The DNA concentration and DI were determined using the Quantifiler Human Plus DNA Quantification Kit (except bone). Percentages are based on 165 SNPs in the panel. N/A, not applicable.
The maximum GQ score possible for an SNP is 99.
DNA Extraction
The reference samples were prepared and extracted using the EZ1 DNA Investigator Kit (Qiagen, Hilden, Germany) following the manufacturer’s protocol. Forensic-type samples were prepared for DNA extraction using the EZ1 DNA Investigator Kit as follows: (1) water bottles, nail clippings, and soda cans were wet swabbed with sterile water with a single cotton swab and cut immediately into a microcentrifuge tube; (2) toothbrush bristles were cut and placed directly in a microcentrifuge tube; and (3) approximately 4 mm of the filter paper circumference of each cigarette butt was removed with a sterile razor blade. The freshly shed hairs containing roots (eyebrow and head) were extracted using the PrepFiler Forensic DNA Extraction Kit (Thermo Fisher Scientific) with only a single deviation from the manufacturer’s protocol: extraneous DNA was removed from hairs by subjecting them to wash steps prior to extraction, including a xylene substitute (Thermo Fisher Scientific) wash, a 5% Tergazyme (Alconox Inc., White Plains, NY) wash, and a 100% ethanol rinse, and finished with a sterile water rinse. Approximately 1 mL of each wash/rinse was used to fully submerge the hair at each step. Preextracted and prequantified (with given DI values) DNA from two bones derived from human remains, which were placed on a soil surface and allowed to naturally decompose, was provided to us for use in this study from the FBI Laboratory archive.
DNA Quantification
For all samples prepared for sequencing on the PGM (except bone), the Quantifiler Human Plus DNA Quantification Kit (Thermo Fisher Scientific) was used to quantify the amount of DNA extracted as well as to estimate the state of DNA degradation. Data analysis of the analytical results from the qPCR analysis provides a Degradation Index (DI). The DI is a ratio comparing the quantity of a small autosomal target (80 bp) to that of a large autosomal target (214 bp), and is used to infer the level of DNA degradation. 13 The manufacturer suggests the DI value be interpreted as follows: (1) <1, no degradation or inhibition; (2) between 1 and 10, slightly to moderately degraded; and (3) >10 (or no value), significantly degraded. 13 For samples prepared for sequencing on the S5, the Quantifiler Duo DNA Quantification Kit (Thermo Fisher Scientific) was used for DNA quantification. All samples, regardless of quantification kit, were diluted to appropriate concentrations prior to library preparation and stored at 4 °C.
Library Preparation
The Ion AmpliSeq Library Kit and the Precision ID Ancestry Panel were used to manually prepare all libraries for sequencing on both the PGM and S5 following the respective protocols.13–15 Libraries were prepared in triplicate for the high-quality blood samples using 1.0 ng (290 DNA genome copies), 0.5 ng (145 DNA genome copies), and 0.2 ng (~58 DNA genome copies) of DNA for each sex (n = 18) and once for the sexual fluid and saliva samples of each sex (n = 4) for PGM sequencing; six saliva libraries were prepared in duplicate for S5 sequencing (n = 12). Libraries for the forensic-type samples were prepared in duplicate when possible, using varied DNA amounts (i.e., 1.0 ng [290 DNA genome copies], 0.5 ng [145 DNA genome copies], and 0.2 ng [~58 DNA genome copies] and with the amount available if ≤0.05 ng [~15 DNA genome copies] [toothbrush B, hair B, razor hair, bone, and fresh hair A]; total n = 68). The number of amplification cycles was normalized to the amount of input DNA as per the manufacturer’s guidelines. 14 All libraries, regardless of downstream sequencing platform, were barcoded separately to allow for library pooling. Purified libraries were quantified via real-time PCR using the Ion Library TaqMan Quantification Kit (Thermo Fisher Scientific) following the manufacturer’s protocols.13–16
Templating and Enrichment of ISPs of the Library
For libraries sequenced on the PGM, templating and enrichment were performed using the Ion OneTouch 2 200 Kit following the manufacturer’s guidelines. 17 Following completion of the semiautomated Ion OneTouch 2 templating procedure, the percentage of templated ISPs was quantitated with the Ion Sphere Quality Control Kit (Thermo Fisher Scientific). The manufacturer’s guidelines recommend that 25 µL of the pooled 8 pM libraries be added to the Ion OneTouch 2 amplification mix to achieve templated ISPs within the optimum range (10%−30%). 17 However, given that overtemplating (>30%) was initially observed, the input amount of library was varied (20−25 µL). Libraries were carried to sequencing if 10%−30% of the ISPs were templated. Enrichment of the templated ISPs was performed semiautomated with the Ion OneTouch ES device with manually purified streptavidin magnetic beads. The total time to prepare samples to load on the chip was ~22.5 h, including both the manual (6 h) and automated (16.5 h) steps.
Procedures for templating and enrichment on the automated Ion Chef using the Ion S5 Precision ID Chef & Sequencing Kit (Thermo Fisher Scientific) were performed according the manufacturer’s instructions 15 for the forensic-type samples sequenced on the S5. An appropriate volume of each manually prepared library, adjusted to 30 pM concentration, was combined to create an approximately equimolar pooled library for the Ion Chef. Preparing and loading the pooled library sample and instrument setup were the only manual steps for the Ion Chef procedure ( Fig. 1 ), as the Ion Chef automated the templating and enrichment overnight (13 h).
Sequencing on the PGM and S5 Instruments
Using the Ion PGM Sequencing 200 Kit v2 and following the appropriate manufacturer’s protocol,
18
libraries were combined with sequencing primers and polymerase before being sequenced randomly across eight Ion 316 v2 chips: six chips for the reference blood samples and two chips for the reference saliva and sexual fluid samples, along with the forensic-type samples (Thermo Fisher Scientific). Purified 18 MΩ cm−1 Milli-Q (EMD Millipore, Darmstadt, Germany) water was used in manual preparation of all PGM reagents and solutions. Following manual initialization, the instrument adjusted the pH of the buffers automated in a series of steps lasting
Using the Ion S5 Precision ID Chef & Sequencing Kit and following the manufacturer’s protocol, 15 libraries were sequenced on four Ion 520 chips. After automated initialization of the instrument, the Ion Chef loaded chip was placed in the instrument. As is the case with changes to any kit and instrumentation, the reagents between the semiautomated and automated workflows are different (personal communications). However, it was outside the scope of this study to assess the impact of chemistry changes and automation independently, especially given that forensic laboratories would preferentially acquire the Ion Chef and S5 together.
Data Analysis
Raw sequence data for the libraries (n = 85) were analyzed through the manufacturer’s plugin (HID SNP Genotyper v4.3.1) using the default settings, which generates the following: (1) genotype calls and associated genotype quality (GQ) metric (i.e., a Phred-scaled marginal probability of a called genotype, with a maximum score of 99 for each SNP), (2) quality control (QC) flagging of potentially problematic genotypes based on various metrics, 19 and (3) admixture and specific population likelihood assignments. Parameters and population data used by the plugin in the analysis for ancestry inference could be neither viewed nor modified by the analyst. From the 165 SNPs in the ancestry panel, the plugin uses a subset of 151 SNPs for admixture prediction; 19 all 165 SNPs have been included in the quality metric calculations. Means and standard deviations were computed using Microsoft Office Excel 2013 (Microsoft Corporation, Redmond, WA). One-way analyses of variance (ANOVAs) with post hoc Tukey’s tests were performed to determine the significant difference between the amount of DNA used for library preparation and number of SNPs genotyped or reads. Student t tests were performed to determine the significant difference between semiautomated and automated metrics (percent of loaded wells, total number of usable reads, reads per library, and percent of SNPs with a maximum GQ score). Correlation analyses were conducted to quantify the relationship between read depth and GQ scores or total number of reads. For this experiment, p values of ≤0.05 were statistically significant.
Results and Discussion
DNA Quality of Forensic-Type Samples
To determine the stringency of the PGM and S5 in sequencing, DNA extracted from forensic-type samples (which included some samples with low-quantity and -quality DNA) was used. To do this, a range of mock and anonymous forensic-type samples were processed ( Table 2 ). DNA integrity was estimated using a quantitative PCR analysis approach (explained in Materials and Methods) and expressed as a DI. Most samples had a DI of <1.0, indicating no degradation or inhibition ( Table 2 ). The highest recorded degradation indices were observed in DNA from chewing gum and bone (fresh, 1.06−1.41; bone, 1.47−2.96) ( Table 2 ), which is categorized as slightly to moderately degraded. No significant difference (p = 0.25) in DI was observed between the mock forensic sample types.
DNA Quantity in Library Preparation and Genotyping Success
The DNA yield from the extractions varied from >1 ng/µL (>290 DNA genome copies/µL) to <50 pg/µL (<15 DNA genome copies/µL) (results not shown). To determine if the sequencing and genotyping were successful with less than the manufacturer-recommended 1 ng template DNA (290 DNA genome copies), libraries were prepared with 1, 0.5, and 0.2 ng of DNA (290, 145, and ~58 DNA genome copies, respectively) and sequenced on the PGM. This was completed with the reference blood (n = 18), saliva (n = 2), and sexual fluid (n = 2) samples, with the number of SNPs genotyped and reads (e.g., amplified DNA segments) obtained for the varying library input DNA amounts depicted in Figure 2 . The results indicated that all the SNPs in the panel could be genotyped with DNA in the range of 1−0.5 ng (290−145 DNA genome copies), but incomplete SNP profiles were obtained when 0.2 ng of DNA (~58 DNA genome copies) was used for library preparation. No significant difference was observed between the amount of DNA used for library preparation and the number of SNPs genotyped (p = 0.18) and reads (p = 0.34). Similar sensitivity observations have been reported for the Precision ID Ancestry Panel 20 and the similarly formulated Precision ID Identity Panel9,21,22 with reference-type samples. These results suggested that successful sequencing and genotyping of forensic-type samples with <1 ng of DNA would be possible, with the caveat that when <0.5 ng of DNA (<145 DNA genome copies) is used as input, not all SNPs may be recovered. For example, despite the razor hair sample having a DI of 1.01 ± 0.03, it was only possible to input 0.05 ng of DNA (~15 DNA genome copies) into library preparation due to amplification reaction volume restrictions ( Table 2 ). Since zero SNPs were genotyped out of 165 for both library preparation replicates, the razor hair sequencing results were so poor that they were excluded from further analysis ( Table 2 ).
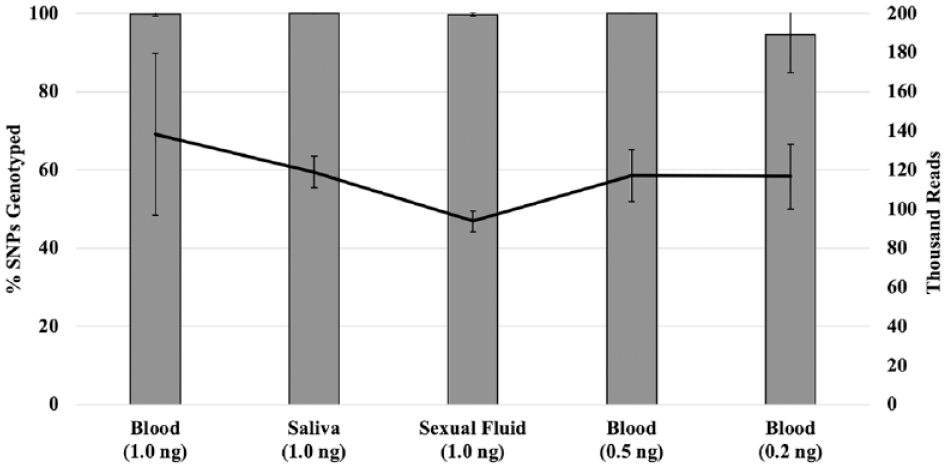
Relationship between the amount of reference DNA used to prepare the library (x axis), the total number of reads generated from sequencing each library (solid line, right y axis), and the percentage of SNPs genotyped for each library (columns, left y axis). Error bars represent the standard deviation from the average from six blood samples (at each input DNA amount) and two saliva and sexual fluid samples (described in Materials and Methods).
Comparison of the ISP Performance Metrics of the PGM and S5
The average ISP performance metrics (e.g., percentage of ISP loading of wells on the chip, usable reads, and clonality of the ISPs) for both chip types and systems are given in Table 3 . Automating the chip loading with the Ion Chef increased the number and consistency of loaded wells (79.3 ± 11.5% vs 86.0 ± 2.94%, respectively), but no significant difference between semiautomated and automated workflows was observed (p = 0.15) ( Table 3 ). An increase in the total number of usable reads between chips loaded manually and robotically was observed (30.9 ± 9.12% and 42.0 ± 5.19%, respectively) ( Table 3 ), and this difference was statistically significant (p = 0.05). Significantly fewer reads per library (p = 0.0004) were observed for the chips run on the PGM than on the S5 (113,000 ± 32,700 vs 210,000 ± 24,800, respectively). This is likely indicative of the difference in the number of wells available on the two chip types and the number of samples pooled on a single chip, rather than the level of automation employed.
Data for the Sequencing Metrics for PGM and S5 Chips. a
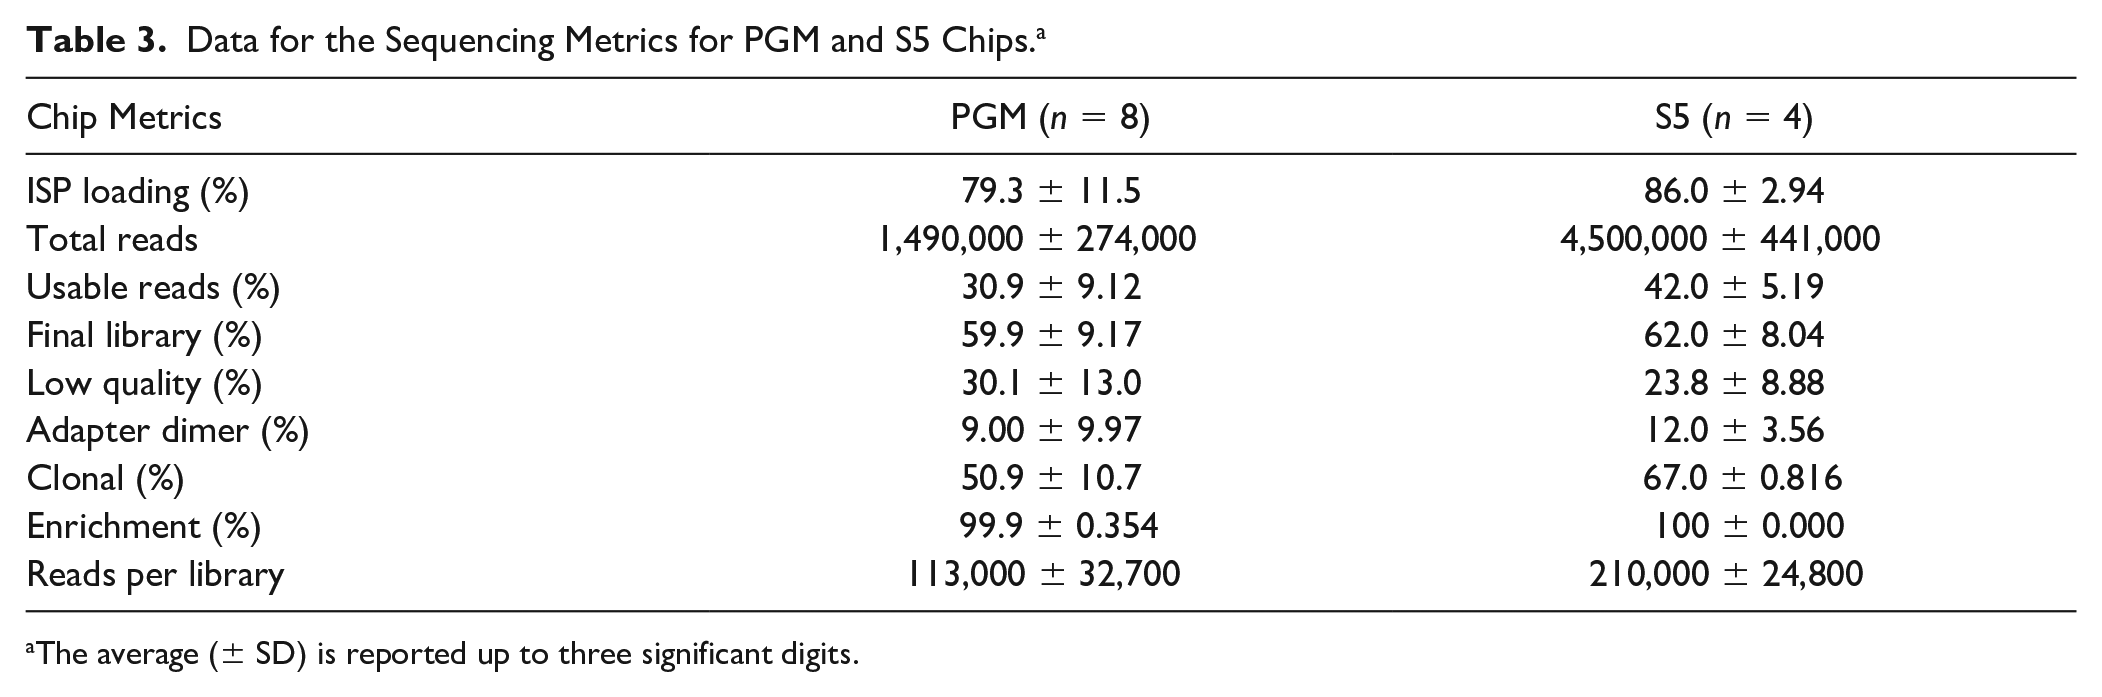
The average (± SD) is reported up to three significant digits.
One method employed in previous studies to determine the performance of an MPS SNP panel was examination of the balance in coverage and strand ratio (i.e., proportion of forward-to-reverse reads).20,23,24 In this study, the strand ratio across all 165 SNPs was compared for the forensic-type samples sequenced on both the PGM and S5. Regardless of the sequencing platform, the strand ratio was well balanced ( Fig. 3 ). This observation held across the complete range of SNPs in the panel and did not depend on the depth of coverage obtained for the two platforms.
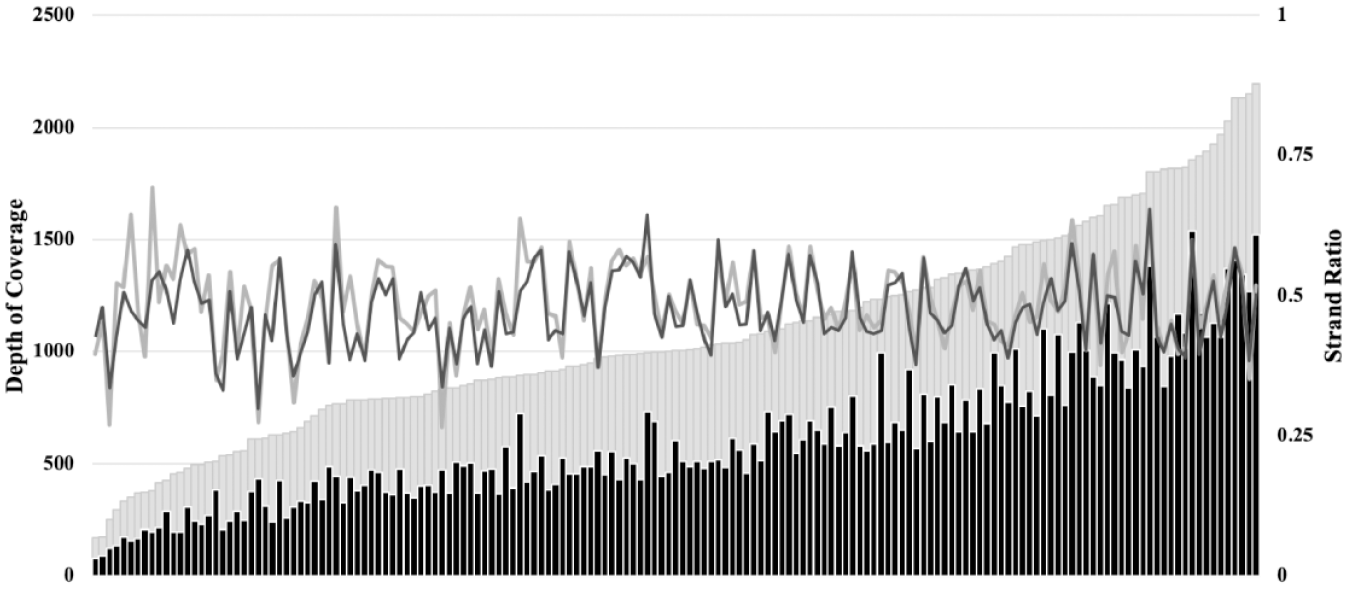
Performance metrics of the SNPs on the PGM and the S5. Data evaluated for the forensic-type samples that were sequenced on both platforms (PGM [n = 39] two chips; S5 [n = 10] one chip). The 165 SNPs in the panel are arranged along the x axis by increasing the average depth of coverage (total number of reads) on the S5 (light gray), and the corresponding coverage for the PGM is mapped accordingly (black) (left y axis). The average strand ratio (proportion of forward-to-reverse reads) for each SNP is represented by the light gray (S5) and black (PGM) lines (right y axis).
Further, we also compared the quality metric assigned by the manufacturer’s analysis software for each SNP (i.e., GQ) for the eight forensic-type samples run on both platforms; five samples were not sequenced on the S5 as there was insufficient DNA remaining for library preparation. To simplify cross-sample comparisons, we summed the number of SNPs per sample that had the maximum GQ score of 99 (total out of 165 SNPs). A significantly (p = 0.0001) higher percentage of SNPs with the maximum GQ score were obtained when samples were sequenced on the S5 than on the PGM ( Fig. 4 , striped bars). Additionally, a trend was observed with GQ and read depth; across both platforms, GQ scores and read depth were correlated (PGM: r = 0.81, p < 0.0001; S5: r = 0.59, p = 0.0005) ( Fig. 4 ). Even though significantly (p < 0.0001) fewer reads were generated for samples sequenced on the PGM, a high percentage of SNPs were genotyped nonetheless. Read depth and percent of SNPs genotyped were moderately correlated (PGM: r = 0.66, p < 0.0001) ( Fig. 4 , dark gray bars).
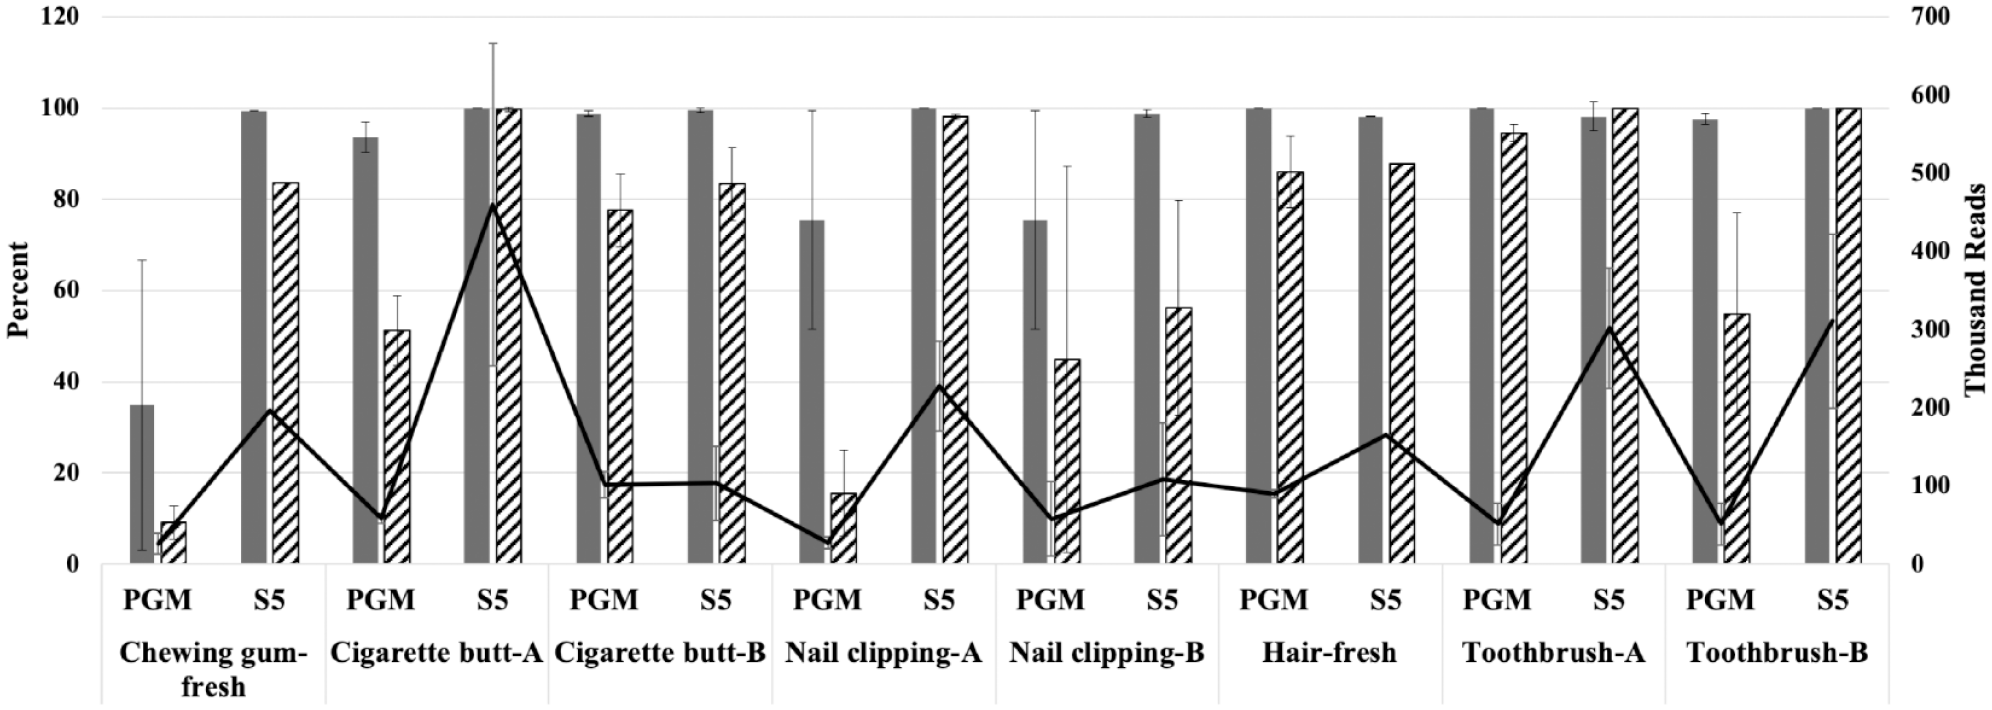
Comparison of the average (± SD) percentage of SNPs with the maximum GQ score (striped bars, left y axis), the percentage of SNPs genotyped (black bars, left y axis), and the total number of reads (solid line, right y axis) used for genotyping for a subset of forensic-type samples sequenced on the PGM and S5 (n = 8).
Sequencing Forensic-Type Samples on the PGM
The forensic-type samples sequenced on the PGM had as few as 1 SNP (1% of all SNPs; sidewalk chewing gum) and up to 159 SNPs with the maximum GQ score (96% of all SNPs; toothbrush A) (
The results also showed that samples with a lower number of high-GQ SNPs generally had fewer SNPs for ancestry predictions (
Sequencing Forensic-Type Samples on the S5
A subset of the forensic-type samples was sequenced on the S5 after templating on the Ion Chef (n = 8). The subset was based on available DNA for the library preparation. The percentage of SNPs with the maximum GQ score, the number of SNPs used in ancestry predictions, and the number of reads for each sample sequenced on the S5 were recorded for comparison with those sequenced on the PGM (
Table 2
). A higher number of SNPs with maximum GQ scores (122−165) were obtained, with the lowest being for one of the nail clippings (
Inference of Ancestry for Samples Sequenced on Both Systems
Concordance in ancestry inference was measured (1) across chips for samples run on the same system and (2) across systems for the subset of samples run on both the PGM and S5. Interchip concordance was observed for the samples sequenced on each PGM chip, and the same result was observed for the samples sequenced on the S5 chips. The ancestral inferences of the subset of samples run on both systems were identical across both the PGM and S5 chips. The samples that were sequenced with the PGM (
Conclusions
In this work, the Thermo Fisher Scientific Precision ID Ancestry Panel was used to test the sequencing performance, data quality, and ancestry inference capability of two MPS systems, the PGM and the S5. Since many steps in the workflow were automated using the Ion Chef, it was important to establish that the reduction of at least 6 h of labor did not reduce the quality of the sequencing results. Both the mean depth of coverage and the quality of the SNPs were higher for all samples when sequenced with the S5. Nevertheless, the ancestry inference was concordant for samples run on both systems. The results obtained in this study validate the inferences made on studies reported earlier for the PGM9,20–24,26–32 in that the introduction of the automated workflow for higher throughput did not alter the predictions provided by the manufacturer’s plugin. With ever-increasing demands on the analyst, it is feasible that the S5 could be implemented to streamline operations, saving hours of labor to perform priority tasks.
Supplemental Material
Supplementary_Tables_Revision_AMC_060720 – Supplemental material for Performance Comparison of Massively Parallel Sequencing (MPS) Instruments Using Single-Nucleotide Polymorphism (SNP) Panels for Ancestry
Supplemental material, Supplementary_Tables_Revision_AMC_060720 for Performance Comparison of Massively Parallel Sequencing (MPS) Instruments Using Single-Nucleotide Polymorphism (SNP) Panels for Ancestry by Ashley M. Cooley, Kelly A. Meiklejohn, Natalie Damaso, James M. Robertson and Tracey Dawson Cruz in SLAS Technology
Footnotes
Acknowledgements
J.M.R. is grateful for training in the Ion Torrent sequencing procedure provided by Momo Vuyisich and Xiaohong Shen at Los Alamos National Laboratory, Santa Fe, New Mexico. We thank Patrick Rydzak for formulating the tables and figures and Kyleen Elwick for suggestions for the paper. Part of this work was from the Virginia Commonwealth University master’s thesis of A.M.C.
Supplemental material is available online with this article.
Disclaimer
This is publication no. 18-05 of the Laboratory Division of the Federal Bureau of Investigation. This work was presented in part as a poster at the 2019 International Symposium on Human Identification (ISHI), Palm Springs, California. Names of commercial manufacturers are provided for information only and inclusion does not imply endorsement by the FBI or the U.S. Government. The views expressed are those of the authors and do not necessarily reflect the official policy or position of the FBI or the U.S. Government.
Declaration of Conflicting Interests
The authors declared no potential conflicts of interest with respect to the research, authorship, and/or publication of this article.
Funding
The authors disclosed receipt of the following financial support for the research, authorship, and/or publication of this article: This research was supported in part by an appointment to the Visiting Scientist Program at the FBI Laboratory Division, administered by the Oak Ridge Institute of Science and Education, through an interagency agreement between the U.S. Department of Energy and the FBI. This research received no specific grant from any funding agency in the public, commercial, or not-for-profit sectors.
References
Supplementary Material
Please find the following supplemental material available below.
For Open Access articles published under a Creative Commons License, all supplemental material carries the same license as the article it is associated with.
For non-Open Access articles published, all supplemental material carries a non-exclusive license, and permission requests for re-use of supplemental material or any part of supplemental material shall be sent directly to the copyright owner as specified in the copyright notice associated with the article.