
Abstract
Simultaneous measurements of glucose, lactate, and neurotransmitters (e.g., glutamate) in cell culture over hours and days can provide a more dynamic and longitudinal perspective on ways neural cells respond to various drugs and environmental cues. Compared with conventional microfabrication techniques, direct writing of conductive ink is cheaper, faster, and customizable, which allows rapid iteration for different applications. Using a simple direct writing technique, we printed biosensor arrays onto cell culture dishes, flexible laminate, and glass to enable multianalyte monitoring. The ink was a composite of PEDOT:PSS conductive polymer, silicone, activated carbon, and Pt microparticles. We applied 0.5% Nafion to the biosensors for selectivity and functionalized them with oxidase enzymes. We characterized biosensors in phosphate-buffered saline and in cell culture medium supplemented with fetal bovine serum. The biosensor arrays measured glucose, lactate, and glutamate simultaneously and continued to function after incubation in cell culture at 37 °C for up to 2 days. We cultured primary human astrocytes on top of the biosensor arrays and placed arrays into astrocyte cultures. The biosensors simultaneously measured glucose, glutamate, and lactate from astrocyte cultures. Direct writing can be integrated with microfluidic organ-on-a-chip platforms or as part of a smart culture dish system. Because we print extrudable and flexible components, sensing elements can be printed on any 3D or flexible substrate.
Introduction
Astrocytes are glial neural cells that play important support, homeostatic, and repair roles in the brain.1,2 Astrocytes reuptake glutamate from the synaptic cleft and recycle it back to neurons via glutamine. 2 According to the lactate shuffle model, glutamate reuptake stimulates astrocytic glucose uptake and lactate production from glucose (glycolysis). Then, astrocytes secrete lactate into the extracellular space. It is thought that neurons use lactate from astrocytes as a fuel for supporting synaptic transmission.2,3 Beyond the brain, glucose and lactate are key biomarkers for investigating metabolism generally. They can be used to infer rates of aerobic versus anaerobic respiration, hence mitochondrial dysfunction (chemical toxicity),4,5 the Warburg effect (dominant phenotype of cancer cells), and lactic acidosis (common among solid tumors). 6 A low-cost multianalyte biosensor array compatible with conventional cell culture systems would be a useful tool for continuously measuring metabolites (e.g., glucose and lactate) and other species of interest, such as neurotransmitters (e.g., glutamate) from cell cultures for biological research and drug screening.5,7,8
Enzyme-based biosensors are attractive because they are relatively easy to fabricate, can sense a myriad of chemical species with high specificity, respond on a second or subsecond scale, are amenable to miniaturization, and work without genetically modifying, dying, or staining cell samples. 9 Several groups have used enzyme-based multianalyte biosensors for measurements in vivo,10–13 on-line, 14 off-line,15–17 and in vitro.18–32 However, their use with organ-on-a-chip platform5,33 or in cell cultures 34 is not widespread. Bavli et al. 5 and Misun et al. 33 have integrated glucose and lactate sensors into custom microfluidic systems for organ-on-a-chip. Microfluidic systems can replace complex media with phosphate-buffered saline (PBS) temporarily during measurement. In addition, microfluidic systems reduce sample volumes, so analyte concentrations change faster for the same number of cells. As for conventional cell culture systems, Pemberton et al. 35 have used microelectromechanical systems (MEMS) fabrication to make an array for measuring glucose, lactate, pH, O2, and temperature, but they only demonstrated in situ measurement of glucose from cell cultures. Enzyme stability, interference from components of cell culture medium, and biofouling are challenges to using enzyme-based biosensors for measuring cell cultures long-term.25,36
Researchers often measure cell cultures in PBS to avoid the problems of interference and biofouling.5,37–39 However, this limits how long one can measure because cells lose adherence to their substrate past a couple of hours.37,38,40 Cell cultures are typically grown in medium over days, so it would be useful to monitor them over that period, not only for short intervals. Implanted (in vivo) enzymatic biosensors also suffer from biofouling. 41 Physical,42–44 chemical,45,46 and biological 47 approaches all have the potential to reduce biofouling and improve biosensor stability during chronic measurement in complex fluids.
Direct writing refers to printing a material with controlled architecture and composition from a nozzle on a computer-controlled translation stage. 48 Compared with conventional microelectromechanical systems (MEMS) fabrication, direct writing is cheaper, faster, and more customizable. By direct writing, it is possible to print devices onto almost any 3D or flexible surface.49,50 Therefore, instead of fabricating entirely new platforms, sensor systems can be printed onto existing devices, such as cell culture plates. Moreover, the low-cost customization of direct writing is advantageous when moving from one biological model system to another. Biological phenomena occur over a wide range of spatial and time scales. 51 Depending on the analyte of interest and biological model system, the device geometry needed to capture biophysical responses of interest may change.
In this work, we used direct writing to make multianalyte biosensor arrays, which we used to measure lactate, glutamate, and glucose from 2D human astrocytes in a conventional cell culture setup. To our knowledge, our work represents the first attempt to use direct writing for this purpose. We printed biosensor arrays onto cell culture plates, sheets of flexible laminate, and glass slides. Human astrocyte cultures could be grown on top of biosensor arrays, and biosensor arrays could be placed into cell culture plate wells for in vitro measurement. We applied 0.5% Nafion to biosensors to improve their selectivity and functionalized them with oxidase enzymes. We measured lactate, glutamate, and glucose from cultures of human astrocytes in serum-supplemented Dulbecco’s modified Eagle’s medium (DMEM) for more than 6 h. Control electrodes, also known as sentinel electrodes, 52 were used to account for interference and sensor drift by self-referencing. Finally, we tested sensor stability as a function of time in cell culture medium at 37 °C. This work is an important step toward making a low-cost smart cell culture system and flexible multianalyte biosensors to enable future in vitro and in vivo studies.
Materials and Methods
Materials
We purchased 27-gauge chamfer needles (part 7015236) and 32-gauge needles (part 7018462) from Nordson EFD (East Providence, RI). Plain microscope slides (25 × 75 × 1 mm), C-Pt paste (10% Pt), DMSO, 0.1 M PBS (pH 7.4),
We purchased human cerebral cortex astrocytes, astrocyte medium, astrocyte growth supplement (cat. 1852), cell freezing medium, fetal bovine serum (FBS; cat. 0010), and penicillin/streptomycin solution (P/S; cat. 0503) from ScienCell Research Laboratories (Carlsbad, CA). Astrocyte medium contained 500 mL of basal medium, 10 mL of FBS, 5 mL of astrocyte growth supplement, and 5 mL of P/S. Unless stated otherwise, water refers to 18.2 MΩ of ultrapure water. We used a reference 600 potentiostat (Gamry Instruments, Warminster, PA) for amperometry.
Rheology
We performed shear/flow and oscillatory tests with a TA AR G2 at room temperature (22 °C). We used a 20 mm 1° cone geometry with a 29 µm gap. Tests were run in triplicate on both inks used to make biosensor arrays, the PtNP nanocomposite ink, and the activated C/Pt microparticle composite. Shear tests consisted of shear-rated controlled flow ramps (44 points) from 0.01 s−1 to 200 s−1. Oscillatory tests consisted of strain-controlled amplitude sweeps from 0.01% to 150% strain at 0.5 Hz.
Biosensor Array Fabrication
We made biosensor arrays similarly to how we previously described.49,53 Using an automated microfluidic dispensing system (Pro EV3, Nordson EFD, East Providence, RI), we printed the biosensor array directly onto flexible 50 µ XT/duroid 8000 thermoplastic laminate, cell culture plate wells, and glass microscope slides (
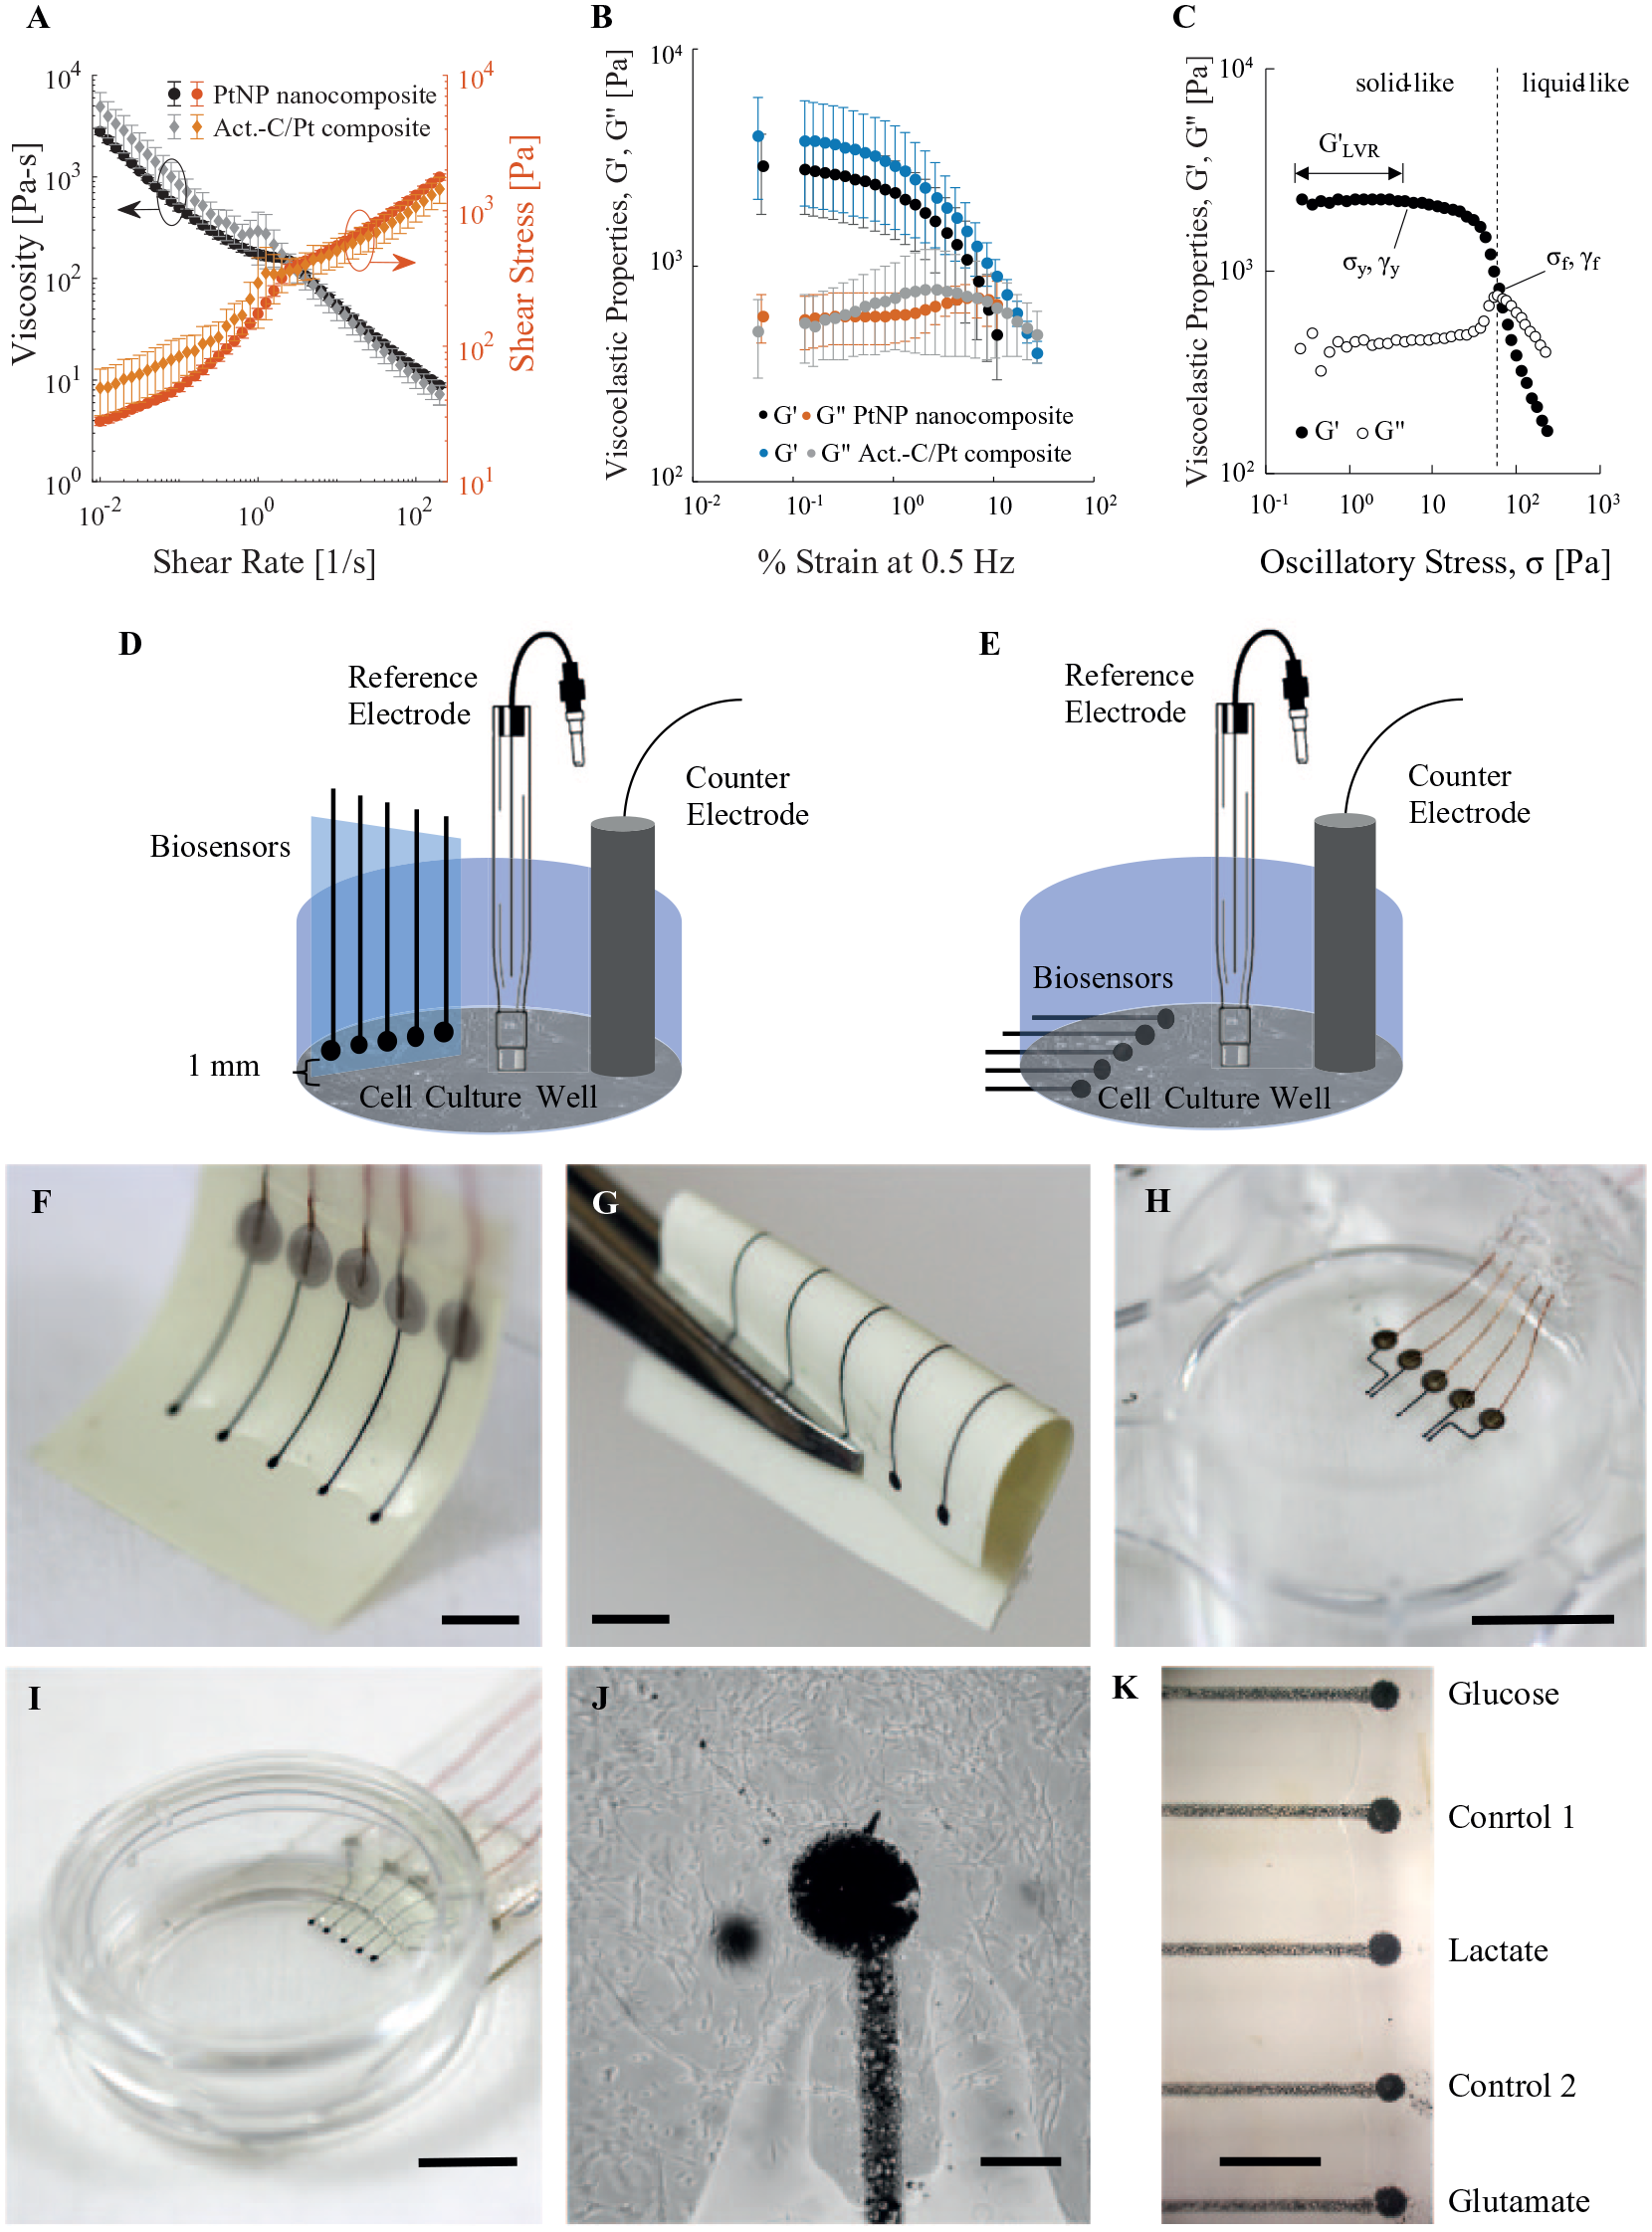
Rheology of inks, schematics, and images of biosensor arrays made by direct writing. (
After printing conductive lines, we printed biosensor electrodes as 450 ± 26 µm diameter (0.160 ± 0.018 mm2) dots with an activated C/Pt microparticle composite with a 27-gauge chamfer needle, 20 psi, and 5-inch H2O vacuum between dot dispensing. The activated C/Pt microparticle composite consisted of PEDOT:PSS and C-Pt paste (10% Pt). 53 We mixed 400 mg of PEDOT:PSS with 100 mg of C-Pt paste using a planetary centrifugal mixer (ARE-310, Thinky U.S.A., Inc., Laguna Hills, CA) for 30 min and then degassed the mixture for 10 min. Once we printed the conductive lines and biosensor electrodes, we left the inks to dry at room temperature overnight. We either printed electrodes 1 mm from the end of the microscope slide or, using a diamond point scribe, cut the microscope slide 1 mm from the electrodes.
Next, we added magnet wire as leads to the end of the conductive lines with Ag ink, leaving the ink to dry at room temperature for several hours. Then, we covered conductive traces with elastomeric PDMS (for arrays on flexible laminate sheets and cell culture plate wells) or NOA 61 (for arrays on glass slides). Baking at 70 °C accelerated the crosslinking of PDMS. We crosslinked NOA 61 with 254 nm of ultraviolet (UV) radiation for 1 h and baked at it 50 °C for 12 h to promote chemical bonding to the glass substrate. Culture wells were made from 35 mm FluoroDish cell culture dishes. We removed the glass bottoms and adhered the dish to on top of the biosensor array with PDMS. We sterilized devices with UV light for 15–60 min before use with cell cultures.
Immobilization of Perm-Selective Membrane and Enzymes
We drop-casted 1 µL of 0.5 wt% Nafion onto all electrodes, which we dried for 1 h at room temperature to create a perm-selective membrane. We immobilized enzymes onto biosensor electrodes by drop-casting a solution of glutaraldehyde, BSA, and oxidase enzyme in water. With a 10 µL micropipette, we placed 0.5 µL of solution onto an electrode and then immediately aspirated it back off the electrode. This was repeated three times for each electrode with 1 min intervals. Our solution for lactate sensors was 0.1% glutaraldehyde, 0.8% BSA, and 0.8 U/µL lactate oxidase; for glutamate sensors, 0.4% glutaraldehyde, 2.5% BSA, and 0.1 U/µL glutamate oxidase; for glucose sensors, 0.1% glutaraldehyde, 0.8% BSA, and 0.2 U/µL glucose oxidase; and for control sensors, 0.1% glutaraldehyde, 0.8% BSA, and no oxidase enzyme. After drop-casting, we left the solutions to crosslink at room temperature for at least 2 days.
Microscopy
We captured the image appearing as Figure 1J with a digital microscope (Hirox KH-8700, Tokyo, Japan). We used an Olympus microscope with 40× magnification and a digital camera with ToupView software to take the images of cell cultures.
Calibration
We used amperometry with a three-electrode setup, including a Ag/AgCl (3 M NaCl) reference electrode and graphite rod counterelectrode, for calibration of biosensor arrays and measurements from cell cultures. All biosensors on an array were calibrated simultaneously in mixed solution, which means they were each calibrated in one recording in the same solution. We applied 0.5 V versus Ag/AgCl to all biosensors in an array (lactate, glutamate, glucose, and control), using one reference and counterelectrode for all four sensors. At least 30 min was given after biasing the electrodes before beginning calibration. We sampled every 0.2 s. A 1 × 5 mm magnetic stir bar was used to stir the solution at 300 rpm. We calibrated biosensor arrays in 0.01 M PBS (pH 7.4) and in glucose-free DMEM + 2% FBS + 100 U/mL P/S (GFDMEM).
In 0.01 M PBS, lactate and glutamate sensor calibrations comprised 0.01, 0.3, 0.05, 0.1, 0.3, 0.5, and 1 mM, and glucose sensor calibrations comprised the same concentrations plus 3, 5, and 10 mM. These calibrations occurred in 20 mL of 0.01 M PBS. In GFDMEM, calibrations comprised 0.05, 0.1, and 0.5 mM for lactate; 0.05, 0.1, and 0.15 mM for glutamate; and 0.5, 2.5, and 5.5 mM for glucose. We chose the concentrations for GFDMEM based on expected ranges from cell cultures and the concentration of glucose in human astrocyte medium (5.5 mM). All analyte additions were separated by 100 s intervals. These calibrations occurred in 5 mL of GFDMEM in a well of a six-well cell culture plate in a humidified incubator set to 37 °C and 5% CO2. The incubator was only opened briefly (<10 s) at 100 s intervals to add lactate, glutamate, or glucose.
For calibrations and measurements in six-well cell culture plates, we inserted the biosensor array, reference electrode, and counterelectrode through slots cut out of cell culture plate covers, so each were normal to the bottom of the well. Each electrode had also been inserted through a thin rubber sheet with slightly smaller slots, placed over the plastic cover with tape, to hold the array and electrodes securely in place. After calibration in GFDMEM, we gently rinsed biosensor arrays with fresh GFDMEM and removed excess solution without them drying completely before using them immediately for measurements from cell cultures. The fresh GFDMEM used for washing was placed in a half-open centrifuge tube in the incubator before calibration to get the GFDMEM to pH 7.4.
Cell Culture
Human cerebral cortex astrocytes were obtained from ScienCell and cryopreserved at passage 1. Astrocytes were expanded and maintained per ScienCell’s protocol. Astrocytes were cultured in astrocyte medium in six-well, tissue culture-treated plates, with 3 × 10⁵ cells seeded per well. These cultures were then incubated until confluent in a humidified incubator at 37 °C and 5% CO2. We replaced the astrocyte medium 1 day after seeding. Unless otherwise stated, all incubation in this work occurred in a humidified incubator at 37 °C and 5% CO2.
Measuring from Cell Culture
We calibrated all biosensor arrays in GFDMEM immediately before using them in cell cultures. We washed cell cultures twice with Dulbecco’s PBS (pH 7.4) and then added 3 mL of GFDMEM. Next, we placed the plastic cover with the biosensor array, Ag/AgCl (3 M NaCl) reference electrode, and graphite rod counterelectrode, described in the section on calibration, on top of the cell culture well, and then placed everything in a humidified incubator (37 °C, 5% CO2). As for calibrations, we biased the biosensors at 0.5 V versus Ag/AgCl and sampled every 0.2 s. We left the biosensors to settle for 1 h before adding 5.5 mM glucose by a 174.6 µL bolus of 100 mM glucose. After another hour, we added 150 µM glutamate by a 123.7 µL bolus of 4 mM glutamate, and a half-hour after that we added 150 µM glutamate a second time (133.7 µL bolus of 4 mM glutamate). During each addition, we opened the incubator for less than 10 s. We continued to measure for another 4 h, so the total recording time was 6.5 h or 23,400 s.
Testing Biosensor Performance after Storage in Cell Culture Medium
We calibrated new glucose biosensors in 0.01 M PBS (pH 7.4) to glucose the same way as described in the section on calibration but to 0.5, 2, 5, 7.5, and 10 mM glucose. Following calibration, glucose biosensors were rinsed with water, dried with N2, and placed in astrocyte medium + 10% FBS + 100 U/mL P/S. We incubated the biosensors in a humidified incubator at 37 °C and 5% CO2 for at least 2 days. Every day, we removed glucose biosensors from astrocyte medium, gently rinsed them with PBS, and recalibrated them. Finally, we rinsed biosensors with ultrapure water, dried them with N2, and returned them to astrocyte medium for further incubation.
Data Analysis
We converted current data from amperometry to current density (µA/mm2 or nA/mm2). For calibration, we adjusted the baseline currents from all biosensors by subtracting the mean current during the 5 s prior to the first addition of lactate. For calculating sensitivity, we subtracted the current at zero analyte concentration from the currents at all other concentrations. The current at each concentration was calculated by taking the mean after a 90% response. Sensitivity was calculated as the slope of the linear regression through the linear range of the biosensor. The y intercept of these linear regressions was not set to zero.
The concentration of lactate, glutamate, and glucose during measurements in astrocyte cultures was calculated as follows. First, we converted current data to current density as previously described. Then, we subtracted the control sensor’s current as a function of time from that of the lactate, glutamate, and glucose sensors. To calculate the glutamate concentration, we divided by sensitivity found by calibration. To calculate the lactate and glucose concentration, we used second-order polynomial fits of calibrations if measurements fell outside the linear range. Finally, we subtracted the current of each biosensor at 1 h, immediately before adding 5.5 mM glucose, from its current as a function of time. This assumes that the concentration of lactate, glutamate, and glucose was zero before glucose and glutamate were added. These data and calibration data were filtered with a low-pass filter.
Results and Discussion
Rheological Characterization of Ink
We evaluated the printability of both inks used in printing biosensor arrays with shear and oscillatory rheology.
Figure 1A
shows the viscosity and shear stress τ of the PtNP nanocomposite and activated C/Pt microparticle composite as functions of shear rate
Amplitude sweeps from 0.01% to 150% strain at 0.5 Hz were used to quantify inner structure and breakdown processes. Both inks have similar viscoelastic properties (storage modulus G′ and loss modulus G′′) as functions of shear (
Direct Writing Biosensor Arrays
We made biosensor arrays for use in one of two configurations (
Direct writing can be used to print multianalyte arrays onto flexible substrates such as XT/duroid laminate (
Biosensor Calibration
We calibrated biosensor arrays in 0.01 M PBS (pH 7.4) as a reference for evaluating their performance in cell culture medium. We tested the effect of bending on biosensor performance, particularly sensitivity. We calibrated flexible single-analyte arrays of lactate, glutamate, and glucose sensors, first straight and then bent as shown in
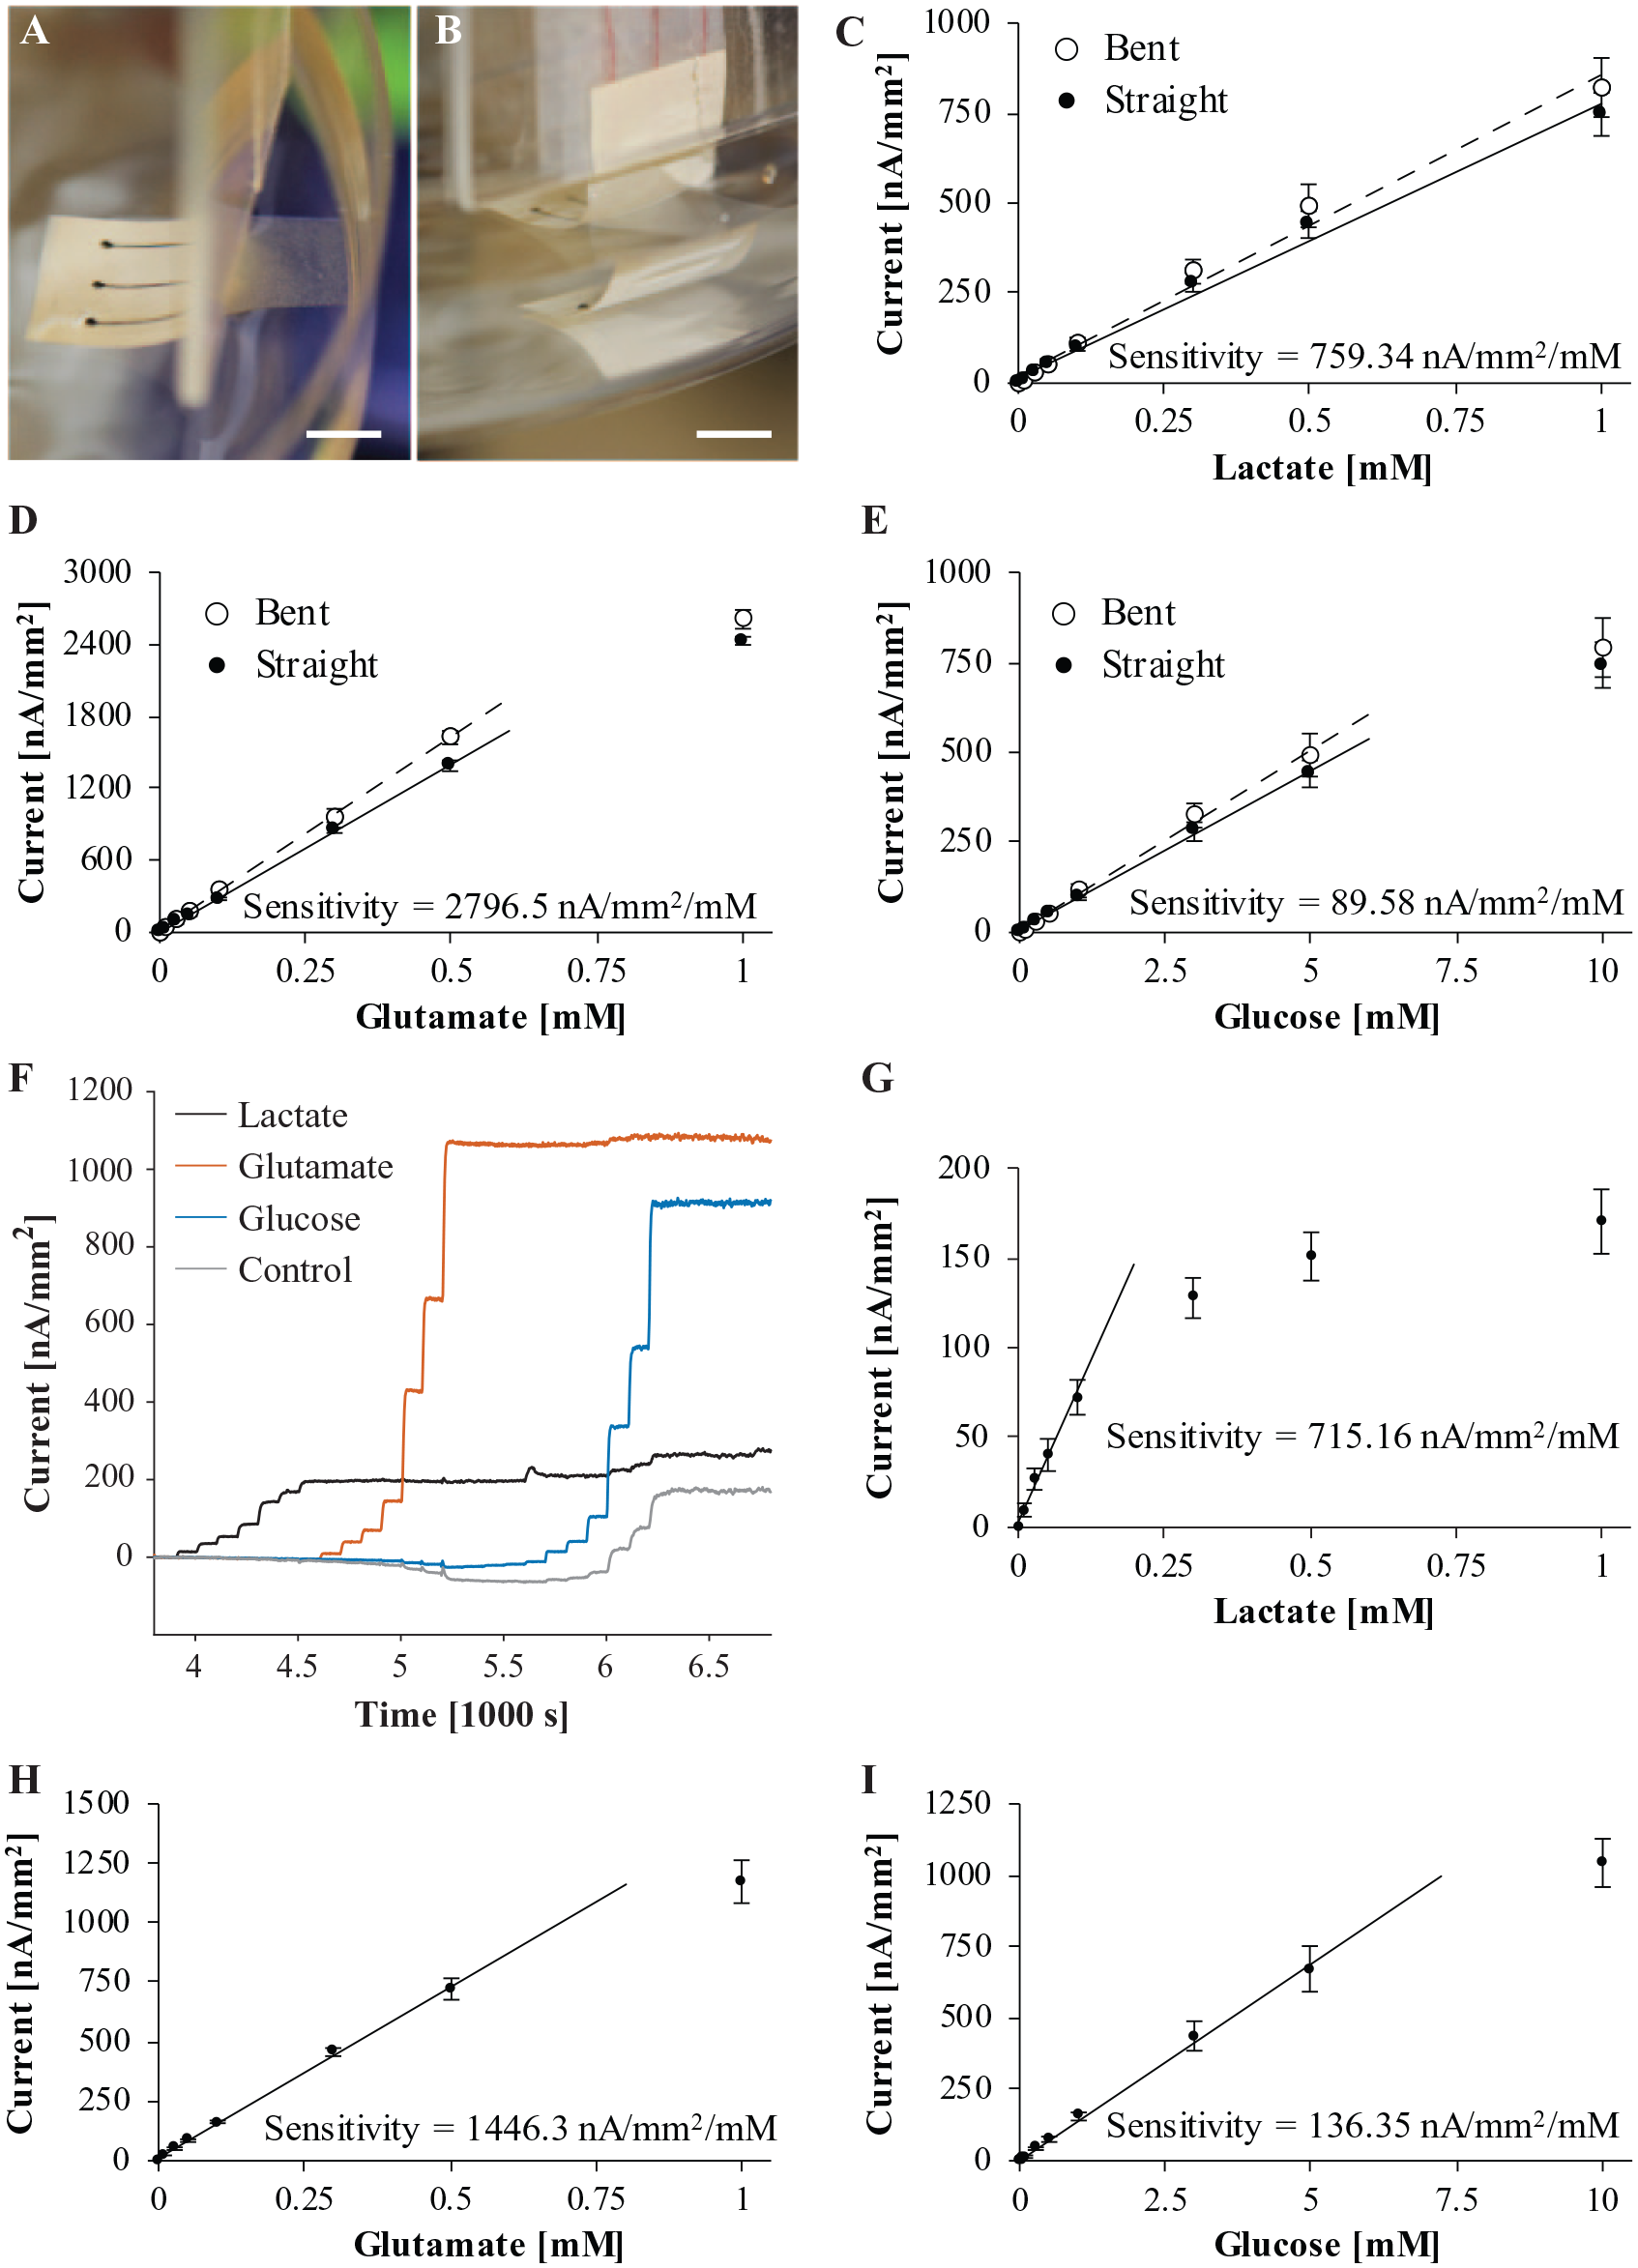
Calibration of biosensor arrays in 0.01 M PBS (pH 7.4). (
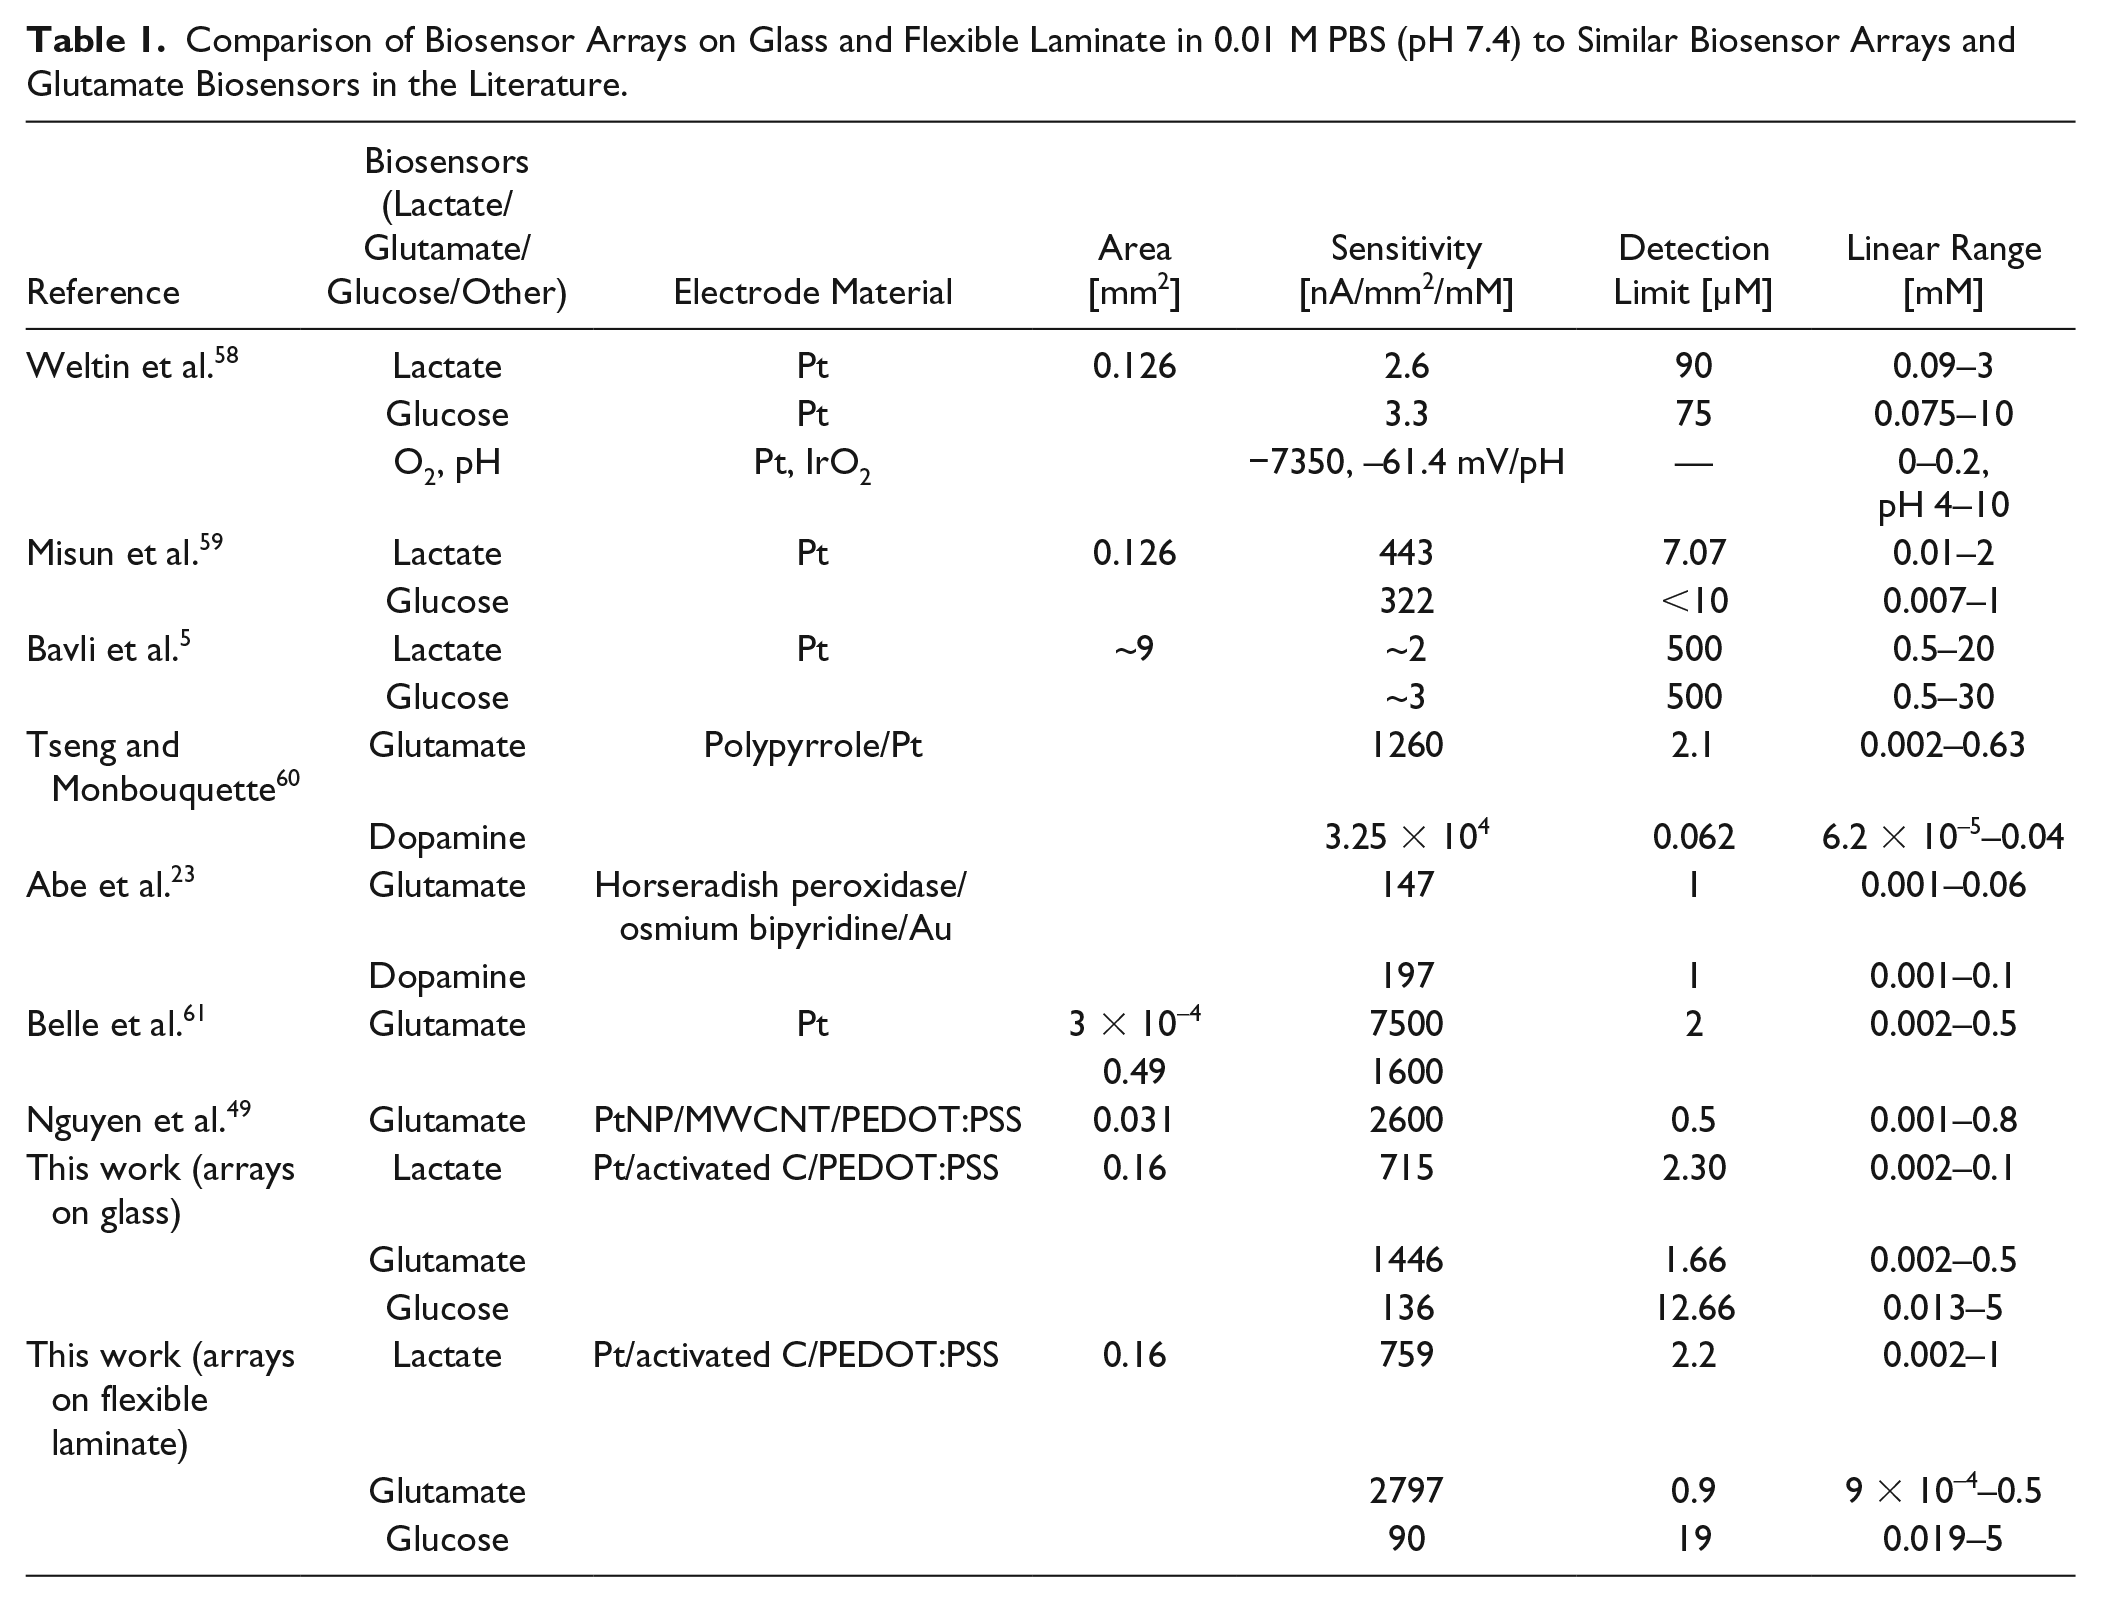
Comparison of Biosensor Arrays on Glass and Flexible Laminate in 0.01 M PBS (pH 7.4) to Similar Biosensor Arrays and Glutamate Biosensors in the Literature.
Lactate did not interfere with the other glutamate, glucose, or control sensors. However, there was crosstalk interference from glutamate and glucose. Glutamate above 50 µM decreased the current of nonglutamate sensors. Cordeiro et al. found that lactate below 8 mM had a similar effect on their pyruvate sensor. 13 On the other hand, glucose increased the current of nonglucose sensors. This type of crosstalk is common between enzyme-based biosensors on a multianalyte array.64,65 The most likely cause is the excess H2O2 from glucose oxidase that escapes from the glucose sensor electrode into the bulk PBS. Adding a layer of catalase on top of the enzyme/BSA/glutaradehyde matrix is one way to prevent crosstalk from excess H2O2.15,33 Another way is by self-referencing.25,52
We addressed crosstalk and other interferences by self-referencing. We included control, or sentinel, electrodes on our biosensor arrays, which we functionalized with only Nafion and a BSA/glutaraldehyde matrix. Signal from the control electrode can be subtracted from biosensor signals to remove interference and drift. We assumed that interference and drift are constant among control and biosensor electrodes. Unexpectedly, in PBS, crosstalk from glucose sensors was not uniform across lactate, glutamate, and control sensors. In fact, crosstalk affects control sensors the worst and glutamate sensors the least. This may be due to differences in enzyme/BSA/glutaraldehyde matrix composition across biosensors. More BSA (2.5%) was applied to glutamate sensors than to the others (0.8%). Alternatively, interference from glutamate and excess H2O2 may depend in part on total current, so interference may be reduced when biosensor currents are near saturation.
Based on crosstalk interference, we calculated the selectivity of biosensors to glutamate and glucose when applicable. Lactate and glutamate sensors respond to their respective analytes over 100 times more than to crosstalk from glucose sensors (103:1 and 712:1). Nonetheless, we calibrated glucose to 10 mM, and interference becomes apparent around 5 mM glucose. On the other hand, glucose sensors were much less selective against glutamate (17:1), yet we calibrated and measured glutamate over a smaller range, 0.01–1 mM.
Characterization in Cell Culture Medium
Although PBS is an optimal electrolyte for the biosensors, it is poorly suited for maintaining human astrocytes long-term. Within only 2 h of being in PBS at room temperature, the morphology of human astrocytes changes drastically (
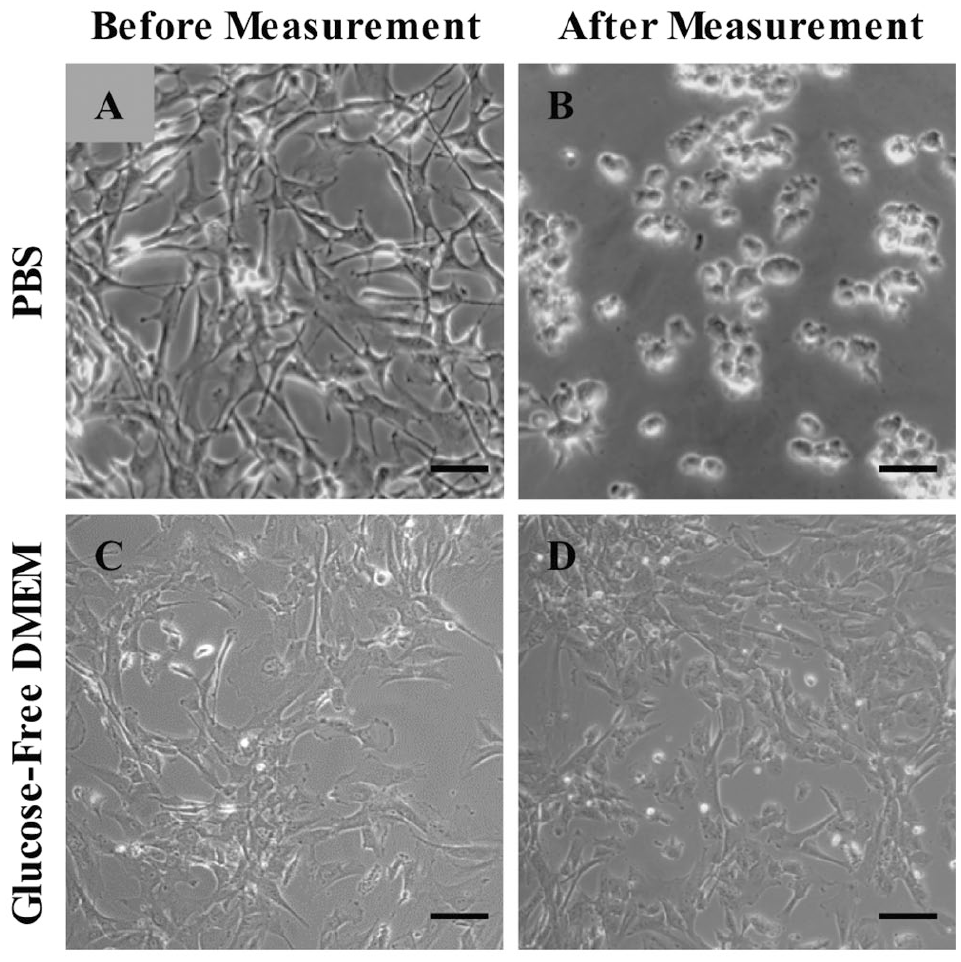
Human astrocytes. Scale bar = 50 µm. (
Therefore, we decided to measure lactate, glutamate, and glucose from astrocytes in cell culture medium. Astrocyte medium contains 5.5 mM glucose, so we used glucose-free DMEM + 2% FBS + 100 U/mL penicillin/streptomycin (GFDMEM). In contrast to astrocytes in PBS (
We calibrated each biosensor array in GFDMEM prior to measuring from astrocytes. Figure 4A shows a representative plot of current density as a function of time for each biosensor and control sensor on the same array. We chose calibration concentration points based on expected concentrations during measurement from astrocytes. As with calibrations in PBS, glutamate reduced the current of all other biosensors. On the other hand, glucose did not increase the current of other biosensors, whether directly or indirectly via H2O2. Glucose apparently interfered in a similar way to glutamate. This suggests that in DMEM there is little crosstalk from excess H2O2 from the glucose sensor. Similarly, Ward et al. saw crosstalk from glucose sensor H2O2 during calibration in aqueous buffer, which disappeared during subcutaneous in vivo measurement. 10 Ward et al. attributed this phenomenon to not stirring in vivo, reducing the flow velocity of H2O2. We did stir during calibrations in GFDMEM, so hydrodynamics cannot entirely explain our observations. Serum proteins and vitamins in GFDMEM may have oxidized excess H2O2 before it accumulated enough to cause crosstalk. In contrast to calibrations in PBS, glutamate and glucose interfered equally across the other biosensors. Therefore, we were able to eliminate crosstalk from lactate, glutamate, and glucose measurements by subtracting control sensor signal as intended.
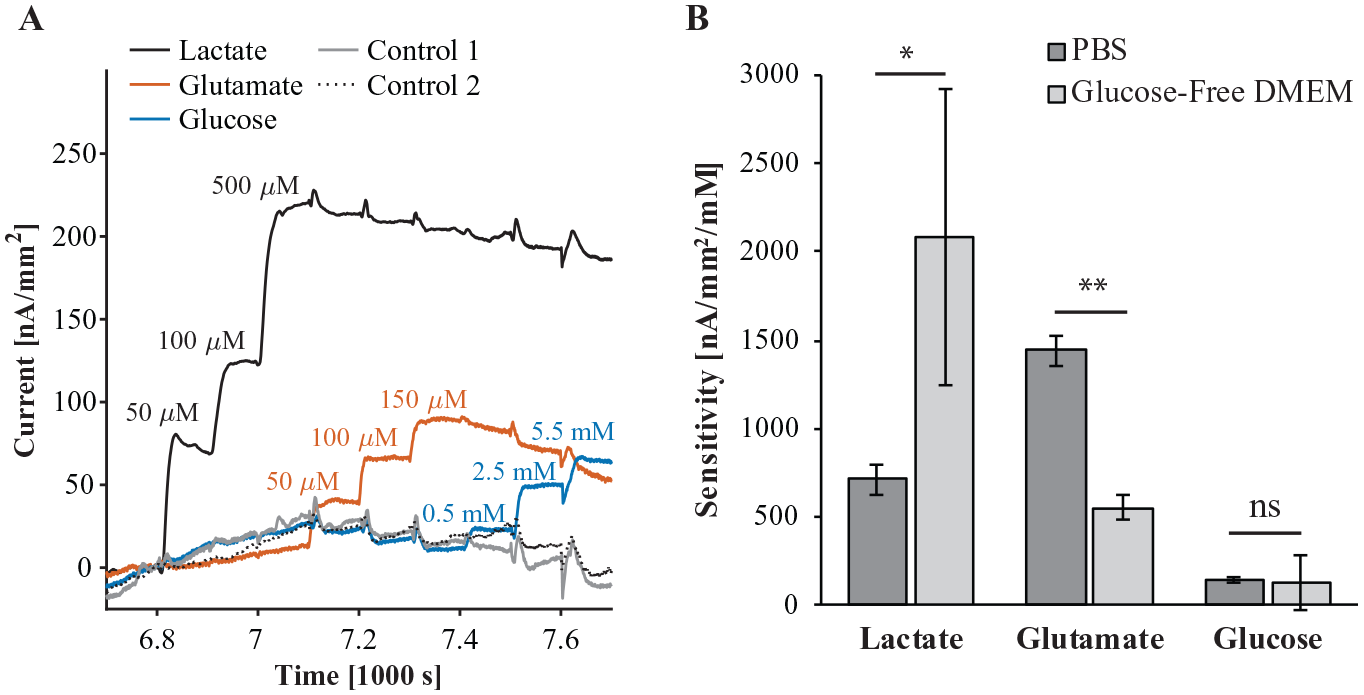
Calibration of biosensor arrays in GFDMEM and comparison of sensitivity to biosensors in 0.01 M PBS (pH 7.4). (
Figure 4B compares the sensitivity of lactate, glutamate, and glucose sensors in PBS to the sensitivity in GFDMEM from triplicate calibrations. The sensitivity of glutamate sensors significantly decreased from PBS to GFDMEM (t test, p < 0.001). Surprisingly, lactate sensors were more sensitive in GFDMEM than in PBS (t test, p < 0.05), and the mean glucose sensor sensitivity did not change from PBS to GFDMEM. There was more variability in sensitivity among lactate and glucose sensors in GFDMEM than those in PBS. We had not expected the sensitivity of any biosensor to increase from PBS to GFDMEM. The increase in lactate sensitivity is more likely due to variability between enzyme functionalization. Whereas all biosensors calibrated in PBS were functionalized simultaneously, biosensors calibrated in DMEM and used for measuring cells were functionalized separately on different days. This may also explain the greater variability in sensitivity in GFDMEM versus PBS.
Multianalyte Measurement from Human Astrocytes
Once we calibrated biosensor arrays in GFDMEM (
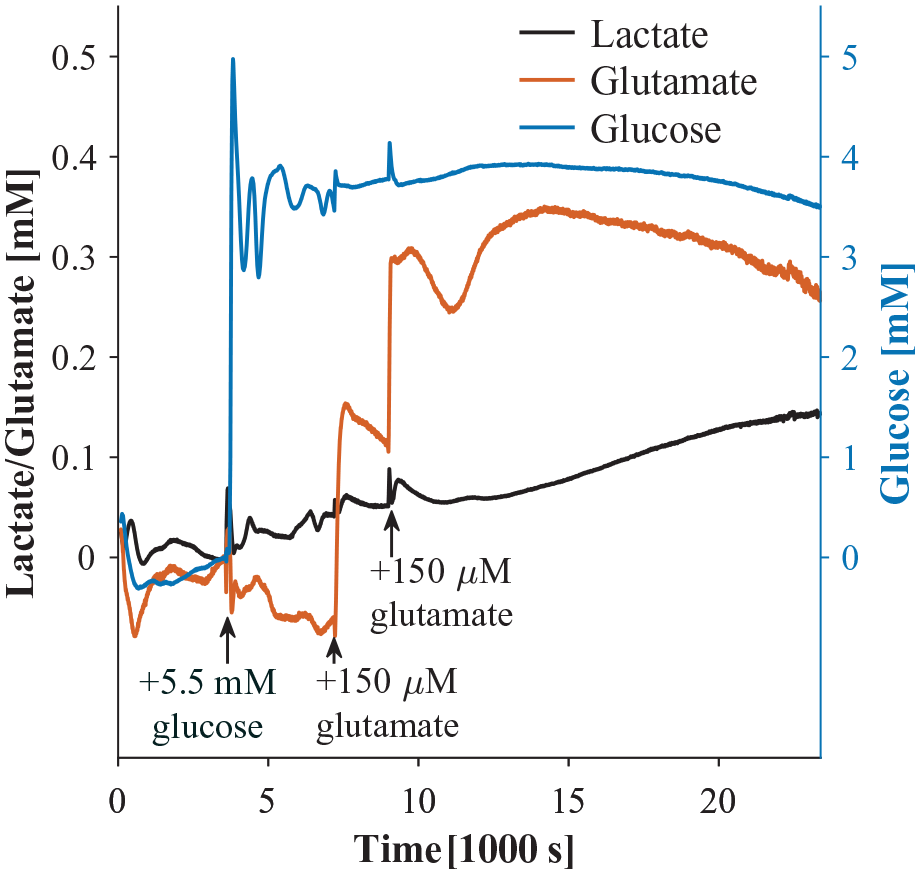
Lactate, glucose, and glutamate as a function of time 1 mm above human astrocyte culture in GFDMEM in a humidified incubator at 37 °C and 5% CO2. Note that the glucose response is significantly larger due to the larger glucose dosage to reflect a physiologically relevant concentration.
From 1 to 2 h, we measured an average of 3.6 mM glucose, 65% of the expected concentration, 5.5 mM. Sensor degradation between measurements may have contributed to this discrepancy, which we could address in the future with in situ calibration. 37 Oscillations in observed glucose may be due to convective mixing. The response time during measurement appears slower because we did not stir as we did during calibration. By 6.5 h, we measured 3.5 mM, a 3% decrease from 1 to 2 h. Assuming we measured the bulk concentration, the observed glucose consumption was 20 µM/h, or 5 pM/cell/s, assuming 1.2 × 10⁶ cells at confluency. Despite our assumption of measuring the bulk concentration, we expect that transport limitations affected the observed consumption rate.37,38,57 We would expect to observe a higher consumption rate from the same number of cells in a shallower well or in a stirred well.
As for glutamate, we measured 0.153 mM 6.5 min after adding 0.15 mM, 102% of expected. After another 30 min, we added 0.15 mM glutamate more and measured an increase of 0.186 mM (from 0.113 to 0.3 mM) within 2 min, so 124% recovery. Both times we added glutamate, it decreased largely linearly for about 30 min. Glutamate consumption after adding 0.15 mM was 80 µM/h or 19 pM/cell/s. Consumption after adding another 0.15 mM was 53 µM/h or 12 pM/cell/s. Then, at around 11.2 h, glutamate unexpectedly increases again. The standard deviation of glutamate measurements was large compared with those of lactate and glucose because the glutamate bolus took longer to mix throughout our system during some measurements. We could solve this problem by delivering glucose and glutamate with syringe pumps. 66
Lactate was the one analyte we did not add to the system. Lactate increased by 0.144 mM from adding 5.5 mM glucose at 1 h to the end of the measurement at 6.5 h. Assuming we measured bulk solution lactate at each time point, cells secreted lactate at a rate of 26.2 µM/h over 5.5 h, or 6 pM/cell/s. Therefore, the lactate-to-glucose ratio is 1.2. The upper limit of the lactate-to-glucose ratio is 2 because anaerobic glycolysis produces 2 mol lactate from 1 mol glucose. A higher lactate-to-glucose ratio in the presence of oxygen suggests the Warburg effect, a phenotype of cancer cells. At the other end, cells undergoing lactate acidosis, common among solid tumors, would have negligible lactate production and a low lactate-to-glucose ratio. We suspect that convection after adding 5.5 mM glucose caused transients in lactate, glutamate, and glucose measurements between 1 and 2 h. It is possible that our measurements overestimate glucose and glutamate consumption and underestimate lactate secretion since enzymatic biosensor sensitivities are expected to decrease over time during continuous measurement. We tested the lactate sensor’s response after measurement (
Biosensor Stability
Eventually, we will measure lactate, glutamate, and glucose from astrocytes and other cells by growing cells on top of the biosensor array (
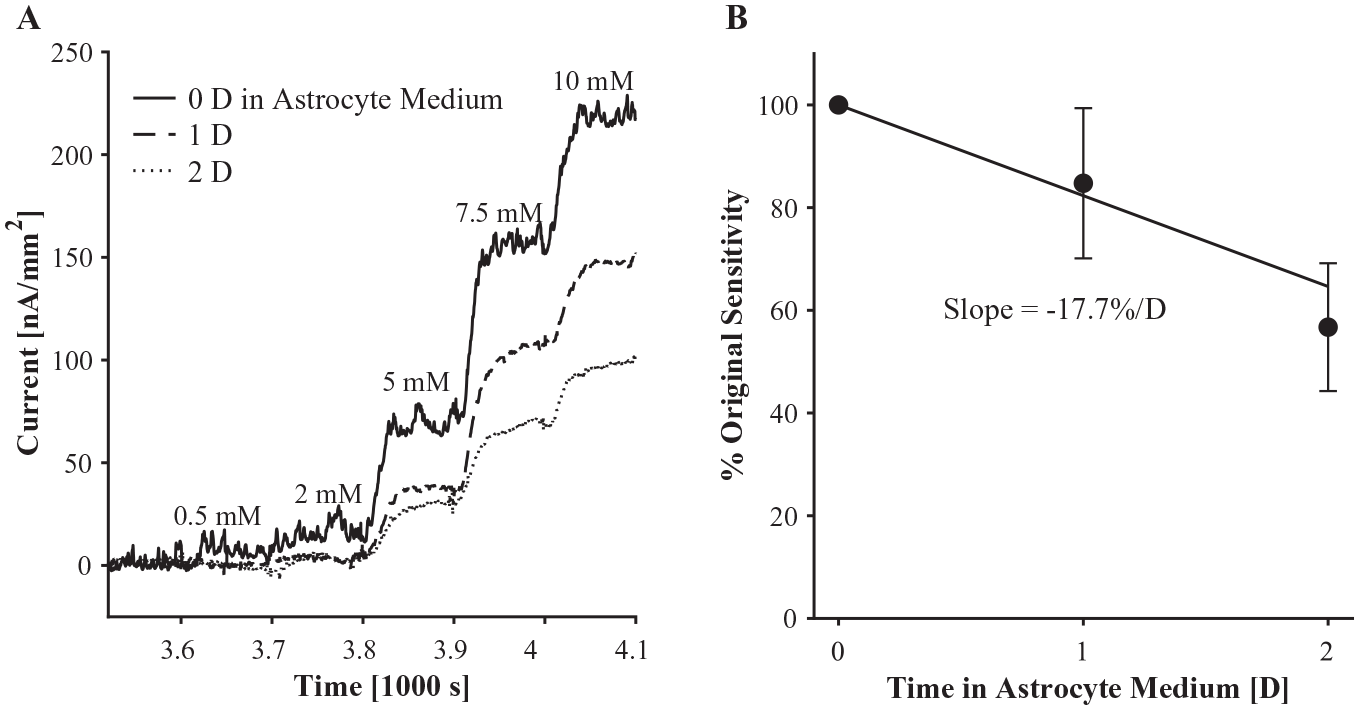
Glucose biosensor performance over 2 days of incubation (humidified, 37 °C, 5% CO2) in astrocyte medium. (
The rate of glucose sensors’ degradation was similar to that of other enzyme-based biosensors. 67 For example, glutamate sensors made by Ganesana et al. (2019) lost about 20% sensitivity after 1 day and 30% after 2 days of dry storage at 4 °C. Ganesana et al. also found that the same glutamate sensors measured every day for 7 days had lost 40% sensitivity, while glutamate sensors measured after only 7 days had lost only 5% sensitivity. Likewise, repeated calibrations before incubation, at days 1 and 2, probably contributed to sensitivity lost by our glucose sensors. In that case, –17% sensitivity per day in medium (humidified, 37 °C, 5% CO2) would be an overestimation. We need to further evaluate the impact of incubation on sensitivity during repeated measurement to decouple these two variables.
In addition, we will study the stability of lactate and glutamate sensors. Because astrocyte medium contains 5.5 mM glucose, it is possible that glucose sensors would degrade the fastest. In contrast to lactate oxidase and glutamate oxidase, glucose oxidase in the presence of 5.5 mM glucose would continuously produce H2O2, which would accumulate unless the biosensor is biased to 0.5 V versus Ag/AgCl. H2O2 deactivates the Pt electrodes over time. 68 This would be an issue if one waited days for cells to grow on top of a biosensor array before measurement. On the other hand, one may want to continuously measure glucose, lactate, and glutamate during cell growth.
In this work, we have demonstrated the usefulness of direct writing for low-cost rapid prototyping of electrochemical biosensor arrays. Direct writing can complement other printing techniques, such as inkjet maskless lithography. 69 Compared with inkjet printing, direct writing involves printing higher-viscosity materials omnidirectionally. Depending on the material, direct writing can create spanning structures in air. 70 Besides rapid prototyping, an advantage of our multianalyte biosensor system is the ease of integration or direct use with conventional, commercially available cell culture systems: tissue culture plates and standard incubators. One remaining limitation of our approach is the potentiostat system. In this work, we used five individual potentiostats wired through the back of an incubator. A potentiostat with at least four channels could have been used likewise. A small, wireless multichannel potentiostat, similar to recently developed devices,71,72 into which we could simply plug devices would make our system more accessible and bring it closer to being a “smart petri dish.”
This work expands the function of biosensors arrays made by direct ink writing. Because we print extrudable and flexible components, sensing elements can be printed on any 3D or flexible substrate. We have shown here that printed enzyme-based multianalyte biosensor arrays function in a complex cell culture medium, which is a promising step toward implanting similar devices for in vivo measurements.
Supplemental Material
Supplemental_Material_for_Direct_Writing_Biosensor_Array_by_Nolan_et_al – Supplemental material for Simple Fabrication of Flexible Biosensor Arrays Using Direct Writing for Multianalyte Measurement from Human Astrocytes
Supplemental material, Supplemental_Material_for_Direct_Writing_Biosensor_Array_by_Nolan_et_al for Simple Fabrication of Flexible Biosensor Arrays Using Direct Writing for Multianalyte Measurement from Human Astrocytes by James K. Nolan, Tran N. H. Nguyen, Khanh Vy H. Le, Luke E. DeLong and Hyowon Lee in SLAS Technology
Footnotes
Acknowledgements
We thank Dr. David B. Janes, Dr. Jenna L. Rickus, Dr. Siddarth V. Sridharan, and Dr. Jose F. Rivera for their helpful discussion. We thank Dr. Jenna L. Rickus for also providing lactate oxidase and astrocytes. We also thank Dr. Sarah Calve and Mazin Hakim for their help with rheological tests. Finally, we thank L. Garrett Bangert and Barnabas T. Obeng-Gyasi for assistance during flexible biosensor calibrations.
Supplemental material is available online with this article.
Declaration of Conflicting Interests
The authors declared no potential conflicts of interest with respect to the research, authorship, and/or publication of this article.
Funding
The authors disclosed receipt of the following financial support for the research, authorship, and/or publication of this article: Division of Computer and Network Systems (grant/award no. CNS-1726865).
References
Supplementary Material
Please find the following supplemental material available below.
For Open Access articles published under a Creative Commons License, all supplemental material carries the same license as the article it is associated with.
For non-Open Access articles published, all supplemental material carries a non-exclusive license, and permission requests for re-use of supplemental material or any part of supplemental material shall be sent directly to the copyright owner as specified in the copyright notice associated with the article.