
Abstract
Mass cytometry (CyTOF) is a critical cell profiling tool in acquiring multiparameter proteome data at the single-cell level. A major challenge in CyTOF analysis is sample-to-sample variance arising from the pipetting process, staining variation, and instrument sensitivity. To reduce such variations, cell barcoding strategies that enable the combination of individual samples prior to antibody staining and data acquisition on CyTOF are often utilized. The most prevalent barcoding strategy is based on a binary scheme that cross-examines the existence or nonexistence of certain mass signals; however, it is limited by low barcoding efficiency and high cost, especially for large sample size. Herein, we present a novel barcoding method for CyTOF application based on mass ratiometry. Different mass tags with specific fixed ratios are used to label CD45 antibody to achieve sample barcoding. The presented method exponentially increases the number of possible barcoded samples with the same amount of mass tags compared with conventional methods. It also reduces the overall time for the labeling process to 40 min and avoids the need for expensive commercial barcoding buffer reagents. Moreover, unlike the conventional barcoding process, this strategy does not pre-permeabilize cells before the barcoding procedure, which offers additional benefits in preserving surface biomarker signals.
Introduction
Recently, mass cytometry (CyTOF) has facilitated high-throughput and multiplex approaches to acquire single-cell immunological information for clinical diagnostics. Experimental procedures involve phenotyping cell subsets and analyzing the changes in diverse cellular functions such as RNA abundance, 1 protein expression,2,3 cytokine secretion, 4 cycle progression, 5 cell death, 6 and cell interaction. 7 CyTOF enables complex, deep, and multidimensional single-cell analysis, and currently provides up to 40 immunological parameters.8,9 However, the uniformity of CyTOF data is highly influenced by sample processing procedures, such as antibody concentration, cell number, cell transmission, and instrument sensitivity, which may cause significant artificial differences among identical cell populations and samples. 10 Therefore, many studies have used the sample barcoding method, which labels samples with unique barcodes and processing them simultaneously, to attain reliable results.11–13
The sample barcoding strategy used in previous CyTOF research was based on combinations of negative and positive signals from specific mass channels. The mass tags labeled on the cell surface or intracellular components enable the identification of individual samples from the pooled barcoded composite.12–14 High reagent costs and low efficiency of such a two-state barcoding strategy are challenges to realizing large-cohort studies of clinical research. Moreover, the commercial mass-tag cell barcoding (MCB) method, based on a six-choose-three combination strategy with six palladium chelations, requires cell permeabilization prior to processing and is commonly reported to interrupt surface antigen epitope expressions. 15 In addition, commercial barcoding reagents are expensive and time-intensive, specifically requiring at least 3 h in the labeling protocol. Thus, an effective, economic, and surface antibody-protecting method for CyTOF cell barcoding is highly beneficial.
The cellular surface protein antigen CD45, expressed in the majority of immune cells, can be dynamically barcoded to most channels. 14 CD45 is a stable indicator of a target’s surface expression level for barcoding under various experimental conditions, such as scarce samples, multiplex samples, and samples with multiple time points or drug stimulations. 15 The large amount of CD45 receptors available for binding when labeled with two or more epitopes in the multiplex barcoding strategy provides clear differentiations in peripheral blood mononuclear cell (PBMC) samples.16,17 Recently, novel barcoding approaches based on CD45 were described to circumvent permeabilization problems;16,18 however, the nonuniform expression of CD45 in cells remains a limiting factor for its application. Ratiometric measurements facilitate the reduction of background signal noises arising from excitation power fluctuations, detector optoelectronic drift, and inhomogeneity behaviors. 19 Herein, we present a novel barcoding strategy based on mass ratiometry, utilizing special ratios among labeling mass tags conjugated to CD45 antibody for barcoding purposes. The presented barcoding scheme describes a CD45-based sample barcoding method, as illustrated in Figure 1 .
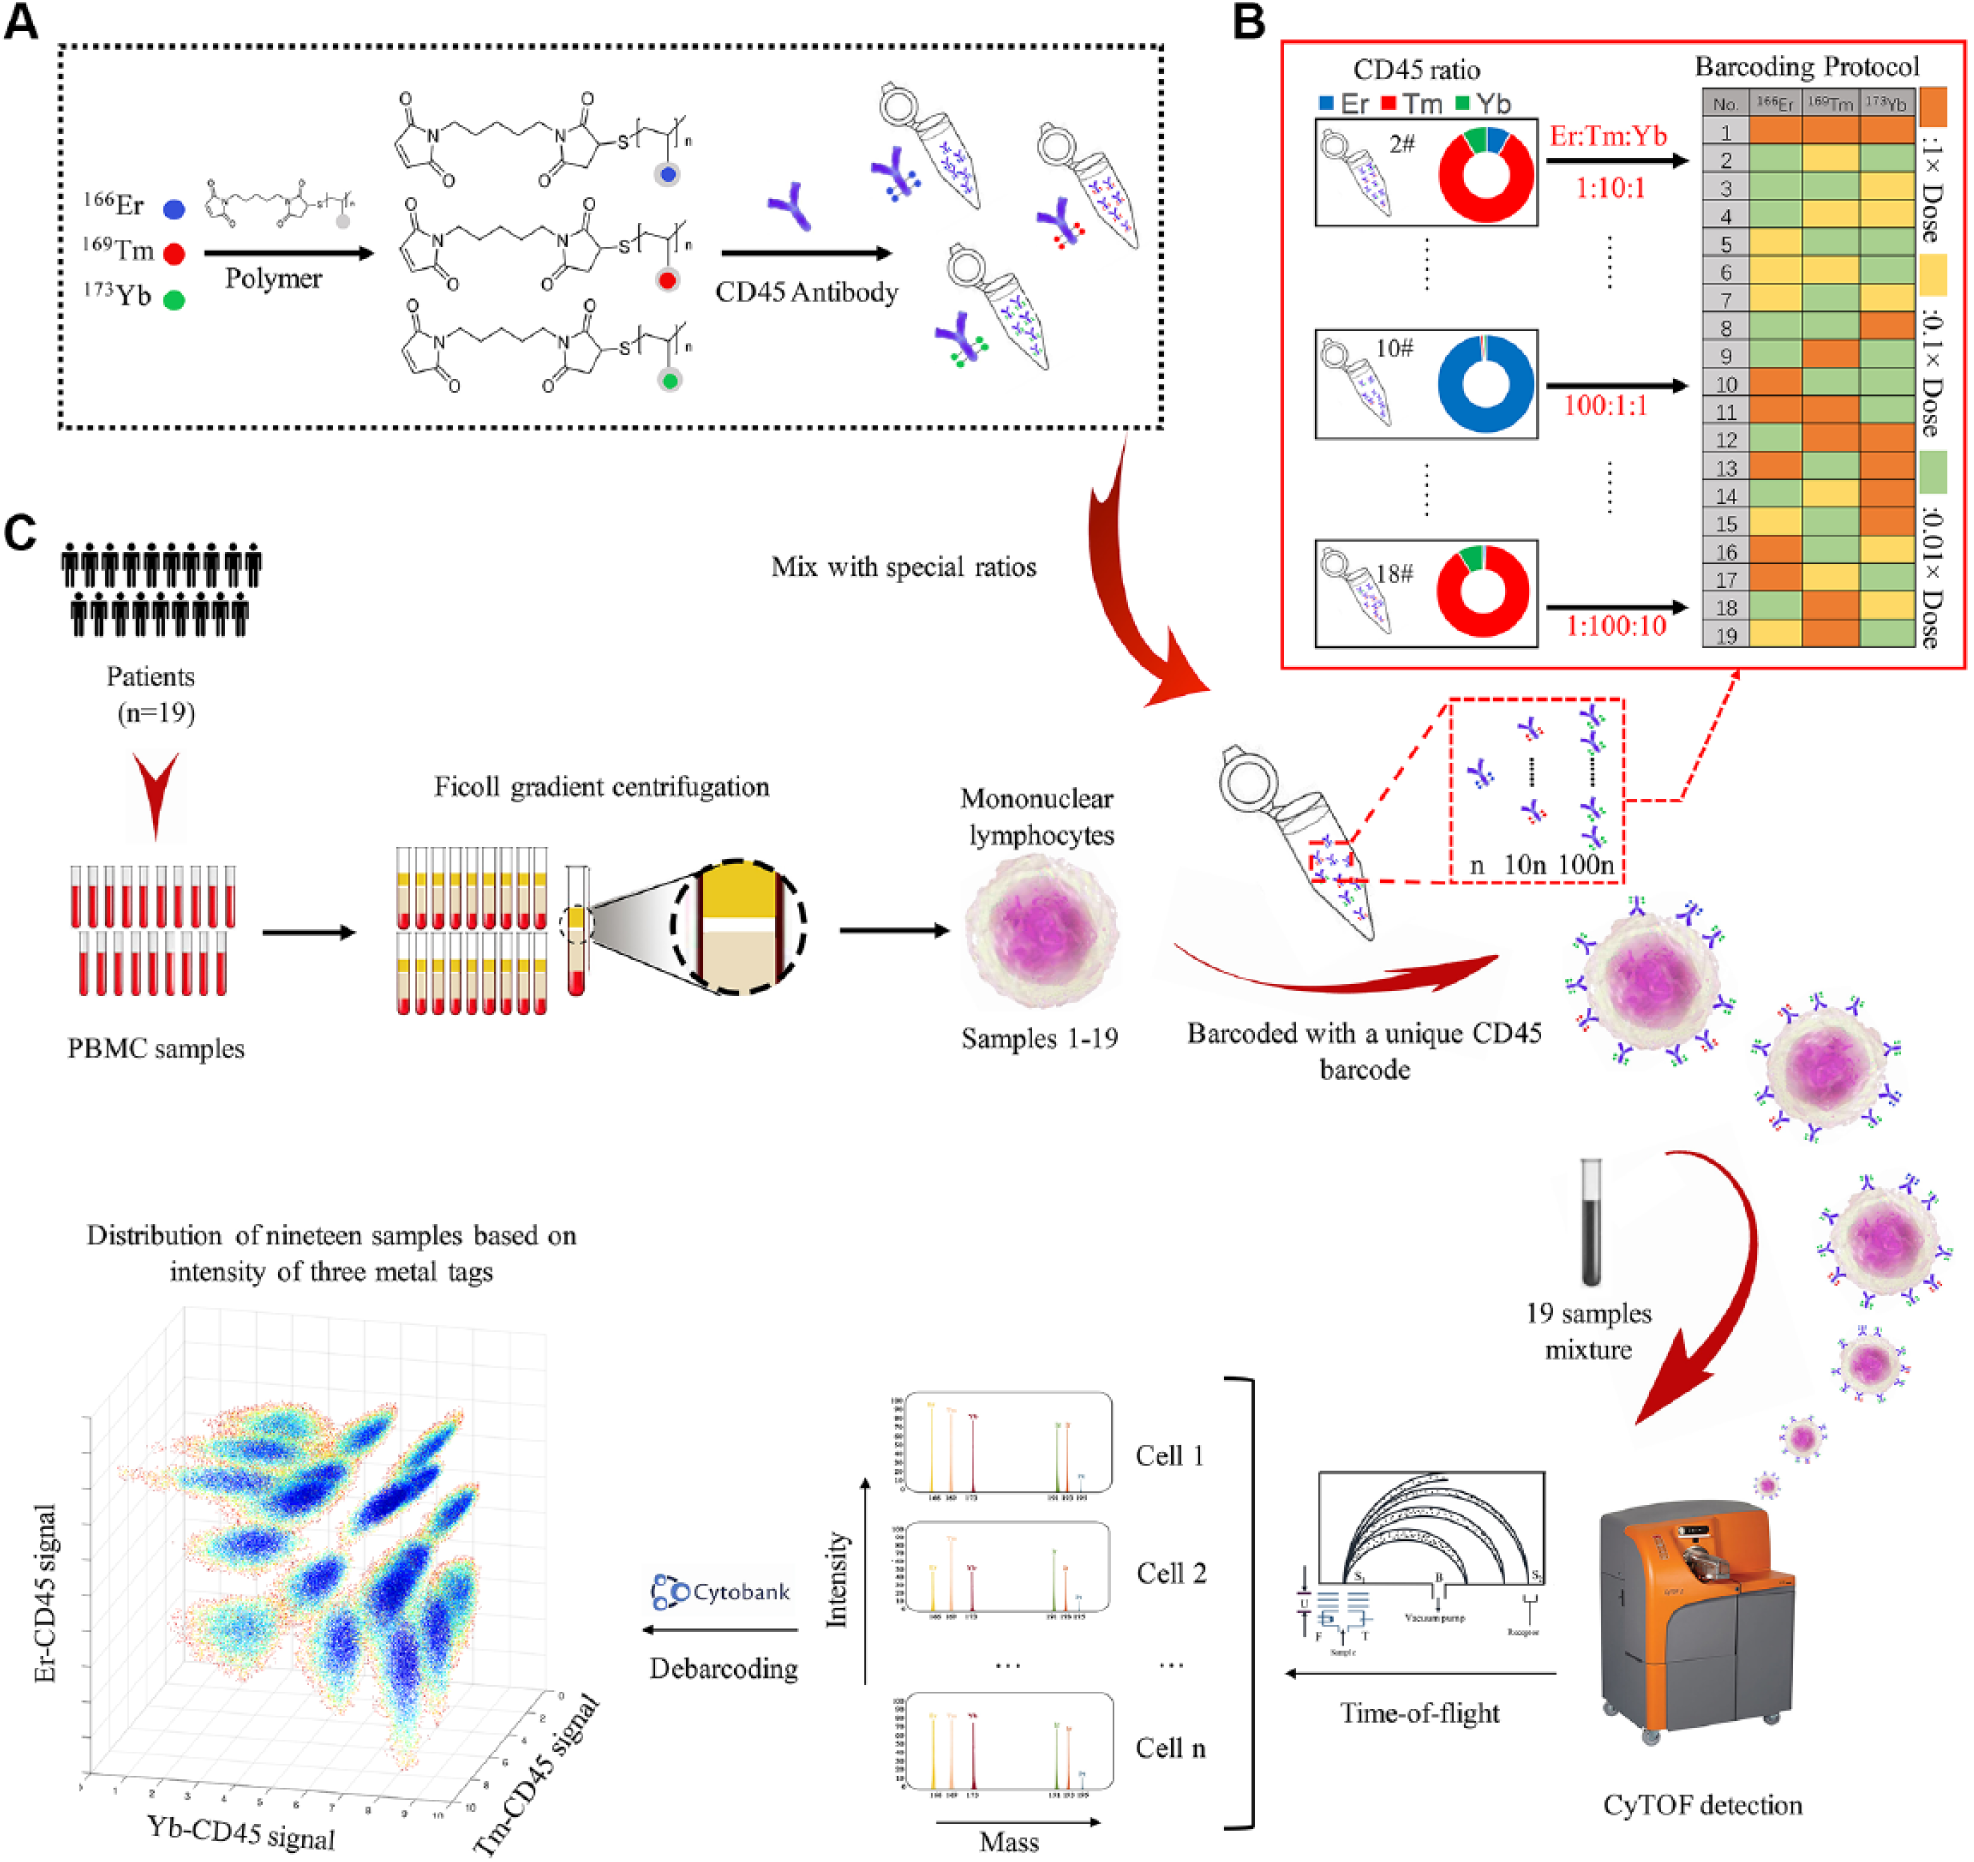
Schematic diagram of the CD45 mass-ratiometry barcoding method for CyTOF detection. (
To evaluate this method’s effectiveness, three mass tags at three different ratios were applied to barcode 19 samples. An exponential number of samples can be barcoded with several mass channels by increasing the mass and ratio number. Compared with existing commercial methods, this barcoding method can prevent the permeabilization destruction of surface markers. 20 Since no permeabilization process is required, the total sample washing process is reduced to only three times, leading to a higher cell recovery number. The simplified process reduces the labeling time to 40 min. Meanwhile, the presented method decreases antibody consumption 21 and reduces the intersample variations during sample preparation and measurement. Furthermore, the presented technique can also be applied in combination with the conventional MCB approach to permit experiments that were previously deemed unfeasible due to low barcoding efficiency. This methodology provides a highly efficient, accurate, and stable cell barcoding strategy that decreases the number of decremented mass channels for single-cell mass spectrum analysis.
Materials and Methods
Human Whole-Blood Sample Processing
PBMC samples were obtained by processing the whole blood of patients collected from the Shanghai Tumor Hospital via gradient centrifugation over Ficoll medium (GE Healthcare), and then labeled with Cisplatin (Sigma-Aldrich, St. Louis, MO) to distinguish live/dead cells. Next, the PBMC samples were washed with phosphate-buffered solution (PBS) and cryopreserved. Frozen PBMC samples underwent a cell count calculation and viability analysis using a Cellometer (Nexcelom, Lawrence, MA). PBMC viability was on average >95%. The samples were kept in 150 μL of CyTOF cell staining buffer (CSB; PBS with 0.5% bovine serum albumin and 0.02% sodium azide) containing 10% DMSO at −80 °C for long-term storage. During experiments, PBMC samples were thawed in a 37 °C water bath, washed twice in CSB, and kept on ice pending use.
Antibody Mass Labeling
Purified antibodies (without carrier proteins) were purchased from Biolegend (San Diego, CA), and 100 μg of each antibody was labeled using the MaxPar X8 chelating polymer kit (Fluidigm Sciences, South San Francisco, CA) according to the manufacturer’s protocols. After labeling, all antibody concentrations were quantified by a NanoDrop (Thermo Fisher, Waltham, MA) at 280 nm. Antibody stabilization buffer (Fluidigm Sciences) was added to adjust the samples to the desired concentration. All antibodies were kept at 4 °C. Three CD45 antibodies were labeled with 166Er, 169Tm, and 173Yb isotopes. Based on the NanoDrop absorbance results, or preferably the specific antibody cell staining titration results by CyTOF, the final concentrations of the three conjugated CD45 antibodies were diluted to the same level.
Preparation of CD45 Antibody Barcoding Cocktail
Following labeling and equalization, CD45 mass-ratiometry barcoding cocktails were prepared according to different ratios, which are described in the barcoding protocol table of Figure 1B . Of all CD45 cocktails, 100× intensity antibody solutions (denoted as 100×) were acquired directly from the 1× original CD45 antibody solutions, while 10× and 1× were obtained by diluting the CD45 antibodies to 0.1× or 0.01× of the original concentration using the antibody stabilization buffer (Fluidigm Sciences). Nineteen different cocktails were prepared by adopting different concentrations of the three mass-conjugated CD45 antibody solutions according to the ratio design in Figure 1B . All CD45 cocktails were stored at 4 °C.
CD45 Mass-Ratiometry Barcoding Staining
CD45 antibody cocktail selected from the CD45 mass-ratiometry barcoding kit was diluted with CSB to achieve a CD45 antibody concentration of ~1 μg/μL. According to the CD45 antibody titration results in
Mass-Tag Cell Barcoding Staining
MCB was performed using a commercial 20-plex Pd Barcoding Kit from Fluidigm. To guarantee uniform cell labeling, the barcoding protocol required fixation and permeabilization before labeling. After barcoding, the downstream protocol for antibody staining was performed.
Non-CD45 Antibody Staining
Following barcoding, samples were washed twice with the CyCSB solution, pooled, and incubated with the applicable antibodies with the same protocol as used in the CD45 antibody staining process. After antibody staining, the twice-washed cells were stained for 1 h at room temperature in 1 mL of 1:2000 191/193Ir DNA intercalator (Fluidigm Sciences) at a concentration of 0.5 μM, with 4% paraformaldehyde (PFA) in PBS. The cells were washed once with CyCSB solution and thrice with deionized water (18 MΩ, ultrapure) and analyzed on the same day.
Mass Cytometry Measurement
After the staining processes, the cells were analyzed using a CyTOF machine (Fluidigm Sciences). Before CyTOF sample injection and detection, samples were resuspended in 0.1× EQ four-element calibration bead buffer (Fluidigm Sciences) via diluting one part of bead buffer to nine parts of deionized water. The beads were added for data normalization. 22 Sample cells were then resuspended at a concentration of 0.5–1 × 10⁶ cells/mL. Afterwards, sample data collected from different tubes were normalized based on a four-element bead signal using the CyTOF software (Fluidigm Sciences).
Fundamental Data Analysis and Visualization
Initial data processing and gating were performed on the Cytobank platform. 23 Beads were gated off from the samples and data. Then the singlets were gated, based on 191/193Ir and event length channels. Dead cells were removed by 195Pt channel. MCB debarcoding was performed on the debarcoder software (Fluidigm Sciences). A three-dimensional scatterplot was obtained in MATLAB (r2015b; MathWorks, Natick, MA).
Manual Debarcoding Methods for CD45 Mass-Ratiometry Barcoding Mixed Samples
The debarcoding method was based on the ratio relationship among the three mass-conjugated CD45 expressions as the ratiometry strategy. On the cytometry data-analyzing platform (Cytobank.org),
23
after uploading the data, the barcoding channels could be selected for gating. All individual samples were located as a narrow elliptic type line following a Poisson distribution (
Fig. 2B
) in which slopes were consistently around 1 while their Y intercepts varied among 0, 1, and 2, which corresponds to the ratiometry of 1:1, 1:10, and 1:100. The intensity of each mass-tag channel is presented in a logarithmic form as the distance. If the samples were barcoded over two mass epitopes, the gating was carried on by changing the gating channels until all prelabeling barcoding channels were utilized. The gated populations were then analyzed as individual samples. The debarcoding process of 19 samples at three-mass with three-ratio barcoding mainly comprised two steps, which are shown in
Barcoding and debarcoding strategies of the mass-ratiometry barcoding method. (
Automatic Barcode Deconvolution
Debarcoding results of 19-plex barcoded data by the MCB method were performed using the single-cell debarcoding algorithm in MATLAB (r2015b). 21
Results
Barcoding Based on Concentration Signal for CyTOF
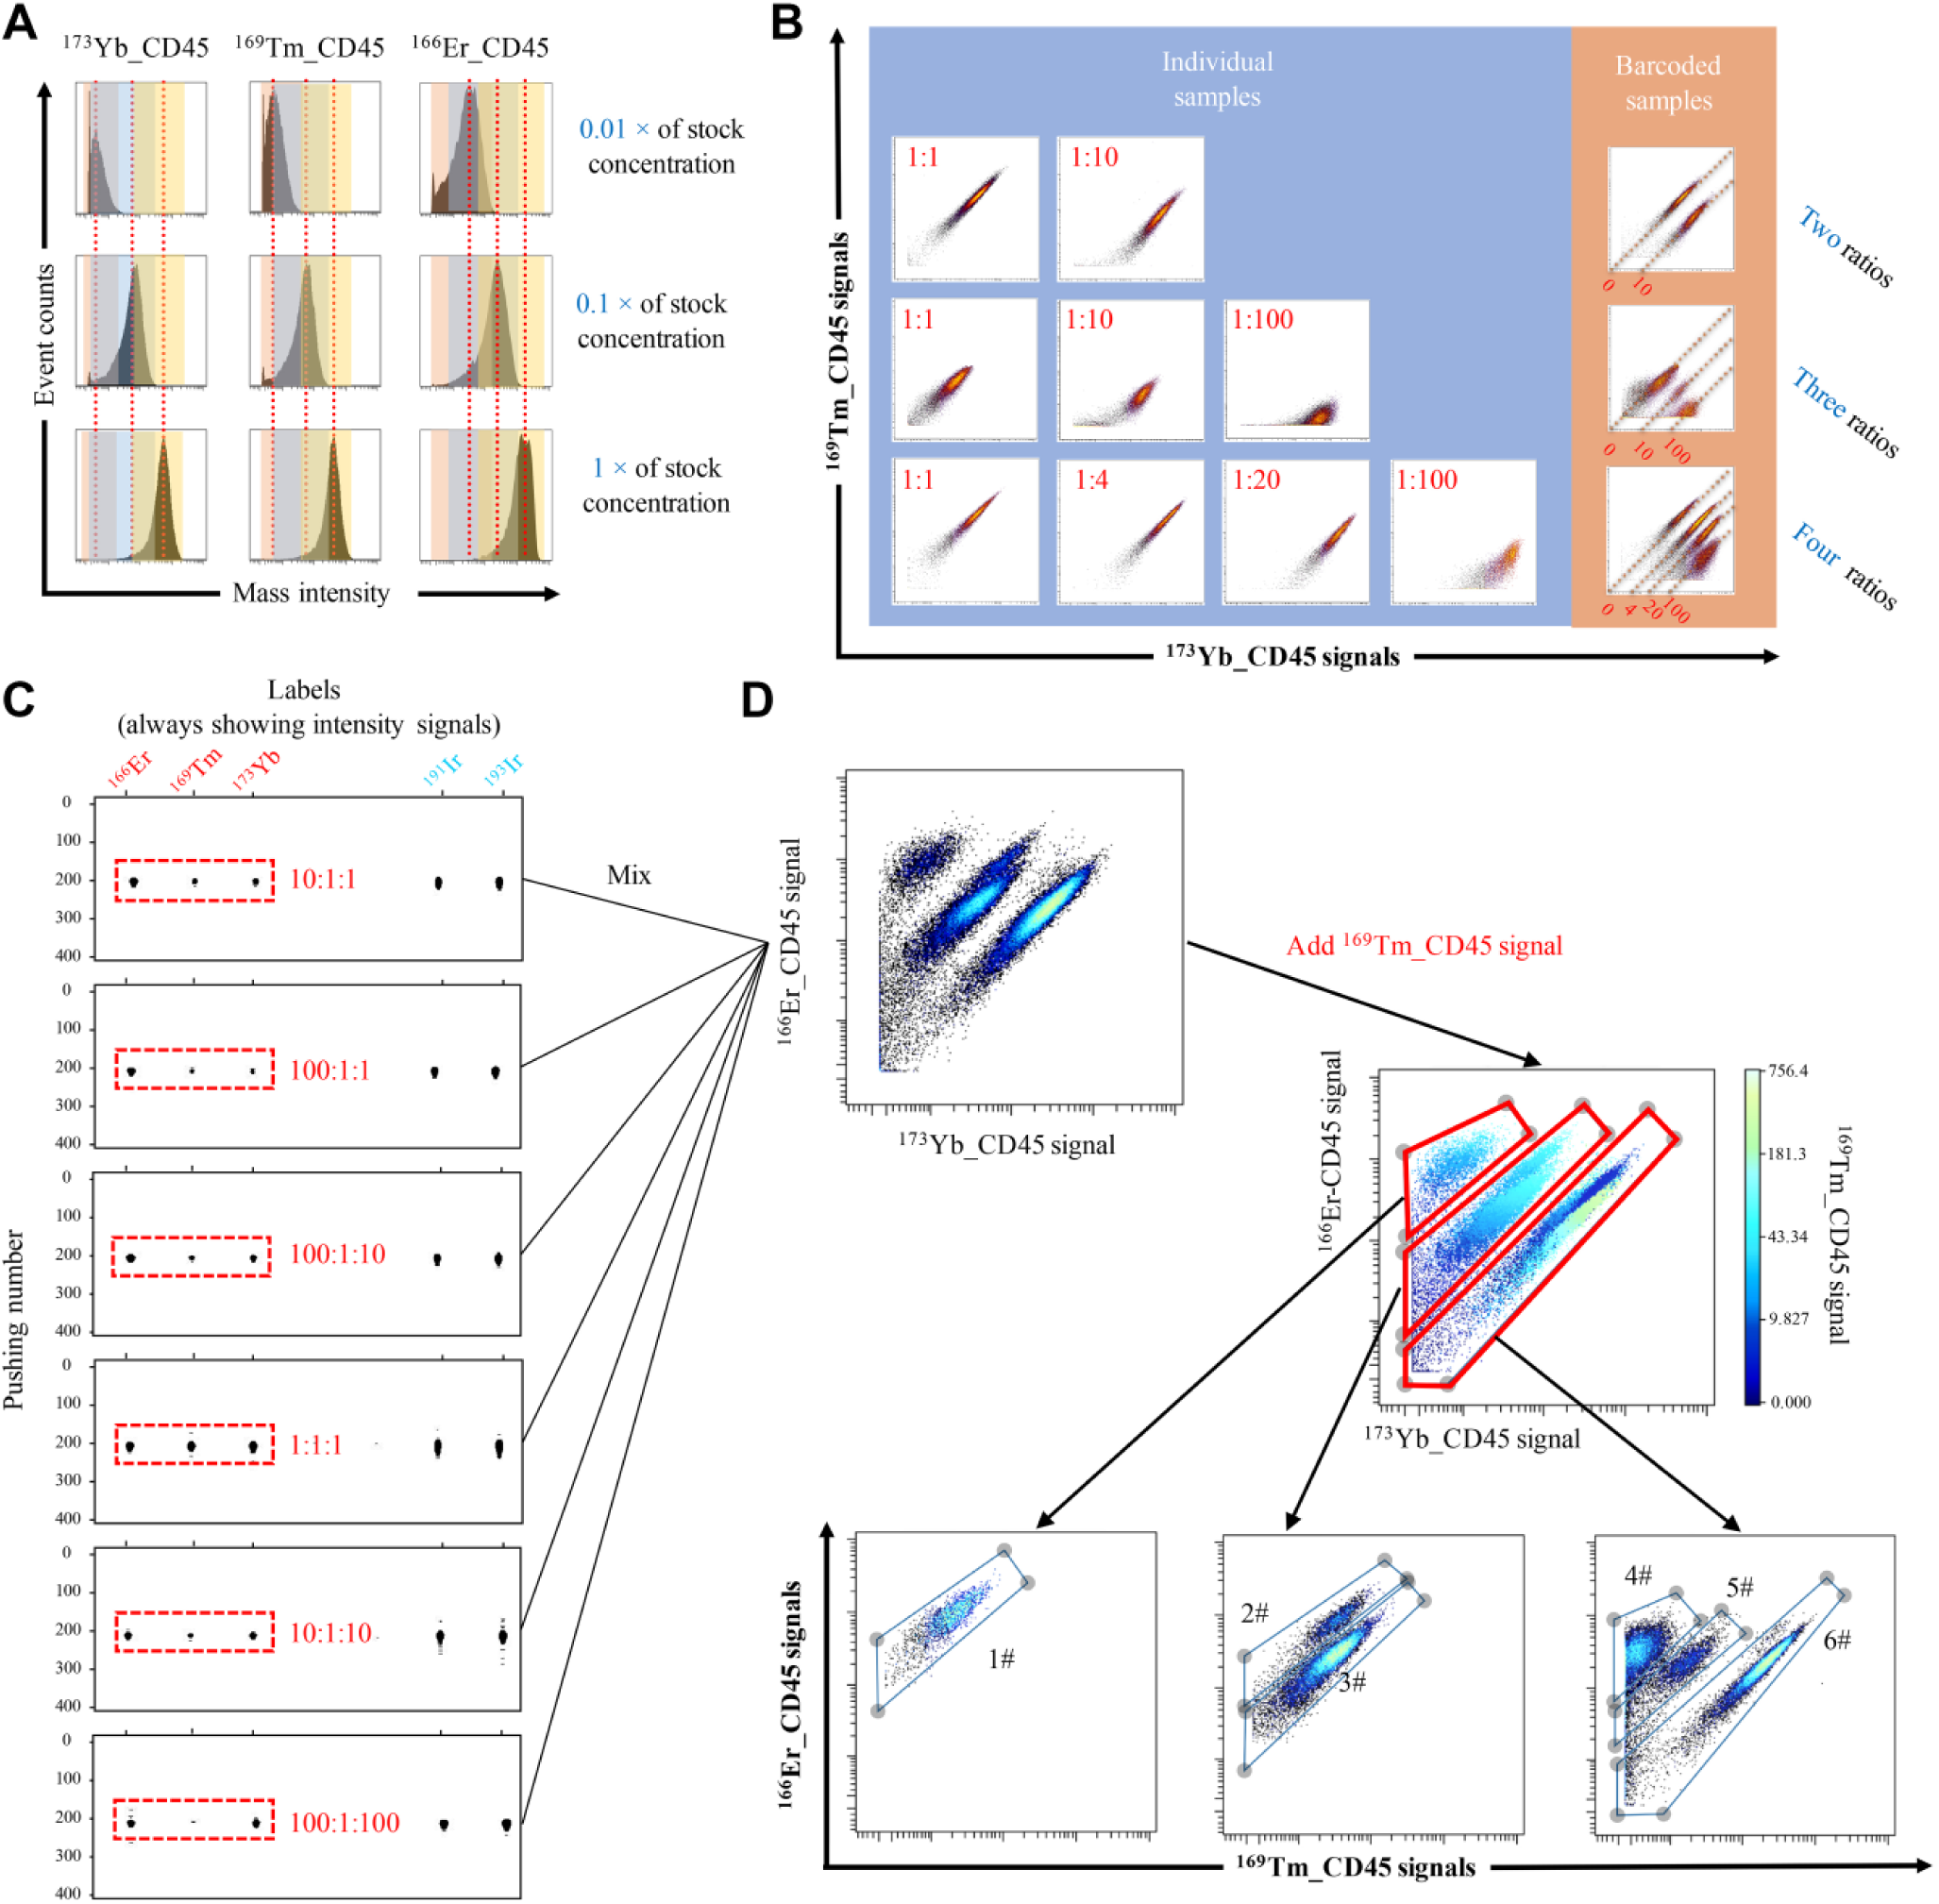
To verify the potential of mass-conjugated CD45 antibody for barcoding, we first applied different concentrations of one single mass tag to barcode multiple samples. We stained nine replicates of the same human sample with nine CD45 antibodies labeled by three indicated mass ions (166Er, 169Tm, and 173Yb) at three gradient concentrations (0.01×, 0.1×, and 1× of stock concentration).
Figure 2A
depicts the signals of various concentrations. The red lines show the median signal, which indicates that all nine samples were distinguished. However, the concentration strategy alone for barcoding was not accurate enough. We observed some overlapping signals among the samples in the same column according to the color lumps. In the barcoding detection, the barcoded composite that contains three individual samples labeled by 173Yb_CD45 antibodies of different concentrations is detected (
Barcoding Based on Ratiometry Signal for CyTOF
To resolve the signal overlay and fluctuation issues, ratiometry between mass tags for barcoding was introduced. As previous literature has indicated, the ratiometry method is an effective strategy to overcome the instability of detection intensity. 25 Furthermore, using mass-ratiometry barcoding, we expect to extend the two-state signal combination, which is based on a signal’s presence or absence, into multistate signals.
The barcoding results of multiple ratios between two signals are presented in Figure 2B . Each sample was equally divided into two parts: the individual part and barcoding part. Both parts were labeled with the same CD45 barcoding cocktail to perform a proof-of-principle test. The individual parts were separately detected while the barcoding parts were combined and detected as a composite. Considering that CyTOF data are usually processed logarithmically to facilitate analysis, we designed the ratio as a 10-fold gradient. Thus, 1:1 and 1:100 are chosen for two ratios; 1:1, 1:10, and 1:100 are chosen for three ratios; and 1:1, 1:4, 1:20, and 1:100 are chosen for four ratios. Altogether, the barcoding parts for two to four ratios produced the same distinct clusters as the individual parts ( Fig. 2B ). This result proves the feasibility to barcode multiplex samples with mass ratiometry.
We also examined whether the use of the same CD45 clone conjugated to different mass tags in multiplexed barcoding would result in an overall lower signal per channel as the antibodies labeled with different mass tags were competing for the same epitope on the receptor. Our results indicate that the signal differentiation remains visually clear despite employing the multiplex barcoding strategy ( Fig. 2B ). This is likely due to the large amount of CD45 receptors available for binding, thus mitigating the reduction in signal strength when multiple barcodes are applied.
Sample Barcoding and Debarcoding Processing by CD45 Mass-Ratiometry Barcoding
To further improve the efficiency of barcoding, we investigated the use of six different ratios (1:1:1, 10:1:1, 10:1:10, 100:1:1, 100:1:100, and 100:1:10) among three mass-conjugated CD45 antibodies (166Er, 169Tm, and 173Yb). The six PBMC patient samples were individually stained with one of the above six barcodes. We first examined the rain plots when these six samples were separately detected, as shown in Figure 2C . The barcoded cells clearly represented their unique barcodes with six fundamental ratios. Subsequently, we mixed all six samples together and obtained the barcoding results shown in Figure 2D . For debarcoding, three clusters were first identified based on 166Er/173Yb expression. Subsequently, the samples were further differentiated according to 169Tm channel CD45 expression. Six distinct samples were identified.
We investigated whether a higher level of multiplex barcoding could be applied to achieve a more efficient high-throughput sample collection. Nineteen samples were barcoded according to the spreadsheet in
Figure 1B
. With this approach, combinations of three mass tags at three ratios were enough to barcode all 19 samples, whereas six mass tags would be required in the conventional MCB barcoding strategy to barcode the same number of samples. As indicated in
Validation of High-Efficiency CD45 Mass-Ratiometry Barcoding Strategy Compared with MCB
To ensure that the barcoded samples were distinguished and accurately assigned to their original sample identity, we compared the accuracy of the CD45 mass-ratiometry barcoding strategy with the most prevalent barcoding method in mass cytometry, the MCB method. We applied a dual-barcode strategy that simultaneously labeled each of the 19 samples with both 19 mass-ratiometry barcodes, as described in the previous section, and 19 MCB barcodes. The detailed protocol is shown in
Figure 3A
. The event rain plots in
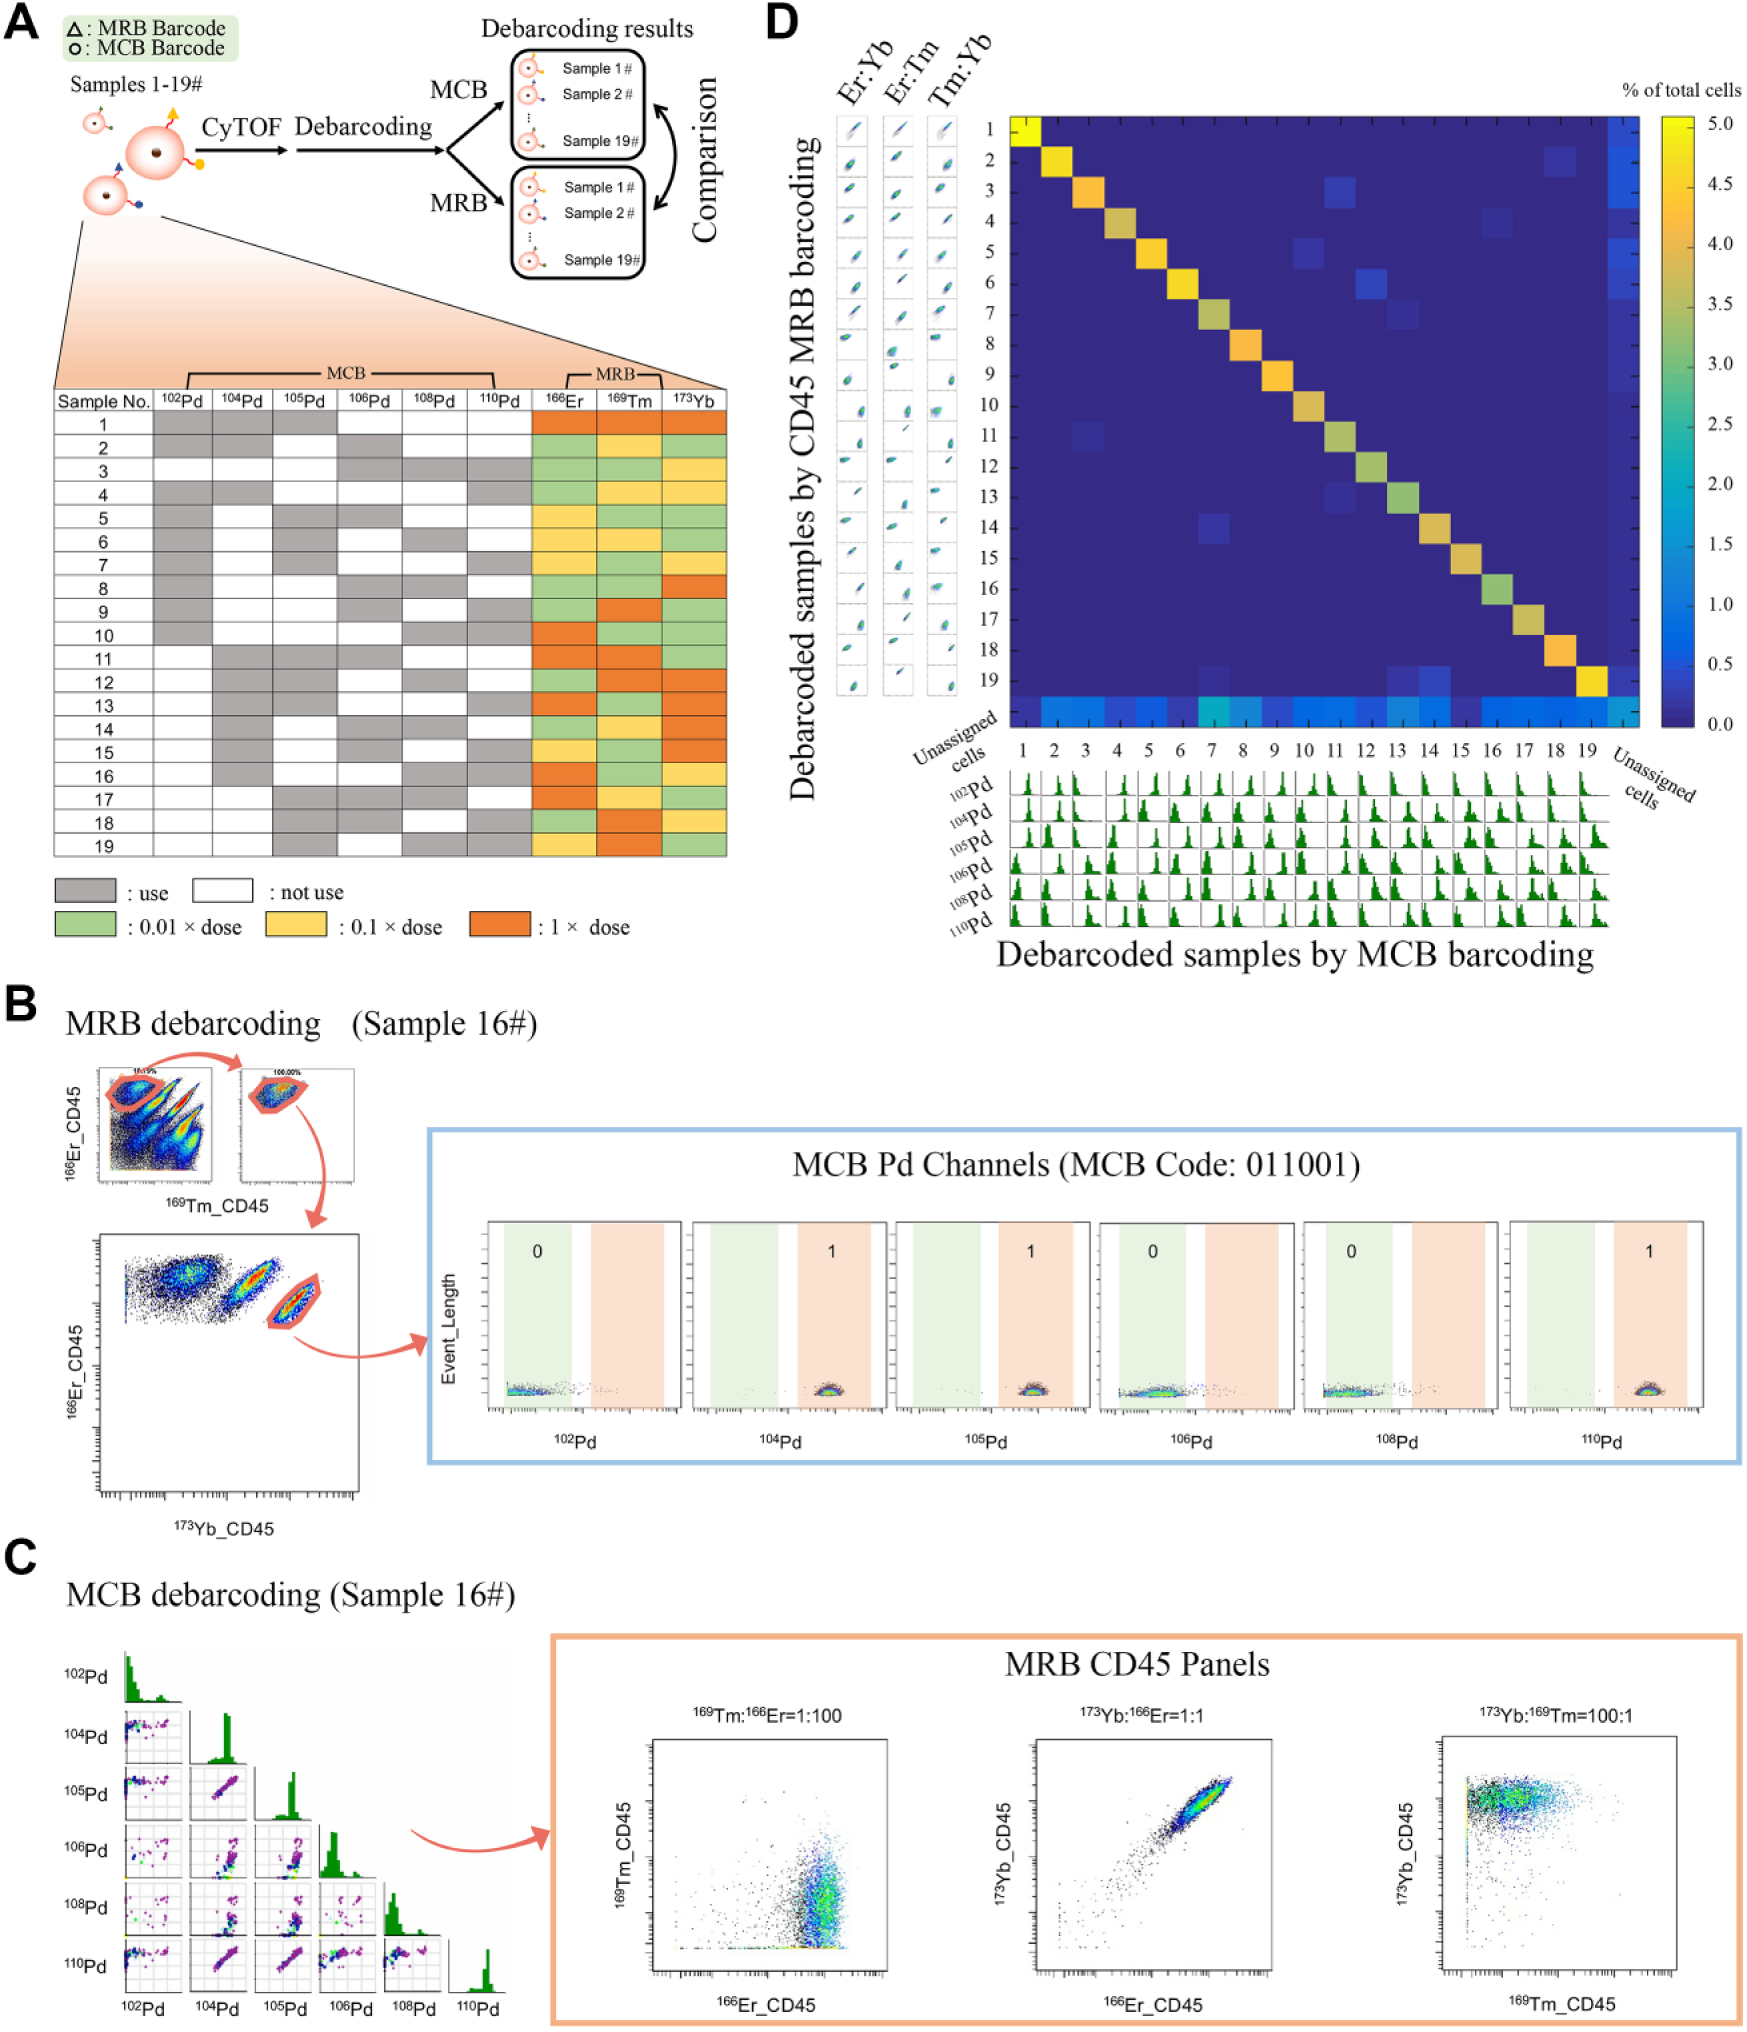
Comparison of the mass-ratiometry barcoding method and the conventional MCB method via dual-barcode labeling. (
Figure 3B
depicts the cells of sample 16 deconvoluted by the MCB strategy; it shows apparent mass-ratiometry characteristics whose CD45 antibody detections exhibited a ratio between 169Tm, 166Er, and 173Yb as 1:100:100. Meanwhile, the same sample (no. 16) gated by the CD45 mass-ratiometry strategy had identical MCB Pd channel expression characteristics (
Fig. 3C
). All 19 sample gating results of both methods are presented in
The pairwise similarity rates across 19 samples of debarcoding results between two barcoding methods are presented in
Figure 3D
. In the heat map, the horizontal axis and vertical axis represent the 19 debarcoding samples by MCB or CD45 mass-ratiometry barcoding. Every block in the heat map calculates the cell count assigned and its proportion within the entire sample. The 20th row and column stand for the unassigned cells in the two processing methods, respectively. The accurate numbers of cells in each block are shown in
Maintainability of Surface Marker Intensities Using CD45 Mass-Ratiometry Barcoding Strategy
The prospect of mass cytometry relies on its capacity to acquire routine collection of multiparameter data, which are comparable among multiple samples. The assumption that antibody staining processes are in the same level among samples is essential to draw meaningful biological conclusions. To determine whether the barcoding approach would be able to yield highly consistent staining and biological conclusions, we divided each of the 19 samples into two equal portions to investigate the influence of the barcoding process on target antigen detection. One portion was individually stained with antibodies, namely, CD3, CD4, CD8, CD14, CD16, CD20, and CD56, while the other portion was first stained with the CD45 mass-ratiometry barcoding kit and then stained with the same antibodies. After initial data deconvolution (composite samples) or the gating procedure for CD45+ cells (nonbarcoded samples), the expressions of the above seven surface markers were compared in major cell subsets including monocytes, T cells, and B cells to determine if the presented barcoding strategy affects sample surface marker intensities.
Our results indicate that the barcoding method could visibly eliminate sample-to-sample variations resulting from staining ( Fig. 4A ). Following deconvolution, the CD3, CD4, and CD8 signal intensity and distribution were compared between individual processed samples and barcoded samples. The batch effect (sample-to-sample antibody staining variation) between barcoded samples was lower than that between individually tested samples, as shown in Figure 4B . Six examples (CD3 signal of CD3+ subset and CD3– subset, CD8 signal of CD3+CD4+ subset and CD3+CD8+ subset, and CD4 signal of CD3+CD4+ subset and CD3+CD8+ subset) extracted from all analyses demonstrate the significant decreases of coefficient of variation (CV; CV = standard deviation/mean of population). The CV of median signal intensity data in the barcoded samples were dramatically decreased compared with the individual samples.
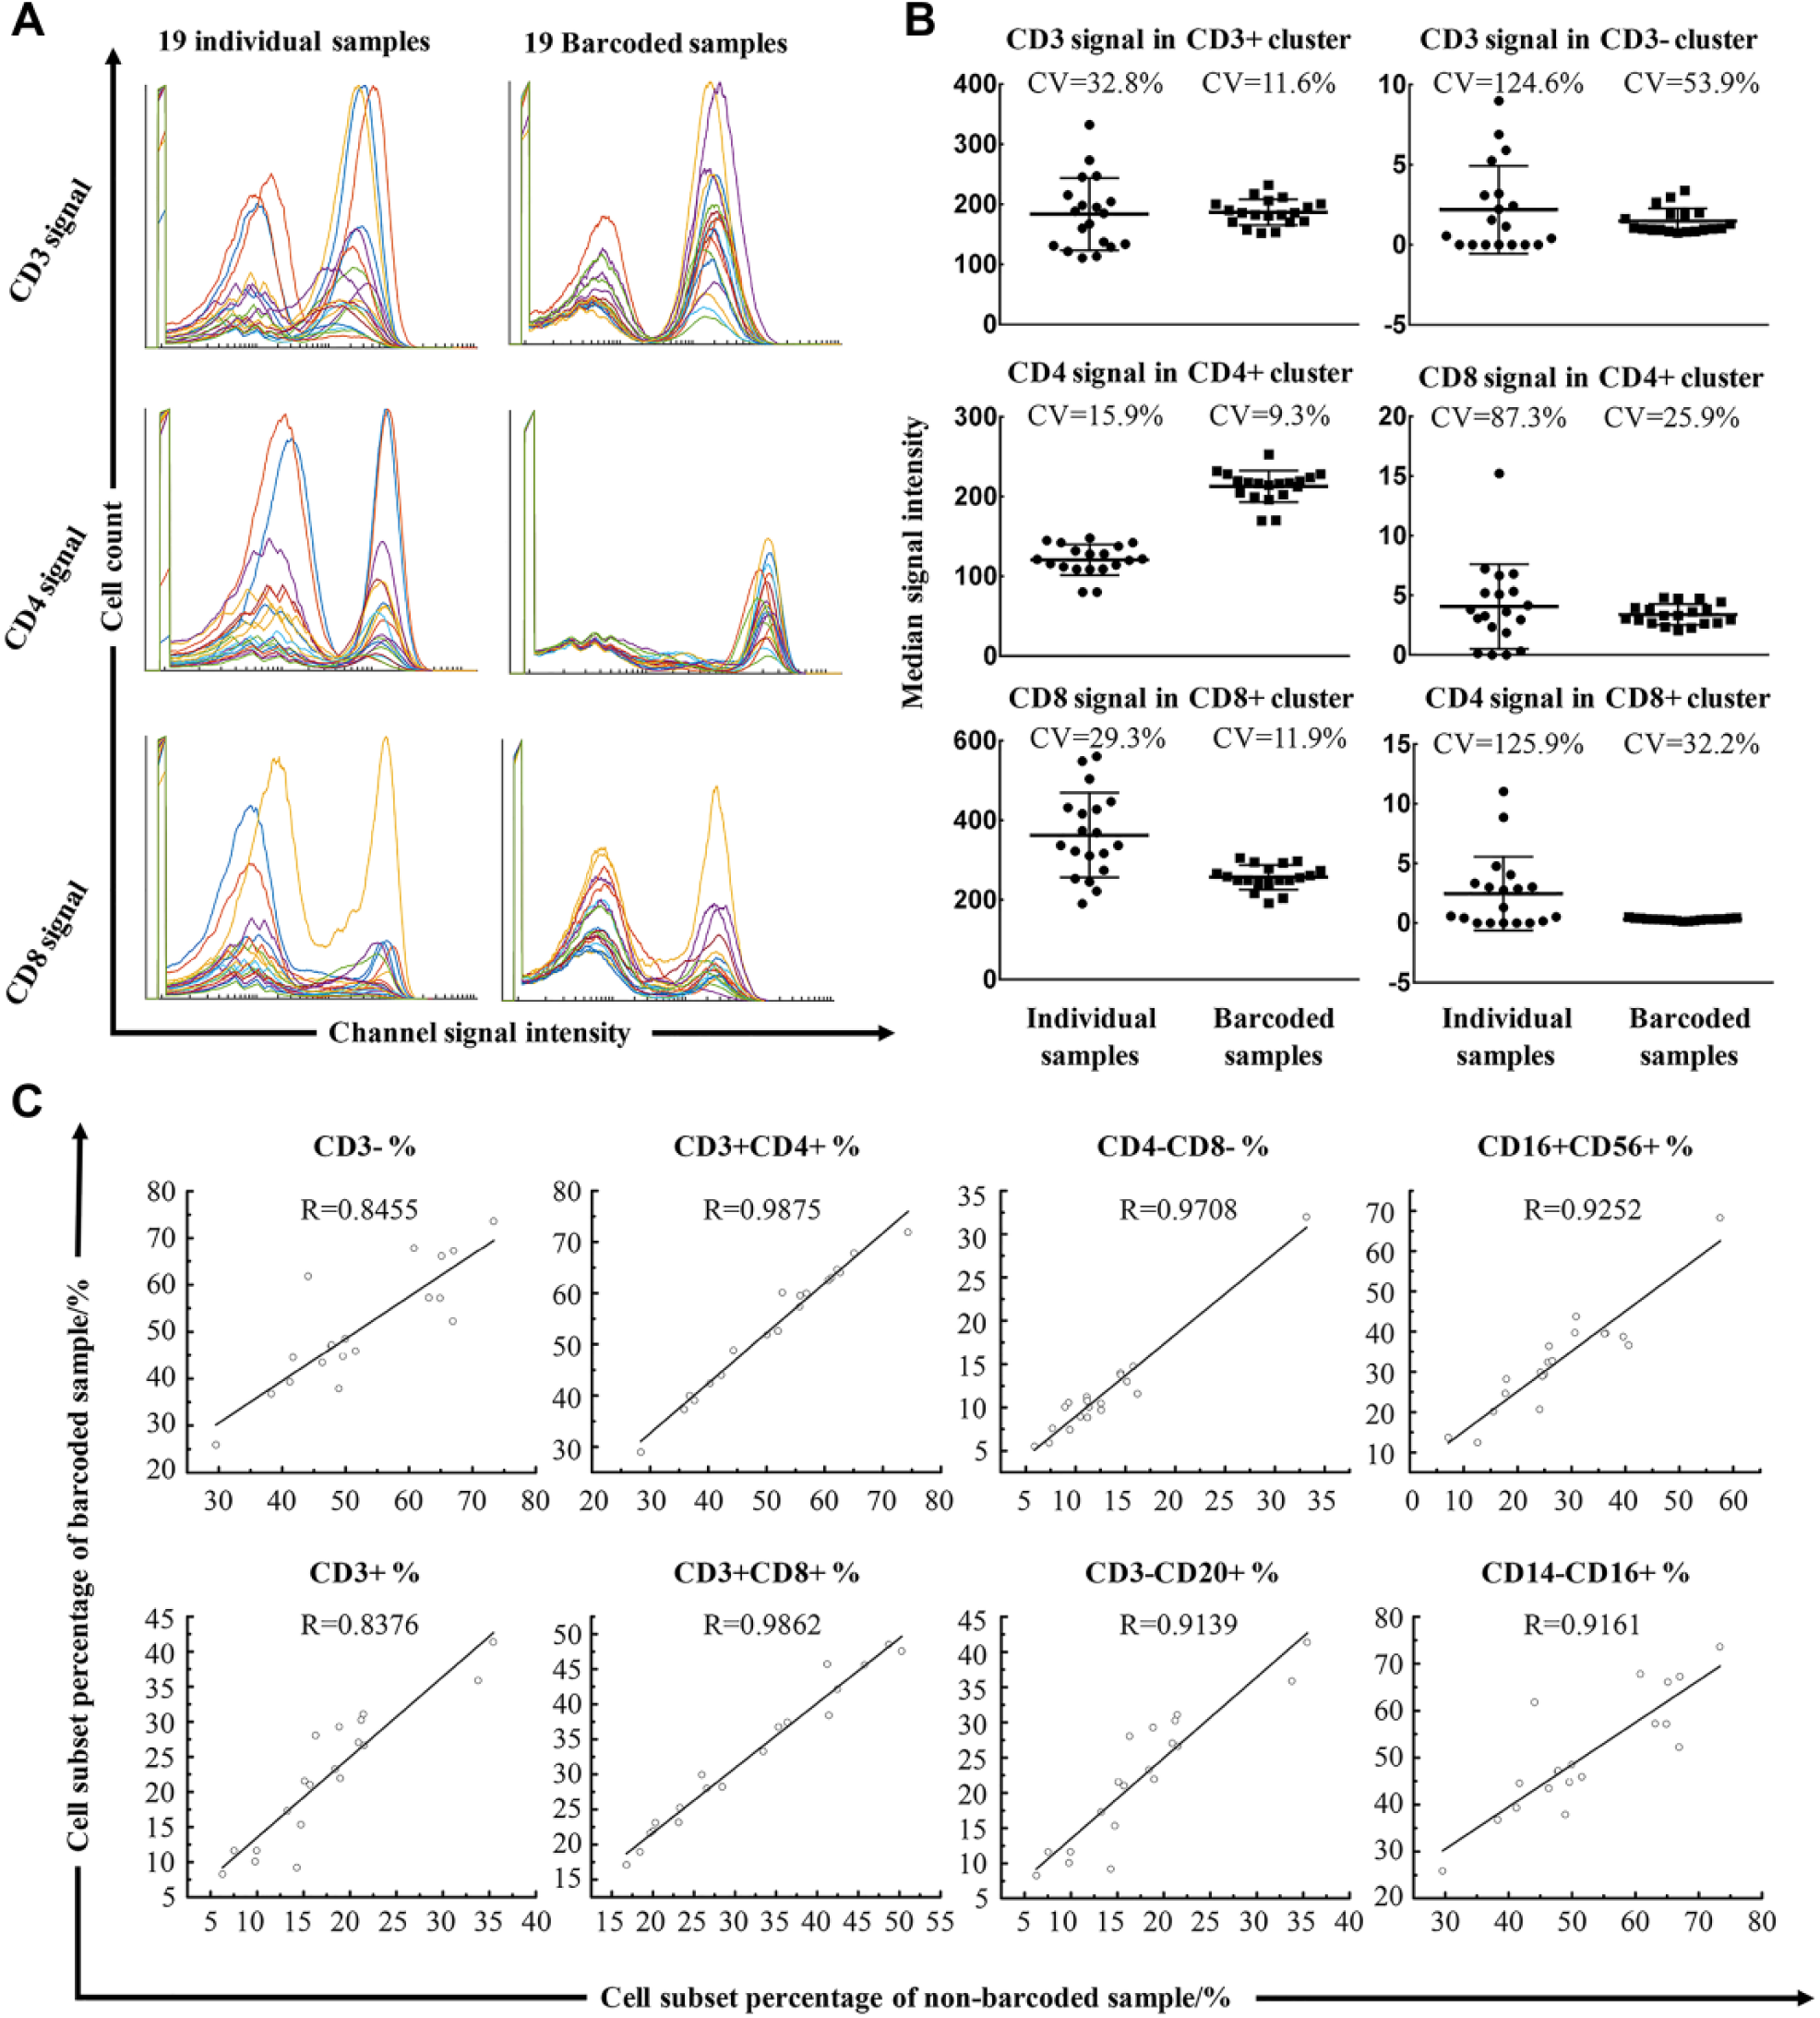
Comparison between barcoded and individually processed samples. (
The barcoding method facilitates the reduction of staining and background differences. The CVs of the CD3 median intensity signal of the CD3+ and CD3– subsets are 11.55% and 53.88% in barcoded samples, while in nonbarcoded samples they are 32.75% and 124.64%. Meanwhile, the CV of the CD4 median intensity signal of the CD3+CD4+ subset is 9.3% in barcoded samples and 15.9% in nonbarcoded samples. In addition, the CV of the CD8 median intensity signal of the CD3+CD8+ subset is 11.9% in barcoded samples and 29.3% in nonbarcoded samples. To compare the background staining differences, we calculated the CV of the CD8 median signal of the CD3+CD4+ subset (25.94% for barcoded samples and 87.3% for nonbarcoded samples) and the CD4 median signal of the CD3+CD8+ subset (32.22% for barcoded samples and 125.94% for nonbarcoded samples).
The results of barcoded samples largely matched those of nonbarcoded samples. Figure 4C depicts correlation analyses for the frequency of CD3–, CD3+, CD3+CD4+, CD3+CD8+, CD3+CD4–CD8–, CD3–CD20+, CD3–CD20–, CD14+CD16–, CD14–CD16+, and CD16+CD56+ subpopulations among all cells between barcoded and individually measured sample data. Correlations of frequency and signal intensity data between barcoded and nonbarcoded samples were consistent for these subpopulations, demonstrating that the sample properties were attained using the mass-ratiometry barcoding method. The R values that resulted from Spearman correlation analyses were mostly above 0.9 ( Fig. 4C ).
Overall, these findings demonstrate that the observed disparities among samples mainly resulted from changes in target antigens rather than experimental variance or error. Concurrently, the CD45 mass-ratiometry barcoding method retains sample identity with high accuracy.
Discussion
CyTOF is becoming a fundamental tool for high-throughput, single-cell immune analysis in clinical trials, deep phenotyping, and cell population discovery.26,27 Nevertheless, its wide application is hampered by data variations of different samples and limited barcoding dimensions. 16 As the ratiometric method provides an effective approach to overcome the instability of single signals, 25 this study provides a new barcoding strategy based on a CD45 mass-ratiometry scheme in CyTOF analysis. This method can greatly increase the throughput of barcoding and conserve cytometric channels for multiplexed analysis of PBMC samples.28,29 Ratiometry-based barcoding greatly increases barcoding efficiency, producing a very narrow size distribution of every barcoded sample. Thus, it offers a new solution to mitigate sample processing variations and preserve as many channels as possible for target signaling molecule detection in a large-cohort analysis. Furthermore, the data analysis retains accuracy and comparability. Above all, CD45 barcoding does not require permeabilization, preserving surface biomarker information. Additionally, the concept of using CD45 ratiometry-based barcoding is not limited to CyTOF; it can also be applied to other research fields, such as fluorescence-based flow cytometry.
Commercial barcoding methods, such as the MCB method, 21 label the barcodes after cell permeabilization with Fix and Perm Buffer (PBS with 1.6% paraformaldehyde; Fluidigm Sciences), which arouses partial loss of the signal intensity of cell surface markers. 20 However, CD45 mass-ratiometry barcoding is a pre-permeabilization method,16,18 allowing the cells to be combined before the intra- and extracellular marker staining procedure. Thus, surface immunophenotypic analysis based on surface marker expression will be minimally disrupted by the barcoding process. In addition, since no permeabilization process is required, the washing process can be decreased to three times. Hence, it facilitates the recovery of more cells. The labeling time can be accordingly decreased to 40 min.
CD45 barcoding requires the presence of CD45 receptors on cells for binding, which means it cannot be used in non-PBMCs. However, this ratiometric barcoding method can work well under multiplex conditions if the target cell lines have highly and steadily expressed receptors or even through barcoded nanoparticles. Although CD45 is one of the most abundant cellular biomarkers highly expressed in PBMC samples, limitations may arise when samples have CD45 deficiency or heterogeneity. It occurs mostly in cases with cell lines or nonleukocytes. Diseases such as a SCID phenotype 30 caused by genetic disorder may result in a severely low CD45 expression. Additionally, it is reported that CD45 deficiency is common in some plasma cells of the bone marrow, especially in multiple myeloma.31,32 In these cases, CD45 antibody is not recommended for barcoding. Other more suitable markers, which are stably and abundantly expressed and not expected to differ significantly between samples, such as high-affinity probes, can be considered.
It is a great challenge to achieve identical results between barcoded samples and individually processed samples, especially for a large-cohort study. However, the advantages of the presented barcoding method are highly beneficial as uniform antibody staining and indiscriminate CyTOF detection will contribute to acquire more credible conclusions. As Figure 2B shows, high resolution of CD45 is attained, demonstrating that ratiometry among mass channels can be applied for barcoding. 14 Notably, our data prove that at least four ratios (1:1, 1:4, 1:20, and 1:100) between two different mass-conjugated CD45 antibodies can be distinctly detected. As the ratio levels and number of mass tags expand, the potential barcoding capability can cover an exponential number of samples. This will allow for experiments that were previously deemed unfeasible owing to barcoding inefficiency.
Since CD45 is a ubiquitous cell surface marker in PBMC, barcoding based on CD45 could be easily achieved for large numbers of samples. Besides, the high and stable expression of CD45 can also eliminate the tedious titration procedures. Also, as mentioned in other research, the CD45 antibody can conjugate to most mass tags, not only 166Er, 169Tm, and 173Yb, making the panel design more flexible.16,18 Moreover, compared with conventional MCB and multitag CD45 barcoding methods, CD45 mass-ratiometry barcoding greatly decreased the number of washing steps, which can both shorten the staining time and reduce cell loss. Overall, the high efficiency and resolution of cell staining enable CD45 to be potentially used as a barcoding carrier, especially for rare samples (see
The number of barcoding samples based on CD45 mass ratiometry could be up to 36, theoretically utilizing six available mass tags conjugated with CD45 antibody, which is much higher than the 26 with previous methods, let alone 20 samples with commercial methods. This indicates that the number of mass tags utilized for barcoding is much less than any other barcoding strategy (see
In conclusion, when using the mass-ratiometry barcoding method in PBMC before staining and acquisition, biological sample properties were well retained and data variations were largely reduced across samples. Moreover, for large-scale studies including hundreds of patient samples, the presented method would enable the barcoding of multiplex samples while also maintaining uniform antibody staining to ensure data quality and reliability.
Supplemental Material
DS_TECH834057 – Supplemental material for A Mass-Ratiometry-Based CD45 Barcoding Method for Mass Cytometry Detection
Supplemental material, DS_TECH834057 for A Mass-Ratiometry-Based CD45 Barcoding Method for Mass Cytometry Detection by Hongu Meng, Antony Warden, Lulu Zhang, Ting Zhang, Yiyang Li, Ziyang Tan, Boqian Wang, Hongxia Li, Hui Jiang, Guangxia Shen, Yifan Hong and Xianting Ding in SLAS Technology
Footnotes
Supplemental material is available online with this article.
Declaration of Conflicting Interests
The authors declared no potential conflicts of interest with respect to the research, authorship, and/or publication of this article.
Funding
The authors received no financial support for the research, authorship, and/or publication of this article.
References
Supplementary Material
Please find the following supplemental material available below.
For Open Access articles published under a Creative Commons License, all supplemental material carries the same license as the article it is associated with.
For non-Open Access articles published, all supplemental material carries a non-exclusive license, and permission requests for re-use of supplemental material or any part of supplemental material shall be sent directly to the copyright owner as specified in the copyright notice associated with the article.