
Abstract
The determination of pathogen-specific antibody indices (AIs) of CSF and serum is an essential cornerstone in assessing neurological diseases and demands reliable high precision. Various companies provide ELISA kits for the detection of respective antibody concentrations and base AI calculation on a single CSF/serum pair of optical densities (ODs), combined with selection rules. The remainder of OD measurements is not used. There is no averaging of measurement errors and result stabilization. OD data from Siemens Enzygnost ELISA measurements of 2012–2016 proficiency survey samples for measles/rubella/varicella zoster/herpes simplex virus (MRZH) reaction (INSTAND e.V.) were reanalyzed. Several reference methods for calculating Q values from ODs using multiple-point evaluation are described. The methods are based on the α method and the four-parameter logistic (4PL) equation. Statistical analysis shows standard deviations of relative AI differences from AI target values to be significantly lower if derived from multiple-point evaluation instead of single-pair evaluation. Thus, the virus-averaged hit rate of a 10% target AI environment can be improved from 49% up to 69%. Waiving the usage of a standard curve in favor of parameter fitting significantly improves calculational precision for Siemens Enzygnost assays. Patient safety, diagnostic assay costs, and laboratory effectiveness might be improved for other test distributors as well.
Introduction
In CSF diagnostics, ELISA is a widely used technique to determine antibody (AB) concentrations in CSF and serum samples simultaneously. Optical densities (ODs) are measured for both the CSF and serum samples at different dilution levels. The various methods to extract AB concentrations of the undiluted samples from the measured OD values are documented in the test kit distributors’ manuals. The specific antibody index (AI) is calculated from these concentrations. 1
It has been known for decades that most reliable results for CSF/serum quotients (Q values) are obtained with a simultaneous analysis of virus-specific AB concentrations in CSF and serum.2,3 However, reports on improving the precision of Q-value determination by optimizing the evaluation of the measured ODs are rare. Reiber and Lange 2 describe the construction of a standard curve for the evaluation of their enzyme immunoassay tests and provide selection criteria for a CSF/serum concentration pair to be used for Q-value calculation. Their Q-value coefficients of variation for the measles/rubella/varicella zoster/herpes simplex virus (MRZH) reaction can be directly compared with our results given below.
In the method catalog of the German Society for CSF Diagnosis and Clinical Neurochemistry (DGLN), a recommendation is given to preferentially use CSF/serum concentration pairs measured with similar ODs. 4
Klauenberg et al. 5 use Bayesian statistics to estimate uncertainties of concentrations derived from ELISA measurements and the four-parameter logistic (4PL) equation 6 as a calibration model. The authors found results based on a range of measurements to be generally superior to those solely based on point estimates. This approach requires a priori information about the distributions of all model parameters involved.
Today’s fully automated infectious disease testing systems allow a rapid and reliable measurement of ODs with stable intra- and interassay variabilities. INSTAND e.V. (Düsseldorf, Germany) regularly provides a proficiency service for external quality assurance. Only minimal errors of OD measurements, especially for low target AI values, are tolerable.
In test evaluations using only a single CSF/serum pair of OD values for AI calculation, the bulk of the measured OD values are not used. The information contained in these measurements is lost. To exploit all available resources, we propose algorithms, which use as many as possible of the measured OD values. A reference equation is fitted to appropriately corrected OD data. This procedure is similar to setting up a calibration curve.6,7 However, there are crucial differences: First, OD values from patient samples are analyzed instead of standardized samples. Second, not only method parameters are fitted to the data, but also concentration parameters (or their ratio). Both parameter types determine the theoretical distribution of OD values, and it should be possible to simultaneously extract their values from measured data. Recommendations for data weighting with fitting are followed. 6
This study aims to establish novel algorithms for multiple-point evaluation to (1) achieve variation averaging with OD measurements, (2) avoid random selection of the used CSF/serum pair of OD values caused by an instable selection rule, and (3) eliminate inconsistencies between measured data and method parameters noted on test kit certificates.
In a comprehensive study, OD values gained from 56 pairs of INSTAND e.V. MRZH reaction proficiency survey samples of the October 2012 to April 2016 campaigns were reassessed with algorithms based on modifications of two methods: the α method 8 and the 4PL method.6,7
In a first step, the shortcomings of the single-pair evaluation were identified. The second step went into the development of methods for multiple-point evaluation. Attention was paid to inconsistencies between the measured data and the given method parameters.
Materials and Methods
Throughout this paper, the notation OD is to be understood as a blank value corrected and adjusted OD value. Subscripts i and j refer to a CSF and serum value, respectively.
Data labels in the figures use L and S to indicate a CSF or serum value, respectively, to save space.
Ethical approval: The conducted research is not related to either human or animal use.
Materials
The 56 proficiency survey sample pairs (INSTAND e.V.) comprised AB assays for MRZH for both CSF and serum. They were pipetted into Enzygnost microtiter assays with a TECAN Freedom EVO pipetting device (Tecan Group Ltd., Männedorf, Switzerland) and analyzed with a BEP III System (Siemens Healthcare Diagnostics GmbH, Eschborn, Germany) according to the manufacturer’s instructions. The number of sample dilution steps varied between two and six.
Using the α Method
The α-method basic equation is 8

or in OD-explicit form:

with T0 and n being the undiluted AB titer and dilution factor, respectively, and α and β being the method parameters for both CSF and serum.
Using the definition of the specific Q value,
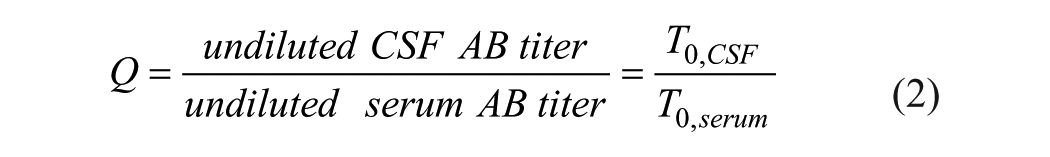
and eq 1a, the Q value determined from values ODi and ODj is given by

where ni and nj are the dilution factors used in the ith CSF and the jth serum OD measurement, respectively, and ODi = OD(Ti), ODj = OD(Tj).
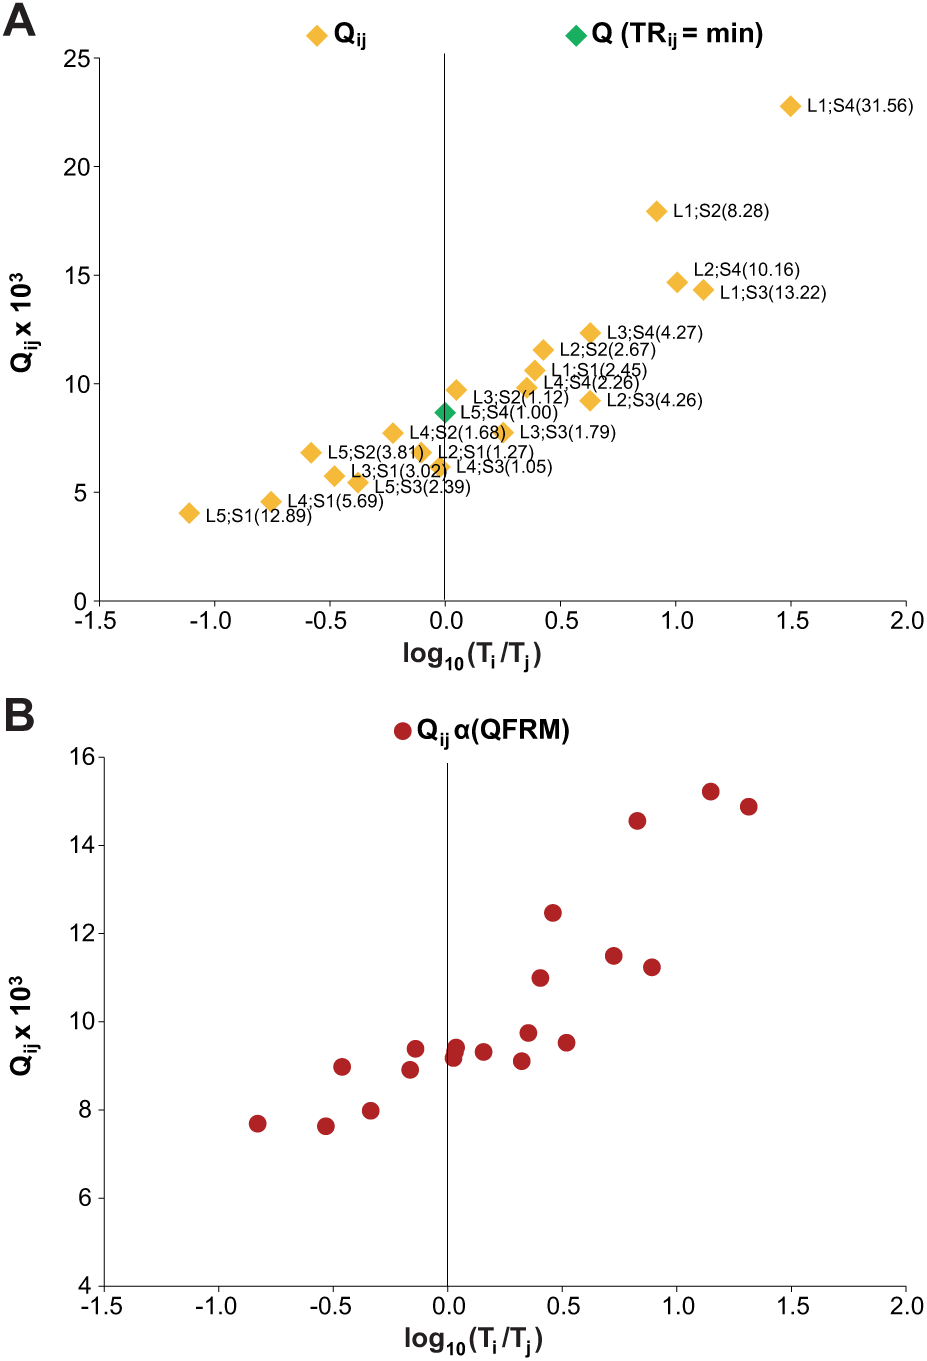
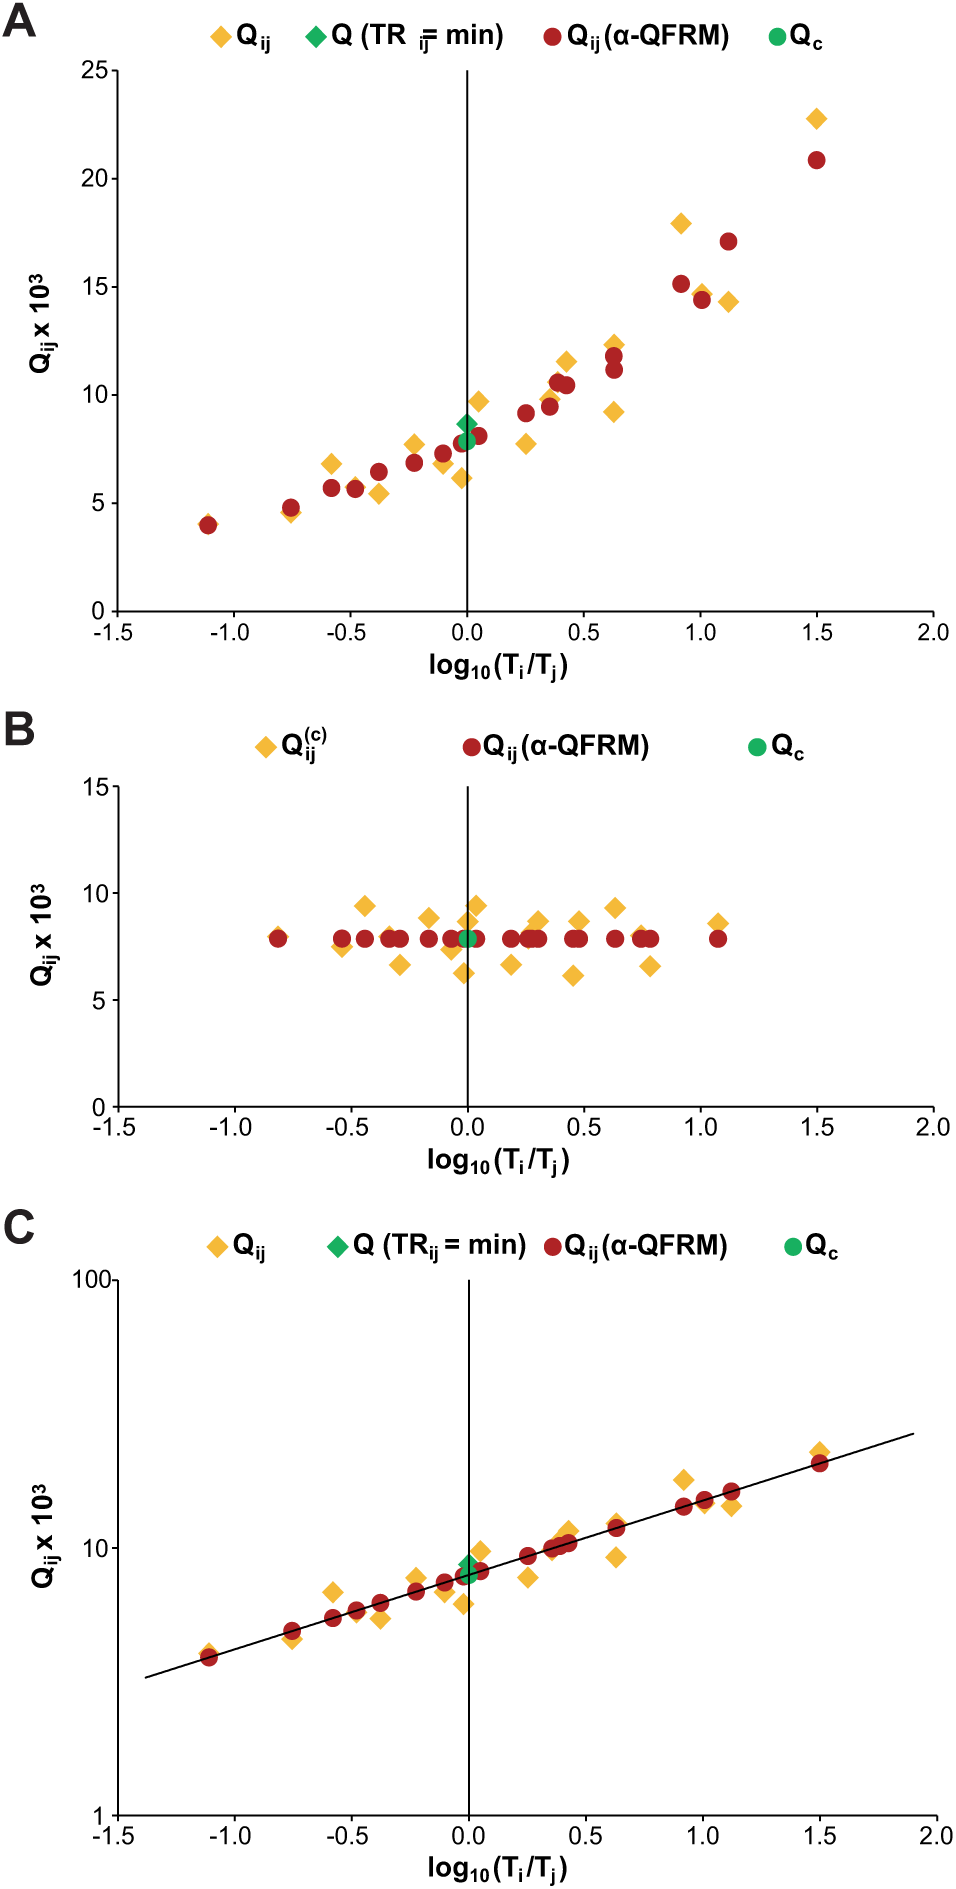
A typical plot of Qi, j values’ distribution (Q matrix) is shown in Figure 1A .
(
Q-Matrix Single-Pair Evaluation (α-QSPE)
From the CSF and serum OD values, a “best-suited CSF/serum pair” is selected for evaluation by applying selection criteria (see Q-Matrix Single-Pair Evaluation section below).
Q-Matrix Multiple-Point Evaluation
With multiple-point evaluation, a reference method containing the values of interest as free parameters is fitted to the measured data. It can be derived by analysis of the shape of the Qi,j distribution of Figure 1A .
Q-Matrix Full Reference Method (α-QFRM)
The Q value for a specific AB is a unique property of a CSF/serum sample pair, and Qi,j values should exhibit a horizontal distribution. This is obviously not the case.
Furthermore, Qi,j data points are widely scattered. This is not only due to OD measurement errors. Figure 1B shows the Qi,j distribution derived from a set of OD values, calculated from eq 1b with arbitrary (consistent) parameters αc = 4.0 and βc = 0.2, but with Qi,j evaluated with eq 2 using α = 2.5 and β = 0.5 as (inconsistent) parameters.
The Qi,j distribution of Figure 1B is qualitatively similar to the one of Figure 1A . It is nonhorizontal and shows considerable scattering, although the underlying OD values are error-free and consistently calculated. This type of Qi,j distribution can serve as a reference method with the method equation
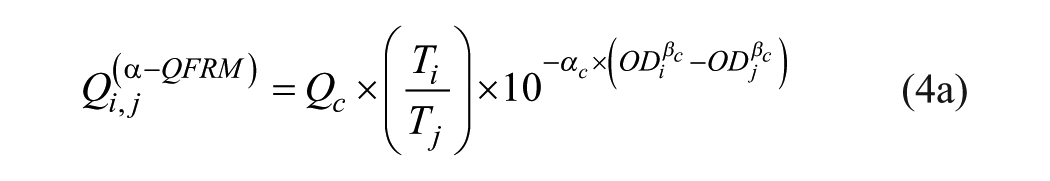
or
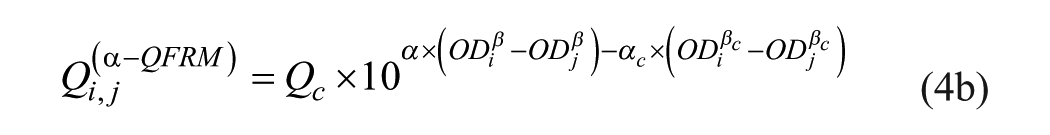
with αc and βc as corrected method parameters and Qc being the Q value of eq 2.
The three parameters αc, βc, and Qc are obtained by fitting eq 4a to a real Qi,j distribution derived from measured OD values. The objective function (OF) to be minimized is given by

Qc is used to calculate the AI.
As an example, fitting eq 4a to the Qi,j distribution of Figure 1A yields Figure 2A . For OF minimization by simultaneous variation of the three unknowns αc, βc, and Qc, Microsoft Excel Add-In SOLVER (Microsoft Corp., Redmond, WA; Frontline Systems Inc., Incline Village, NV) is used.
Evaluations with Q-matrix methods. (
If Qi,j values were calculated from eq 3 using αc and βc instead of α and β, the expected horizontal distribution Qi,j(c) would be obtained ( Fig. 2B ). Corresponding Qi,j(α-QFRM) values lie on the horizontal trend line f(Ti/Tj) = Qc, being the geometric mean of the Qi,j(c):

NQ is the number of Qi,j(c) values.
Q-Matrix Simple Reference Method (α-QSRM)
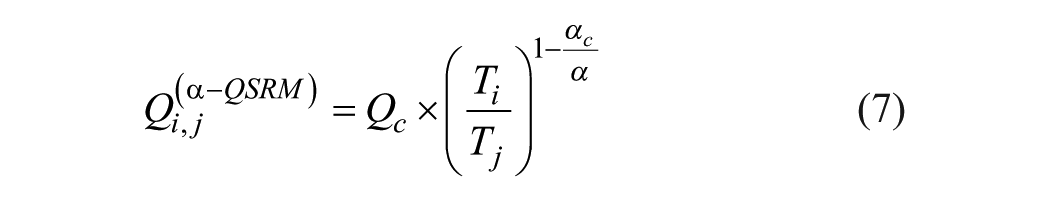
Setting parameters α ≠ αc and β = βc yields a special case of eq 4a that reduces to
The trend line of the Qi,j(α-QFRM) distribution is a straight line in a double-logarithmic diagram ( Fig. 2C ).
Evaluation Using Curve Fitting
Calculating undiluted titer values T0i and T0j from eq 1a for different dilutions ni and nj generates a set of different values. Table 1 lists the T0i and T0j values corresponding to matrix elements Qi,j of Figure 1A .
Different Prediluted Titer Values.
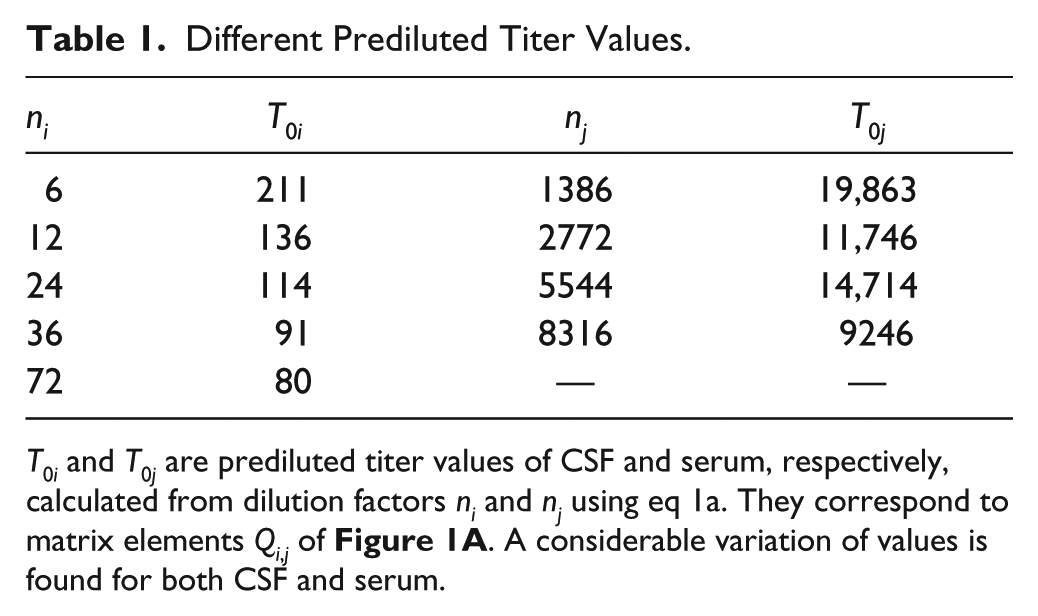
Unique values T0,CSF and T0,serum are obtained by using eq 1b in three different ways for both CSF and serum.
Multiple-Point Evaluation Methods ALPHA-SC, ALPHA+, and TiBER
The OF is given by
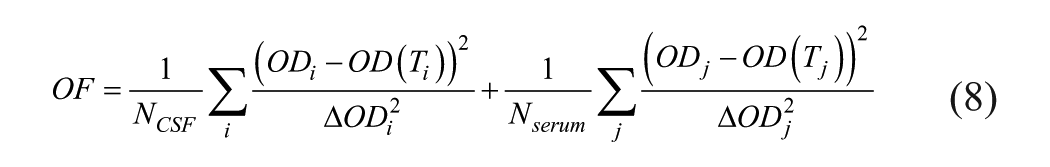
ΔODi2, ΔODj2 are the variances, and NCSF are Nserum the numbers of ODi and ODj values, respectively. In this work, a strict proportionality, ΔOD ~ OD, is used.
With ALPHA-SC (standard curve, α and β kept fixed), T0,CSF and T0,serum are the only parameters to be determined by fitting eq 1b to measured ODi and ODj values.
ALPHA+ (α variable) is analogous to α-QSRM method (see above). The fitting result with αc = 2.7936, βc = β = 0.2023, and Q = 8.11 is similar to the one shown in Figure 3 . Due to different OFs (eqs 5 and 8), there is a difference between this Q value and the α-QSRM method’s Qc = 7.9.
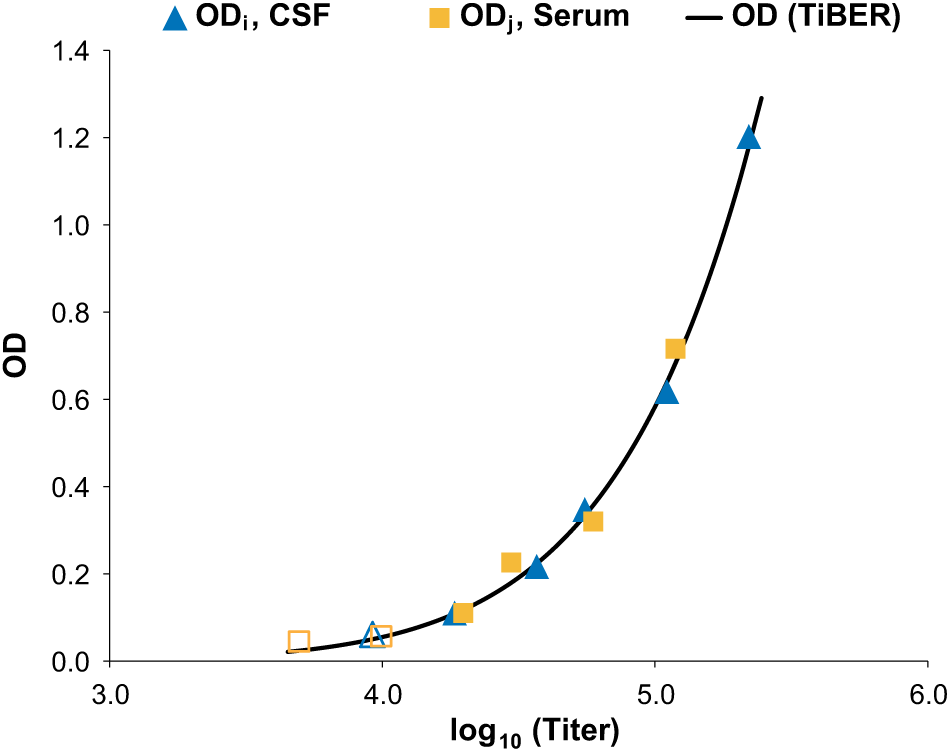
Curve fitting with TiBER. The α method’s OD-explicit form (eq 1b) was fitted against the OD values underlying the Q values of Figure 1A. New values αc and βc, as well as the unique undiluted pseudotiter values T0,CSF and T0,serum, are determined. From T0,CSF and T0,serum, the Q value is calculated. The parameter values are αc = 5.2617, βc = 0.0946, and Q = 8.05. The open symbols correspond to measurements that were canceled due to the validity criterion 0.1 ≤ OD ≤ 2.0.
TiBER (α and β variable) simultaneously yields αc, βc, and the ratio T0,CSF/T0,serum = Q (analogous to the α-QFRM method; see above). Figure 3 shows the result of fitting eq 1b to the OD values underlying Figure 1A .
Using the 4PL Equation
The relationship between OD and AB concentration c(n) is given by 6
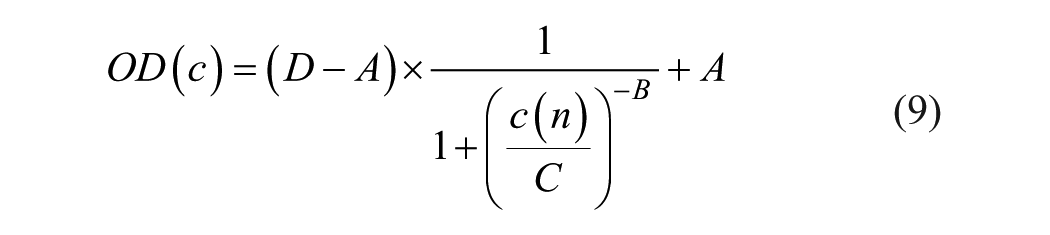
where c(n) = c0/n is the undiluted concentration c0 divided by dilution factor n. Values for A, B, C, and D are provided by the test kit vendor.
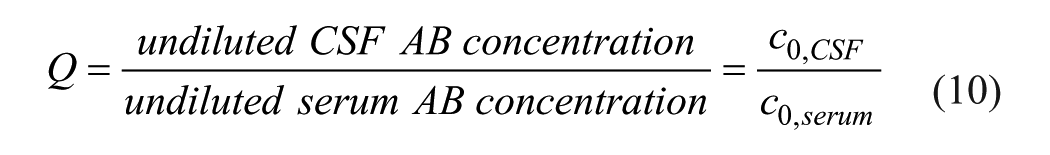
Based on concentrations instead of titers, the Q value is given by
From eqs 9 and 10, the element Qi,j can be calculated:
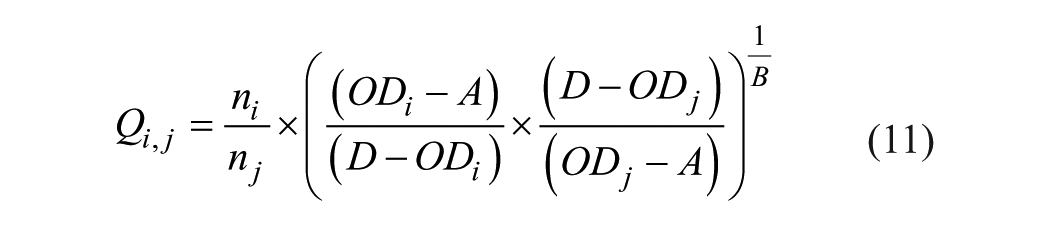
Only OD values with the product in brackets being positive or zero (i.e., A < ODi, ODj < D) can be used.
Q-Matrix Multiple-Point Evaluation
The following two methods are described for completeness only. They have not been used in the proficiency survey study.
Q-Matrix Full Reference Method (4PL-QFRM)
As with the α method, the Qi,j distribution calculated from eq 11 is not horizontal in general ( Fig. 4 ). In analogy to eq 4a (α-QFRM), a 4PL-QFRM with corrected parameters Ac, Bc, and Dc can be formulated:
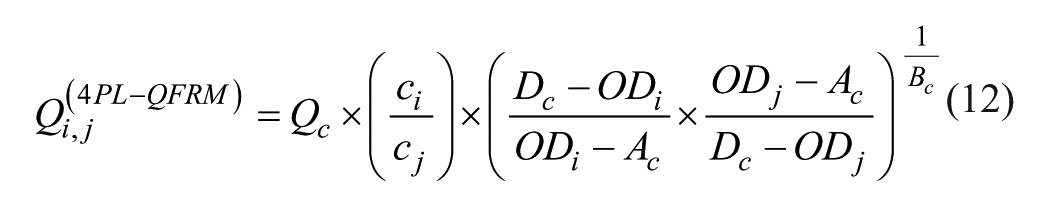
The OF used for fitting eq 12 to a Qi,j distribution is given by

Q-Matrix Simple Reference Method (4PL-QSRM)
For simplification, only parameter B is corrected to yield Bc, while A and D are left unchanged. Equation 12 then reduces to
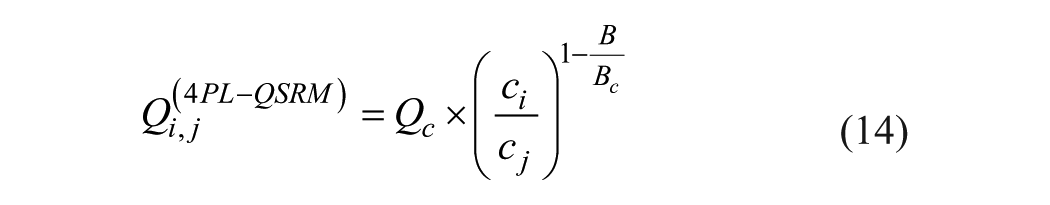
Qc depends on A and D and the given OD correction factor FOD.
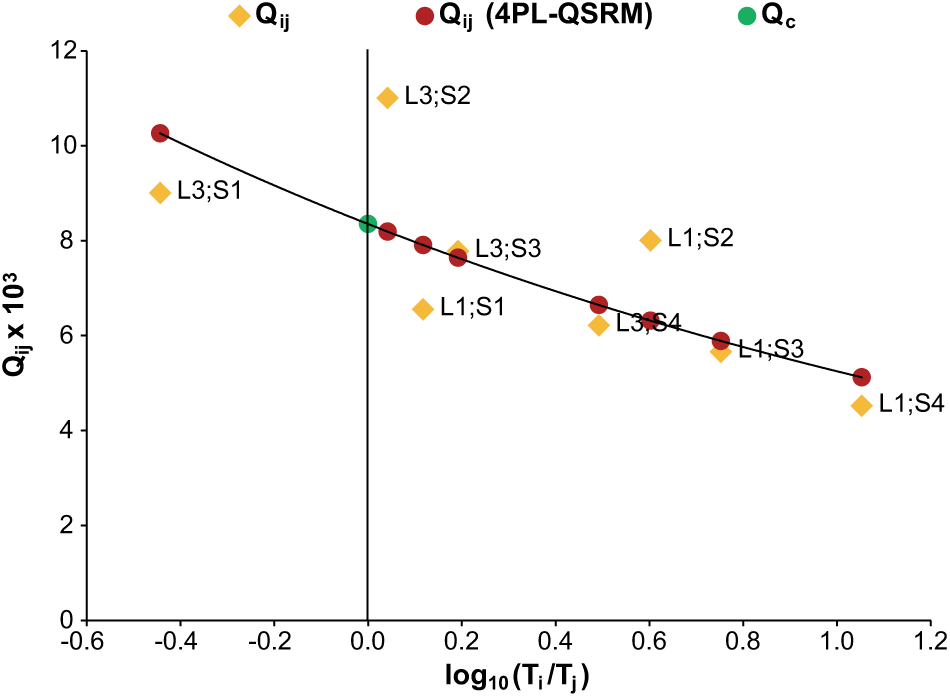
Fit of Q-matrix simple reference method (4PL-QSRM). The 4PL-QSRM was fitted against the real Qi,j data of a 4PL-based ELISA test system. The green circle indicates method parameter Qc resulting from the fitting process and used for AI calculation. The parameter values are B = 1.038, Bc = 0.8638, and Qc = 8.35.
Figure 4 shows the result of fitting eq 14 to a Qi,j distribution calculated with eq 11.
Evaluation Using Curve Fitting
To determine two unique values c0,CSF and c0,serum, eq 9 was used for both CSF and serum.
Multiple-Point Evaluation Method 4PL-2
The OF is given by
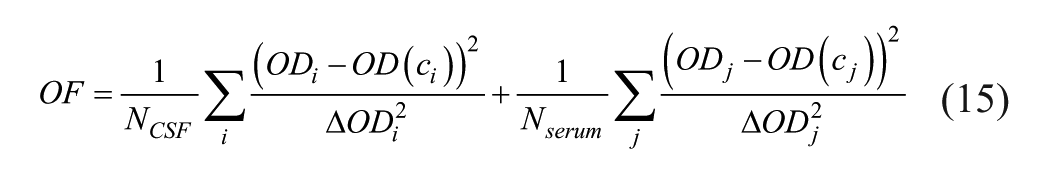
with ci = c0,CSF/ni and cj = c0,serum/nj, ΔODi2 and ΔODj2 being the variances of ODi and ODj, and NCSF and Nserum being the numbers of ODi and ODj values, respectively.
With method 4PL-2, it was attempted to completely replace vendor parameters A, B, C, and D with corrected ones, Ac, Bc, Cc, and Dc. This is analogous to the treatment of α and β with the TiBER method. Two parameters were set to fixed values: Usually A is much smaller than the usable OD values, and therefore Ac is set to 0. Cc can be set to 1 without loss of precision. Minimization of OF eq 15 simultaneously yields Bc and Dc and the ratio c0,CSF/c0,serum = Q.
Tests and Results
Systematic Error Correction
AI values can be falsified due to systematic errors generated by malfunction of the photometric device or any other laboratory equipment.
Before a ranking of methods could be set up, systematic errors had to be removed as far as possible. Therefore, virus-dependent correction factors for the AI values were determined for each method by minimizing the sum of the squared relative AI deviations from the associated AI target values. Thus, the capability of an individual method to reproduce an AI target value (accuracy) could not be used as a measure of method quality.
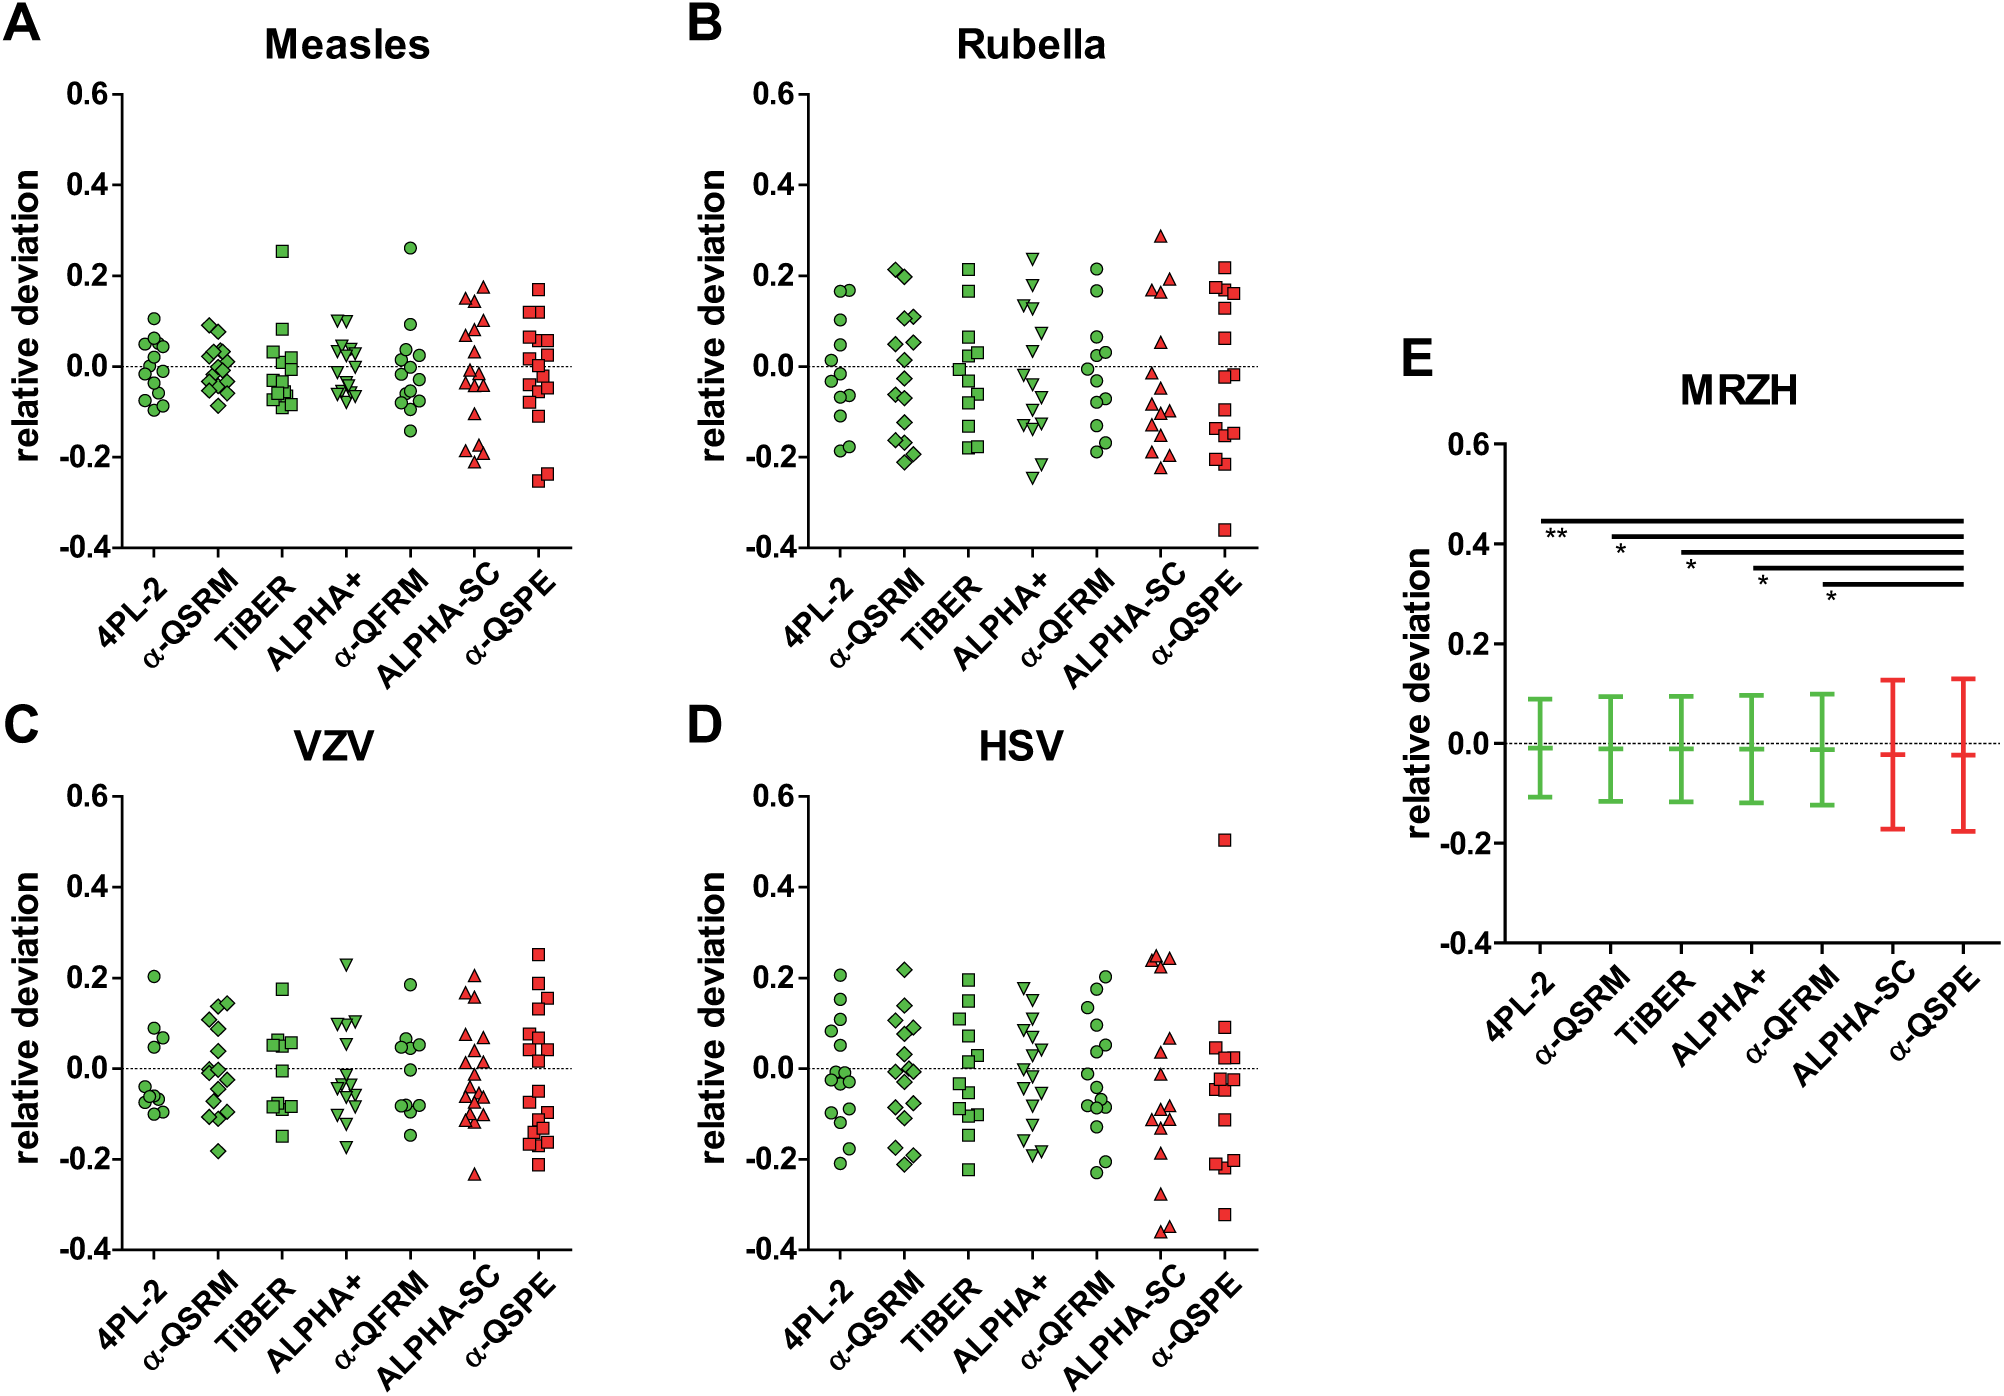
Distributions of Relative AI Deviation
The corrected AI values generated distributions of relative AI deviations (RDs) from AI target values specific for each evaluation method ( Fig. 5 ). Each RD distribution’s standard deviation (SD) estimate represented a precision feature of the method under consideration, which was used to establish a ranking ( Table 2 ).
Distributions of RDs from the AI target values. (
Significance of Test Results.
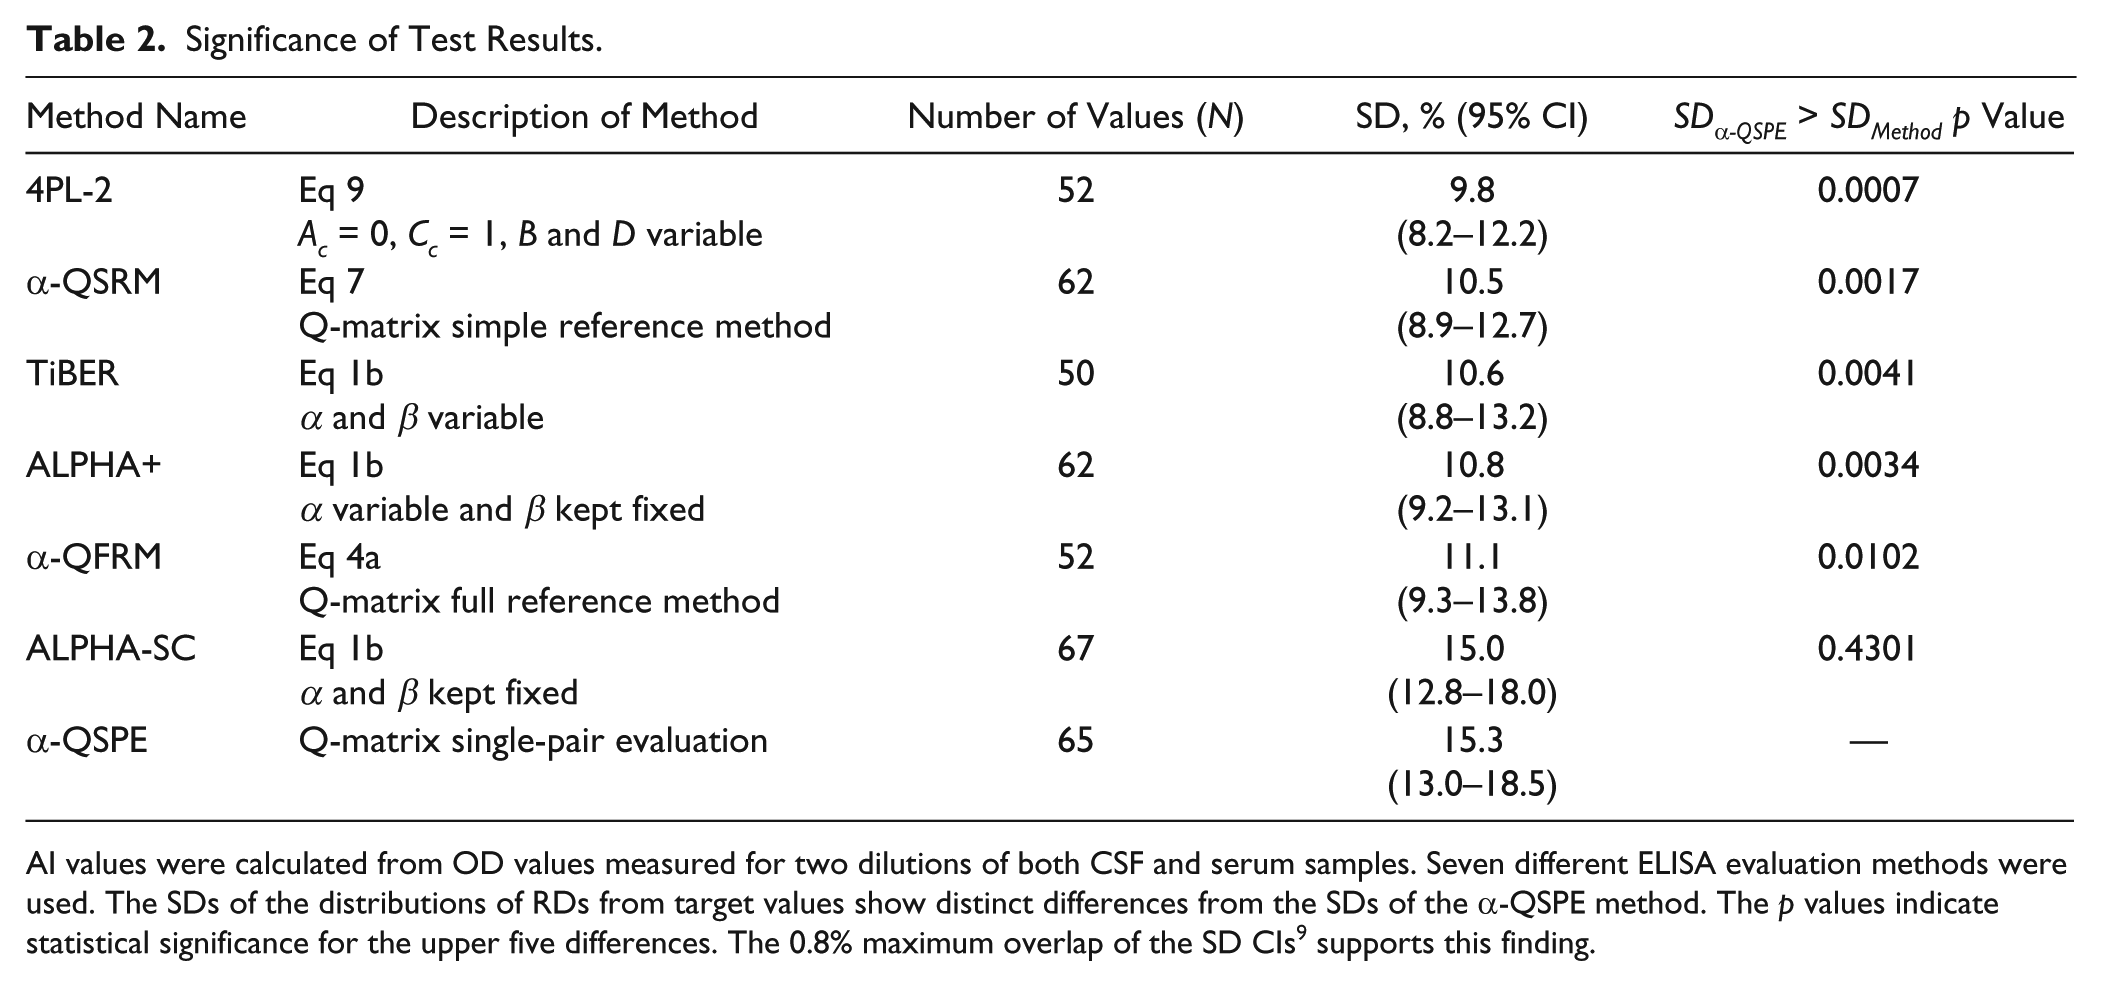
AI values were calculated from OD values measured for two dilutions of both CSF and serum samples. Seven different ELISA evaluation methods were used. The SDs of the distributions of RDs from target values show distinct differences from the SDs of the α-QSPE method. The p values indicate statistical significance for the upper five differences. The 0.8% maximum overlap of the SD CIs 9 supports this finding.
Since for the Enzygnost lots only parameters α and β were available, the ranking was possible only for methods based on the α method and the 4PL-2 method.
The analysis of AIs presented was based on values that were obtained from tests with two dilutions for both CSF and serum samples. They are regarded as a good compromise between reliable result and cost, and comprised the majority of the data available.
Significance Tests
With the seven evaluation methods tested, the RD distribution populations ranged from 52 to 67 values. Distributions were checked for normality (significance level 5%) with the Anderson–Darling test calculated with Microsoft Excel 2010 and the D’Agostino & Pearson omnibus K2 normality test calculated with Prism 5 for Windows (GraphPad Software, La Jolla, CA). With all RD distributions, normality was found.
AI value outliers of one single sample pair were excluded from analysis. No further outlier tests were performed.
For each method, the RD distributions of all virus parameters were combined. Thus, the SD estimates of the blended RD distributions are virus-averaged values ( Table 2 ).
For each combination of two methods in Table 2 , a right-tailed F test (significance level 5%) was performed (Microsoft Excel 2010 and Prism 5 for Windows) to find significant differences between the associated RD distribution variances. The SDs of two methods (ALPHA-SC and α-QSPE) were found to be significantly different from those of the other methods.
p values for SDα-QSPE being significantly greater than other SD values are also given in Table 2 . As a complement, the 95% confidence intervals (CI) of the SDs were determined 9 and are also shown in Table 2 .
Parameter Dependence
The RD distributions for each individual virus parameter are shown in Figure 5A – D . The SDs of blended distributions measured in the MRZH reaction are illustrated in Figure 5E . There are differences in the shapes of individual RD distributions, so the enhancement of precision is not the same for all kinds of parameters.
Discussion
Significance Tests
In Table 2 , there are two methods, 4PL-2 and α-QSRM, with SD CIs not overlapping with those of methods ALPHA-SC and α-QSPE. These findings and the small p values indicate that 4PL-2 and α-QSRM possess a higher precision than the last-mentioned methods. Thus, the virus-averaged probability of hitting a 10% target AI environment is increased from 49% to 69% when using the 4PL-2 method instead of the α-QSPE method. However, it must be stressed that this benefit can be obtained only in the absence of or after correction of systematic errors, caused by defective equipment.
Table 2 shows the advantage of methods using multiple-point evaluation with corrected method parameters (4PL-2 to α-QFRM) over those that do not (ALPHA-SC and α-QSPE).
Q-Matrix Single-Pair Evaluation
In Figure 1A , data points are scattered forming a cloud-shaped distribution. Spread and orientation of the cloud depend on the values of α and β.
The selection criteria for the “best-suited ODi, ODj pair” to be used, formulated by the test kit vendor, refer to the ratio TRi,j = max(Ti, Tj)/min(Ti, Tj): 10
TRi,j should be as close to 1.0 as possible.
TRi,j must not be greater than 3.0.
Data point (L5, S4) with Qi,j = 8.66 perfectly matches the selection criteria with TRi,j = 1.0. From this Qi,j value, the AI is calculated. However, in most Qi,j distributions, there is no TRi,j equal to 1.
The shortcomings of this strategy are severe. The intersection of the vertical line Ti/Tj = TRi,j = 1.0 with the Qi,j data point distribution covers a broad range of Qi,j values. Especially if more than only a few OD measurements were made for both the CSF and serum samples (say 6 or so), there might be several data points with TRi,j values close to 1.0 but considerably differing in their Qi,j values (e.g., point L4, S3 with TRi,j = 1.05 but Qi,j = 6, 16 in Fig. 1A ). A very small change of the TRi,j values may result in a different choice of the “best pair” with a completely different Qi,j value. The measurement evaluation thus becomes a matter of chance.
Due to the second condition, the region of usable Qi,j values is small compared with the range covered by all Qi,j values. Although all ODi and ODj values of Qi,j data points with TRi,j > 3.0 meet the condition of validity 0.1 ≤ OD ≤ 2.0 required by the test kit vendor, these data points cannot be used for evaluation.
Another major disadvantage with single-pair evaluation is the absence of any averaging of Qi,j errors caused by OD measurement errors. Of course, error averaging is possible only if the number of Qi,j values exceeds the number of parameters to be fitted.
These considerations also apply to Qi,j values calculated from eq 11, based on the 4PL equation ( Fig. 4 ). Therefore, only multiple-point evaluation was tested with the 4PL equation.
In view of the drawbacks of single-pair evaluation, multiple-point evaluation seems to be the better choice to extract the desired information from the measured data.
Q-Matrix Multiple-Point Evaluation
There is a slight but not significant difference of precision between methods α-QFRM and α-QSRM ( Table 2 ). Method α-QFRM, with three free parameters, generally works better with more than three or four Qi,j data points calculated from the minimum of four OD values, which Table 2 is based on. With method α-QSRM, only two parameters are fitted, so there is additional error averaging.
Evaluation Using Curve Fitting
Selection Criteria for Single-Pair Evaluation
Since there are no best-pair selection criteria referring to the positions of data points relative to the standard curve described by eq 1b, and due to the lack of error averaging, no attempt of single-pair evaluation using the α method has been made.
After rearranging 4PL eq 9, c(n) values can be calculated from the measured OD values. As a selection criterion for the best-suited pair of OD values, the corresponding c(n) values are usually recommended to lie as close as possible to the inflection point concentration C. The relative concentration error Δc(n)/c(n) is expected to have a minimum value at that point. But this is true only if there is a constant OD variation ΔOD0 across the entire concentration range. However, experience shows that this is usually not the case. 6 Dependency ΔOD(OD) shifts the minimum value of Δc(n)/c(n) to values less than C, which is no longer a basis for a selection criterion.
Limits of quantitation are specified to discriminate usable OD values from those to be discarded. They define a concentration range, and hence a range of OD values, but do not yield a best-suited pair of OD values from which to get the optimum AI result.
In view of the lack of reliable selection criteria, the absence of error averaging, and the unknown accuracy of method parameters, it is felt that single-pair evaluation with a 4PL standard curve may not be the best choice.
Pseudoconcentrations
The final result needed for AI calculation is the Q value given by eqs 2 and 10. Only the titer/concentration parameter ratio Q is of any interest, not their individual (pseudo-) values. Analysis of the Q matrix outlined above supports this statement. Qc is determined directly without calculating individual titer values (eqs 3 and 4b).
Inconsistent Method Parameters
By comparison of Figure 1A , B , it can be concluded that a nonhorizontal distribution of Qi,j values and a strong scattering of data points is (at least partially) due to an evaluation with inconsistent method parameters α and β. The same argument holds for the Qi,j distribution in Figure 4 and 4PL parameters A, B, C, and D. Decreasing of T0 values with increasing dilution in Table 1 also reflects the inconsistency between α and β and measured OD values.
Variation of method parameters was stimulated by the requirement of a horizontal Qi,j distribution. The (partial) replacement of standard curve parameters with corrected ones and tolerating the unrealistic but unique undiluted concentrations led to an increased precision with Q-value calculation. Values αc and βc or Bc and Dc can be regarded as the actual but initially unknown parameter values of the OD-value distribution, which is assumed to follow the α-method eq 1b or 4PL eq 9, respectively.
Advantages and Limitations
Less Auxiliary Data Needed
Replacement of the test kit vendor’s method parameters α and β or A, B, C, and D by fitted (αc, βc, Bc, Dc) or fixed (Ac, Cc) values means that original parameter values serve only as starting values for the fitting algorithm. They can be replaced by any reasonable numbers. As a consequence, the resulting Q (and hence AI) values are independent from any OD correction factor FOD. Thus, the methods can be used even if no values for method parameters and FOD are available, provided the measured OD values depend on titer or concentration values according to α-method eq 1b or 4PL eq 9.
With α-QSRM, the value of Qc is independent from α, and hence from an OD correction factor, but depends on β.
Obviously, the use of a standard curve together with an OD correction factor is not obligatory in CSF diagnostics. Consequently, there is no need for calibration wells or for adjusters on the test kit. This might motivate test kit manufacturers to rethink their evaluation strategies for ELISA measurements in this field.
Proficiency Survey Samples
Within this study, proficiency survey sample pairs were examined and Q values calculated. Usually, “spiked” specimens but not native CSF and serum are supplied, which is a common disadvantage of this sample type. Therefore, matrix effects present in dilution series of those samples might differ from the original patient’s material. However, imprecise or inconstant nephelometric measurements interfering with AI analysis can be excluded as INSTAND e.V. provides QAlbumin and QIgG values for each sample pair.
Improvement for Diagnostic Routine Laboratories
Besides the improvement of calculational precision and therefore increased patient safety, the usage of standard curve-free algorithms shows the potential of cost reduction for diagnostic assays. Laboratory effectiveness was improved by implementation of calculations and decision-making rules within the easily operated Microsoft Excel 2010 application AICON. A substantial reduction of hands-on time was achieved.
Footnotes
Acknowledgements
We would like to express our very great appreciation to the technicians of the laboratory of the virology department at the Max von Pettenkofer-Institute for their help in analysing the proficiency survey samples.
Declaration of Conflicting Interests
The authors declared no potential conflicts of interest with respect to the research, authorship, and/or publication of this article.
Funding
The authors received no financial support for the research, authorship, and/or publication of this article.