
Abstract
Recently advances in miniaturization and automation have been utilized to rapidly decrease the time to result for microbiology testing in the clinic. These advances have been made due to the limitations of conventional culture-based microbiology methods, including agar plate and microbroth dilution, which have long turnaround times and require physicians to treat patients empirically with antibiotics before test results are available. Currently, there exist similar limitations in pharmaceutical sterility and bioburden testing, where the long turnaround times associated with standard microbiology testing drive costly inefficiencies in workflows. These include the time lag associated with sterility screening within drug production lines and the warehousing cost and time delays within supply chains during product testing. Herein, we demonstrate a proof-of-concept combination of a rapid microfluidic assay and an efficient cell filtration process that enables a path toward integrating rapid tests directly into pharmaceutical microbiological screening workflows. We demonstrate separation and detection of Escherichia coli directly captured and analyzed from a mammalian (i.e., CHO) cell culture with a 3.0 h incubation. The demonstration is performed using a membrane filtration module that is compatible with sampling from bioreactors, enabling in-line sampling and process monitoring.
Keywords
Introduction
Sterility and bioburden testing are critical quality control steps in the pharmaceutical production process, and they are required for sterilization validation and release testing as per United States Pharmacopeia (USP) 71 and 61.1–3 Breaches of sterility and bioburden limits are costly in terms of time, materials, product, labor, and even life, and faster results enable more efficient production and valuable cost savings. The sterility or bioburden requirements of the industry also affect the supply chain (since the results are required for product releases and provide feedback on the sterility of the production equipment). However, the USP 61 and 71 compendial methods currently require long testing times (i.e., days) and can create process and inventory bottlenecks and significant technician testing time and labor.
The need for new rapid microbiology methods (RMMs) that reduce turnaround time, automate workflows, and eliminate the potential for error is widely recognized across regulatory agencies, the pharmaceutical industry, and quality control laboratories.1–3 New guidelines, such as Ph. Eur (5.1.6) and USP <1223>, have been released to guide the validation and adoption of the new technologies. Over the years, several new RMM products have come to the market, including the Milliflex Rapid System, BACTEC System, and BacT/ALERT Microbial Detection System. While these technologies make great strides in reducing the turnaround time for sterility results to 5–7 days, on average, they are still not rapid enough to provide immediate feedback affecting supply chain and real-time monitoring and control systems. In addition to sterility testing, there is new interest in actively integrating quality into manufacturing processes 4 through quality by design (QbD) approaches; QbD relies on testing critical quality attributes (CQAs; such as sterility) throughout the manufacturing process to ensure they are within the defined acceptance criteria. As a result, high quality (including sterility) is actively maintained and monitored instead of only evaluated at the endpoint. To efficiently implement QbD, technologies for in-line sampling and testing are ideal. And, as with supply chain management, the limitation for enabling in-line sterility testing of the biopharmaceutical production process has been the lengthy time to result.
In this article, we describe a proof-of-concept rapid microbiology screening system that is compatible with in-line testing within pharmaceutical production processes. The system consists of a filtration module that removes mammalian cells from the sampling stream (e.g., CHO cells being utilized for production of a protein or biologic), so that the sample can be processed for microbiological content. The processed sample is separated into thousands of nanoliter-sized droplets for stochastic confinement, encapsulation of any microbiological contaminants, and rapid accumulation of indicator reagents (as shown previously in clinical samples and workflows5,6). We demonstrate that the doubling time and viability of the bacteria are not inhibited by the microfluidic assay (enabling successful detection of a model contaminant). And, we demonstrate this detection within 3 h. We quantify the utility of the filtration step in terms of effectiveness at high CHO culture densities and low contaminant concentrations, and we report precautions that must be taken to eliminate the potential effects of photophysical/photochemical reporter dye reactions within the nanoliter assay.7,8 These results demonstrate that methods currently being adopted in clinical settings9,10 may be modified and adapted to have a significant impact in pharmaceutical and other industrial production processes and facilities.
Materials and Methods
Bacteria Cell Culture
Bacteria obtained were JW5605-1 (Keio collection), sourced from Dharmacon (clone cat. OEC4987-213607041). Stock solutions of the cells were made using LB broth formulation. The bacteria strain used was kanamycin resistant, so that selective growth (on kanamycin agar plates) could be used to ensure accurate counting of spiked samples. For each experiment, a vial of frozen stock was brought to room temperature and streaked onto an agar plate. After overnight incubation, colonies from the plate were transferred back to growth broth and cultured at 37 °C (shaken within flask). The incubation was stopped once the culture reached an OD600 of 1.0 (demonstrating successful log phase culture). Cell densities were then adjusted prior to spiking into the mammalian cell cultures (to provide a model of a nonsterile culture). After spiking, the experimental dilution was again streaked onto agar plates (after an appropriate dilution or after filtration), and the actual spiked concentration was recorded for each experiment. All procedures for bacteria preparation used sterile methods, and all devices, tubing, syringes, and solutions were either packaged sterile or filtered prior to use, to ensure an accurate spiking condition. Two bacterial concentrations of 1.7 × 10⁵ and 2.8 × 10⁷ CFU/mL were used in the spiked experiments (after dilution in the CHO cell culture and processing, and before mixture with growth broth and resazurin and injection into the droplet generator) to represent nonsterile CHO cell conditions.
Mammalian Cell Culture
CHO-M (GE Healthcare) cells were thawed and used to inoculate 125 mL shake flasks containing ActiPro (GE Healthcare) medium to achieve a viable cell density (VCD) of 2 × 10⁵ cells/mL. Flasks were placed on an INFORS HT Celtron orbital shaker (140 rpm, 25 mm throw) within a standard water-jacketed CO2 incubator (5% CO2/95% air at 37 °C). When the VCD reached 1 × 10⁷ cells/mL, the cells were harvested and diluted to either 1 × 10⁶ or 1 × 10⁷ cells/mL, inoculated with the appropriate concentration of bacteria (representing a model nonsterile culture as described above), and utilized in the following experiments. Experiments involving the filtration module involved injecting the cell solutions (spiked and sterile) into the filter apparatus and sampling according to the procedure below. Cell viability greater than 90% was deemed acceptable for performing the experiments. Additional agar plates were streaked postbacteria inoculation to ensure that the spiked bacteria remained viable within the mammalian cell culture environment for the duration of the experiments, and postfiltration to ensure that no bacteria were introduced during the filtration process.
Filtration Module
The filtration module consisted of Primecare membranes (iPOCDX; originally designed for point-of-care blood processing and diagnostic applications) cut into 13 mm diameter circles loaded into a 13 mm Whatman Pop-Top Filter Holder (GE Healthcare). The samples (1 mL volume) were pushed through this filtration module using a standard syringe. The filter module was then flushed using a second air actuation, pushing any remaining sample through to a collection tube. Two hundred microliters of the eluate was used for agar plating (for a control measure to quantify the efficiency of bacteria collection and removal), while the remaining volume was used in the droplet-enabled sterility screening assay. Figure 1A (left) shows an example benchtop bioreactor vessel that typically sits within a control station that provides controls for thermal mass, a regulated gas overlay, and four-gas mixing capability for automated pH and dissolved oxygen adjustments. In addition, the head plate (example shown in Fig. 1A , middle) typically allows insertion of additional probes or sampling tubes, and sampling using sterile sampling kits. The filtration unit described can be adapted and designed to directly interface with these sterile sampling kit tubes, and provide a method for in-process or on-line sampling by directly separating mammalian versus microorganisms, discussed below.
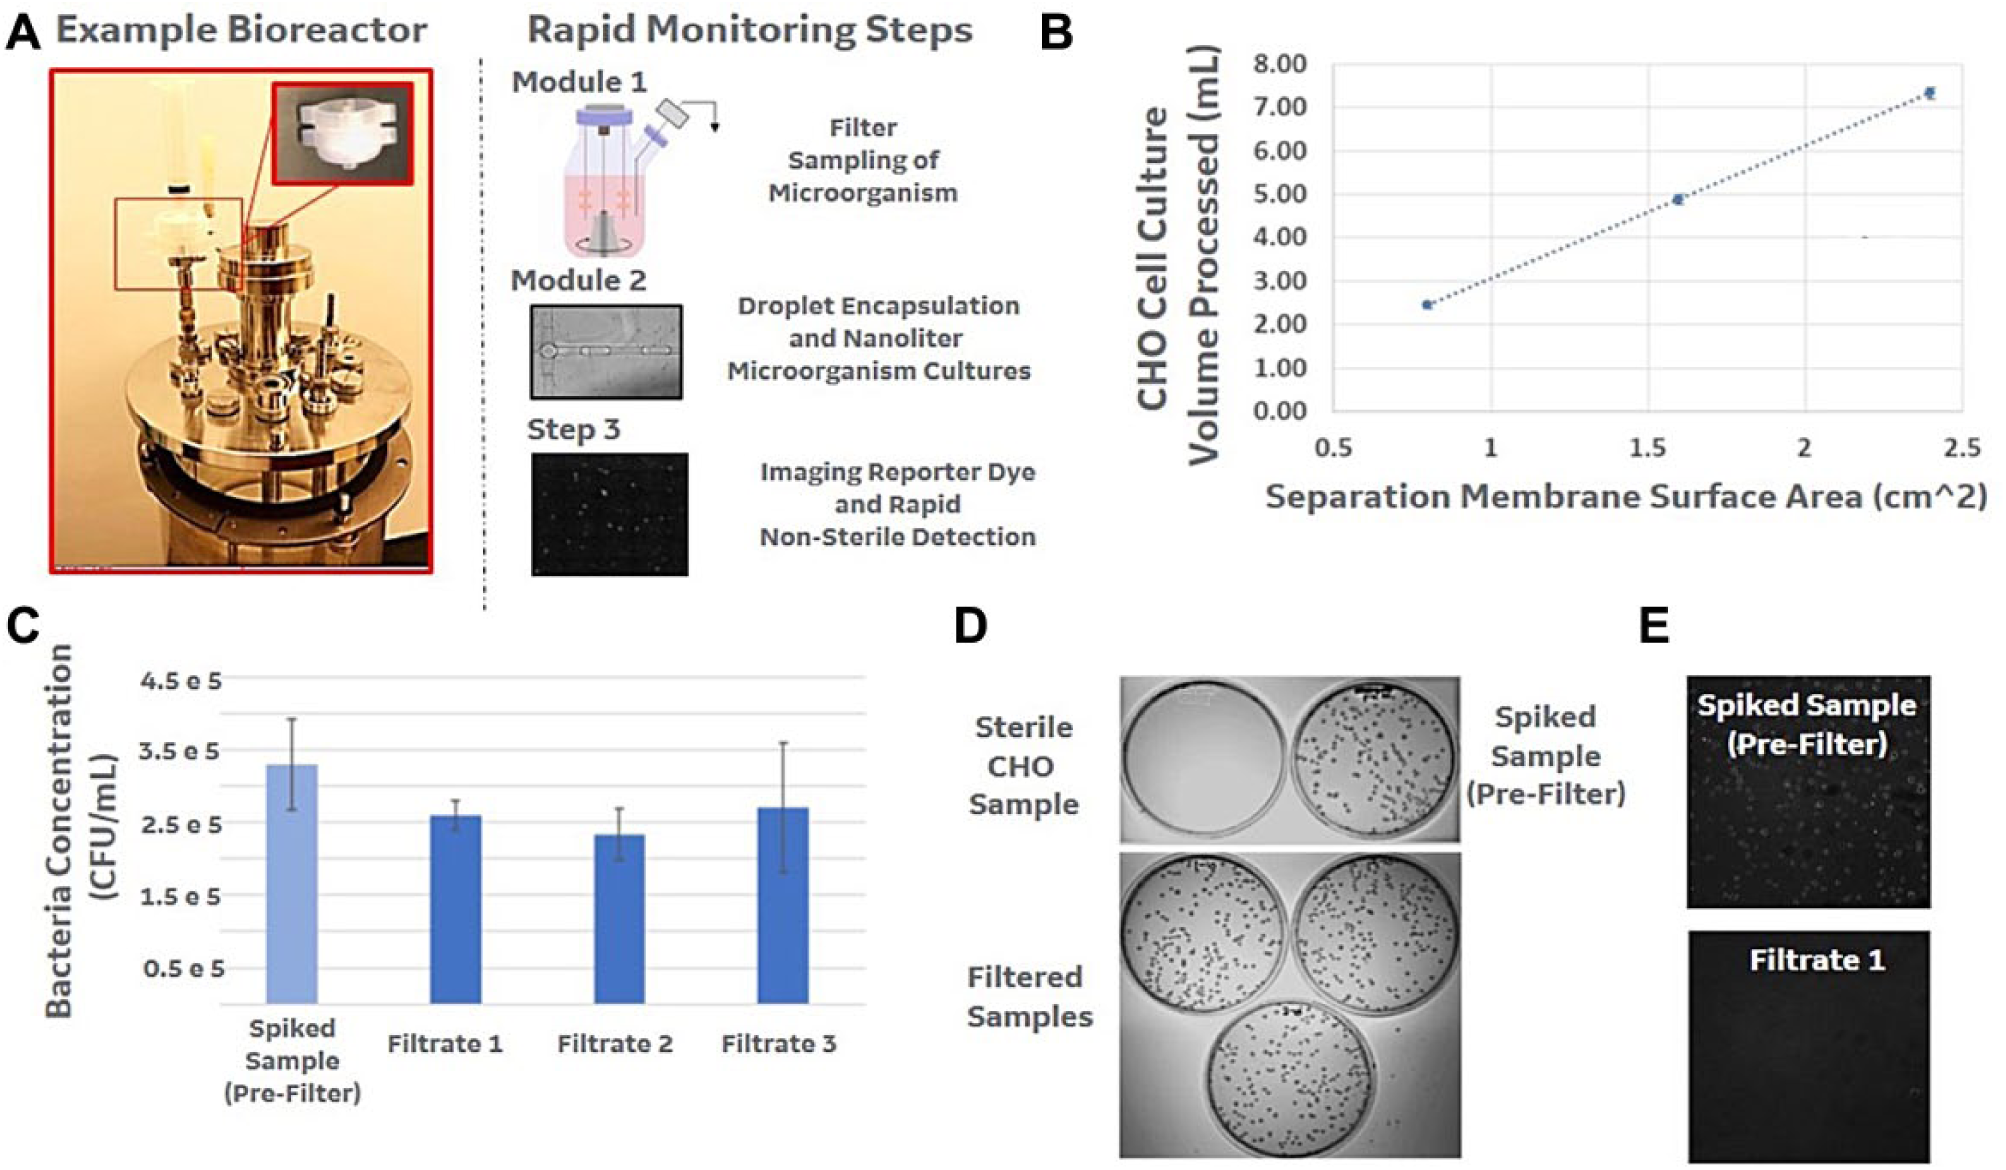
High-efficiency filtration as an interface between bioreactors and rapid microbiological tests. (
Droplet-Enabled Digital Growth Assay
Sample-in-oil droplets were formed using disconnected DG8 cartridges from BioRad QX200 Droplet systems. Connections to the cartridge were made using custom silicone gaskets to provide an airtight seal to the sample and oil inlet chambers within the cartridge. Both the sample and oil were loaded into these inlet chambers and pressurized using a 0.02 in. diameter Tygon tubing pressure fit into a hole within custom silicone covers (details shown below). The sample was first mixed with the indicator dye resazurin (using a 2 mM resazurin salt stock solution in water) and diluted by a factor of 10 with LB broth, creating a final sample solution with 400 µM resazurin. The chambers were then pressurized using two syringe pumps connected to the Tygon tubing, set at 15 µL/min for the sample and 15 µL/min for the oil chambers, respectively. The device was then run until the third collection chamber was filled, containing tens of thousands of sample-in-oil droplets.
The entire droplet-containing collection chamber was then moved to a standard PCR centrifuge tube and incubated in a thermal cycler at a constant temperature of 37 °C. After 0 or 3 h of incubation (results for different incubation times shown below), the tube was removed from the heat source and excess oil (below the droplet suspension) was removed from the tube. The droplet suspension was then injected into a disposable cytometer imaging chamber (countess disposable slides, Thermo Fisher), and loaded into an automated fluorescence microscope (Cytell, GE Healthcare). The sets of droplets were imaged using a Cy3 filter and a 10× 0.45 NA objective with a 5 or 2.5 ms exposure time, depending on the sample intensity to prevent pixel saturation. Fluorescence images of the droplets were then processed by using the particle-counting and analysis procedure described below.
Imaging Data and Population Statistics
All droplet images were scaled by exposure time differences to enable intensity comparisons. Droplets were first analyzed by separating them from the image background using auto thresholding with the Li method. The Li method is a segmentation approach offered as a built-in plugin on the FIJI software platform, and it uses Li’s minimum cross-entropy algorithm. 11 Next, the conjoined drops were separated using the erosion and watershed processes on the FIJI software platform. The ImageJ particle analyzer was then utilized to distinguish each individual droplet within the images using a minimum pixel area of 1000 pixels^2 and a circularity filter of 0-1. An additional precaution taken in this manuscript was to crop each image by 10% (montage images were not cropped for visualization purposes only), so that the droplets at the peripheral of each field of view are eliminated from analysis. This ensured that there was no “reimaging” of droplets or “double counting” of detected bacteria. Over time, the average intensity of the thresholded droplets increased in the experimental groups that contained bacteria, and by the 3 h time point the intensity diverged into two populations (corresponding to unoccupied droplets and bacterial cell[s] containing droplets). To demonstrate rapid differentiation of the nonsterile culture, we provide both raw images of the droplets and histogram plots showing the statistical distribution of the droplet intensities. The histogram plots are labeled with the µ ± 2σ region observed on the control sample (3 h time point, broth only, no bacteria, no CHO cells). For unoccupied droplets, we expect their population will be approximately normally distributed, with the mean of this population located within the µ ± 2σ region observed on the control sample. For the population of droplets that contain bacteria, their intensity distribution will get shifted to higher values, with the magnitude of the shift dependent on the bacteria concentration and test time. In this experiment, the experimental group with a high concentration of bacteria had all (>99%) of its droplet intensities shifted to much higher values that were well outside the intensity range observed on the control sample. In the experimental group with a low concentration of bacteria, we observed that the population of unoccupied droplets and population of bacterial cell-containing droplets were convoluted with one another at the 3 h time point with a clear increase in the number of droplets outside of the µ ± 2σ region defined by the control sample. For visualization, we deconvoluted the two populations in the data graphs by fitting a first Gaussian distribution to the population of unoccupied droplets and a second Gaussian distribution to the population of bacterial cell-containing droplets. These fits can be used to differentiate the two populations, and further demonstrate the rapid detection of bacterial growth at early test times.
Results and Discussion
Filtration Efficiency
CHO cell culture samples were collected as described above using the filter holder/connector for aseptic sampling. In this demonstration, the CHO cell culture was expanded in a flask, harvested, and centrifuged to the desired testing concentration of 2 × 10⁶ or 5 × 10⁶ cells/mL. One milliliter of the CHO cell solution (both bacteria-containing and sterile samples) was filtered through the iPOCDX as described above. Filtration-based sampling and sterility testing remains the most common method of sampling from water and cell-free reagent streams within pharmaceutical production lines. However, direct filtration-based sampling from mammalian cultures or products remains difficult, as the high density of mammalian cells can clog sampling filters or hinder separation from and analysis of microorganisms. The IPOCDX is designed as a microdepth filter with asymmetric pore sizes from the top to the bottom of the membrane (35 microns on top to 5 microns on the bottom), allowing efficient removal of mammalian cells from the assay sample at high volumes (required in pharmaceutical testing1–3).
As shown in Figure 1B , in this bioreactor application, the depth filter enabled direct removal of CHO cells from the collected sample at high concertation using a relatively small-diameter filter assembly. Importantly, the figure shows that the design of the depth filter (i.e., a gradient of larger to smaller pores within the depth of the filter) enables separation of bacteria from mammalian cells from high volumes of sample, with relatively small-diameter filters. Within this depth filter, the larger mammalian cells are retained throughout the filter structure (as opposed to just the surface of a standard filter), and this enables filtration of many more cells before the filter is clogged and stops passing sample. Documents such as the U.S. Pharmacopeia (http://pharmacopeia.cn/v29240/usp29nf24s0_c71.html) outline the volumes of sample that must be tested based on sample type, which range from 1 mL to 10% of the contents of a container (but not less than 20 mL); the data shown in Figure 1B show that filtration of tens of milliliters of sample can be accomplished using a manageably sized filter. The iPOCDX filter was also demonstrated to have low bacteria/microorganism retention. Figure 1C , D demonstrates a high collection efficiency for E. coli within the nonsterile CHO culture samples, while the cell cytometer images from the same samples show negligible escaped CHO cells from the collected samples ( Fig. 1E ). The resazurin assay (described above), as well as several other rapid microbial screening techniques, requires efficient separation of mammalian cells and microogranisms, due to cross-reactivity of the indicator dye. Therefore, use and application of these new filtration techniques may be essential in expansion of the rapid techniques to pharmaceutical cell culture or cell therapy workflows.
Droplet-Based Bacteria Growth
As shown previously in clinical applications and examples,5,6,9,10 we utilized confinement of individual microorganisms into nanoliter droplets of sample, broth, or indicator dye to reduce the time required to detect their presence. As described above, we loaded the sample directly into a disconnected BioRad DG8 cartridge (separated from the QX200 droplet generator) and utilized a custom silicone interface ( Fig. 2A ) to pressurize the sample and oil inlets and produce the droplets. In the digital experiment (and due to the small size of each droplet), few droplets contain a microorganism (using the “real-world” contaminated or nonsterile sample concentrations). Droplet confinement of a single bacteria results in a greater relative concentration of bacteria (compared with the original sample) within the droplet (i.e., 1 × 10⁵ CFU/mL sample results in 1 in 10 nanoliter droplets containing a bacterium, within which the trapped bacterium is now at a 1 × 10⁶ CFU/mL droplet concentration), enabling faster accumulation of indicator dye and more rapid analysis. However, because of this sampling, many droplets remain empty, and therefore many droplets are required to screen the sample and provide a statistical analysis. As shown in Figure 2A , B (zoom-in images), the BioRad device enables generation of ten thousands of nanoliter droplets and collection in a large-volume collection reservoir. This well-type interface on the droplet generator allows simple collection of the droplets and injection into imaging reservoirs; as shown in Figure 2B , standard cytometers work well to spread the droplets across a large area in a single layer (to allow fluorescent imaging of the entire population). The average droplet volume was approximately 1–5 nL, and each cytometer window shown held ~10,000 droplets (measurements not shown). This enabled analysis of up to 41 µL of the original sample with each cytometer window and provided adequate coverage across the potential input concentrations of bacteria from nonsterile samples (as outlined in Fig. 2C ). Additional droplets can also be injected into multiple cytometer windows (or larger windows) and imaged simultaneously, allowing analysis of larger sample volumes or multiple samples from a manufacturing lot (without complicating or slowing down the assay). To simplify the rapid-culture step, each sample of droplets (prior to injection into the cytometer) is incubated within a standard PCR tube at 37 °C, and Figure 2D shows that growth is not inhibited within this droplet-based growth step (i.e., encapsulated bacteria double within droplets at growth times equivalent to that using standard microbroth techniques).
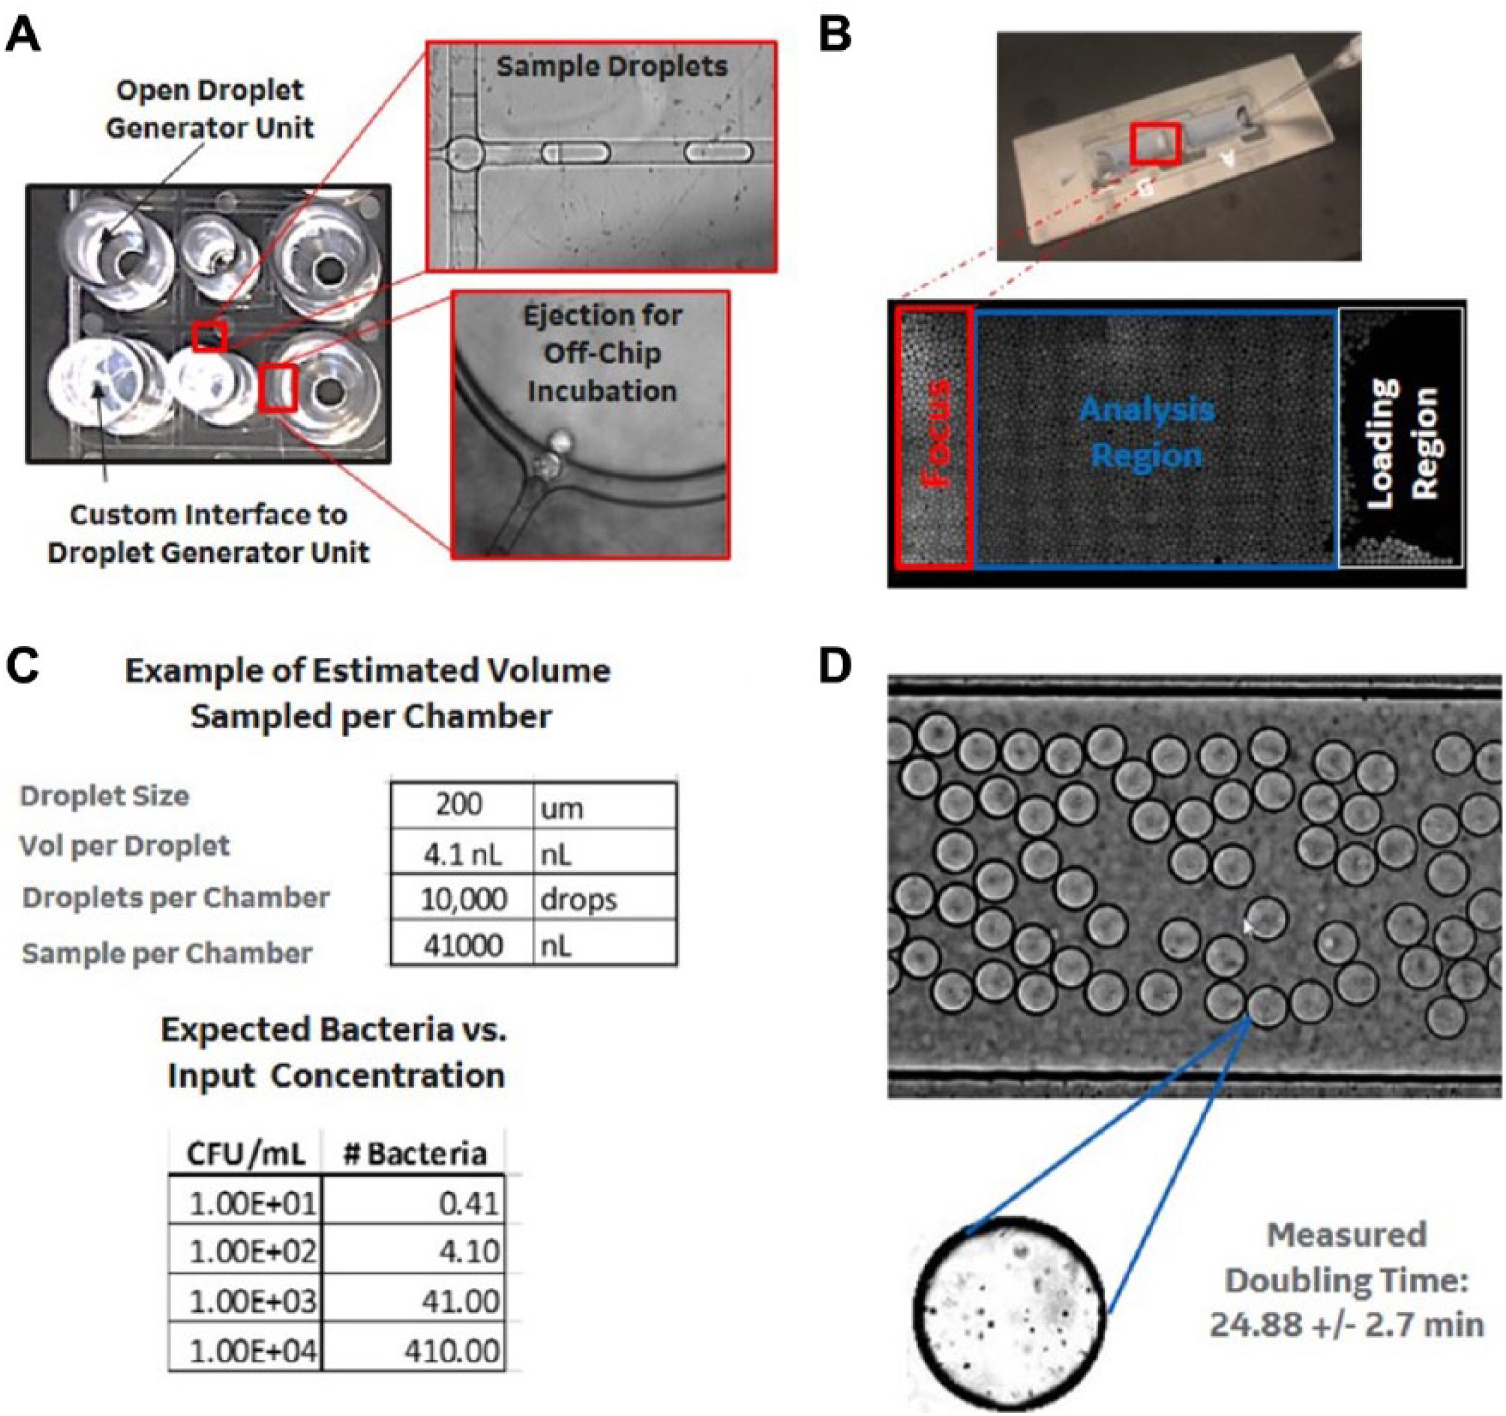
Microfluidic droplet-based microbial detection. (
Photochemistry of Indicator Dyes within Nanoliter Bacteria Cultures
To monitor the presence of microorganisms in the droplets, several indicator dyes are available. 12 Herein, we utilize the fluorescent indicator resazurin, which is reduced by electron receptors used in cellular metabolism (e.g., NADH) and upon reduction produces a fluorescent product (i.e., resorfurin). Using this indicator, the fluorescence intensity in each droplet can be used to detect the presence of a cell. Detection and quantification of contaminated microorganisms is dependent on several experimental conditions, including the removal of CHO cells (the presence of which would also result in conversion of resazurin), the kinetics of accumulation of resorfurin within bacteria-containing droplets (i.e., the time required for the fluorescent product to accumulate to detectable in-droplet concentrations, which is reached sooner compared with the bulk assay due to droplet confinement), and the stability of the background fluorescence signal in empty droplets (i.e., stable background signal is necessary to differentiate empty versus bacteria-containing higher-fluorescence droplets). Background fluorescence in these resazurin assays is dependent on the photophysics and photochemical properties of the dye itself, which is still under active investigation. And, within nanoliter assays (such as the rapid droplet-based screen), these physicochemical properties of the dye7,8 may play a more significant role in the design of the assay than has previously been reported. Of importance is the photoinduced reduction of resazurin, which may occur at a particular broth pH or in the presence of amines.7,8 Within nanoliter assays (in which the entire droplet sample is rapidly and completely irradiated), these photoinduced reactions may result in fluorescent products that shift the baseline fluorescence and mimic bacteria-induced resazurin reduction that has occurred as a result of the presence of a microorganism. Figure 2B (and the outlined red rectangular section on image of control or bacteria-free droplets) shows that in the presence of standard broth, the area of droplets that were previously irradiated for the purposes of focusing and image adjustments has undergone a photochemical reaction and yields a higher-than-background fluorescence at time 0 of culture. The images that have not undergone previous imaging and analysis remain at low-background fluorescence values and remain suitable for analysis (shown in the blue rectangular box). Figure 3A shows a time series of this photoinduced reaction and demonstrates the care that must be taken after droplet culture to image the droplet samples with consistent imaging sequences and timings and ensure that the photochemical reactions do not interfere with the signal generated by the presence of the microorganisms. The figure shows that the 2.5 ms exposure times chosen in this report were also suitable for minimizing the effect of the photoinduced reaction on imaging a new region of the device. Figure 3B shows sequential images from across a droplet-containing imaging chamber, and demonstrates that proper planning of the imaging path and exposure timing results in analysis of droplet regions of interest that are negligibly altered by previous irradiation and analysis of adjacent droplets. Such planning includes defining a focal plane in a separate focal area of the device to reduce the repeated irradiation of droplets of interest. Defining a single focal plane requires a relatively flat layer of droplets (to eliminate out-of-focus droplets). Within the current imaging chamber, the droplets typically reside on one of the imaging surfaces, enabling imaging of the entire device using multiple fields of view; however, custom imaging devices (with a chamber height equivalent to droplet diameter to further ensure flat droplet layers) are a focus of future work to ensure optimal focus across the entire device.
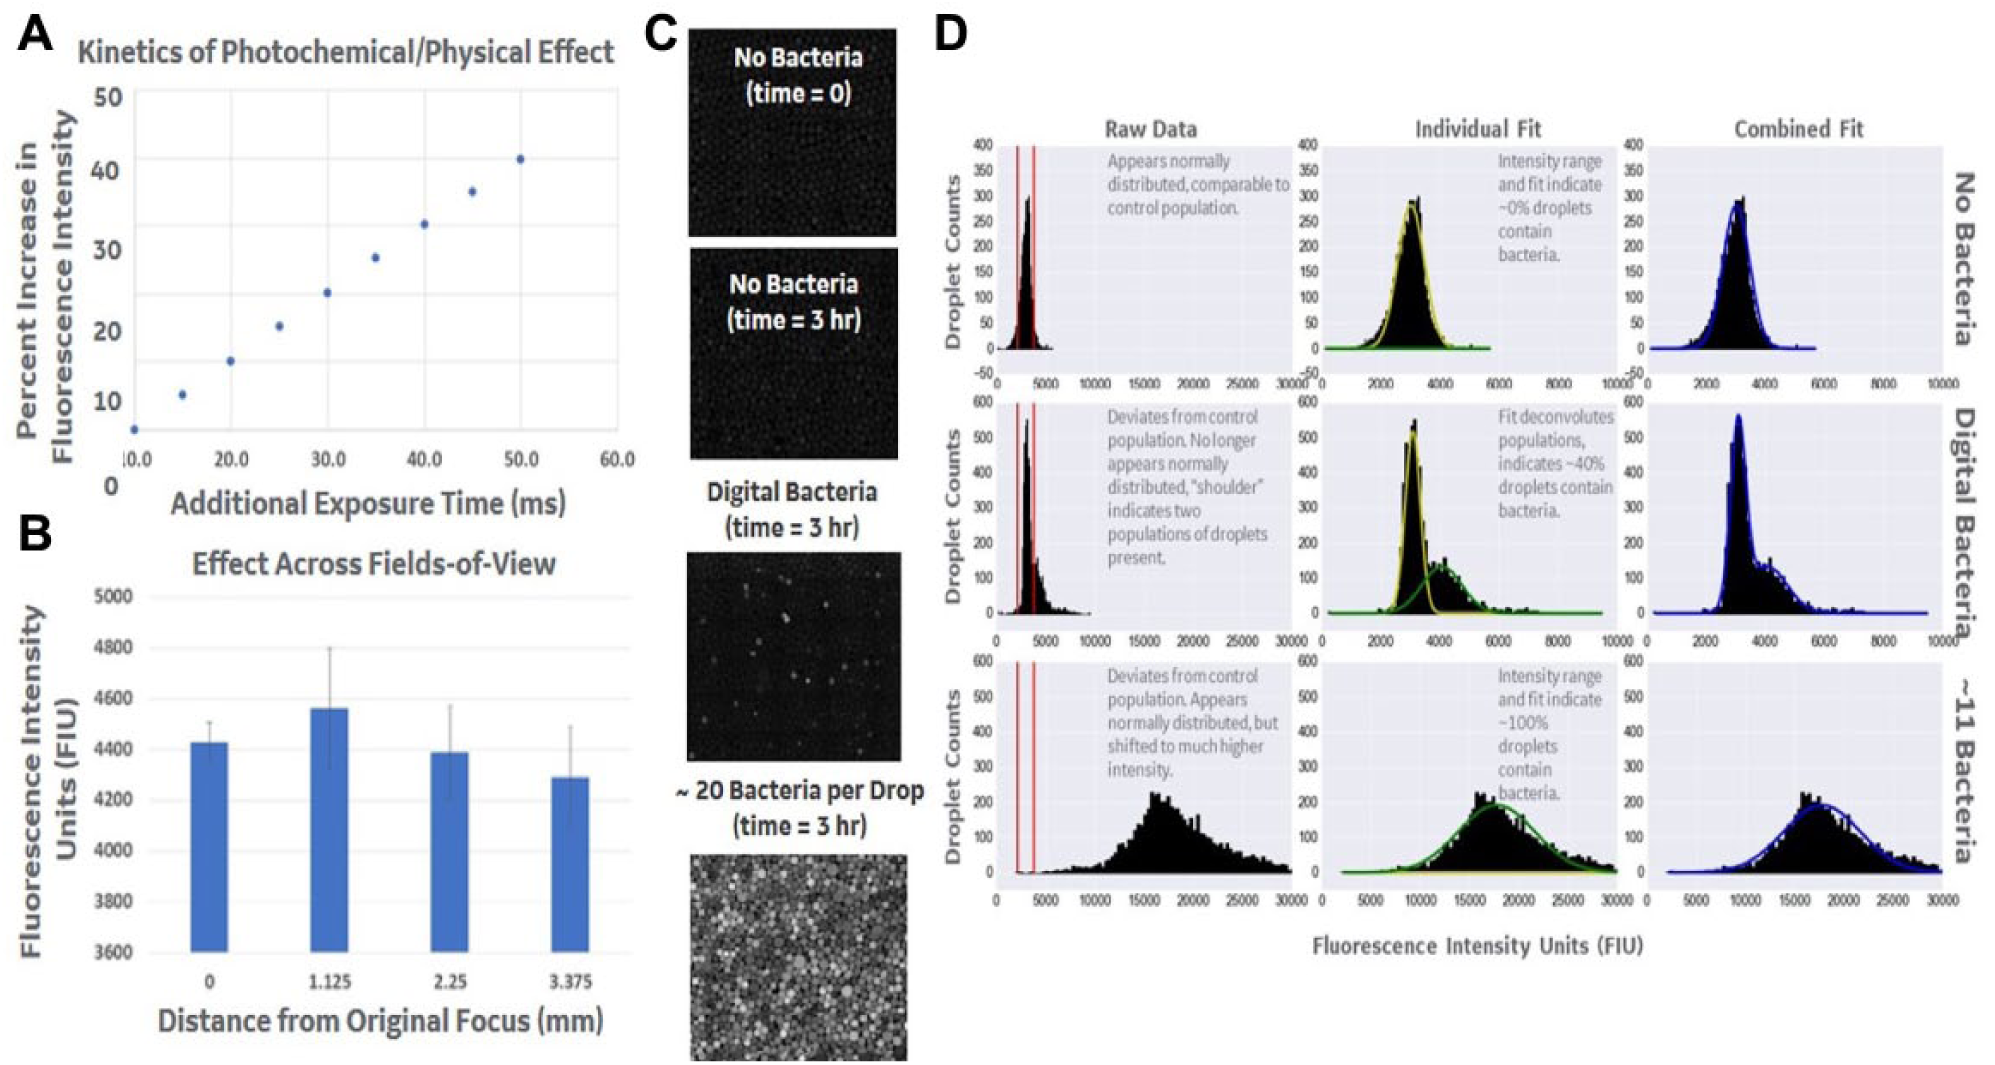
Quantification of photophysical and photochemical effects on resazurin assay and final detection of bacterial contaminants from CHO cell cultures. (
Nanoliter Microorganism Culture and Rapid Screening CHO Cell Cultures
The images of the empty/control droplets, sterile CHO cell culture droplets, and nonsterile droplets (varying levels of contamination) demonstrated a clear increase in the number of highly fluorescent droplets in the bacteria-containing samples ( Fig. 3C ). Figure 3D shows the histogram of droplet intensities for each sample, including CHO cultures contaminated with two concentrations of E. coli. The high concentration of ~2.8 × 10⁶ CFU/mL generated droplets that all contained an average of 11 bacteria at the 0 time point. The second concentration of ~1.7 × 10⁴ CFU/mL generated digital droplets, where 1 in every 140 droplets contained ~1 CFU at the 0 time point. By the 3 h time point, each nonsterile culture produced a statistically significant increase in the number of highly fluorescent droplets, compared with the broth and sterile controls. In previous clinical and diagnostic studies, the time required to differentiate bacteria-containing from empty droplets has been shown to depend on the size of the droplet; therefore, the time to result may be further optimized for specific pharmaceutical applications. This optimization will be important when expanding this technique to slower-growing strains of bacteria, which may require smaller droplet sizes in order to perform testing within the same time period (i.e., 1–4 h of droplet-based culture). In addition, the resazurin dye has been utilized for examination of other potential contaminants in pharmaceutical environments, including other bacteria (both aerobic and anaerobic), yeast, and fungi. 13 Further work is required to understand the sample preparation requirements for each of these contaminants when utilizing microscale and rapid assays, and the importance of the use of additional reporter dyes in these assays to provide analytical coverage for each type of contaminant that must be screened within pharmaceutical production or product release workflows.
Conclusion
Microscale technologies are being rapidly integrated into clinical and diagnostic workflows and offer the potential to decrease assay time and complexity, while improving sampling and testing automation.10,14–19 We demonstrate that with adequate integration of sample preparation and assay planning, rapid microbiological tests can be adapted to pharmaceutical sterility workflows.1–3 Replacement of current microbiological tests will result in shorter test cycle times, which may lead to cost savings (i.e., faster elimination of contaminated batches from production or faster detection and remediation of a potential contamination event), increased workflow efficiencies (i.e., faster release and decrease in warehousing time of product), and increased safety (i.e., rapid screening of cell or gene therapy products, which have shelf-life times that are shorter than the currently available sterility tests or are needed urgently to treat a patient). The emergence of these rapid and automated methods will necessitate comparison with traditional methods to ensure comparable results. In the near future, technology developers must work closely with pharmaceutical manufacturers to define standards, develop alternative sampling methods, and establish new protocols, thereby bringing the advantages of rapid and automated methods to the pharmaceutical industry.
Footnotes
Acknowledgements
We thank Dr. Erik Kvam (GE) for assistance in microbiology.
Declaration of Conflicting Interests
The authors declared the following potential conflicts of interest with respect to the research, authorship, and/or publication of this article: Johns Hopkins, Stanford, Pennsylvania State University, and General Electric have filed patents on methods, consumables, and/or reagents for rapid microbial detection in the past.
Funding
The authors disclosed receipt of the following financial support for the research, authorship, and/or publication of this article: Research reported in this publication was partially supported by the National Institutes of Health/National Institute of Allergy and Infectious Diseases under award number R01AI117032. The content is solely the responsibility of the authors and does not necessarily represent the official views of the National Institutes of Health.