
Abstract
Accurately predicting the human response to new compounds is critical to a wide variety of industries. Standard screening pipelines (including both in vitro and in vivo models) often lack predictive power. Three-dimensional (3D) culture systems of human cells, a more physiologically relevant platform, could provide a high-throughput, automated means to test the efficacy and/or toxicity of novel substances. However, the challenge of obtaining high-magnification, confocal z stacks of 3D spheroids and understanding their respective quantitative limitations must be overcome first. To address this challenge, we developed a method to form spheroids of reproducible size at precise spatial locations across a 96-well plate. Spheroids of variable radii were labeled with four different fluorescent dyes and imaged with a high-throughput confocal microscope. 3D renderings of the spheroid had a complex bowl-like appearance. We systematically analyzed these confocal z stacks to determine the depth of imaging and the effect of spheroid size and dyes on quantitation. Furthermore, we have shown that this loss of fluorescence can be addressed through the use of ratio imaging. Overall, understanding both the limitations of confocal imaging and the tools to correct for these limits is critical for developing accurate quantitative assays using 3D spheroids.
Introduction
The ability to accurately model the complex responses of human tissues and organs in a laboratory setting is crucial for many fields, including drug discovery and toxicity testing.1–5 However, the current methods and models, which include both in vitro assays and in vivo animal testing, are often inadequate in their ability to predict how a compound will interact within the human body.1,3 In vitro assays, which predominantly utilize two-dimensional (2D) cell monolayers, are relatively inexpensive and easy to perform and have the potential to utilize human cells from various sources. However, 2D cell monolayers are limited due to significant differences with the in vivo environment, including low cell densities, a predominance of cell–plastic interactions, a lack of diffusion gradients, and for certain cell types, dedifferentiation and a loss of organ-specific functions.6–8 Alternatively, while animal models are able to recapitulate the complexity of the in vivo environment, they are expensive and time-consuming, thus limiting their usefulness to the evaluation of only very small numbers of compounds. Furthermore, animal models, due to species differences, often fail to predict the human response.9,10 Three-dimensional (3D) multicellular spheroids have been proposed as an intermediate test bed.1,2,5,10 Compared with animal testing, spheroids are inexpensive and easy to use and have the potential to use human cells.1–3 Furthermore, spheroids better approximate the cell density found in vivo, have increased levels of cell–cell interactions and intercellular communication, and have maintenance of the differentiated state and recapitulation of organ-specific processes.6–8,11–14
Despite the biological advantages of spheroids, there are numerous other issues that must be overcome to utilize spheroids as a high-throughput screening tool. For example, imaging of thin 2D monolayers is straightforward, whereas spheroids require more complex techniques to visualize the additional biology occurring within these relatively thick microtissues.2,15,16 Histological techniques, such as cryo- and plastic sectioning, work well but are time-consuming, low throughput, not appropriate for screening a large number of spheroids, and not amenable to imaging live cells. 15 Alternatively, confocal and two-photon microscopy optically section spheroids and can visualize living cells.17,18 Furthermore, confocal microscopy has been configured as a high-throughput instrument for the purposes of high-content imaging large numbers of samples. However, due to light scattering, confocal microscopy has inherent limitations with respect to imaging thick tissues.15,18 To overcome this limitation, tissue clearing methods that remove scattering substances and/or provide refractive index matching have been developed.18–21 Although the depth of imaging is significantly improved, clearing can only be used on fixed nonliving cells as part of an endpoint assay.18–21 Endpoint assays are important, but not all assays can be performed as single-point assays. Live-cell imaging enables users to examine dynamic changes over time, and gather more information.
To evaluate the usefulness of spheroids as a high-throughput screening tool, we developed a method to form spheroids directly within a 96-well plate, as well as examine the quantitative limitations associated with live-cell confocal imaging of spheroids. Through molding agarose hydrogels directly within a 96-well plate, we formed four spheroids of reproducible size that are located at precise x, y, z locations across the entire plate. By varying the number of cells seeded per well, the size of the spheroids could be varied, ranging from 50 to 200 µm in diameter. To determine the depth of confocal imaging, spheroids were formed from cells that were uniformly labeled with four fluorescent dyes, each with different excitation/emission wavelengths. Confocal z stacks were acquired and analyzed to evaluate the total and positional fluorescent signal for spheroids of variable sizes. As spheroid radii increased, the overall proportion of fluorescent signal retention was diminished. Furthermore, the fluorescent signal decreased as a function of z depth into spheroids of all sizes. Interestingly, loss of fluorescence across each x, y confocal slice of the spheroid was not uniform. Due to the curved nature of the spheroid, loss of fluorescence was least around the outer edges of the spheroid and greatest in the center of the spheroid, resulting in a bowl-like appearance in a 3D rendering of the spheroid. Unlike solid-tissue blocks, the irregular spheroidal shape and subsequent bowl-like appearance make it difficult to accurately model, quantitate, and correct the fluorescence throughout a 3D microtissue. However, we have shown that loss of the fluorescent signal can be addressed by ratio imaging. Overall, understanding and accounting for the fluorescent changes throughout confocal z stacks of variable-sized spheroids is critical for designing quantitative biological assays using spheroids.
Materials and Methods
Micromold Fabrication and Hydrogel Formation
Molds, designed using computer-assisted design (CAD) (Solidworks, Concord, MA), consisted of two main components: a base platform on which lay a series of four rows by eight columns of pegs ( Fig. 1A ). The design of the peg consisted of three main components. Directly on the base platform lay a cylinder shape designed to fit tightly within the inner diameter of a well, thus preventing shifting in the x, y direction. This cylinder was then funneled into a flat-top conical structure ending with a two-row by two-column array of conical-shaped microposts, each positioned at the center of an imaging grid of the Opera Phenix. Molds were 3D printed (Phenomyx LLC, Cambridge, MA).
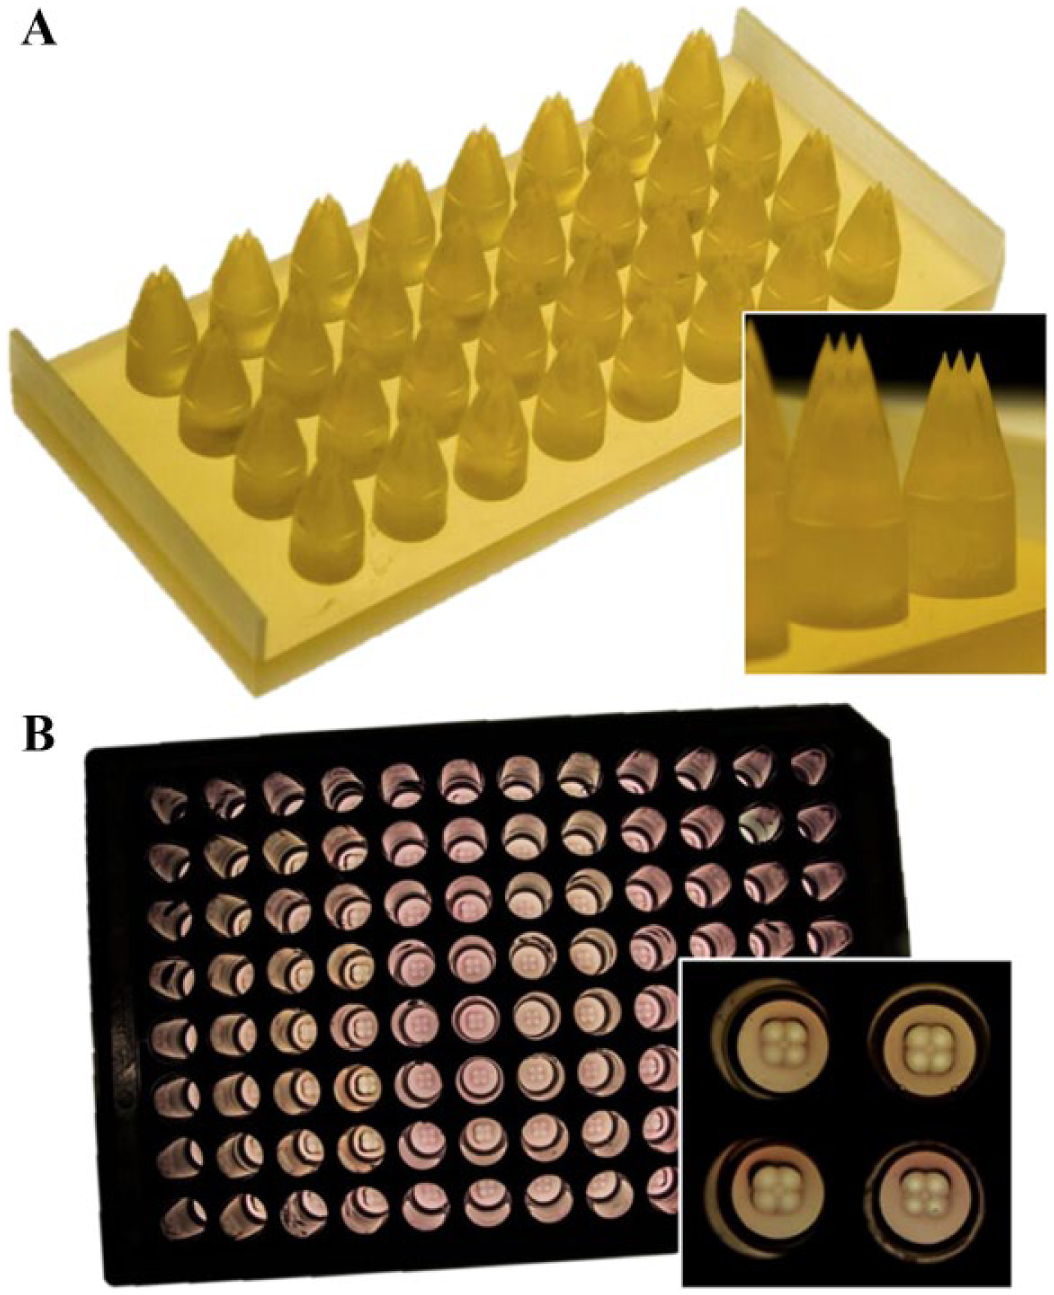
Molding system to form microwells for four spheroids per well in a 96-well plate. Molds designed in CAD, consisting of an array of four rows by eight columns of pegs, with each peg containing four microposts, were 3D printed (
To form hydrogels, 90 µL of sterile molten UltraPure Agarose (Fisher Scientific, Waltham, MA) (2% weight/volume in phosphate-buffered saline) was pipetted into each well and the mold was placed on top of the plate with the microposts submerged in agarose. After 10 min, the molten agarose solution solidified and the mold was removed. The resulting hydrogel that formed within each well contained a round loading dock above four microrecesses ( Fig. 1B ). To equilibrate the hydrogels, 150 µL of serum-free Dulbecco’s modified Eagle’s medium (DMEM; Life Technologies, Grand Island, NY) supplemented with 1% penicillin/streptomycin was added to each well and incubated for 24 h at 37 °C with 10% CO2.
Cell Culture, Fluorescent Dye Labeling, and Spheroid Formation
Human ovarian granulosa (KGN) cells were grown in DMEM with 10% fetal bovine serum (FBS) (Fisher Scientific) and 1% penicillin/streptomycin at 37 °C with 10% CO2. Once confluent, cell monolayers were labeled by first removing serum-containing medium from the culture flasks. Fluorescent dyes were reconstituted in serum-free DMEM, and incubated with the cell monolayer for 30 min at 37 °C with 10% CO2. Four dyes were used to stain monolayers: 2 µM CellTracker Red CMPTX (CTR) (Life Technologies, Grand Island, NY), 2 µM CellTracker Green CMFDA (CTG) (Life Technologies), 2 µM CellTracker Violet (CTV) (Life Technologies), and 2 µM CellTracker Deep Red (CTDR) (Life Technologies). After labeling, medium was exchanged with fresh serum-free DMEM and incubated for 15 min at 37 °C with 10% CO2. The labeled cell monolayers were harvested using 0.05% trypsin, concentrated by centrifugation at 120g for 6 min, and counted. Cells were washed once with serum-free DMEM and spun down at 120g for 6 min. Cells were resuspended in serum-free DMEM at one of the following concentrations: 50,000, 100,000, 150,000, 200,000, 250,000, 300,000, 400,000, or 500,000 cells/mL. A 20 µL aliquot of cell suspension was pipetted into the loading dock of each hydrogel to form four spheroids each composed of 250, 500, 750, 1000, 1250, 1500, 2000, or 2500 cells. After allowing the cell suspension to settle to the bottoms of the microrecesses for 30 min, 150 µL of serum-free DMEM was added per well. Cells were allowed to self-assemble into spheroids for 24 h prior to imaging.
Microscopy and Image Analysis Measurements
To image spheroids, the Opera Phenix High Content Screening System (PerkinElmer, Waltham, MA), an inverted confocal microscope equipped with proprietary Synchrony Optics consisting of a Nipkow spinning microlens disk in conjunction with a pinhole disk and two sCMOS cameras, was used. Fluorescent images for each dye were acquired using the 20× water objective in conjunction with four excitation lasers: 405 nm for CTV, 488 nm for CTG, 561 nm for CTR, and 640 nm for CTDR. Confocal z slices of spheroids were acquired every 5 µm for a total of 500 µm.
Confocal z slice images were analyzed via two different image analysis software programs: Imaris (Bitplane, Belfast, UK) and ImageJ (National Institutes of Health, Bethesda, MD). With Imaris, confocal slices were rendered as 3D objects, and a mask of the outer spheroid surface was created. Total volume was measured for each spheroid, and its average radius was computed by the following equation:
Data Analysis and Derivation of Ideal Curves
To evaluate fluorescence, and its subsequent loss due to imaging limitations, both the measured and maximum hypothetical fluorescence were computed per slice. The measured fluorescence for each slice was plotted as a function of its z depth, and the area under the curve (AUC) was calculated (
Suppl. Fig. 1B,D
). To calculate the hypothetical fluorescence, the following assumption was made: since all cells of the spheroid were evenly stained as a cell monolayer prior to spheroid formation, the signal was assumed to be homogenous throughout. Therefore, cross-sectional area should increase linearly with respect to fluorescence for each slice up until the equator. To determine the hypothetical signal, fluorescence was plotted as a function of cross-sectional area, and the best-fit line for the linear region of the curve was determined to be
To evaluate alterations of fluorescent signal within a spheroid, the center of the spheroid was identified, and then on each confocal slice a series of concentric rings were propagated outward from the center point ( Suppl. Fig. 5C ). The fluorescent values around each concentric circle were then averaged to yield the average fluorescent signal across the cross-sectional radii (x, y) ( Suppl. Fig. 5C ). The average fluorescent signal was then plotted as a function of its cross-sectional radii for each confocal slice throughout the spheroid.
To evaluate the fluorescent loss throughout the z dimension, the center of the spheroid was identified, and the average fluorescent intensity was computed along that central z axis for each slice ( Fig. 5B ). The average intensity of each point was normalized by the maximum fluorescent intensity along the central z axis for each spheroid. This normalized average intensity was plotted as a function of z depth. The best-fit exponential decay function was calculated from 50 µm past the peak signal for every spheroid, according to the following equation: y = Cemx, where y is normalized average fluorescence, x is z depth, and m represents the rate of loss. Spheroids were binned based on 10 µm bins, and the average and standard deviation of the slope of the exponential decay function of each dye were computed and plotted as a function of spheroid radii.
To evaluate the ability of ratio imaging to mitigate fluorescent loss throughout the z depth, the average fluorescence along the central z axis was measured for spheroids prelabeled with both CTG and CTDR as 2D monolayers. To perform ratio imaging, the CTG fluorescence was divided by the CTDR fluorescence at each z slice and vice versa. Both the average and normalized fluorescence were plotted as a function of spheroid z depth. The average and standard deviation of the fluorescence throughout the z depth were computed for both pre- and postnormalization. To compare the effect of ratio imaging, a coefficient of variation (CV) analysis was performed for both pre- and postnormalization of the fluorescence throughout the z depth. Lower CV values indicate less variation throughout the z depth.
Results
Tri-Axis Positional Control of Spheroid Formation in a 96-Well Plate for Confocal Imaging
To increase the throughput of spheroid formation, we designed a mold insert compatible with a 96-well plate. The micromold consisted of a series of pegs, where each peg was designed to fit within the dimensions of one well ( Fig. 1A ). Furthermore, atop of each peg were four conical-shaped microposts, thus enabling the formation of four technical replicates per well. To minimize the imaging area and the number of confocal slices, the micropegs were designed to fall within the same spatial location in every well. Therefore, after adding agarose into the 96-well plate, the resulting hydrogel consisted of four microwells with the same x, y, z locations in every well ( Fig. 1B ).
To evaluate the accuracy of the mold, spheroid formation was measured with respect to two different assessments: (1) the x, y, z location in each well and (2) spheroid radii. Monolayers of KGN cells were labeled with CTR, trypsinized, counted, and seeded into hydrogels to form spheroids (~750 cells). After 24 h, confocal slices were acquired using the 20× water objective and analyzed to measure x, y, z position as well as spheroid radii. Spheroids formed in specific locations within the x, y bounds of the 646 × 646 µm imaging grid system of the microscope ( Fig. 2A ). Furthermore, spheroids formed within a 200 µm range of z locations, approximately centered 650 µm from the bottom of the plate ( Fig. 2B ). To assess the reproducibility of size, we seeded plates with either the same or varying concentrations of monodispersed cells. When seeding ~750 cells per spheroid across the entire plate, the average radius was 54.2 ± 5.2 µm; thus, the standard deviation was approximately 10% of the mean ( Fig. 2C ). Furthermore, when seeding varying concentrations (~250 to ~2000 cells/spheroid), the higher seeding densities yielded larger spheroids ( Fig. 2D ). Regardless of the seeding density, the standard deviation was approximately 10% of its mean ( Fig. 2D,E ).
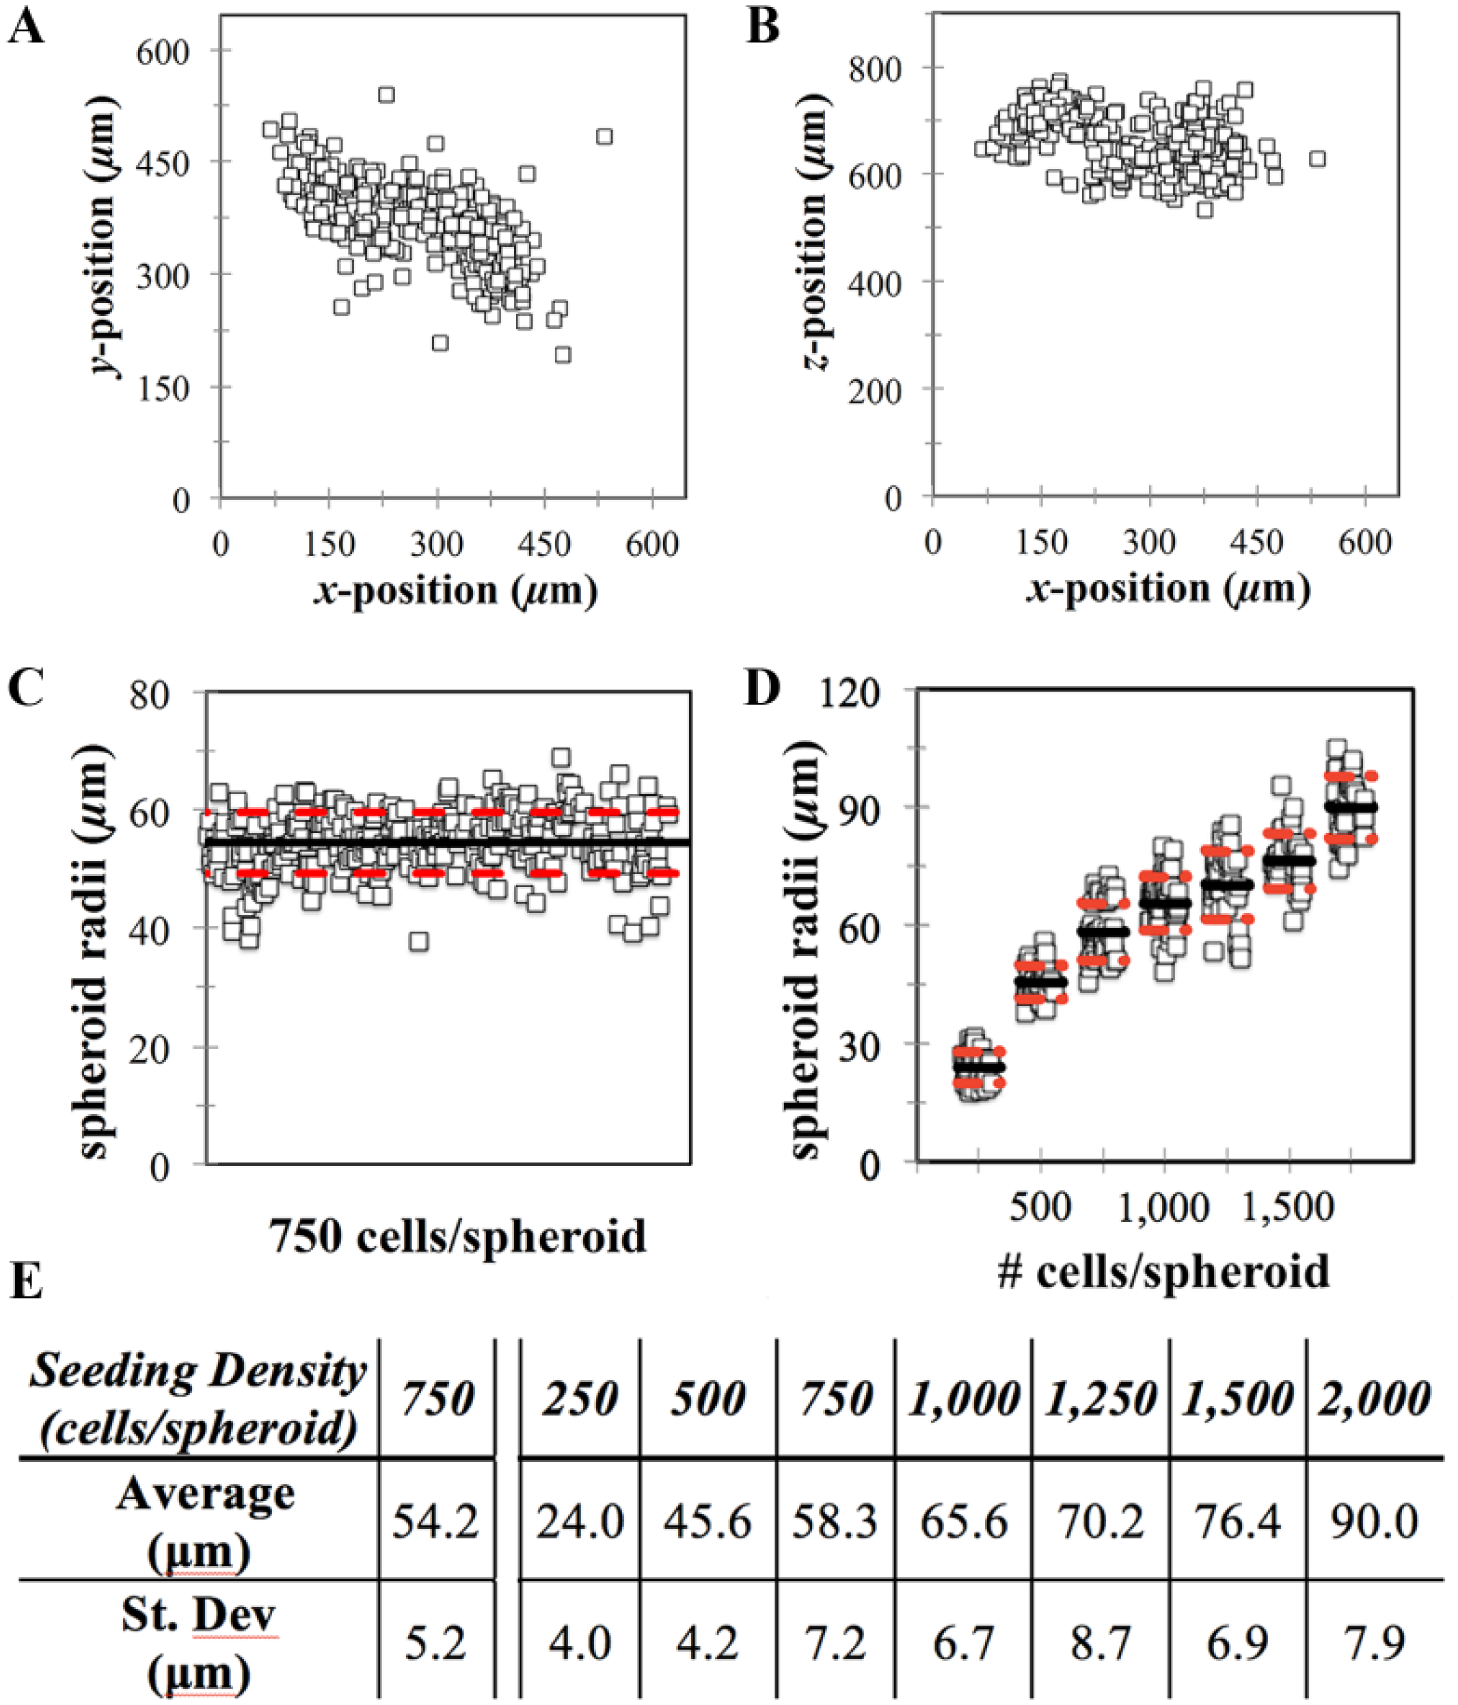
Spheroids of consistent size are formed within specific x, y, z locations. Molds were used to produce agarose hydrogels directly in the wells of a 96-well plate. Monodispersed cells were seeded into the hydrogels at either (i) a single seeding density for the entire plate (
Cumulative Fluorescent Loss Increases as Function of Spheroid Radii
To assess the loss of fluorescence associated with live-cell confocal imaging of spheroids, we imaged spheroids over a range of sizes and tested four different fluorescent dyes. To form uniformly labeled spheroids, KGN cell monolayers were first labeled with four different fluorescent dyes: CTV, CTG, CTR, and CTDR. After labeling, monolayers were trypsinized, counted, and seeded at various cell densities to form spheroids with diameters ranging from 50 to 200 µm. After self-assembling for 24 h, confocal slices for each spheroid were obtained (20× water objective). Representative images for 50, 100, and 150 µm diameter spheroids were reconstructed as orthogonal contrasts for the four dyes tested ( Fig. 3 , Suppl. Figs. 2–4 ). Since the cells were labeled as a monolayer prior to spheroid formation, hypothetically every cell in the spheroid should be evenly stained. Assuming that there was no loss in fluorescence due to imaging limitations, the resulting spheroids should possess a homogenous signal throughout the entire spheroid. Qualitatively, for the four dyes tested, the signal was relatively homogenous throughout small spheroids (50 µm diameter). However, as radii increased, the signal decreased for confocal slices located deeper in the spheroid ( Fig. 3 , Suppl. Figs. 2–4 ).
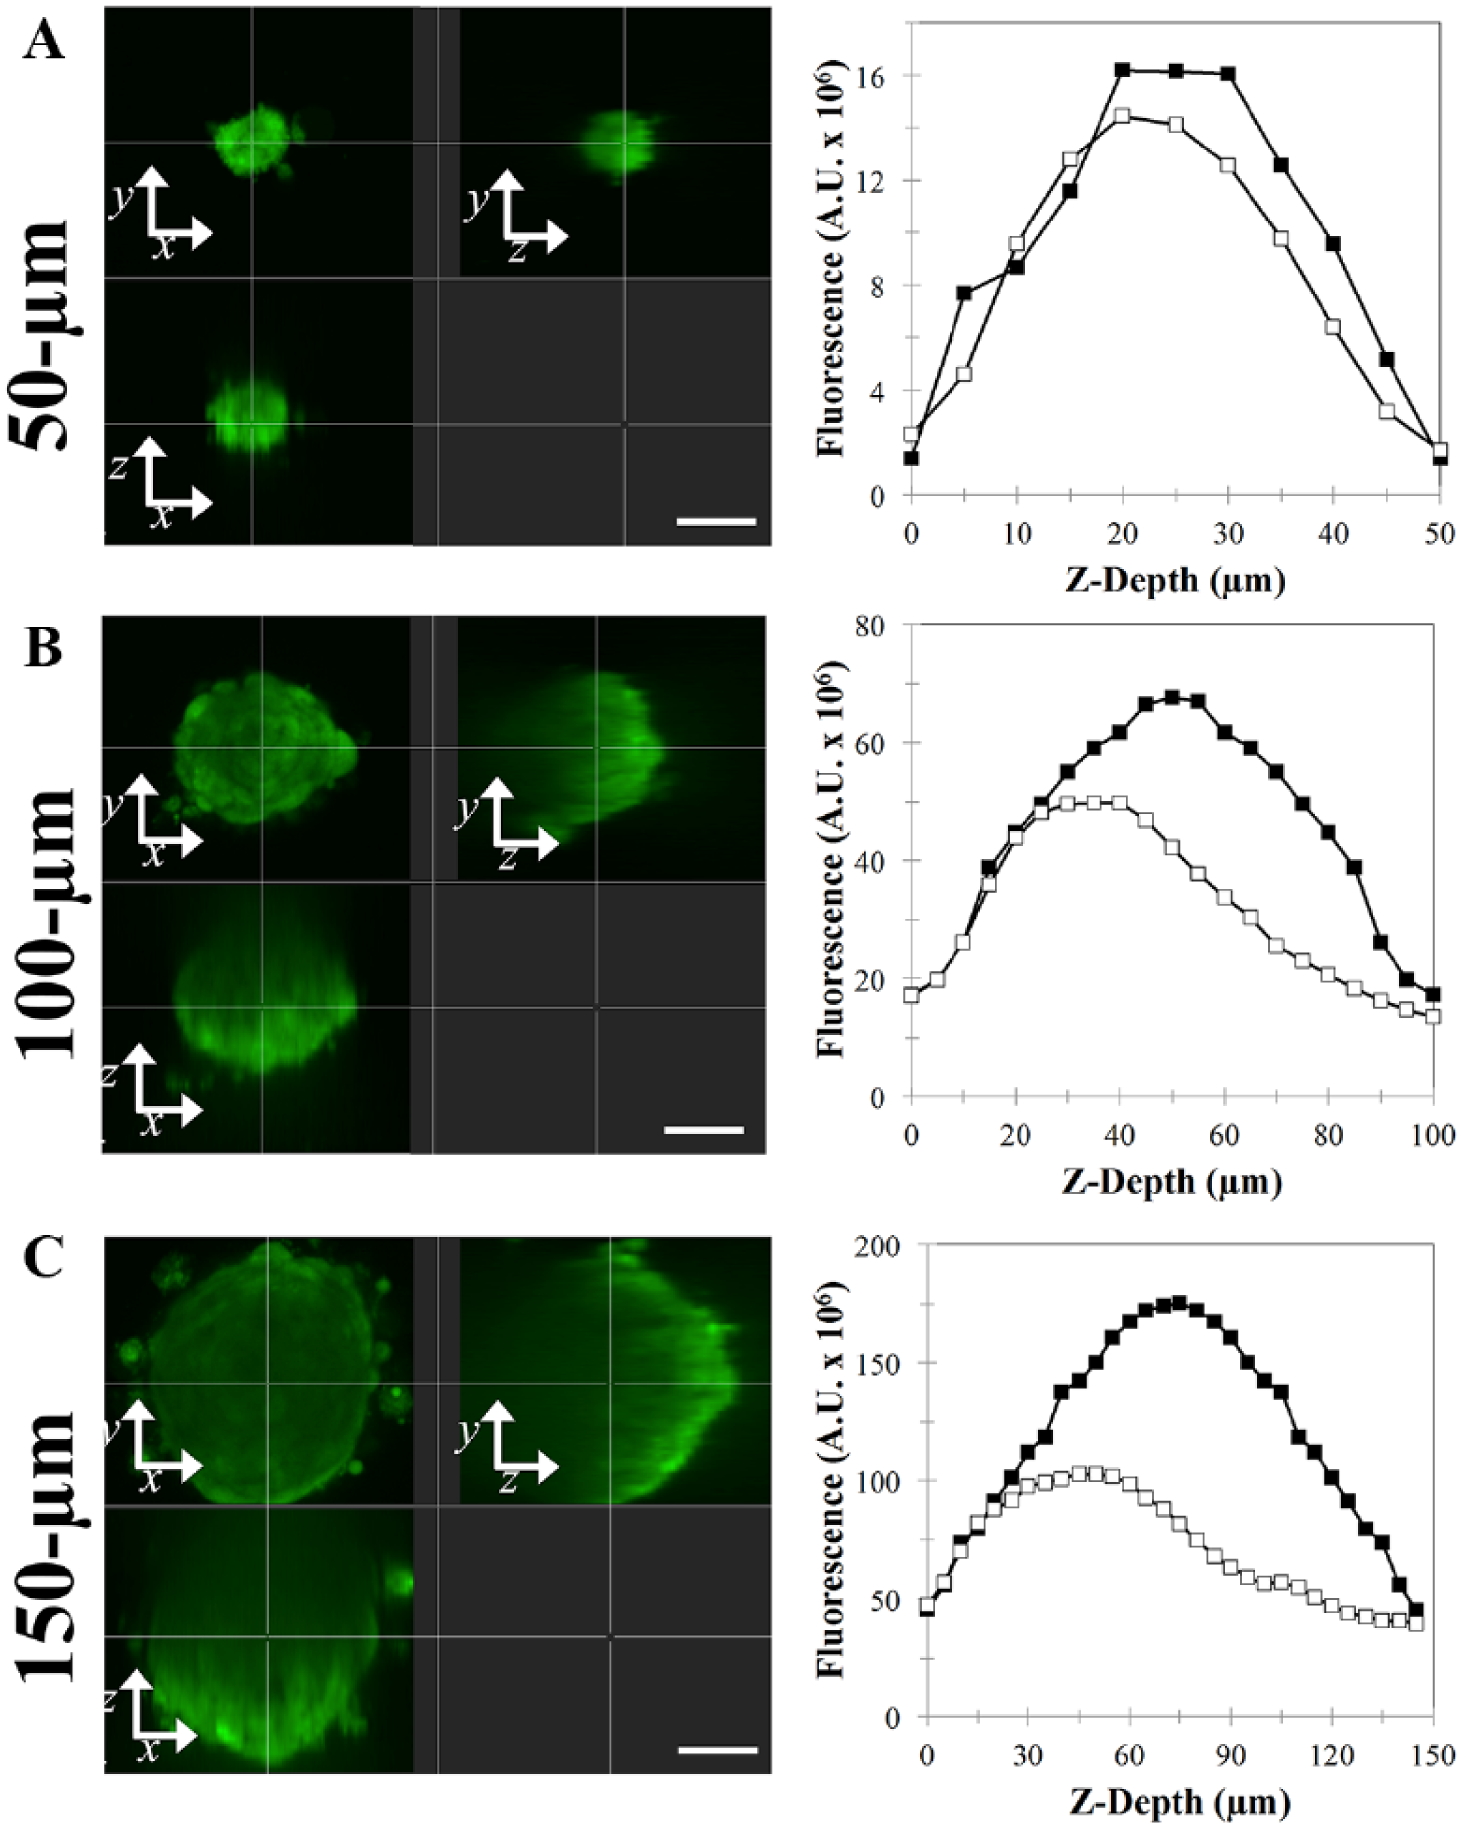
Loss of fluorescent signal occurs deeper within the z depth for spheroids. KGN cell monolayers were labeled with CTG, trypsinized, counted, and seeded at varying cell numbers to form spheroids with diameters ranging from 50 to 200 µm. Confocal images were acquired, and orthogonal contrast images of representative spheroids of 50 µm (
To understand this loss of fluorescence with increasing depth into larger spheroids, we quantified the total fluorescent signal loss for each spheroid and compared populations of spheroids of varying sizes. The actual and hypothetical fluorescence at every confocal slice were measured and plotted as a function of its z depth ( Fig. 3 , Suppl. Figs. 2–4 ). Assuming no loss, the plot of actual fluorescence should match the plot of hypothetical fluorescence. For small spheroids (diameter of 50 µm), the plots for measured and hypothetical fluorescence were overlapping, indicating minimal loss for each of the following dyes: CTR, CTG, CTV, and CTDR ( Fig. 3A , Suppl. Figs. 2A, 3A, and 4A ). For medium and larger-sized spheroids (diameters of 100 and 150 µm), the plots for measured and hypothetical fluorescence overlapped only through the lower portion of the z depth, beyond which the plot of measured fluorescence falls short of the plot of hypothetical fluorescence ( Fig. 3B , C , Suppl. Figs. 2B,C, 3B,C, and 4B,C ). Since all cells were homogenously labeled, the extent to which the plot of the measured fluorescence falls short of the plot of the hypothetical fluorescence is the loss due to imaging thick tissues.
To compare the effect of spheroid size on imaging, we quantified the difference between the actual and hypothetical fluorescence for all dyes. The AUC was calculated for the actual and hypothetical fluorescence as a function of z depth, and the percent loss was computed ( Suppl. Fig. 1C–E ). The percent loss was binned as a function of radii and then plotted for each of the dyes tested ( Fig. 4 ). The percent loss of fluorescence increased as the spheroid radii increased ( Fig. 4 ).
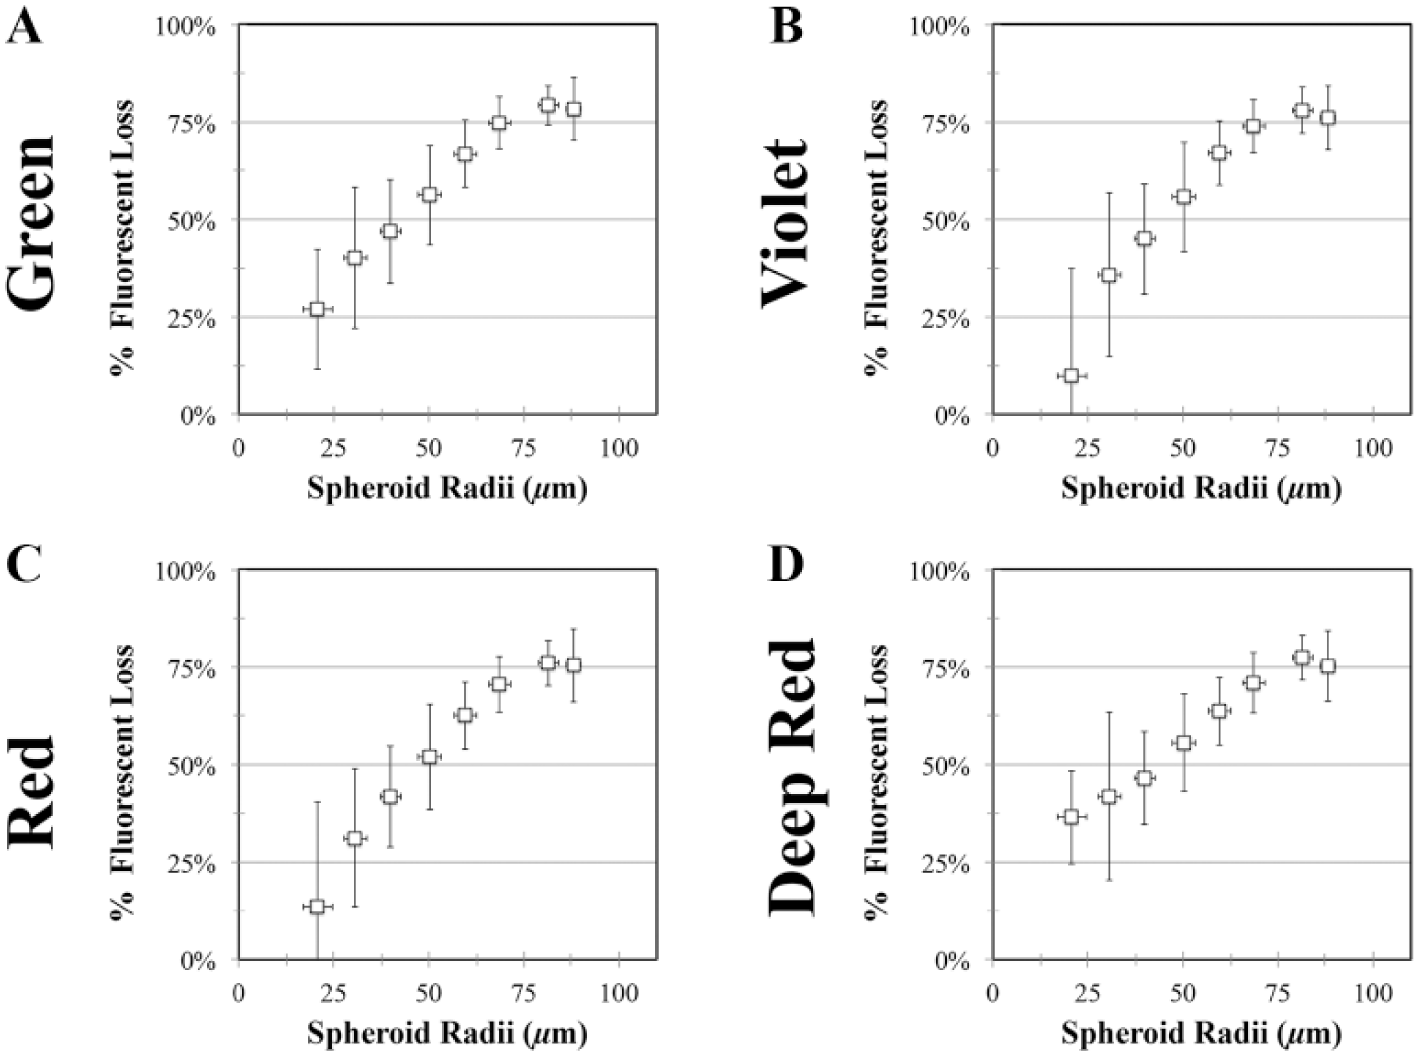
Cumulative loss of total spheroid fluorescence increases as a function of spheroid radii. KGN cell monolayers were labeled with four fluorescent dyes: CTR, CTV, CTG, and CTDR. After staining, monolayers were trypsinized, counted, and seeded at varying cell numbers to form spheroids of a range of sizes. Confocal images were analyzed to determine the actual fluorescence per confocal slice and hypothetical fluorescence per slice, and both were plotted as a function of z depth. By calculating the AUCs for both actual and hypothetical fluorescence, the cumulative fluorescent loss of each spheroid was determined. Spheroids were binned into 10 µm bins based on radii. The average percent loss of fluorescent signal was calculated for each range of radii and plotted as a function of radii for each of following fluorescent dyes: CTG (
Within Spheroids, Loss of the Fluorescent Signal Is Dependent on the Positional (x, y, z) Location
To assess where signal loss was occurring throughout the spheroid, we imaged spheroids over a range of radii and tested different fluorescent dyes. KGN cell monolayers were homogenously labeled with four different dyes (CTG, CTV, CTR, and CTDR), trypsinized, and seeded at varying cell densities to form spheroids with diameters ranging from 50 to 200 µm. After 24 h, z stacks were acquired, and the center point of each spheroid was identified. Representative confocal slices (x, y) were assessed at 30° north of, 30° south of, 60° south of, and at the equator of a spheroid (~100 µm diameter) stained with CTG ( Suppl. Fig. 5B ). For confocal slices south of the spheroid equator (30° and 60° south), the fluorescent signal was relatively homogenous and bright across the entire slice ( Suppl. Fig. 5B ). However, deeper into the z depth (equator and 30° north), the fluorescent signal began to decrease preferentially in the center of each slice, whereas the outer edge of the spheroid retained a brighter signal ( Suppl. Fig. 5B ). To quantify this pattern, the average fluorescence across the cross-sectional (x, y) radii was computed by averaging individual fluorescent values from a series of concentric rings ( Suppl. Fig. 5C ). The average fluorescent signal was plotted as a function of its cross-sectional radii for the confocal slices 30° and 60° north of, 30° and 60°south of, and at the equator for spheroids of variable radii ( Suppl. Fig. 5C–E ). For smaller spheroids (~50 µm diameter), the average fluorescent intensity across the cross-sectional radii was relatively constant across the confocal slice up until the equator, above which there was a decline in signal ( Suppl. Fig. 5C ). For larger spheroids (~150 µm diameter), the fluorescent signal was relatively homogenous throughout the confocal slice corresponding to 30° south; however, the fluorescence of the confocal slices deeper into the spheroid had a measurable decrease in the center compared with the spheroid edge ( Suppl. Fig. 5E ). Similar trends were observed for all dyes tested (data not shown). This pattern of fluorescent signal yields a bowl-like appearance in 3D renderings, with the brightest signal occurring along the bottom hemispheric edge of the spheroid ( Fig. 5B ).
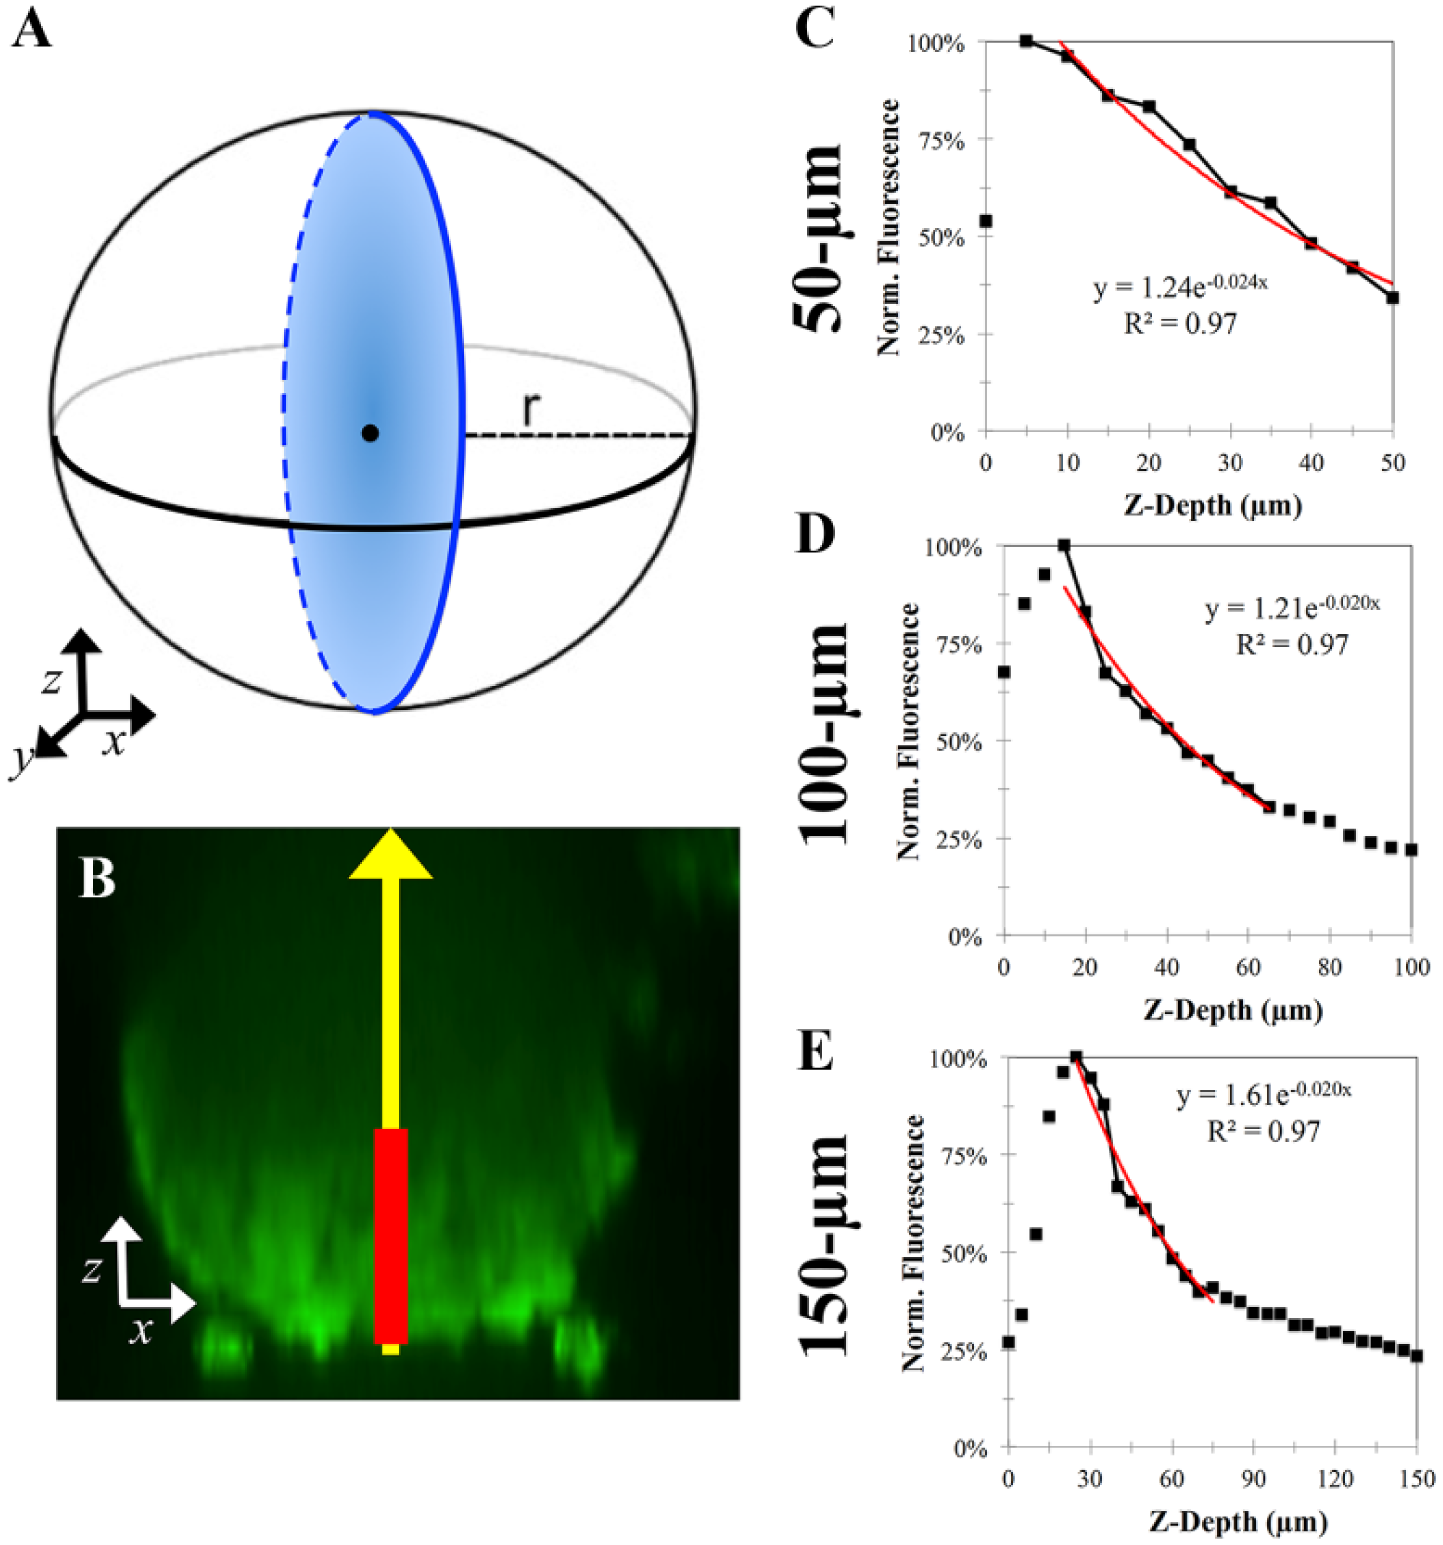
Fluorescent signal loss throughout the z depth of spheroids exhibits a reproducible, exponential decay function. KGN cell monolayers were labeled with CTG, trypsinized, counted, and seeded at varying cell numbers to form spheroids with diameters ranging from 50 to 200 µm. After 24 h, confocal images were acquired and cross-sectional images (x, z) were reconstructed (
To compare the effect of spheroid size on this fluorescent loss throughout a spheroid, we first quantified the distance into live spheroids that could be imaged along the central z axis (
Fig. 5B
). For each spheroid and dye, the average intensity was first normalized by the maximum fluorescent signal along the central axis. The normalized signal was plotted as a function of its z depth, and the best-fit exponential decay curve was calculated from 50 µm past the peak signal (
Fig. 5C–E
). Fluorescent dyes exhibited different staining patterns. For example, CTG staining was a homogenous uniform signal throughout the spheroid, whereas CTR staining was a more randomized punctate signal (
Fig. 3
To compare the effect of size on depth of imaging, we compared the slopes of the exponential decay functions from spheroids of variable radii. Slope was binned as a function of radii, and then plotted for each dye ( Fig. 6 ). For the four dyes tested, the slope of the exponential decay function increased as radii increased, indicating that smaller spheroids possessed a steeper decline in signal throughout the z depth than larger spheroids ( Fig. 6 ).
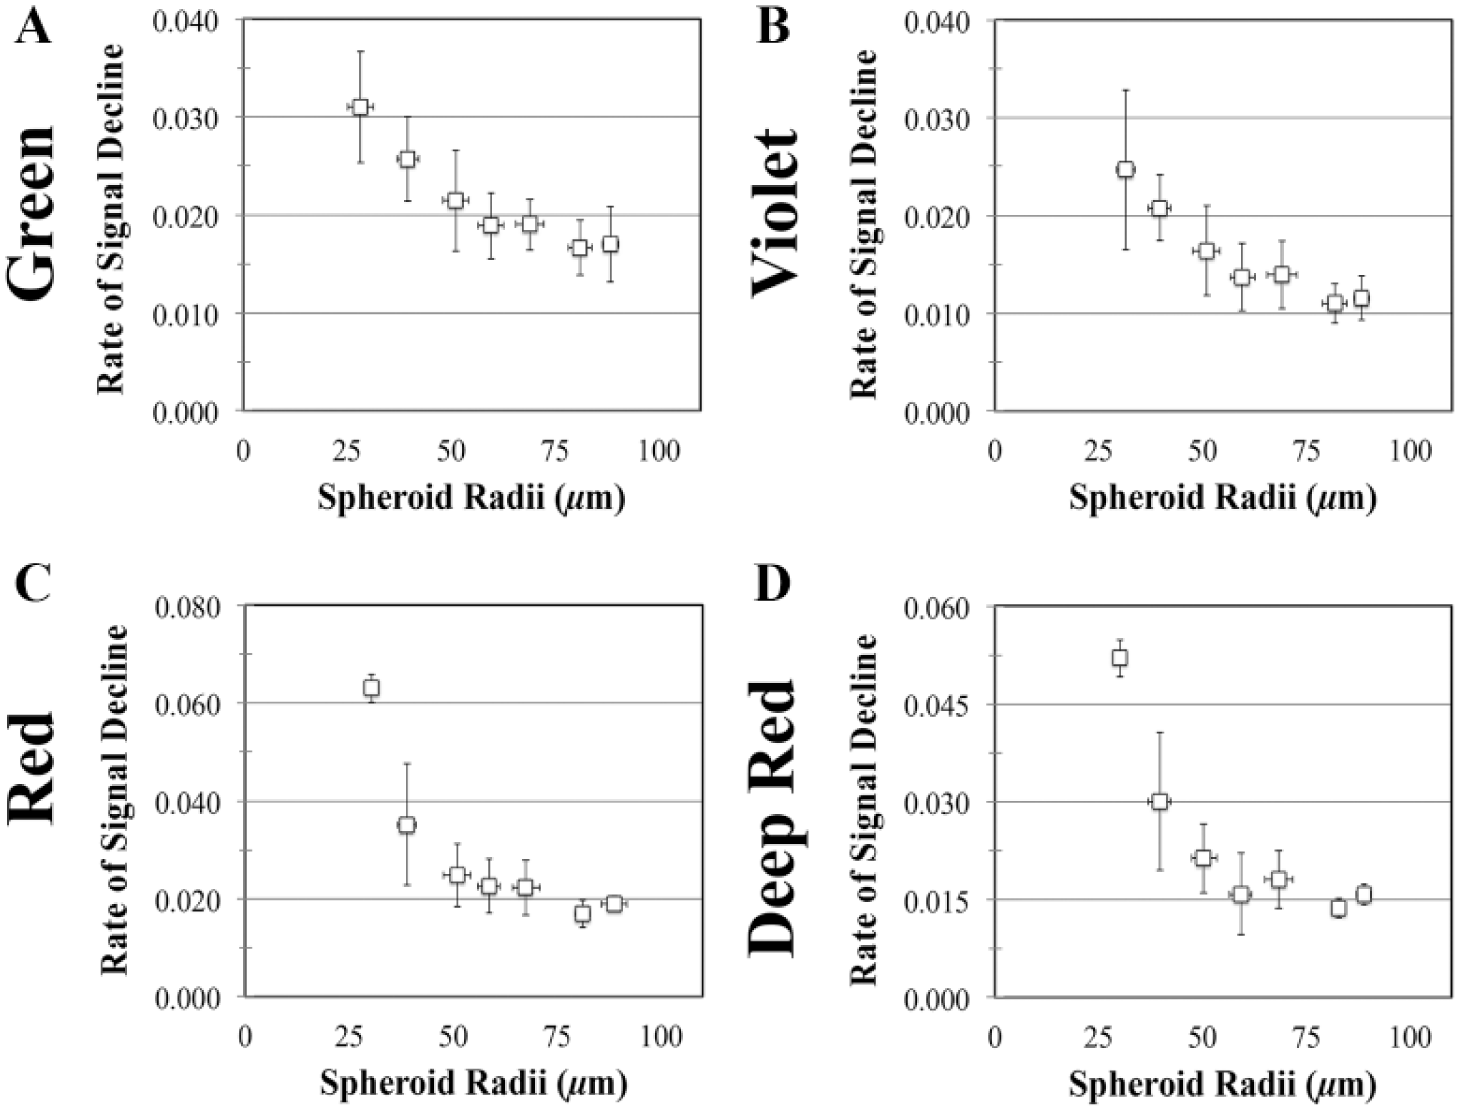
Cumulative loss of total spheroid fluorescence increases as a function of spheroid size. KGN cell monolayers were labeled with four fluorescent dyes: CTR, CTV, CTG, and CTDR. After staining, monolayers were trypsinized, counted, and seeded at varying cell numbers to form spheroids of a range of sizes. Confocal images were analyzed to determine the average fluorescent signal along the central z axis, which was then normalized to peak fluorescence and plotted as a function of z depth for every spheroid. The best-fit exponential decay was calculated from 50 µm past the peak signal. To evaluate the effect of spheroid size on the rate of loss, the slopes of the exponential decay functions were compared. Spheroids were binned into 10 µm bins based on radii. The average slope was calculated for each range of radii and plotted as a function of radii for each of following fluorescent dyes: CTG (
Ratio Imaging Corrects for Loss of Fluorescence throughout the z Depth
To determine if ratio imaging could be used to correct for loss throughout the z depth, KGN cell monolayers were uniformly labeled with both CTR and CTDR, trypsinized, and seeded at varying cell densities to form spheroids of variable radii. After 24 h, confocal z stacks were acquired and fluorescence along the central z axis was measured ( Suppl. Fig. 5B ). Fluorescence of both CTG and CTDR were plotted as a function of z depth ( Fig. 7A , B ). Since the spheroid was uniformly labeled with both dyes, fluorescence should hypothetically be homogenous throughout the z depth; however, the signal of both dyes declined as a function of z depth ( Fig. 7A , B ). To normalize the attenuation, CTG fluorescence was divided by CTDR fluorescence at each confocal slice and vice versa. This normalized signal was then plotted as a function of z depth ( Fig. 7C , D ). Once normalized, both dyes exhibit a more uniform signal throughout the z depth ( Fig. 7C , D ).
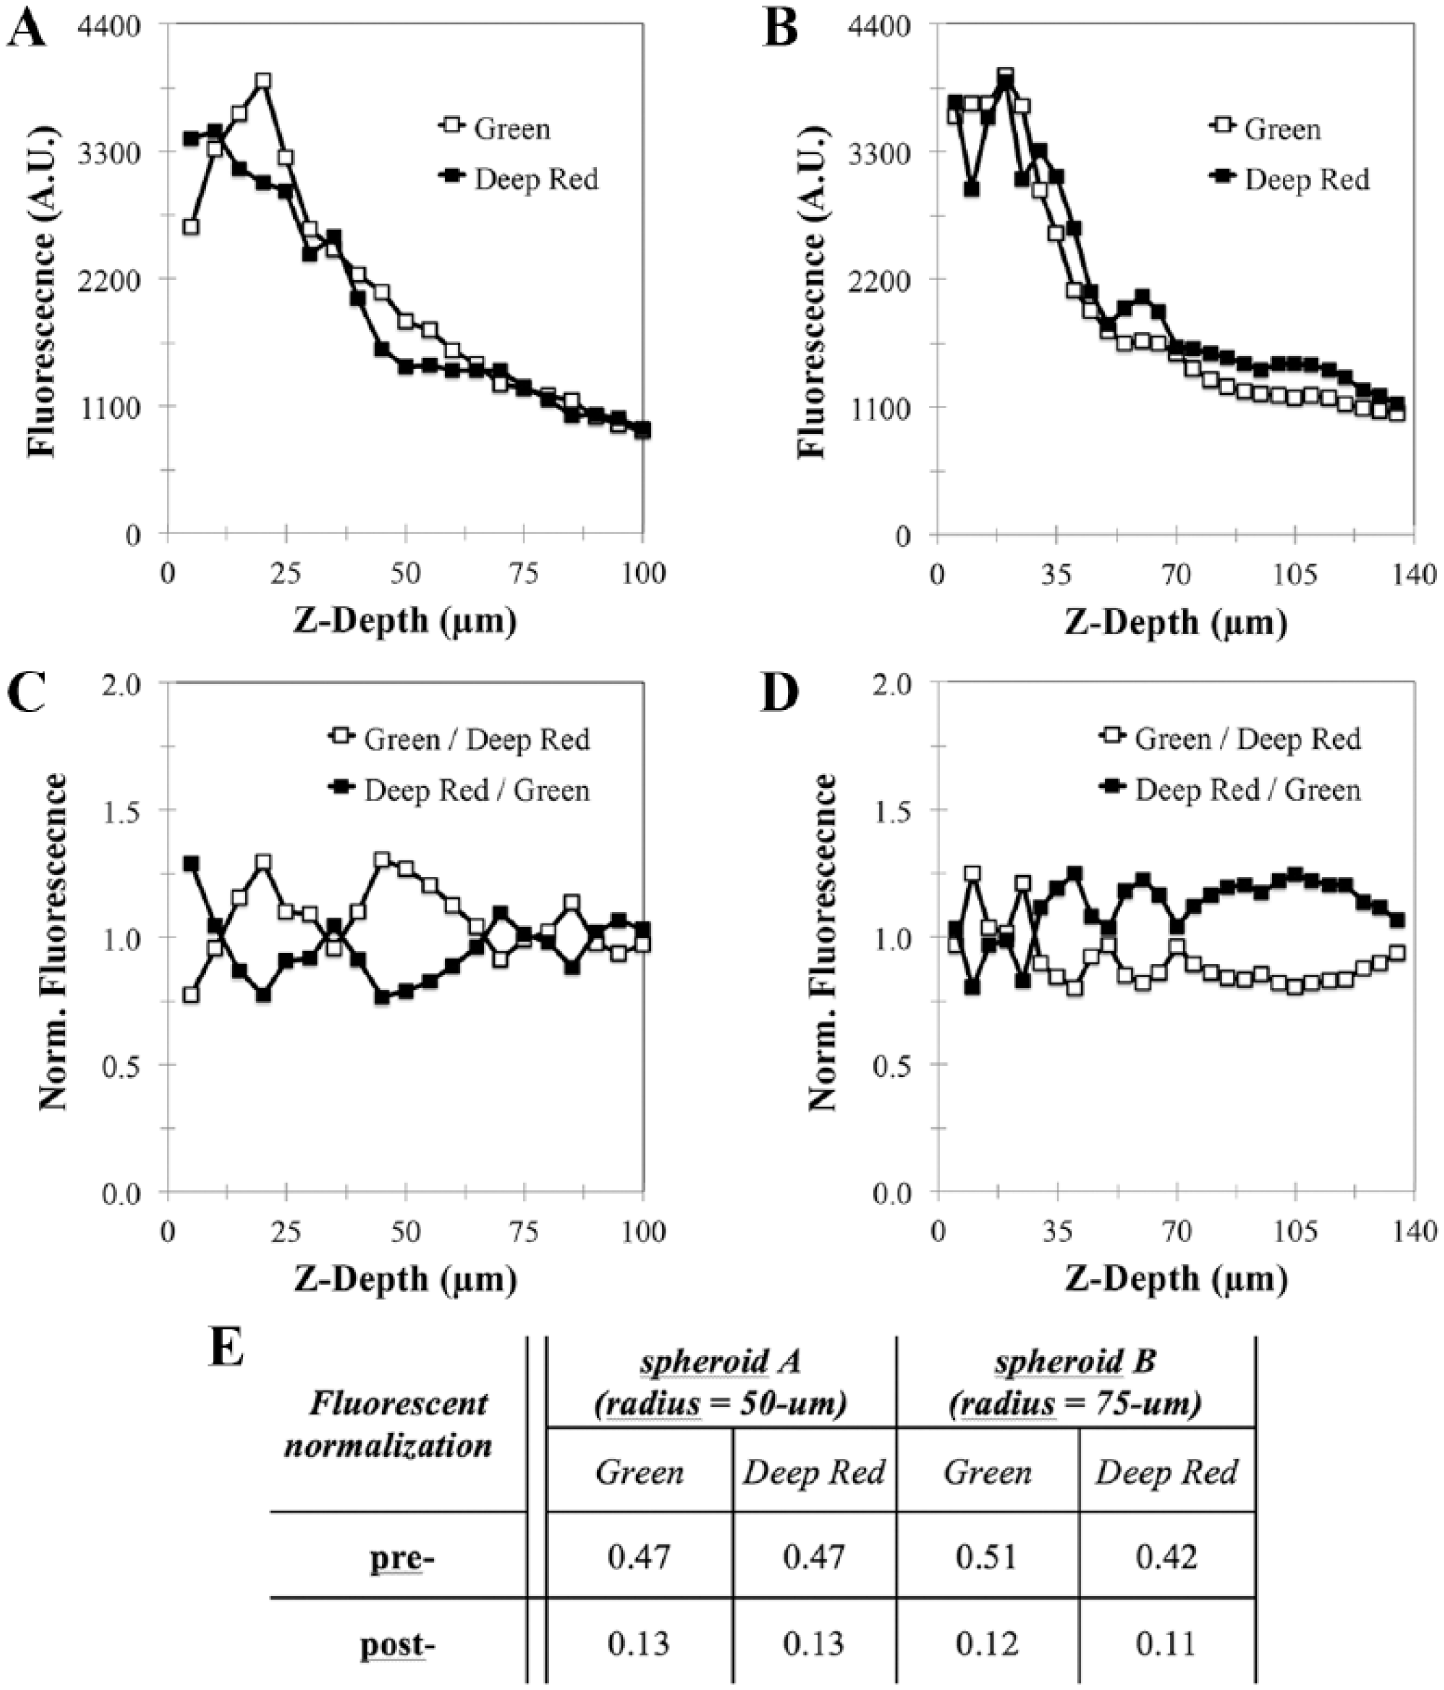
Ratio imaging reduces variation throughout the z depth. KGN cell monolayers were labeled with both CTG and CTDR, trypsinized, counted, and seeded at varying numbers to form spheroids. After 24 h, confocal images were acquired and analyzed to measure the fluorescent signal along the central z axis. Data from two representative spheroids are shown (
To confirm quantitatively that ratio imaging yielded a more uniform signal throughout, we performed a CV analysis, according to the following equation:
Discussion
Needed for drug discovery and toxicity testing are new, more predictive high-throughput in vitro assays that more accurately mimic the biological complexity of human organs and tissues.1,2,5,22 Multicellular spheroids are emerging as a possible solution, but challenges still remain with respect to workflow, spheroid formation, the long-term stability of spheroids, and the high-magnification imaging of spheroids necessary to acquire the quantitative high-content information that spheroids can provide.1,2,5,10,23 In addition to improved in vivo–like differentiation and function, much of this high-content information is due to the fact that, like native tissues, spheroids have multiple cell layers that create gradients (e.g., oxygen, nutrients, and metabolites) and barriers (e.g., drug transport and signaling).4,6–8,24 Biological activities in these microenvironments can be probed using a wide variety of fluorescent dyes, along with confocal microscopy. However, in order to assess these activities as a function of radial position within a spheroid, it is critical that the images are high magnification to get accurate quantitative depictions.
In this article, we aimed to increase assay throughput by designing and evaluating a mold system that formed spheroids directly within a 96-well plate, and then imaging the plate using a 20× water objective of a high-throughput confocal microscope. We acquired z stacks of living spheroids that were uniformly labeled with four different fluorescent dyes and quantified the loss of fluorescent signal as we imaged deeper into each spheroid. Unlike planar specimens where signal loss is a relatively simple function of z depth, the curved nature of spheroids creates a more complex pattern. In 3D renderings, spheroids appear as bowl-like with a bright signal around the edges and a dampened signal in the interior. To better understand fluorescence signal distribution prior to developing biologically driven assays, we quantified the fluorescence of four dyes as a function of the overall signal from the entire spheroid, the rate of decrease throughout the z depth, and the influence of the spheroid size on these stacks of images. Furthermore, we used ratio imaging to demonstrate that loss throughout the z depth can be compensated.
Prior to assessing fluorescence signal, we first designed and evaluated the mold’s ability to form spheroids of reproducible size at precise locations. We molded four microwells into agarose in each well of a 96-well plate, thus forming four replicate spheroids per well that were placed at precise x, y, z locations within each well. The x, y locations corresponded to the centers of the four boxes in the imaging grid used by the 20× water objective. These x, y locations improve workflow by obviating the need to prescan a plate to find spheroid locations and/or having to stitch together adjacent images of spheroids that span grid lines. Placement of spheroids in a precise z location also improves workflow since spheroids can be found at a predictable distance from the plane of initial focus. This fixed position reduces the number of confocal z slices needed to reliably image the entire spheroid. Moreover, the autofocus function can be used with our design because, unlike the round-bottom low-attachment plates typically used to form spheroids in a high-throughput format, our mold is compatible with flat-bottom well plates. Although agarose microwells are curved to aid in the self-assembly of spheroids, agarose has a refractive index that is nearly equal to that of water (1.334 vs 1.3329 of water), and thus should not scatter light more significantly than a water interface would. 25 Lastly, the agarose microwells have been shown to provide a stable cell culture platform for the long term, up to a 4-week culture of spheroids of certain cell types.14,15,26
We controlled spheroid size by altering the number of cells seeded into each well. When the same number of cells was seeded across an entire plate, the variation of spheroid radii was approximately 10% of its mean. Spheroid size could be controlled by altering the input number of cells, with higher seeding densities yielding larger spheroids. Over the range of sizes tested, the variation of spheroid radii was also approximately 10% of the mean for all sizes. A number of factors probably contribute to variation in spheroid radii, including pipetting errors and variation of the diameter of the input cells (KGN cells 12 ± 1 µm). Control over spheroid size and uniformity are important because the biology of spheroids is often linked to their size. For example, spheroids with diameters significantly greater than 200 µm often have necrotic cores with dead and dying cells due to the limitations of diffusion. For some cancer models, large spheroids with necrotic cores are thought to mimic the complexity of tumors in vivo.12,22,27 But for other assays, such as those that use primary cells or that wish to replicate normal physiology, smaller spheroids are preferable with their high viability and lack of confounding influences associated with the apoptotic/necrotic core.
Furthermore, the ability to perform confocal microscopy of an entire spheroid is dependent on their size. For small spheroids with diameters in the range of 50 µm, we found there was minimal loss of fluorescence throughout the z stack. The entire spheroid could be imaged, and for each slice, the increase in cross-sectional area of the spheroid correlated with an increase in the total fluorescence. This was true for all four dyes tested. Depending on the assay, small spheroids may be sufficient. Our spheroids with 50 µm diameters contain approximately two or three cell layers from the surface of spheroid to its edge. This number would vary depending on a number of factors, including the oblate shape of the spheroid, the size of the cell type used, and if the spheroid undergoes morphological changes, such as the formation of luminal structures. 15 For assays using small spheroids that want to quantitate activity as a function of radius, an entire z stack could be obtained or a single confocal slice at about the equator may be sufficient for analysis.
Some assays may require larger spheroids with increased cell layers; however, we found that for spheroids with diameters above 50 µm, there was an associated loss of signal. For all dyes tested, the signal loss increased as spheroid radii increased. Most importantly, this loss was not uniform throughout the spheroid. Unlike a planar specimen that will undergo uniform loss across each slice of a z stack, in a spheroid, the loss of fluorescence was far greater in the interior versus its outer edges due to its curvature. Additionally, confocal slices beyond a certain z depth into a spheroid are not accurate quantitative representations of fluorescence as a function of radial position within that slice, since the signal from interior portions would not differ from background noise. Furthermore, we hypothesized that regardless of size, the rate of loss throughout the central z axis would exhibit an exponential decay function with a similar rate of loss for the first 50 µm. 28 However, even the rate of fluorescent decrease throughout the z depth was dependent on spheroid size, with smaller spheroids possessing a steeper rate than larger ones. This might imply that smaller spheroids scatter light more than large spheroids, despite possessing the same starting cell types and dyes. Therefore, to avoid differences between large and small spheroids, restricting spheroid size to a set range of radii would be beneficial when developing quantitative fluorescent assays.
This nonuniform fluorescent signal and its variable rate of loss complicates the ability to compensate for signal loss throughout a z stack. To address the shortcomings associated with confocal imaging of large spheroids, there are various methodologies and approaches. For example, the depth of imaging in cleared samples is increased.19–22 Although we have not tested it, we suspect that, like our live-cell experiments, there is a reliable depth into cleared samples from which accurate radial information can be obtained from a given slice. However, utilizing this technique limits the type of assays that can be performed to fixed, endpoint assays, since clearing is not compatible with live-cell imaging. An alternative approach to acquiring live-cell images deep within large spheroids could be the use of two-photon microscopy; however, we are not aware of a two-photon microscope designed for high-throughput automated imaging. Alternatively, one could limit spheroid size, 3D portions, or single confocal slices of spheroids to analyze only a set size and z depth, where reliable quantitative information can be obtained. As shown by the data with small spheroids, this distance may be about 50 µm. However, depending on the experimental assay, data from small spheroids or portions of spheroids may not be an accurate quantitative depiction and require the use of larger spheroids. Additionally, to compensate for signal loss and reduce variability throughout the z depth, one could utilize ratio imaging; however, ratio imaging does not overcome the physical limitations of confocal microscopy, and thus is still only effective for a certain range of sizes.
Overall, the use spheroids for high-throughput screening affords numerous advantages, including in vivo–like differentiation, function and architecture, and drug sensitivities comparable to those of tumors.6–8,27,29 Moreover, spheroids have been formed from immortal cell lines as well as primary cells.14,15,26 Additionally, since they are self-assembled from monodispersed cells, spheroids have been formed from mixtures of two or more cell types to make designer spheroids that can mimic even more complex tissue units. 30 Applications of spheroids, some of which have been adapted to high-throughput formats, include toxicity testing, drug transport, and drug discovery.3,5,23,24 Spheroids also create complex microenvironments that include gradients, barriers, polarity, cell–cell signaling, and significant changes to cell physiology, morphology, and differentiation.2,4,5 These changes to the microenvironment will vary along the 3D radius of a spheroid. To accurately quantify these biological changes as a function of radii, the quantitative limitations of confocal imaging of spheroids must be understood. In this article, we addressed some of the challenges of quantifying the bowl-like 3D image of spheroids. These studies set the stage for designing quantitative spheroid-based assays for automated high-throughput screening.
Footnotes
Acknowledgements
We thank Microtissues, Inc. for the mold used to make the 96-well plates.
Supplementary material is available online with this article.
Declaration of Conflicting Interests
The authors declared the following potential conflicts of interest with respect to the research, authorship, and/or publication of this article: J.R.M has an equity interest in Microtissues, Inc. This relationship has been reviewed and managed by Brown University in accordance with its conflict of interest policies.
Funding
The authors disclosed receipt of the following financial support for the research, authorship, and/or publication of this article: This work was funded in part by seed funds from Unilever and the generous support of Donna McGraw Weiss ’89 and Jason Weiss. Also, this work was funded under the U.S. Department of Education, GAANN Award P200A150037, the National Science Foundation Award OIA1655221, the National Institute of Environmental Health Sciences Award 1U01ES028184.
References
Supplementary Material
Please find the following supplemental material available below.
For Open Access articles published under a Creative Commons License, all supplemental material carries the same license as the article it is associated with.
For non-Open Access articles published, all supplemental material carries a non-exclusive license, and permission requests for re-use of supplemental material or any part of supplemental material shall be sent directly to the copyright owner as specified in the copyright notice associated with the article.