
Abstract
The wound healing assay is widely used for the quantitative analysis of highly regulated cellular events. In this essay, a wound is voluntarily produced on a confluent cell monolayer, and then the rate of wound reduction (WR) is characterized by processing images of the same regions of interest (ROIs) recorded at different time intervals. In this method, sharp-image ROI recovery is indispensable to compensate for displacements of the cell cultures due either to the exploration of multiple sites of the same culture or to transfers from the microscope stage to a cell incubator. ROI recovery is usually done manually and, despite a low-magnification microscope objective is generally used (10x), repositioning imperfections constitute a major source of errors detrimental to the WR measurement accuracy. We address this ROI recovery issue by using pseudoperiodic patterns fixed onto the cell culture dishes, allowing the easy localization of ROIs and the accurate quantification of positioning errors. The method is applied to a tumor-derived cell line, and the WR rates are measured by means of two different image processing software. Sharp ROI recovery based on the proposed method is found to improve significantly the accuracy of the WR measurement and the positioning under the microscope.
Introduction
Migration and proliferation are highly regulated cellular events that play essential roles in many normal physiological processes, such as angiogenesis, immune response, embryogenesis, and repairing of intestinal mucosal damage.1,2 Also, those events are present during pathological processes, such as cancer proliferation. 2 Understanding the molecular basis of these cellular events is of great significance.3–5
In vitro methods for studying cellular migration and proliferation include the wound healing assay; methods based on chemotaxis, such as the use of carriers with chemoattractants; videomicroscopy; and more complex systems, such as transwell cell migration and invasion assays. 3 The main drawbacks of these methods are the lack of standardization and, in the case of the wound healing assay, the lack of a tool that provides accurate position data suitable for precise image analysis and registration. 6
For its simplicity and low cost, the wound healing assay is the most widely used method. This assay is simple and generally involves the growth of a confluent cell monolayer where a small area of the culture is interrupted by a mechanical injury. As a result, a group of cells is destroyed or displaced. The free-cell area or “wound” is inspected under an optical microscope. Images of the same region of interest (ROI) of the cell culture are acquired at different time intervals until the cells cover completely the wound area. This healing may take several hours or even days, depending on the extent of the wound, cell type, and conditions of the cell culture.1,2,7 The images acquired at the same ROI are processed in order to calculate the percentage of wound reduction or area (%WR or %WA) and evaluate the migration rate of the cells. 7 The wound healing assay requires tools for measuring the %WR in an objective way. This implies (1) recovering in a precise way the same ROI across all observations under the microscope for further precise image registration,8,9 (2) suitable software routines to compare images and quantify changes in the size of cell-covered areas.
For ROI recovery, different methodologies and tools have been developed over the years to contribute to enhance this assay. Some of those methods are (1) alphanumeric grids that are adapted to divide the Pétri dish surface into labeled small-sized regions, and (2) chambers with treated plastic inserts in order to generate small observation areas. 10 Another method, which is widely used, is the one described by Liang et al. 2 In this method, marks on the cell culture dishes are created in a manual way in order to recover the same ROI at each visualization. All the mentioned methods for ROI recovery only provide a coarse positioning and are user dependent in some aspects, like experience and skills. Therefore, those methods do not allow highly accurate image registration, as well as cell migration and proliferation evaluation (which is measured by the %WR).
This article addresses the problem of accurate ROI recovery for accurate and objective cell migration or proliferation evaluation, by means of an accurate ROI registration technique called position-referenced microscopy (PRM). The technique was developed for high-magnification events, but in this work, it has been adapted for low-magnification events, such as the wound healing assay. As presented in PRM for ROI Recovery in Wound Healing Assay, PRM is based on position reference patterns (PRPs) that were integrated into a 12-well cell culture plate. They allow the accurate retrieval of several ROIs of a wound healing assay. The method is compared with the manual technique proposed by Liang et al. 2 A recall of this technique is presented in Manual Method for ROI Recovery in Wound Healing Assay. The images acquired by both methodologies of ROI recovery were segmented twice: once with a commonly used commercial software and once with the segmentation method developed by Cardona et al. 11 (Bio-EdIP). An explanation of the way the software evaluates the performance of the wound healing is presented in %WR Measurement in Wound Healing Assay. The comparison of the obtained results demonstrates significant improvements in both ROI recovery and %WR when using the proposed ROI recovery method. Those results are presented in Results section.
Materials and Methods
Cell Culture and Wound Healing
For the experiments presented in this article, a human hepatoma cell line, SkHep1, was used for the in vitro wound healing assay. SkHep1 cells were grown in Dulbecco’s modified Eagle medium (DMEM)/F12 (1:1) medium with 10% heat-inactivated fetal bovine serum and 1× penicillin-streptomycin solution, at 37 °C in a humidified atmosphere with 5% CO2.
Before acquisitions, cells were harvested and quantified in a Neubauer chamber. Then, cells were seeded into 12-well plates at a final density of 7 × 10⁴ viable cells/well. After 24 h, cell monolayers were scraped, with a 100 or 1000 μL pipette tip, and washed twice to remove cellular debris.2,9
Manual Method for ROI Recovery in Wound Healing Assay
ROI Selection
In order to get reference results from state-of-the-art techniques, we implemented a manual method as proposed by Liang et al. 2 In this method, once the confluent cell culture monolayer is obtained and scraped, the ROI of the cell culture is selected under the microscope ( Fig. 1 ). Then, a first image of the wound area is acquired and a mark is created near the ROI. This mark is used as a reference point for further ROI retrieval. The reference points are made by etching the culture dish with a razor blade on the outer bottom of the dish or with an ultra-fine-tip marker.
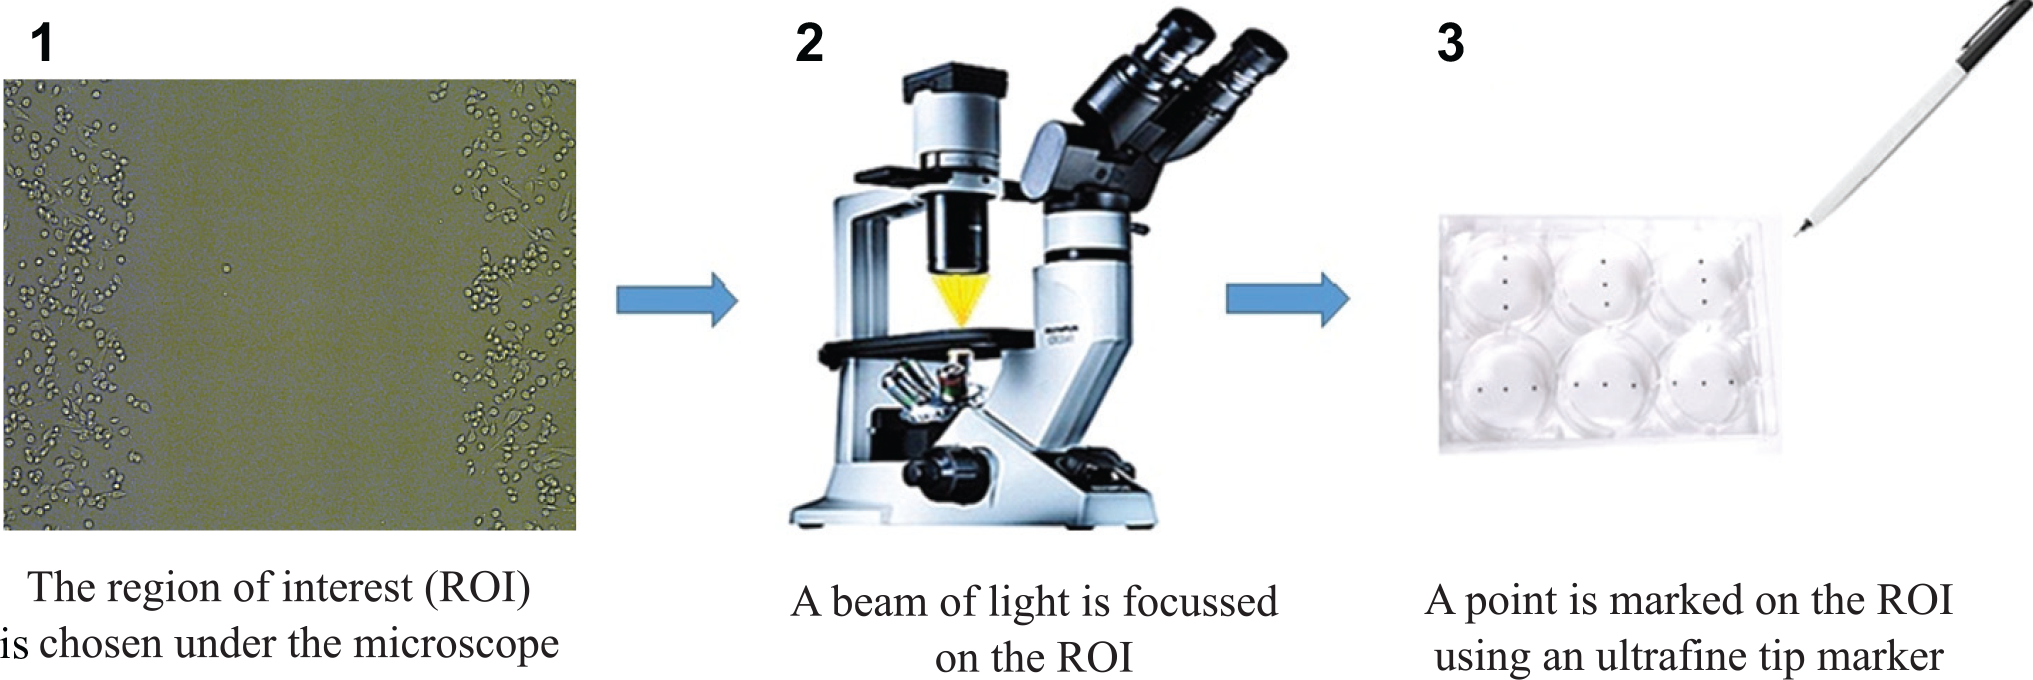
Representation of the manual method for ROI selection.
Once the ROIs are selected, the cell culture is returned back to the incubator until the next ROI follow-up under the microscope. For this article, six ROIs were acquired at each cultivated plate by using the above-mentioned manual method.
ROI Recovery
Images of each cell culture ROI were acquired every 6 h until the wounded area closed completely. This was done by using a microscope objective with 10× magnification and 0.25 numerical aperture. For ROI retrieval, the microscope diaphragm is closed in order to create a beam of light focused on the cell culture dish. Then, the dish is shifted until the user observes that the marked reference point is illuminated by the focused beam, which means that an ROI has been recovered. At this time, the microscope diaphragm is opened and an image of the ROI cell culture is acquired.
In the experiments presented later, plates instrumented with PRPs were used and images of those patterns were always acquired as necessitated for comparison with results obtained with the proposed PRM method (cf. ROI Selection).
PRM for ROI Recovery in Wound Healing Assay
PRM is a technique aimed to allow the easy and accurate recovery of ROI on specimens observed under a microscope.
12
For that purpose, a PRP is put on the cell container and used as a position reference. Then the procedure requires the recording of two images: one of the cell culture and one of the PRP, which is localized at a different depth. The position derived from the PRP image is also relevant for the position of the observed ROI since the shift in the focus depth
In practice, the PRPs are made of glass coverslips on which a thin layer of aluminum was microstructured with pseudoperiodic patterns by photolithography. The pattern is made of dots of 2 × 2 µm of size, with a period of 4 µm, and covers an area of 1 × 1 cm. Those PRPs are attached to the bottom surface of the culture plates for use in the wound healing assay on hepatic cancer cell lines.
ROI Selection
The procedure is performed at the same time as the manual method and is as follows: As presented in the previous section, the SKHep1 cell line is grown until the formation of a confluent cell monolayer. Then the monolayer is scraped and an ROI is selected and an image is acquired (corresponding to the same ROI chosen during the previously mentioned manual method) ( Fig. 2a ). Then, as presented in Figure 2b , the microscope objective is focused on the PRP and an image of this pattern is acquired and processed. Those PRP images are used as reference positions when returning back the culture dish to the microscope for a new observation. As in the manual method, a total of six ROIs were registered at each cultivated plate.
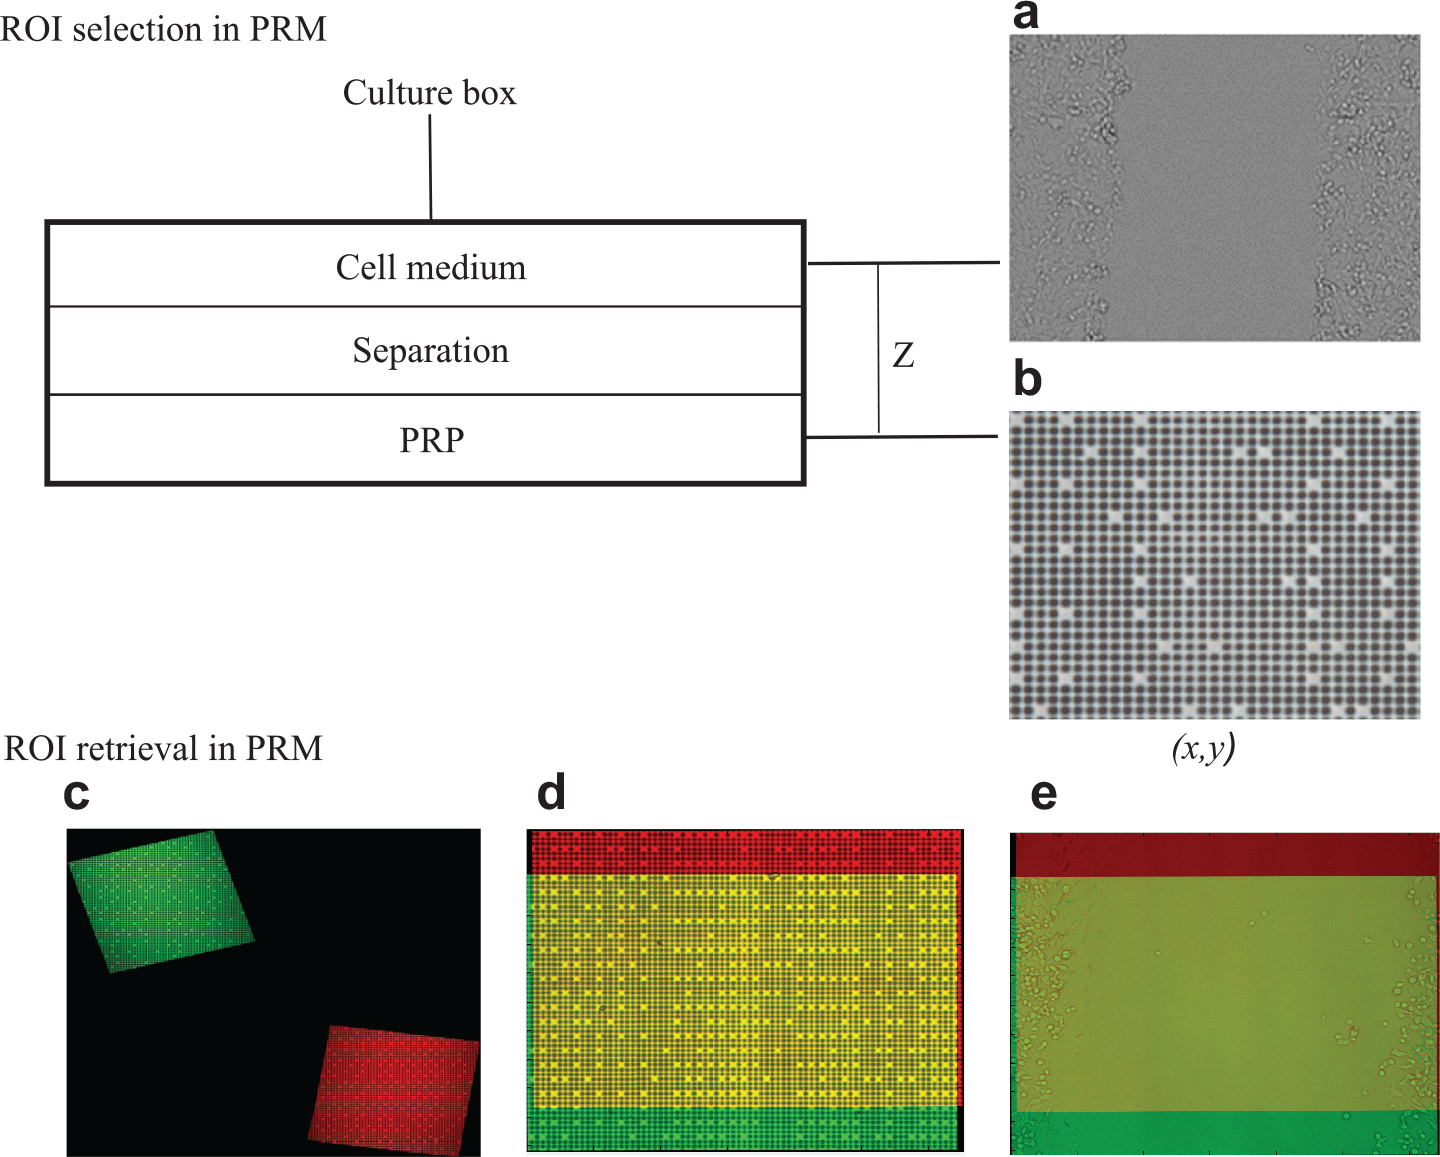
Principle of ROI selection in PRM: Images of both cell culture (
ROI Recovery
As in the manual method, images of each cell culture ROI were acquired every 6 h until the wounded area was completely closed.
For these visualizations, the microscope objective is focused on the PRP and an image of this pattern is acquired. The obtained image is processed and compared with the one obtained during the ROI selection step. This processing puts both images within a common coordinate reference system, allowing their superimposition ( Fig. 2c ). The position mismatch is then available and indicates the shift necessary to recover the expected ROI under the microscope. Then, the culture dish is shifted (manually or with a motorized stage) until reaching the exact ROI absolute position ( Fig. 2d ). Once the ROI has been recovered, the focus of the microscope is shifted to the cell culture and an image of the wound is acquired, which can then be superimposed with the one obtained during the ROI selection step ( Fig. 2e ), of which the common area (yellow color) is used for the wound rate analysis.
This procedure is repeated for all observation sessions. The images of the PRPs were recorded with a magnification of 40×, while the cell culture ROI images were acquired with a 10× objective. This was done because the spatial resolution of the 10× objective lens does not allow the obtaining of sharp images of 2 µm-sized features, as on the PRPs.
Processing of PRP Images
General concept
The processing of PRP images, for highly accurate absolute position estimation, involves two phases:
Evaluation of the distance from the area of interest: In this first phase, the pseudoperiodic pattern images are used to evaluate the distance from the area of interest. Results indicate the displacement necessary to retrieve the desired zone. The required displacement can be realized manually or with a motorized stage. In both cases, unavoidable imperfections could produce residual errors for accurate positioning at the ROI (in the case of a motorized stage, these residual errors could be caused by mechanical backlash). This first phase can be repeated if the residual positioning error remains significant but some error remains necessarily.
Image registration for compensation of residual errors: The aim of the second phase is to deal with these residual errors by means of a software procedure of image registration. The residual distance between the positions of the previous and current images of the sample, respectively, is evaluated from phase computations applied to the images of the pseudoperiodic pattern associated with the previous and current cell culture positions. In this way, the unavoidable residual positioning errors are estimated and compensated for by a software procedure that provides the final image registration. This software adjustment does not require any displacement of cell culture since it is merely numerical. Demonstrated resolutions are lower than 10 nm 12 in the lateral positioning, and this level of performance makes residual errors negligible regarding the definition of recorded images (about 3.4 µm per pixel).
This phase of image registration provides high accuracy to the PRM method and justifies that (1) the eventual accuracy in image registration does not depend on the manual positioning of the cell culture, and (2) the PRM method can be used as a gold standard reference to estimate errors due to manual positioning, which are presented in further sections of the article.
Phase 1: Evaluation of the distance from the area of interest
This phase is composed of two steps. The first one is based on Fourier transform and allows highly accurate relative position retrieval in both the x and y directions, as well as in-plane orientation (β). The second step is based on the binary decoding of PRP images and provides the coarse but absolute (x, y) position. The results of those two steps are combined to obtain the final (x, y, β) highly accurate absolute position of the area under observation on the microscope.
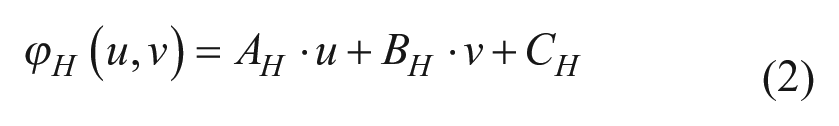
The processing of PRP images by Fourier transform gives, as a result, two phase planes corresponding to the vertical and horizontal directions. Those planes can be fitted by first-degree equations due to the linear distribution of the phase with respect to the image pixel frame. A least-squares fitting for the two directions
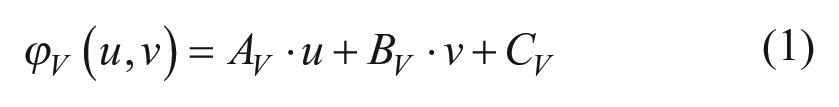
with
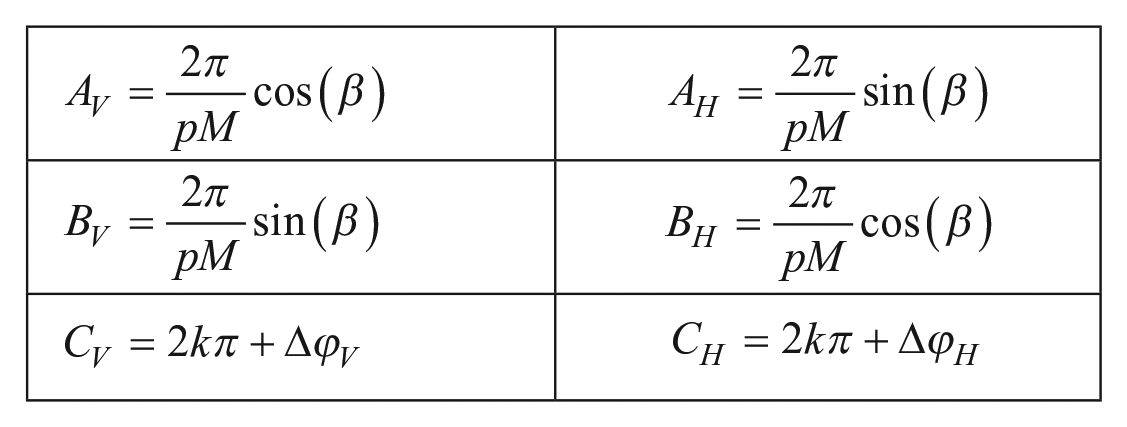
where p is the physical period of the PRP, M is the magnification, and
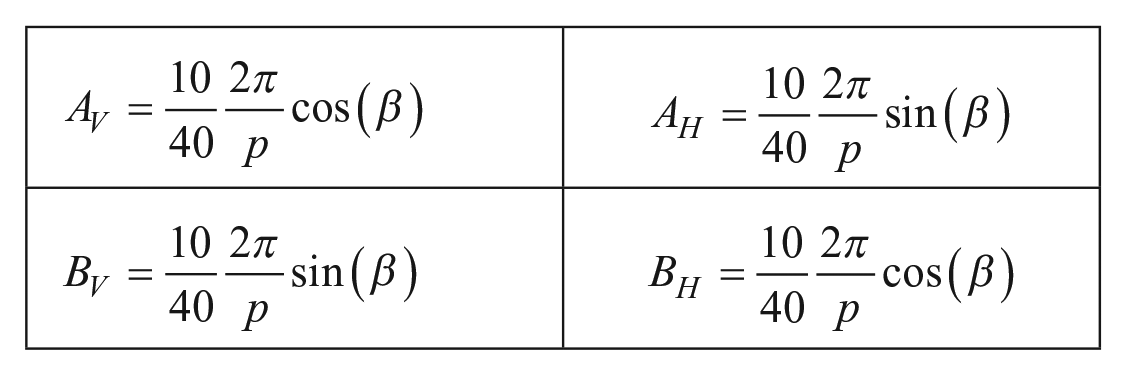
Once the phase equations have been calculated, the values of the constants AH, BH, and AV, BV that correspond to eqs 1 and 2 were multiplied by the outcome of the relationship between 10× and 40× to compensate for differences in magnification between the PRP and cell culture images as follows:
In the second step, we obtain the binary code encrypted in the missing points of the PRP by means of a local contrast evaluation, where absent dots are distinguished from the present ones. 13 The binary values compensate the ambiguity of the constants CH and CV from eqs 1 and 2. Then, in conjunction with the high-resolution position obtained from the Fourier processing, the highly accurate absolute coordinates are obtained. These coordinates indicate the displacement necessary to retrieve the desired zone (in which residual errors could remain). They are also necessary for cell culture image registration.
Phase 2: Image registration for compensation of residual errors
Image registration is an important procedure in cell migration analysis since it allows placing all the acquired data in a common imaging frame (independent of the time of acquisition). In this way, time-lapsed images can be analyzed in an objective way. This factor is useful not only for the wound healing assay but also for other microscopy procedures, such as histological analysis.17,18
In phase 2, we take advantage of the information given by the phase map equations (obtained during phase 1) for superimposing two different images. From the phase equations (eqs 1 and 2), we use the compensated phase constants, which give the absolute phase values with respect to the total encoded area in both the vertical and horizontal directions. These phase constants are transformed into pixels by means of the slope of the corresponding phase equations. The obtained pixel values give the shift necessary to superimpose images within the same frame, and thus to obtain the common area between them (as represented in Fig. 2c ). Image superimposition is obtained numerically and does not depend on residual errors tied to the actual positioning of the culture plate on the microscope.
It is important to note that the procedure of image superimposition is performed once the implied images have been numerically rotated by the value obtained during the Fourier analysis (β).
More details on PRM processing algorithms and procedures can be found elsewhere12,13 for the case where a single magnification is used.
%WR measurement in wound healing assay
The acquired images of the cellular events were segmented with WimScratch (a web-based software from Wimasis) 19 and Bio-EdIP (a software developed by Cardona et al. 11 ). This is done in order to compare the effect of ROI recovery methods with segmentation techniques on %WR calculations.
The WimScratch program is a specialized image processing tool used to quantify cell migration features. The recognition of a gap in an area is based on edge detection techniques. 19 In the case of the program developed by Cardona et al. 11 (Bio-EdIP), the program is based on the intensity level of pixels in the image under evaluation in order to distinguish areas covered by cells from uncovered areas. Initially, the images are converted to grayscale and segmented using a region growing algorithm.
For a particular image, those programs provide the value of both the cell-covered area and scratched area or wound reduction (WR). The results are presented in terms of percentages of the total area, as presented in eq 3 for the case of Bio-EdIP.9,11
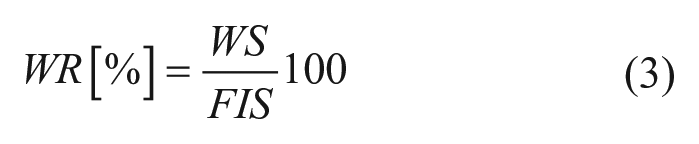
where WS and FIS are the wound region size and full image size, respectively, both in pixels.
Manual ROI recovery performances
The parameters recall, specificity, and accuracy were calculated in order to evaluate the position recovery performance of the manual method. Those parameters were calculated by comparing the cell culture images acquired by the manual method with the ones obtained by the PRM (the method proposed in this work). Assuming the latter images as the gold standard, the changes in the parameter recall, specificity, and accuracy are related to the regions of the images that are different due to their position recovery. A definition of the previously mentioned parameters is presented as follows:
Recall: Measures the proportion of positives that are correctly identified as such. This parameter represents the segmented areas that are coincident in both images (manual and PRM). It is measured from the image background (areas without cells that are coincident).
Specificity: Measures the proportion of negatives that are correctly identified as such. This parameter measures the areas with cells that are coincident between both types of images.
Accuracy: Percent of correctly tagged pixels (true-positive and true-negative pixels) out of the total number of pixels.
Results
As presents in Materials and Methods, a human liver tumor-derived cell line, SKHep1, was used to acquire images of wound healing assay in order to compare the performances of both ROI recovery methods. Two wells from the 12-well plate were cultivated with this kind of cells. Each well corresponds to a cell culture, which was scraped with 100 and 1000 µL tips, respectively. Then, a total of six ROIs were selected at each SKHep1 cell culture.
For this wound healing assay, the manual and PRM methods for ROI recovery were compared by means of its positioning recovery performance and %WR. The aim of these experiments is to quantify the improvement allowed by the RPM method in comparison with the usual manual ROI recovery method. The results are presented in the following sections.
Positioning Error in Manual and PRM ROI Recovery Methods
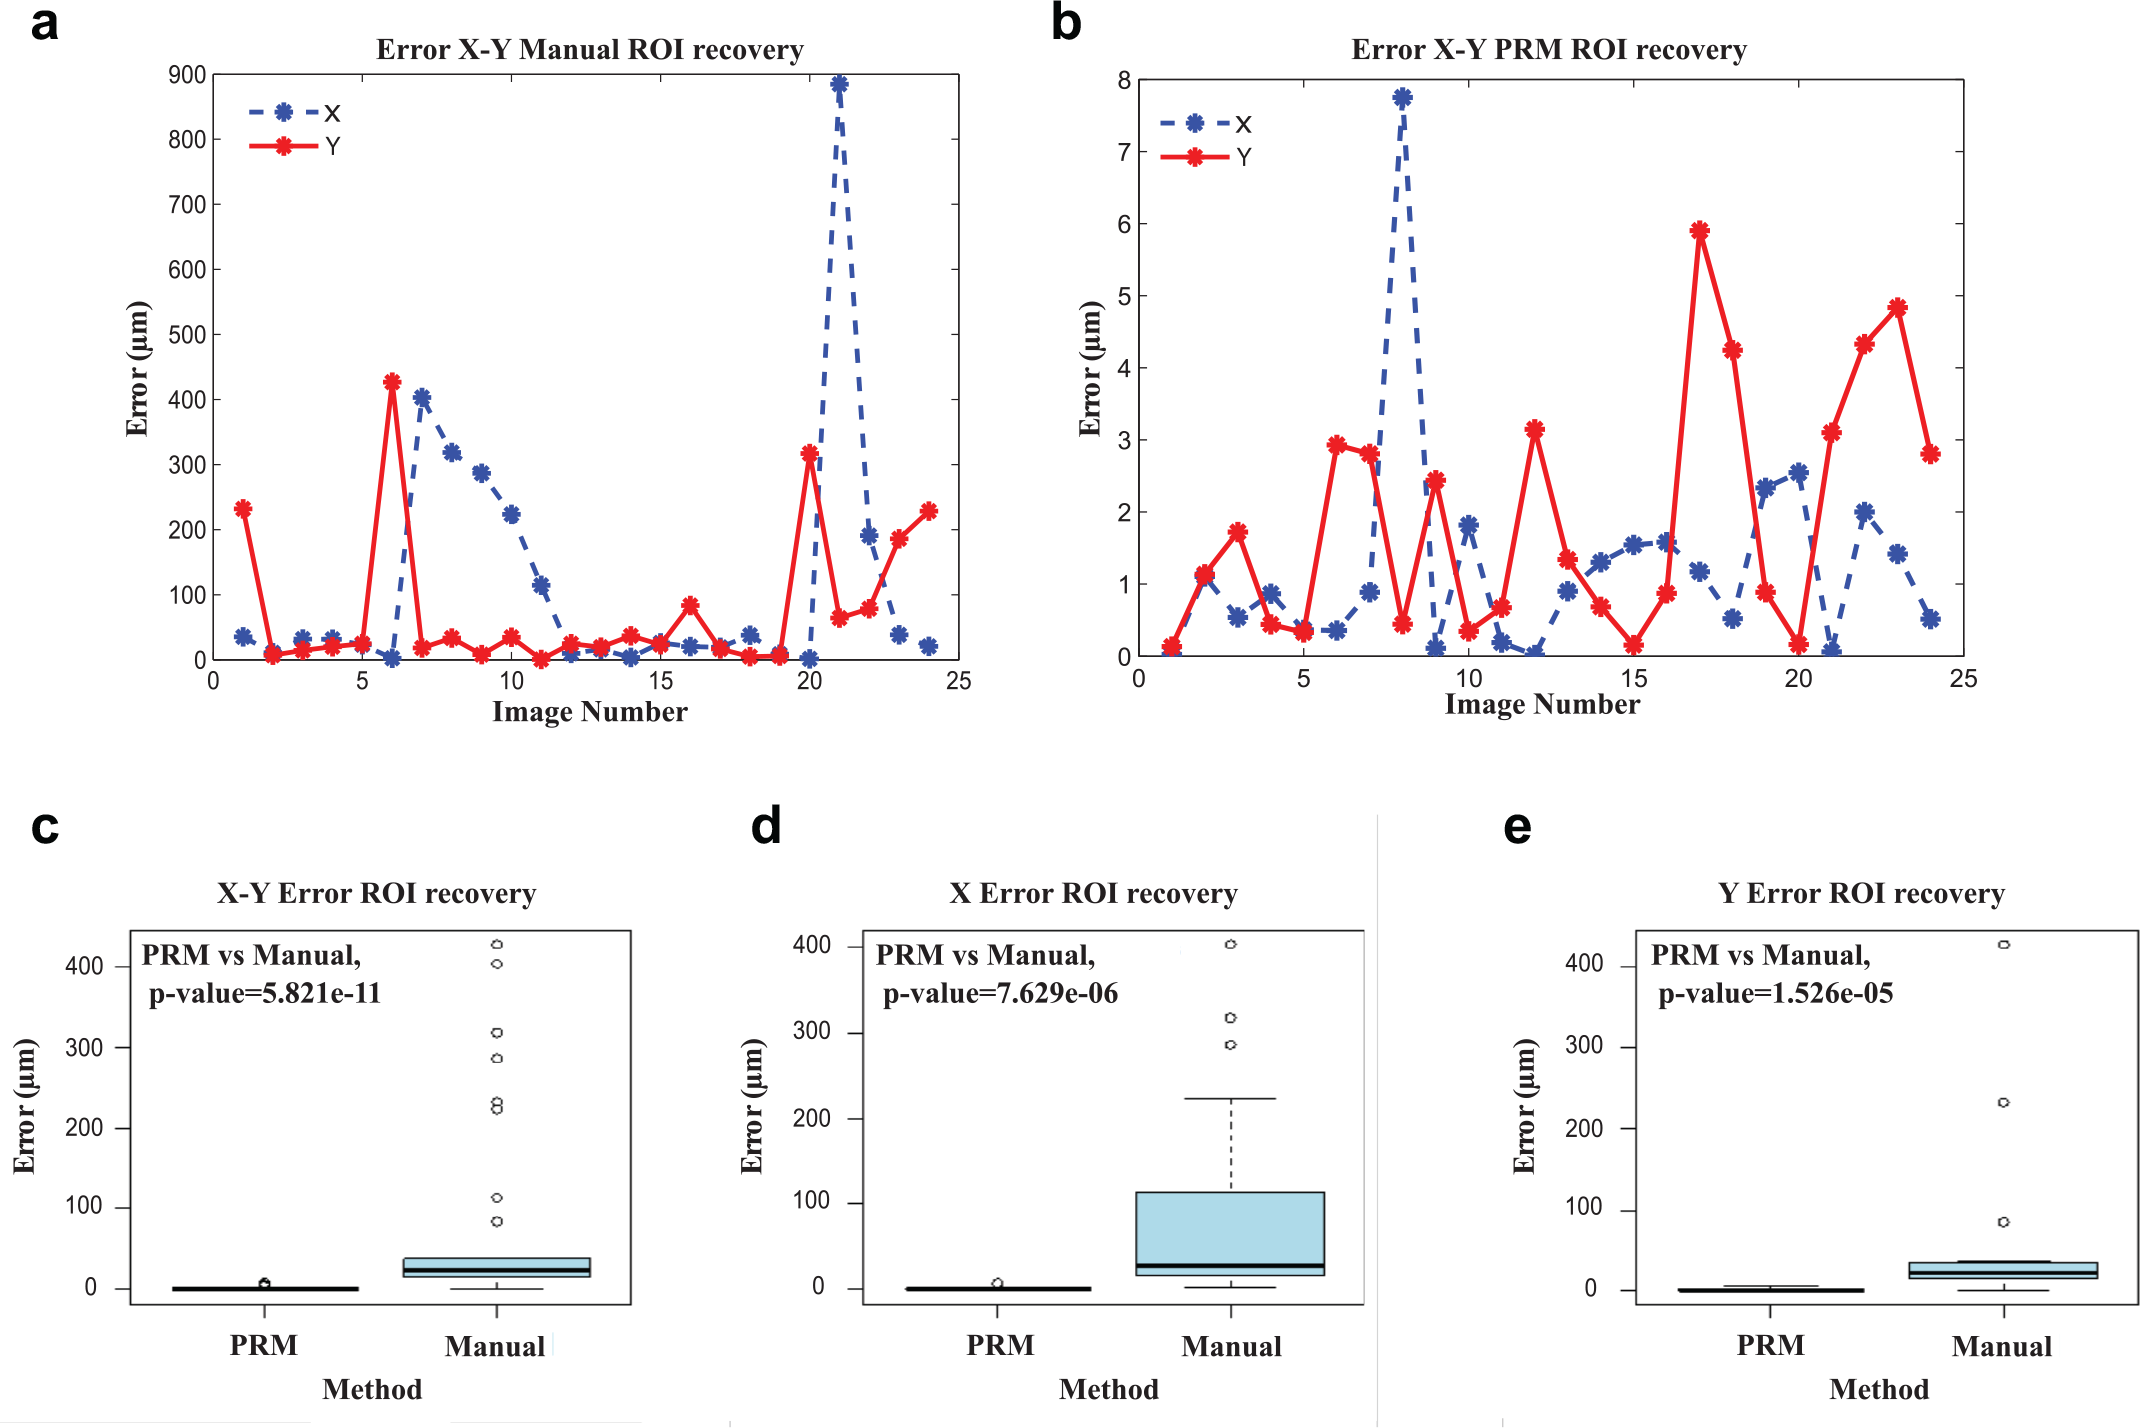
The ROI recovery capacities of the manual method were analyzed through the results given by the processing of the PRP images obtained during the manual ROI recovery. Since the PRP processing provides both the x and y coordinate values of the observed region under the microscope, the values obtained for each recovered region were compared with the corresponding reference values (obtained at the ROI selections). The PRM technique can be used here as the reference tool to evaluate the error of the manual ROI recovery since its performances were demonstrated to be sufficient elsewhere.12,13
Figure 3a
shows the error in both the x and y coordinates for a set of 24 manual ROI recoveries (corresponding to the data presented in
Tables 1
(
Calculation of %WR for SkHep1 Cells by Using Two Segmentation Methods (cell culture scratched with the tip of a 1000 µL pipette).
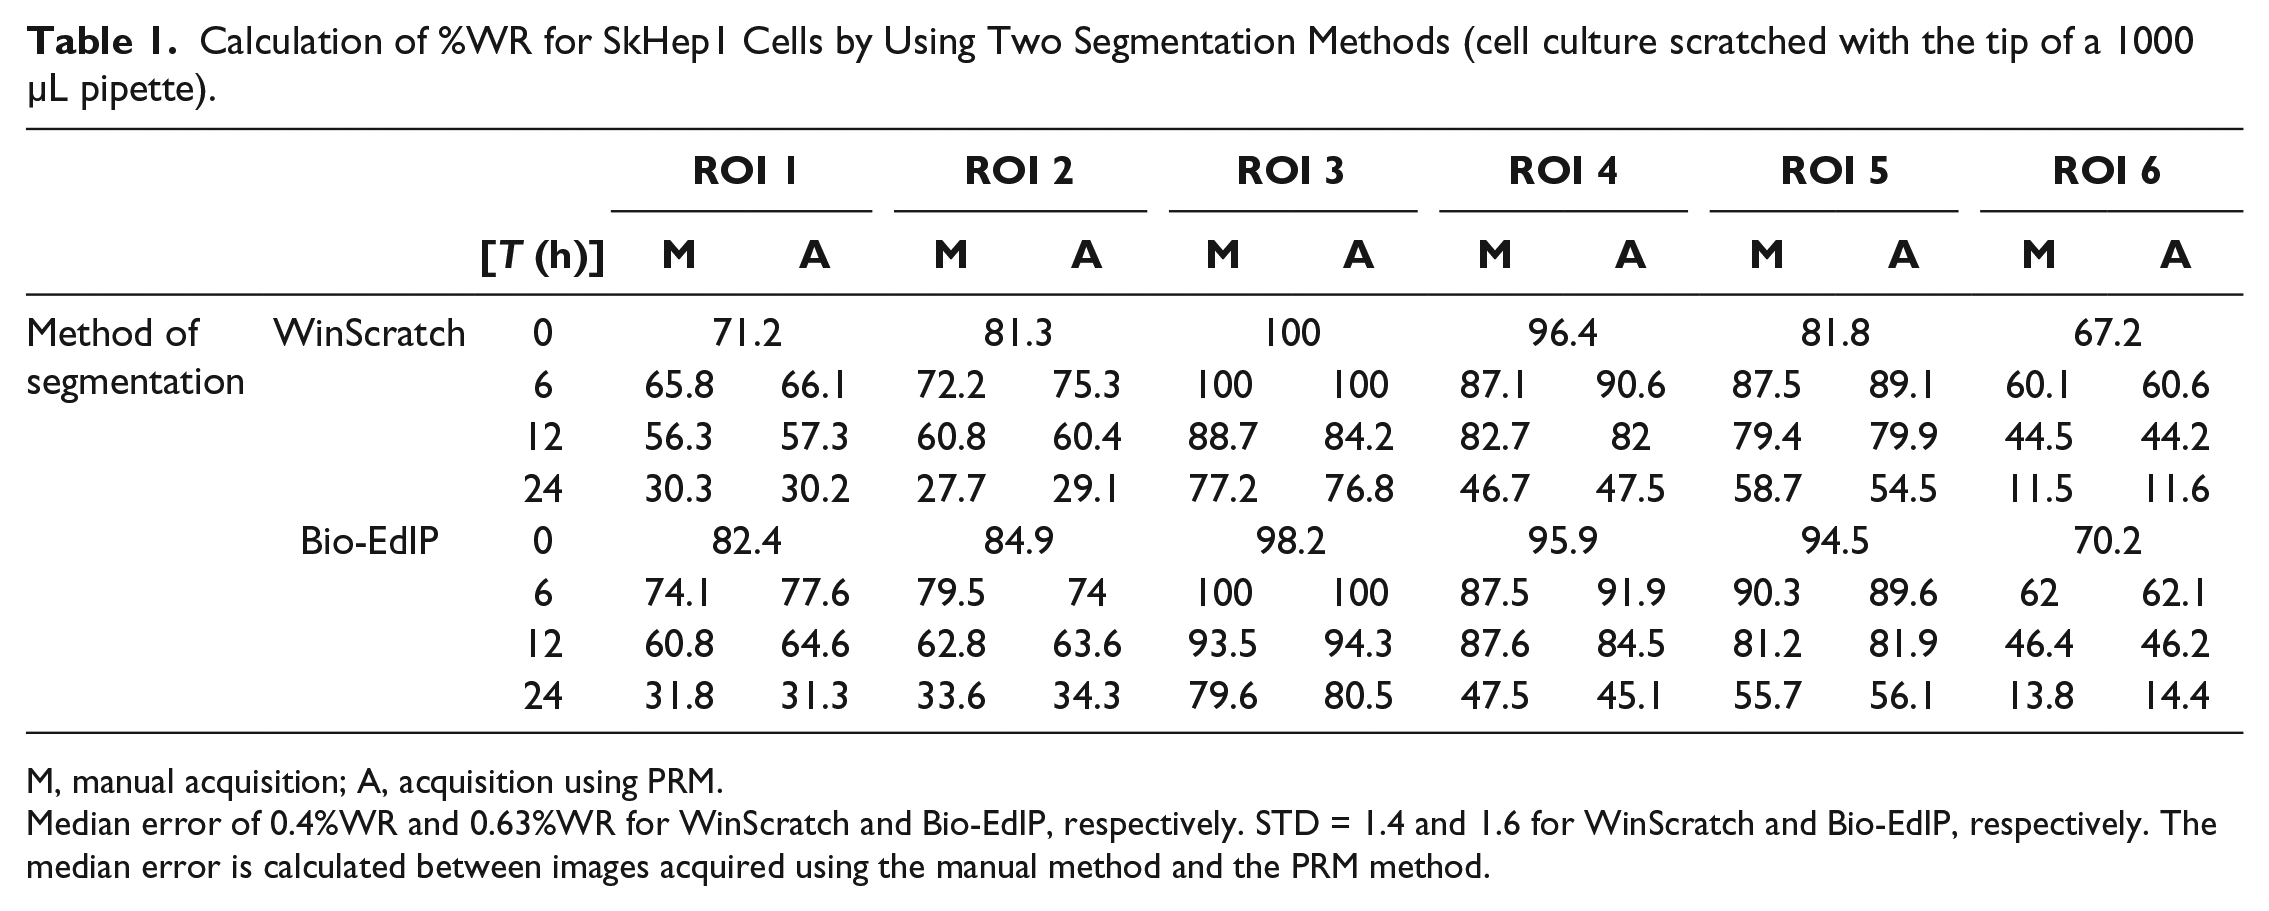
M, manual acquisition; A, acquisition using PRM.
Median error of 0.4%WR and 0.63%WR for WinScratch and Bio-EdIP, respectively. STD = 1.4 and 1.6 for WinScratch and Bio-EdIP, respectively. The median error is calculated between images acquired using the manual method and the PRM method.
Calculation of %WR for SkHep1 Cells by Using Two Segmentation Methods (cell culture scratched with the tip of a 100 µL pipette).
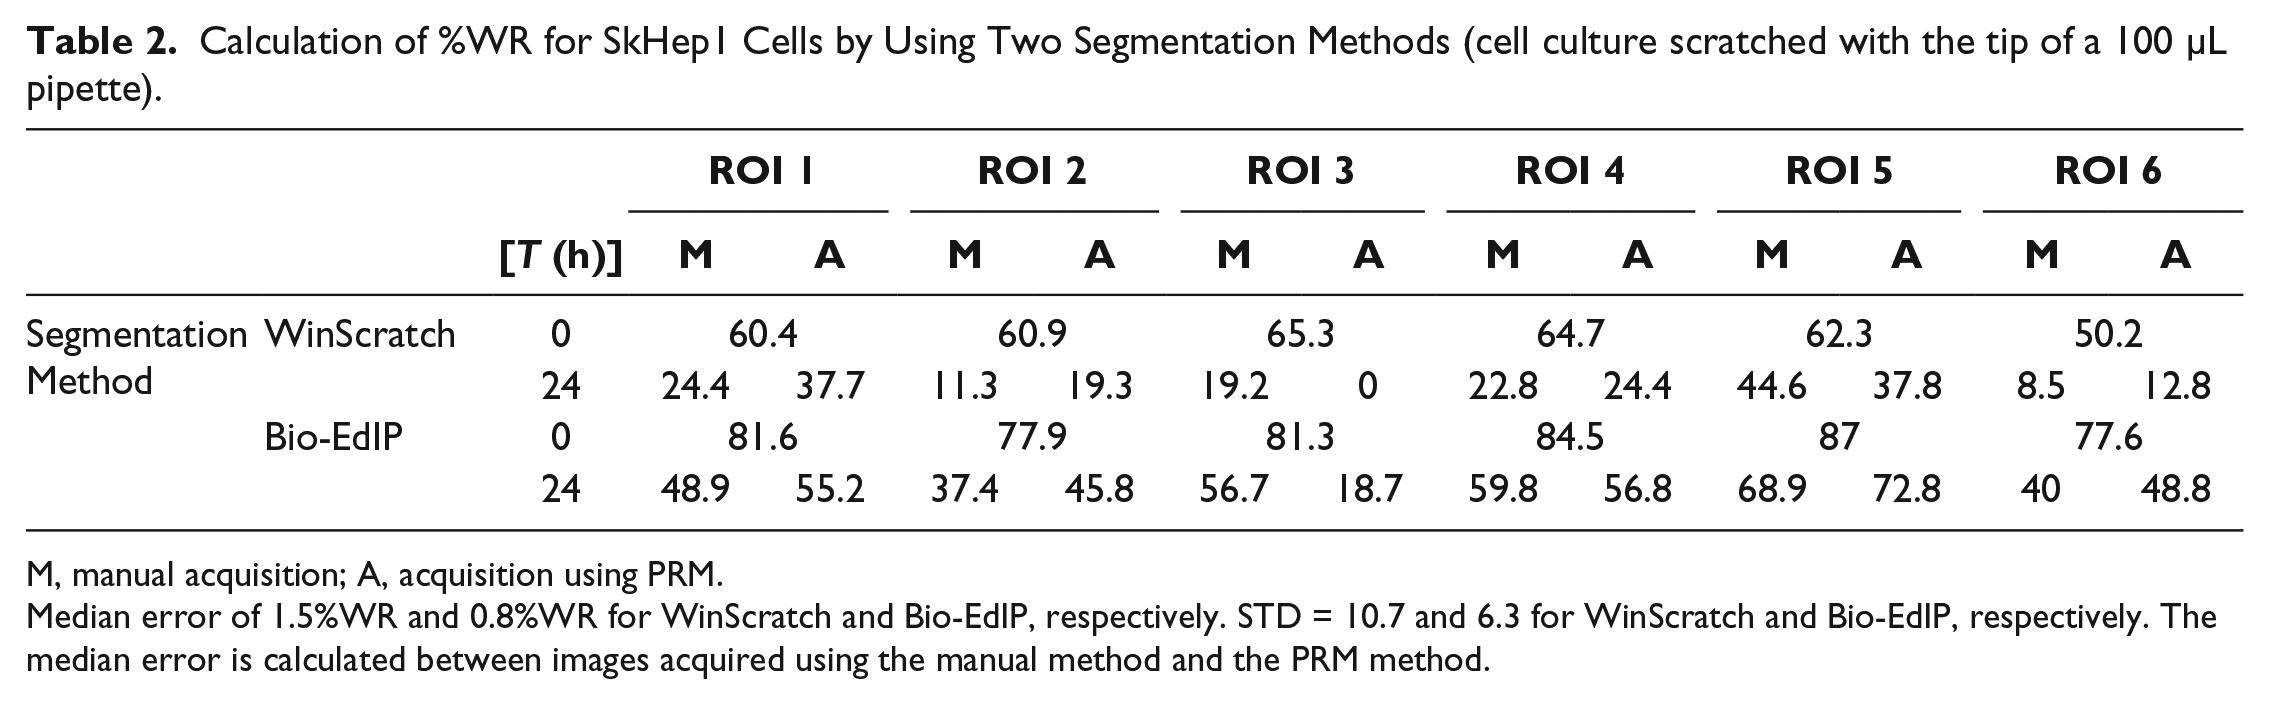
M, manual acquisition; A, acquisition using PRM.
Median error of 1.5%WR and 0.8%WR for WinScratch and Bio-EdIP, respectively. STD = 10.7 and 6.3 for WinScratch and Bio-EdIP, respectively. The median error is calculated between images acquired using the manual method and the PRM method.
On the contrary, the use of the RPM method should result in perfect ROI retrieval. However, since manual (without the use of a motorized stage) position adjustments were performed, the positioning cannot be exactly as suggested by the digital processing of PRP images, and therefore some errors remain.
Figure 3b
presents the errors observed for a set of 24 ROI recoveries (corresponding to the data presented in
Tables 1
Compared with the manual method for ROI recovery, the PRM method is more accurate, and therefore it is more appropriate for ROI position recovery during wound healing assays.
Statistical Analysis in Positioning Error
In order to support differences between manual and semiautomatic (PRM) ROI recovery methods, a statistical analysis of x – y errors in ROI recovery by both methodologies was conducted in R 3.2.5 software (https://www.R-project.org/). Position errors were analyzed from normal distribution using the Shapiro–Wilk test and quantile–quantile plots. Then, differences between error means were evaluated using a paired two-sided Mann–Whitney U test. p < 0.01 was considered statistically significant. With this tool, some comparisons were carried out:
Error in x PRM versus error in x manual: p = 7.629e-06. Since this value is less than 0.01, the means of those data represent a statistically significant difference.
Error in y PRM versus error in y manual: p = 1.526e-05. There is a statistically significant difference between both ROI recovery methods.
Error in x, y PRM versus error in x, y manual: p = 5.821e-11. There is a statistically significant difference between both ROI recovery methods.
Also, the methods were analyzed within themselves. Such analysis allowed us to determine whether the particular method has the same performance in both axes, that is, x and y. The results of those analyses are as follows:
Error in x PRM versus error in y PRM: p = 0.2837. These data do not represent a statistically significant difference. This means that the semiautomatic method has the same performance in both axes.
Error in x manual versus error in y manual: p = 0.3927. These data do not represent a statistically significant difference. This means that the manual method has the same performance in both axes.
Given the accurate results obtained by PRM in positioning error, this method can be considered the reference when analyzing the performance of the manual ROI recovery method.
Calculation of %WR
Tables 1
Figure 4a–d shows a comparison of the segmentation results obtained using WinScratch and Bio-EdIP software for images of an ROI of the cell line scratched with the tip of a 1000 µL pipette. Also, the values of %WA and percentage of cell-covered area are presented in the same figure. The evaluated images correspond to one retrieval of the ROI by the manual and PRM methods. In the segmented images, it is possible to observe a shift of the cell culture image ( Fig. 4a–d ). This is due to the method of ROI recovery, which has implications over the evaluation of %WR. For images segmented using WinScratch, there is not a significant difference between images of the same ROI recovered by both methods ( Fig. 4a , b ); the average error in the calculation of %WR between the manual method and the PRM is barely 1%. On the other hand, the segmentation using Bio-EdIP shows a difference between the images that corresponds to the same ROI recovered by the two methods. In this case, the error in the calculation of %WR is approximately 9% ( Fig. 4c , d ). The same comparison applied to other ROIs led to similar results, so a single test is discussed in details.
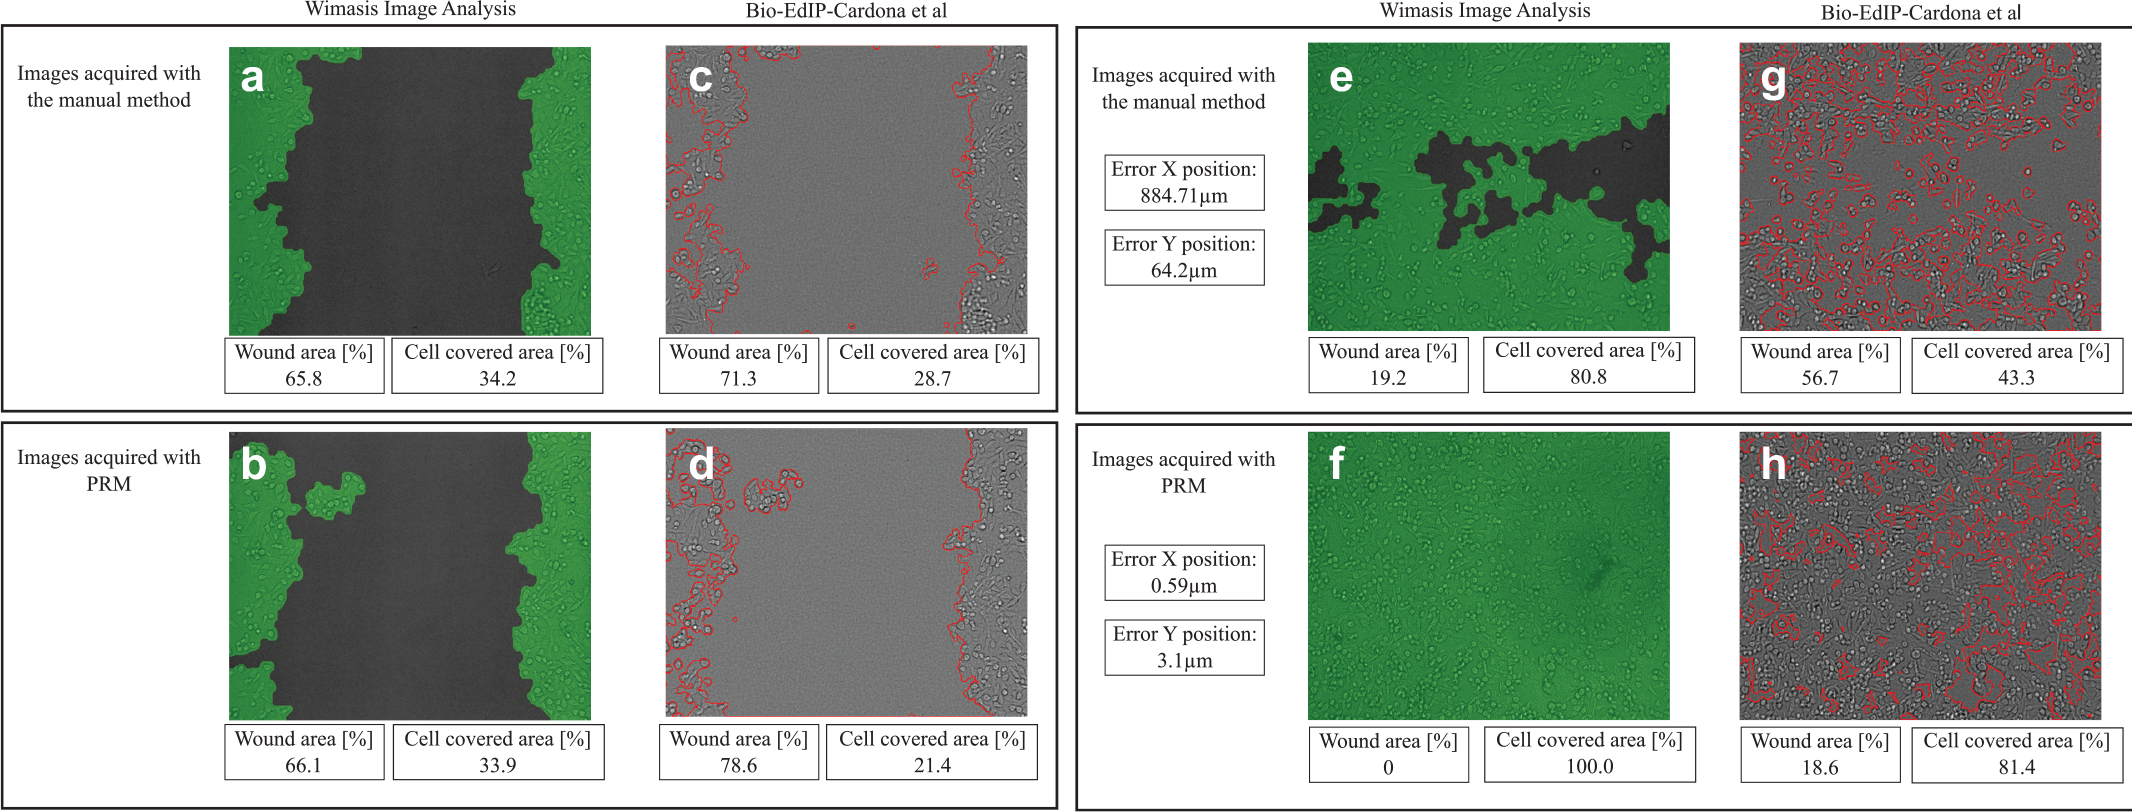
Calculation of %WA of the same ROI, by using Bio-EdIP and WinScratch. (
In the case of the data obtained for the cell lines scratched with the 100 µL pippette, it is possible to observe that the difference of %WR evaluation can lead to misinterpretation when evaluating the time necessary for a cell culture to heal. As presented in Table 2 at ROI 3, the WimScratch segmentation method evaluates that SkHep1 cells spent 24 h to cover the wound area using the manual ROI recovery method. On the other hand, Bio-EdIP shows that the same cells spent more than 24 h to cover the wound area, independent of the ROI recovery method. A graphical representation is presented in Figure 4e–h . Therefore, the combined use of the ROI recovery method and a segmentation method for %WR measurement led to a significant reduction or increase in the evaluation of the time necessary for the cells to cover the wound area.
Performance of Manual ROI Registration
Table 3 presents the results of the parameters recall, specificity, and accuracy calculated for the measurement of the manual ROI registration performance.
Performance of Manual ROI Registration for the Wounds Generated with the Tip of Two Types of Pipettes.
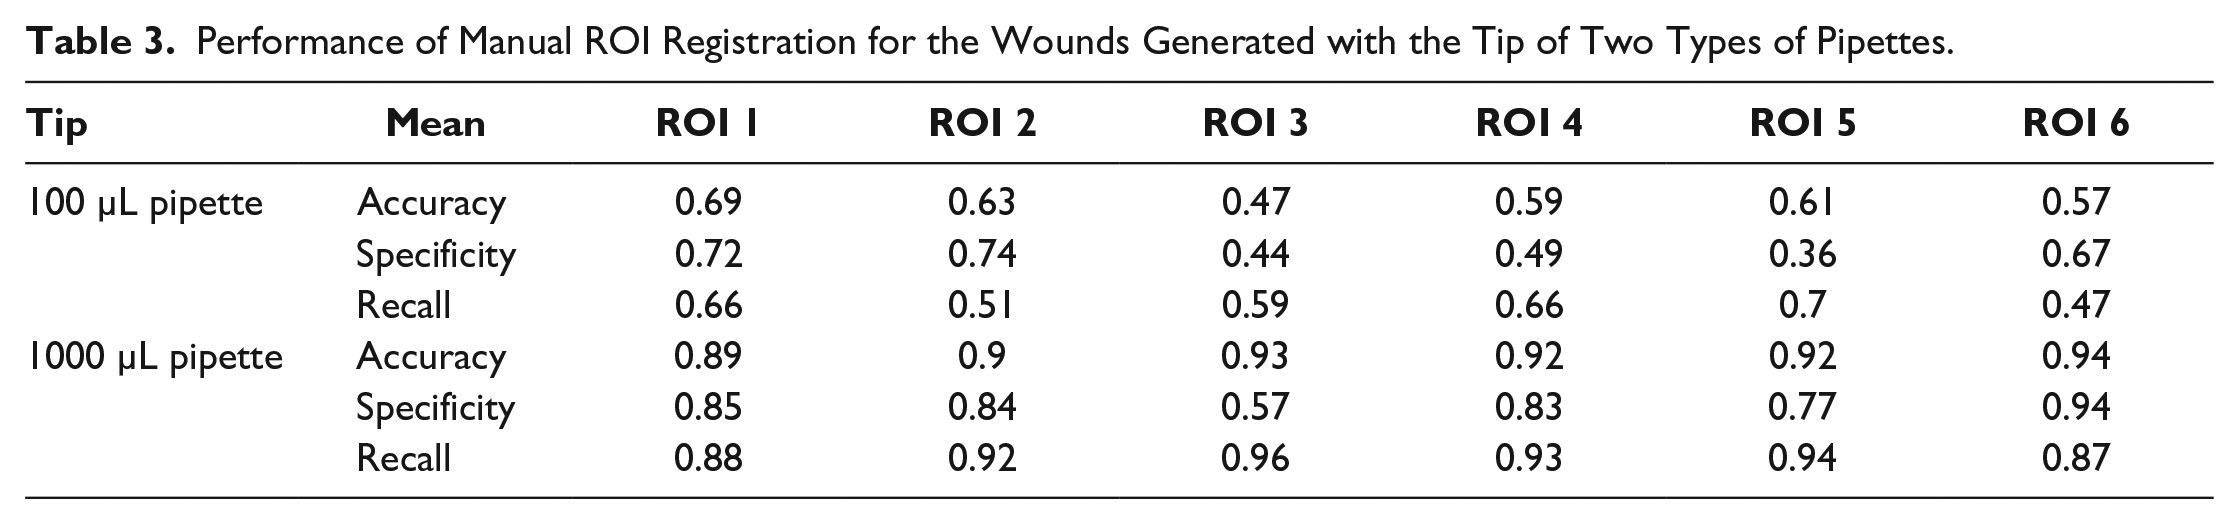
The values from Table 3 corresponding to the 1000 µL pipette are higher than the ones from the corresponding data of the 100 µL pipette. This is due to the fact that the tip of a 1000 µL pipette produces a bigger wound area than the tip of a 100 µL one. In consequence, the process of wound healing lasts longer. In return, this implies that at the moment of first time-lapsed image segmentation (which in most correspond to wound areas), the results are unaffected by the positioning errors when retrieving the same ROI.
On the other hand, the results presented for the tip of a 100 µL pipette are low, which indicates that the performance in image segmentation for identifying cell- and non-cell-covered areas is affected by the ROI recovery method. It is important to note that in the wound healing assay, the tip of a 100 µL pipette is the most widely used tool for wound generation.
Discussion
In this article, the authors report on an improved technique for ROI recovery for the in vitro wound healing assay. The proposed method is based on PRPs and image processing techniques involving Fourier transform and codification of two-dimensional in-plane positions.
Compared with the widely used method for ROI recovery in the wound healing assay, the proposed method allows more accurate cell migration analysis, which is evaluated in terms of %WR.
By analyzing a human liver tumor-derived cell line, the results report that for ROI recovery, the proposed technique has an average positioning error of only 0.9 and 1.2 µm in x and y, respectively, while the manual technique reports average errors of 28.7 and 24.7 µm in the same directions, respectively.
In terms of %WR, for an assay developed with the tip of a 100 µL pipette, it is shown that a manual ROI recovery method can result in erroneous evaluations that can lead to misinterpretations when analyzing a cell migration or proliferation event. It is also presented that the combination of an ROI recovery method with a segmentation one can produce results that show a significant reduction or increase in the obtained value of the time necessary for the cells to cover a wound area. This is a factor that can lead to an overestimation or underestimation when evaluating, for example, the effectiveness of drugs by means of the wound healing assay.
Footnotes
Acknowledgements
We acknowledge the RENATECH network and its FEMTO-ST technological facility MIMENTO, as well as COLCIENCIAS, for the support given to Cesar Bedoya in the frame of the program “Jóvenes Investigadores.”
Declaration of Conflicting Interests
The authors declared no potential conflicts of interest with respect to the research, authorship, and/or publication of this article.
Funding
The authors disclosed receipt of the following financial support for the research, authorship, and/or publication of this article: The authors would like to acknowledge the financial support given by Instituto Tecnológico Metropolitano (Medellín, Colombia) and by Institute FEMTO-ST (Besançon, France), under project numbers P15201 and P10242.