
Abstract
Bioinformatics studies have emerged in the domain of larval behavior analysis in recent years. A dynamic survival detection and analysis system for automatically monitoring a large amount of mosquito larvae in bioassays with multiwell plates by acquiring and processing videos is proposed in this article. In our system, equipment is designed for acquiring the video of the mosquito larvae in several multiwell plates simultaneously by a camera, and a video analysis module is developed for detecting the survival states of larvae in each well in real time. Also, a novel model and a new image registration algorithm are proposed to accurately obtain the survival state by analyzing the larval motion activities and the weights of larvae in each well. In our experiments, several spinosad bioassays against 2-instar Aedes aegypti with 96-well plates are used to evaluate the proposed system, and the accuracy of the larval survival state in our system is more than 85%. Moreover, this investigation has indicated that the developed system not only can be used in the mosquito larval bioassays but also can be suitable to detect and analyze the behaviors of large amount of other larvae.
Introduction
Mosquito larval laboratory bioassays are widely used in mosquito control1–4 and food chemistry and safety.5–7 Usually, the cups or beakers are used to check the biopotency of insecticides for larval bioassays, 8 whereas the multiwell plates are widely used to screen insecticides of the bioassays5,9 or for other testing such as nematodes 10 or fungus 11 controlling mosquito bioassay, larvicidal activity bioassay,12,13 and spinosad strains screening bioassay. 14
In recent years, bioinformatics studies based on image or video technology have emerged in the domain of larval behavior analysis. 15 Compared with the traditional observation method, image-based or video-based automatic analysis is less susceptible to experimenters’ deviation and is more convenient and efficient to obtain the results. Object detection or object tracking has been used for monitoring and analyzing the behaviors of larvae or issues.16–28 Some systems are used for analyzing the locomotion behaviors of multiple Caenorhabditis elegans at the same time16–19 and others for analyzing a specific single worm.20–23 Other works are proposed for tracking drosophila 24 and their larvae. 25 A system for detecting multiple zebrafish embryos is also applied in the work. 26
However, there is no automatic system for monitoring and analyzing the activities of mosquito larvae. Compared with the recording of the bioassays with cups or beakers, it is more challenging to observe the behaviors of large amounts of mosquito larvae in bioassays with multiwell plates. To automatically monitor and analyze the survival states of a large amount of mosquito larvae simultaneously, a dynamic survival detection and analysis system for bioassays with multiwell plates by acquiring and processing videos is developed in this article. The system is composed of equipment used for acquiring larval videos and a software module for analyzing the larval survival states. The equipment consists of several components, as shown in Figure 1 . With the preprogrammed controlling software, the equipment automatically obtains the video data of several multiwell plates. The video analysis software module, whose framework is shown in Figure 2 , registers each frame image by using a proposed imaging registration algorithm. Thus, the module gets the imaging data of each well on each plate from the original video. Then the survival state of larvae in each well in real time is obtained by a novel model, which uses the larval motion activities of larvae and treats the detected average number of pixels for larvae in each well as the weight. To evaluate the effectiveness of the system, several drug assays using high concentrations of spinosad against 2-instar Aedes aegypti with 96-well plates are applied to test the system in the experiments. The system and methods are given in detail in the following sections.
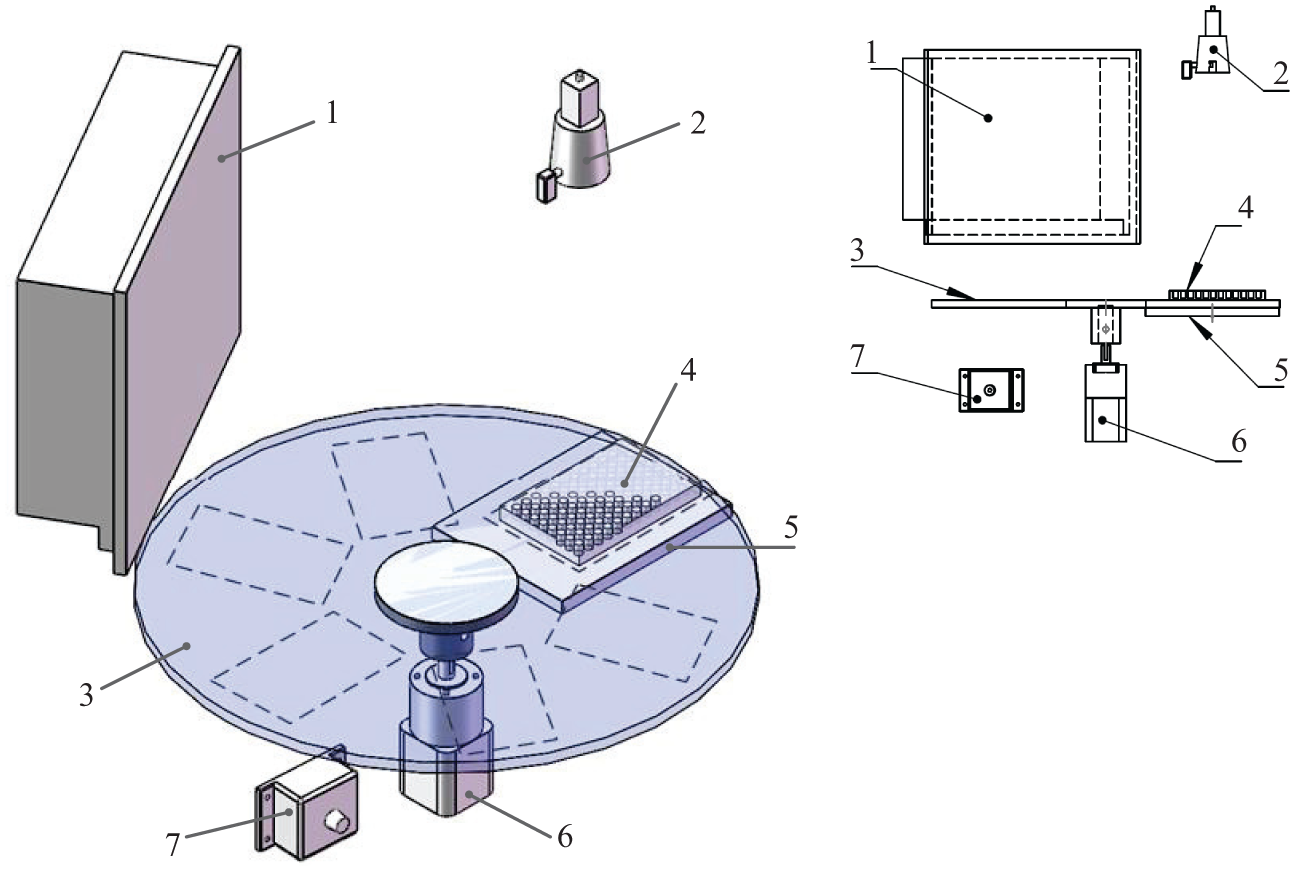
Components of the data acquisition equipment. The equipment includes (
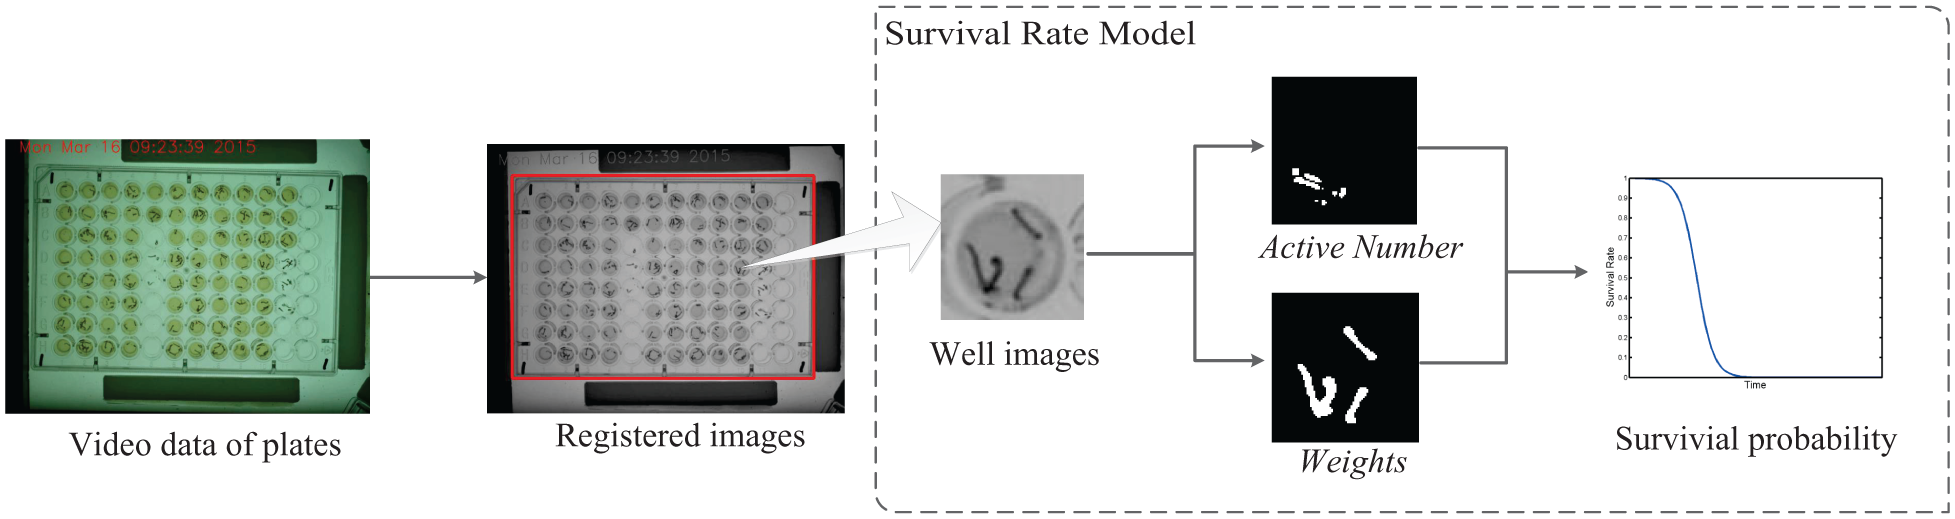
Framework of software module. The video data of plates are first processed by the plate registration algorithm. The survival rate model is then used to compute the survival probability of each well in each plate.
Methods
Data Acquisition
The equipment is composed of a computer, a camera, a circle turntable, a stepper electromotor with the driver, a flat scattering light source, and several plates, as shown in Figure 1 . The camera, the electromotor, and the light source are controlled by the computer. Multiwell plates injected with larvae and insecticides are placed into the specified positions on the circle turntable. There are six different specified positions. The camera is fixed right above the flat scattering light source, aiming for one of those six positions. The circle turntable driven by the electromotor rotates anticlockwise horizontally. When the turntable rotates 60°, it is called a step.
The turntable rotates step by step. After each step, one of the six positions is justly exposed under the camera. If the infrared sensor detects the multiwell plate, the turntable will stop the rotation and allow the camera a short time to record videos. The flat scattering light source is turned on before the recording and turned off after that. If there is no plate, the turntable directly rotates another step.
Mosquito larvae tend to be nonresponsive without external stimulus for a long period, even if they are still alive. The experimenters must tap the plates before recording the mortality of larvae to make the nonresponsive larvae reactive in manual work. In our data acquisition equipment, the rotating turntable provides a vibration that stimulates the inactive larvae. In addition, the sudden change of light can stimulate living larvae.
Plate Registration
It is necessary to obtain the larvae imaging data of each well in each plate. After a step, the location of the plate under the camera is always different with other steps and other circles in the videos. After several rotations, the position of the plate may change slightly, so it is necessary to register the plate in each frame of the video and then obtain the positions of each well. In this article, a correlation filter27–29 is used for the plate registration. The framework of the proposed image registration algorithm is shown in Figure 3 . There is a template image in which the location of the plate has been labeled. For the t-th frame, noted as frame(t), the plate should be registered by using the image registration algorithm. Similar to refs. 27 and 28, the image is expanded to twice the size of the plate as its context. The registration problem is formulated by computing a confidence map that estimates the plate state likelihood:
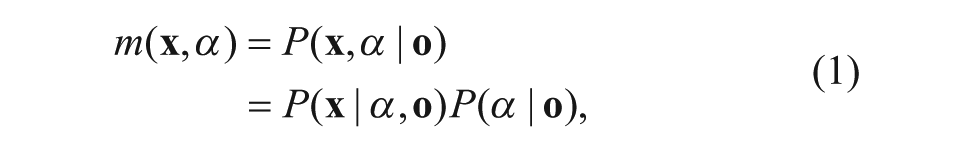
where
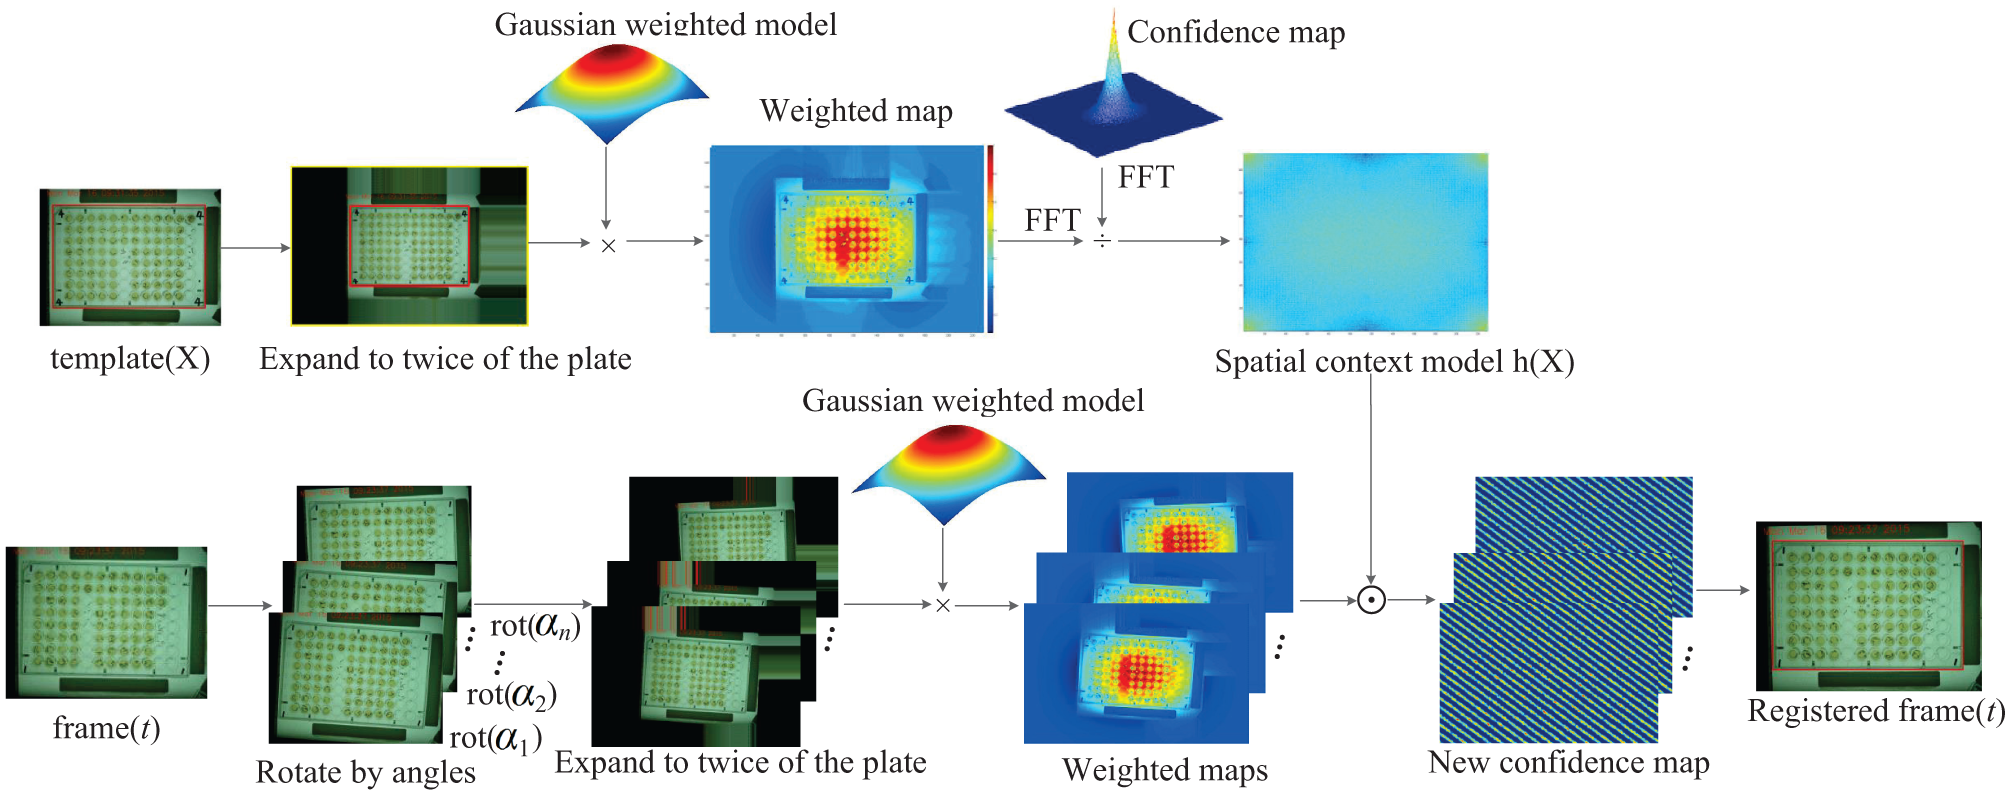
Framework of the algorithm of image registration. The spatial context model h(X) is obtained from the template image template(X). For each frame(t), the registered image is derived from the max confidence value of new confidence maps.
For the template image, the confidence map of the location of the plate is modeled as

where b is a normalization constant and γ is a scale parameter, which is 2.25 in our system. The parameter
For the template image and the frame(t), the plate location likelihood can be modeled as the convolution of the spatial context model and the context prior model:

where Ω

where Iα(

where a is a normalization parameter and σ is the scale parameter, which is 0.075 in this article.
As convolution in Eq. (3) can be transformed to the frequency domain, the spatial context model, which is computed using the fast Fourier transform (FFT) algorithm, 30 can be expressed as
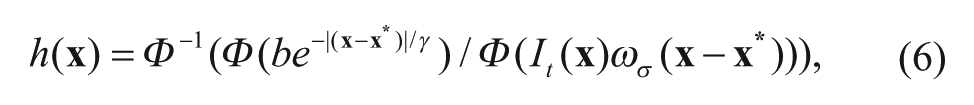
where Φ is the FFT function, Φ−1 denotes the inverse FFT function, and It(
The registration problem is defined as a detection task. The region of the detection in the frame(t) is Ω
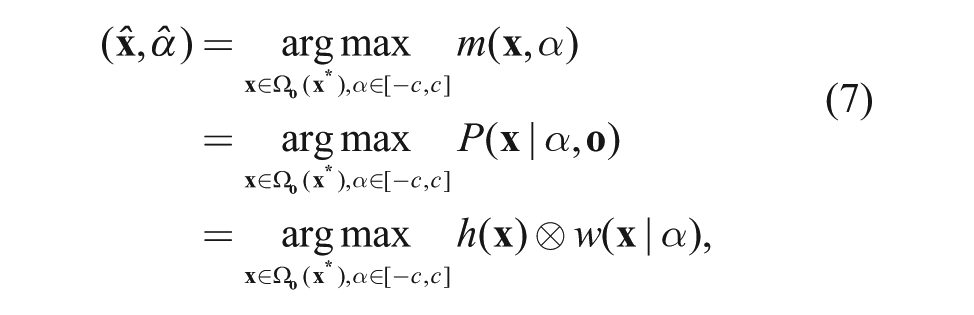
where the h(
Survival State Model
The survival rate of the larvae for a plate is determined by the survival state of larvae in each well. In our work, a model is designed for the survival state of larvae in each well at any time. The survival state model measures the survival states by using moving states of larvae in each well. And the moving state of larvae in each well is measured by the larval motion activities and the weight.
The region of each well can be easily detected from the registered image. The larval motion activities then denote the variations of position or shape of larvae in each well. They can be measured by the active number, which is defined as

where i denotes the i-th well and t means the t-th frame. The
The active number is especially susceptible to illumination variation and noises. It is also easily affected by the number of larvae in each well and the size of each larva. Therefore, the active number is not enough to describe the moving state of the larvae. Then a weight is introduced to solve this problem.
The weight of larvae in each well is measured by the average number of pixels of larvae in the well. The region of larvae in the imaging data of each well is treated as the foreground region. In our work, the moving offset is used to detect the foreground region. m frames are randomly chosen from the original video to the measured set
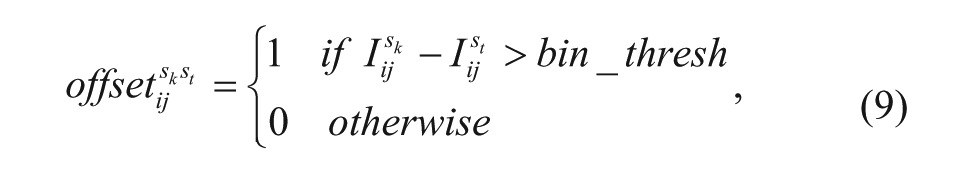
which denotes that the pixels whose intensity value lower than bin_thresh belongs to the foreground of frame st.
The probability of each pixel in frame st belonging to larvae or foreground region is
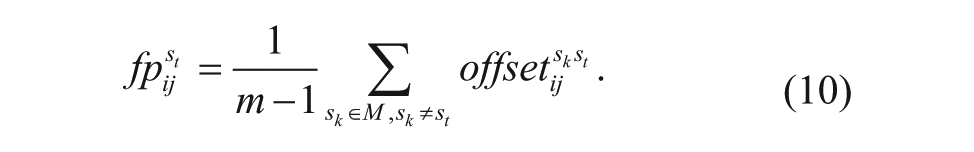
Then the weight(i) is the average number of pixels whose foreground probability is more than ε, and it is represented as
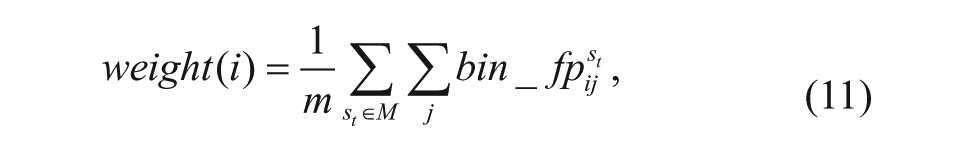
where bin_fp is the binarization of fp when the threshold is ε.
The moving state is measured by moving probability, which is defined as
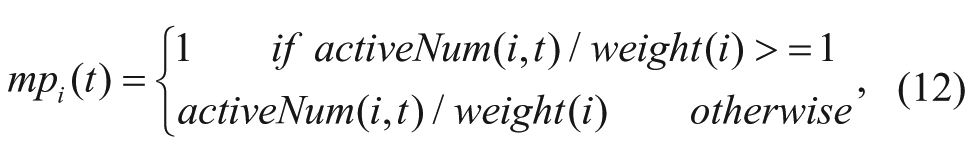
where activeNum(i,t) is defined in Eq. (8).
The survival state of each well is modeled as survival probability, which can be measured by the moving probabilities in the neighborhood frames. The survival probability is modeled as
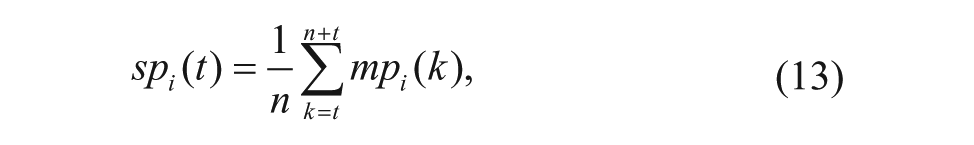
where n is the size of neighborhood frames and mpi(k) is defined in Eq. (12). The survival probability is the expectation of the moving probability in the neighborhood frames.
Last, the survival state of each plate is decided by the survival probability of larvae in all wells.
Experiments
Data Set and Labels
We used a group of 72-h-old 2-instar A. aegypti to test the bioassays. Six kinds of high-concentration spinosad are used as the insecticides, and the concentrations are 357 mg/L, 341 mg/L, 337 mg/L, 299 mg/L, 280 mg/L, and 276 mg/L. The mortalities of all concentrations are nearly 100% after 2.5 h of exposure. Before recording the videos, the mosquito larvae are injected into each well of the plates, and the number of larvae in each well is between 1 and 8. For each plate, one kind of concentration spinosad is tested. The videos are then filmed as the data acquisition system described previously. The waiting time between steps of the electromotor is set as 10 s. Therefore, a number of 10 s short videos for each plate are collected, with a temporal resolution of seven frames per second. Frames have a spatial resolution of 111 µm/pixel, with a size of 1024 × 1360 pixels. In each short video, the larval survival state of each well is measured by a human. The survival states of wells with alive larvae were labeled as 1 and otherwise labeled as 0. The human-estimated results are regarded as the benchmark.
Implementation Details
In our experiments, we collected short videos for six kinds of high concentrations of spinosad in a bioassay. Then, for each short video, by using the registration algorithm described as 3.1, we register one of the frames and obtain the transformation matrix. The bound c of the rotation angle is 3°, and the angular resolution is 0.2°. The active number of each well in every frame is calculated after registering the frame by using the transformation matrix, with the parameter bin_thresh set as 0.1 when the intensity is normalized from 0 to 1. We evaluate the weight of each well of each plate by choosing 10 frames, respectively, from the first three short videos of the plate, because the larvae move fast in the start of bioassay. The threshold parameter ε of the foreground probability is set as 0.2. Finally, for the survival probability of each well, the size of the neighboring frames n is regulated as 20. The final survival probability is the maximization of the whole video. The state of each well is estimated with the survival probability binary processing.
Evaluation Criteria
One of the evaluation criteria of the system can be defined by the difference between the estimated survival rate (ESR) and the truth survival rate (TSR). Generally, the curves of the ESR and the TSR are painted as in Figure 4 . The blue curve represents the TSR, and the red curve represents the ESR. The estimated error can be defined as the variance between the ESR and TSR, which is formulated as
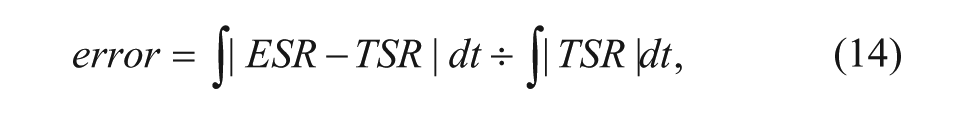
where t is the time variable. In intuition, the estimated error is the area of the blocks between the two curves, as shown in Figure 4 , where it is the sum of the area in the yellow section and cyan section.
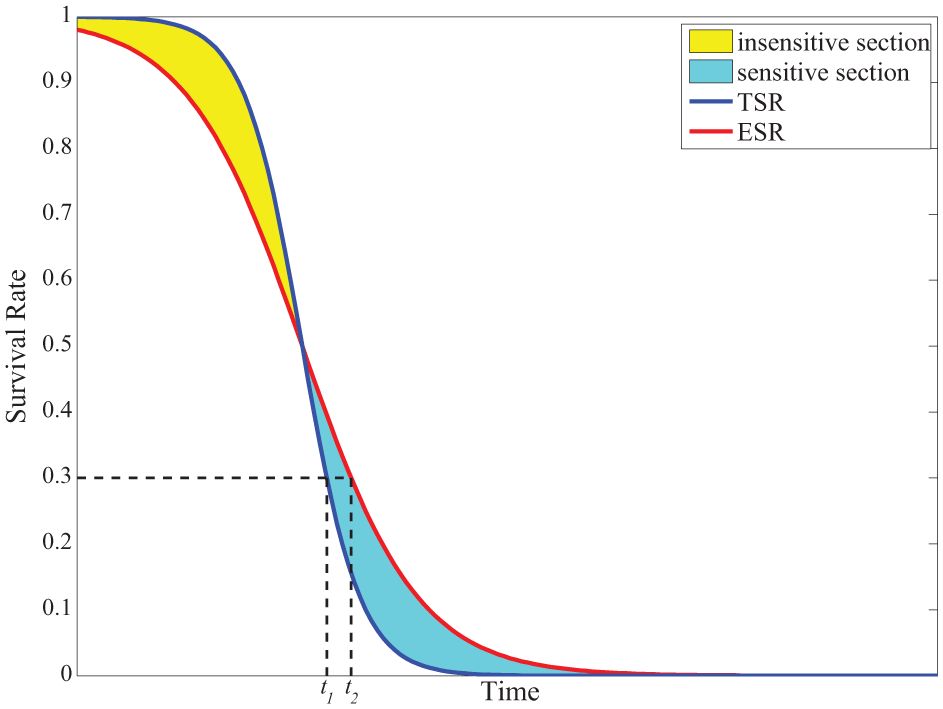
Classic survival rate model. The blue curve is the classic true survival rate (TSR), and the red curve represents the classic estimated survival rate (ESR). The insensitive section is the yellow area that the TSR is greater than the ESR, and the sensitive section is the cyan area that the ESR is greater than the TSR.
In Figure 4 , the yellow area where the TSR is larger than the ESR is called the insensitive section, and the cyan area is called the sensitive section, representing that the ESR is larger than the TSR. The insensitive error (insenErr) is defined as the ratio of the area of the insensitive section and the area under the TSR curve, and the sensitive error (senErr) is defined in a similar way. The estimated error is the sum of the insensitive error and the sensitive error. The sensitive error represents the error that the larva are detected as ones that have survived, whereas the insensitive error represents the opposite. In general, the sensitive error and the insensitive error are ambivalent for one algorithm. One decreases when the other increases. For the system, on one hand, the estimated error should be decreased as much as possible. On the other hand, it should be a tradeoff between the sensitive error and the insensitive error. For example, the ratio of the sensitive error and the insensitive error should be close to 1. Then the tradeoff error (trErr) is defined as

where b is a constant that can be set as 1.
Another evaluation criterion is lethality rate, which is the time difference between the ESR and the TSR when they have the same survival rate. For example, when the lethality rate is set as 0.3, the time difference between the ESR and the TSR is |t1 – t2|, as shown in Figure 4 . The lethality error is defined as

where lr is the lethality rate.
Results and Discussion
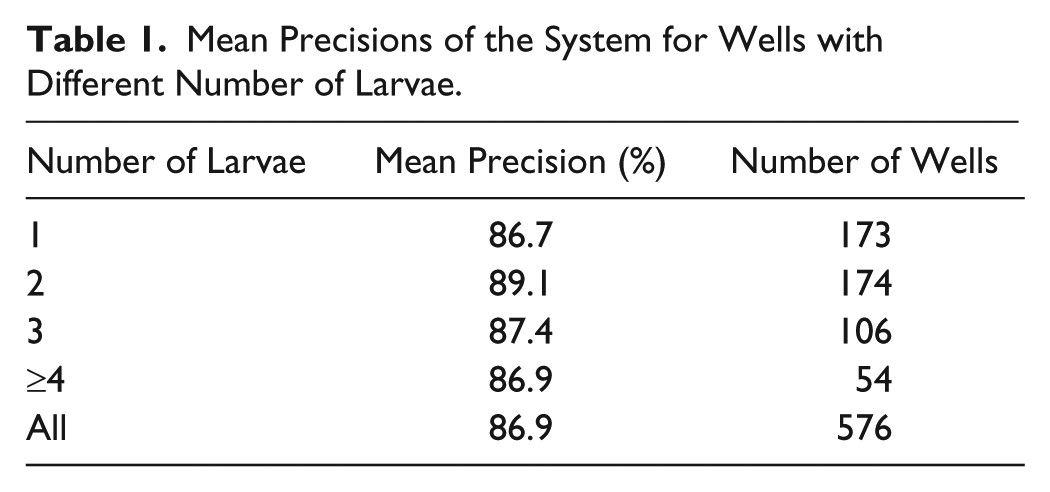
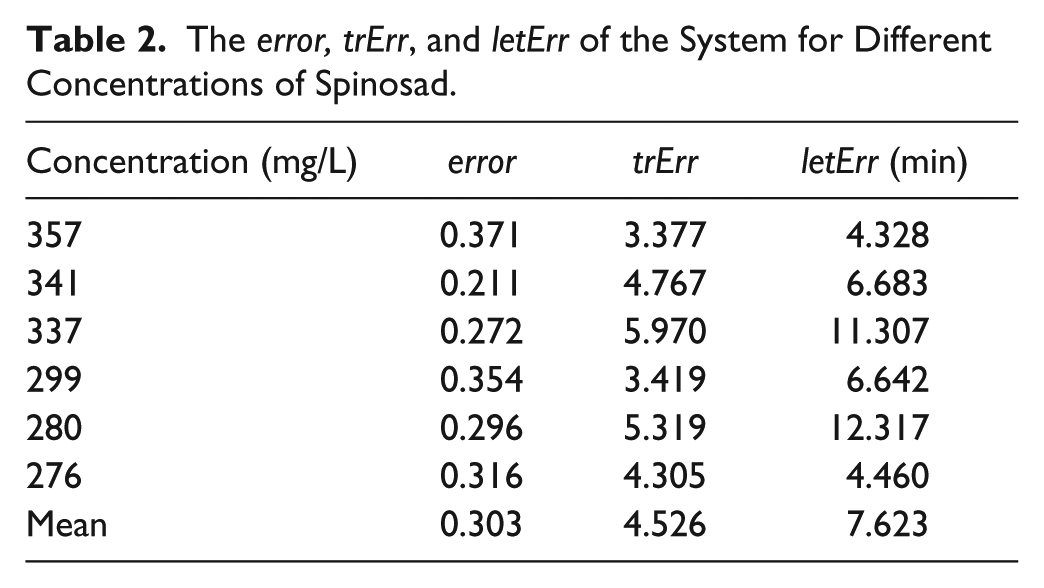
Figures 5 and 6 and Tables 1 and 2 illustrate the results of the system. Each line in Figure 5 shows the average accuracy of the ESR of each plate in the bioassays. Figure 6 compares the ESR and the TSR of the mosquito larvae in different concentrations of spinosad. The accuracy of the estimated survival state for the wells with a different number of larvae is presented in Table 1 . Table 2 shows the errors, trErrs, and letErrs of the system when using different concentrations of spinosad.
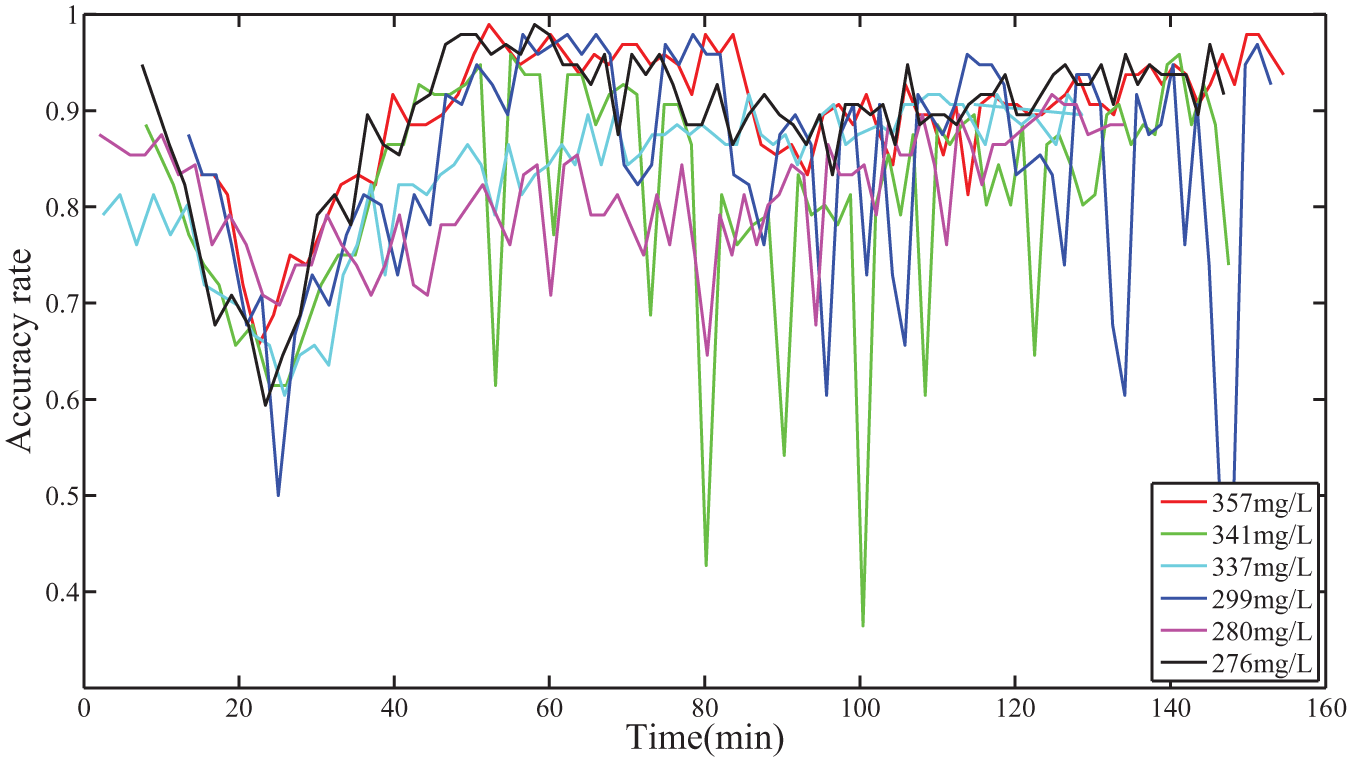
The average accuracy rate curves of mosquito larvae in different concentrations of spinosad in the bioassays. The red curve corresponds to the average accuracy rate when the concentration of spinosad is 357 mg/L, the green curve corresponds to 341 mg/L, the cyan curve corresponds to 337 mg/L, and blue curve corresponds to 299 mg/L, the magenta curve corresponds to 280 mg/L, and the black curve corresponds to 276 mg/L.
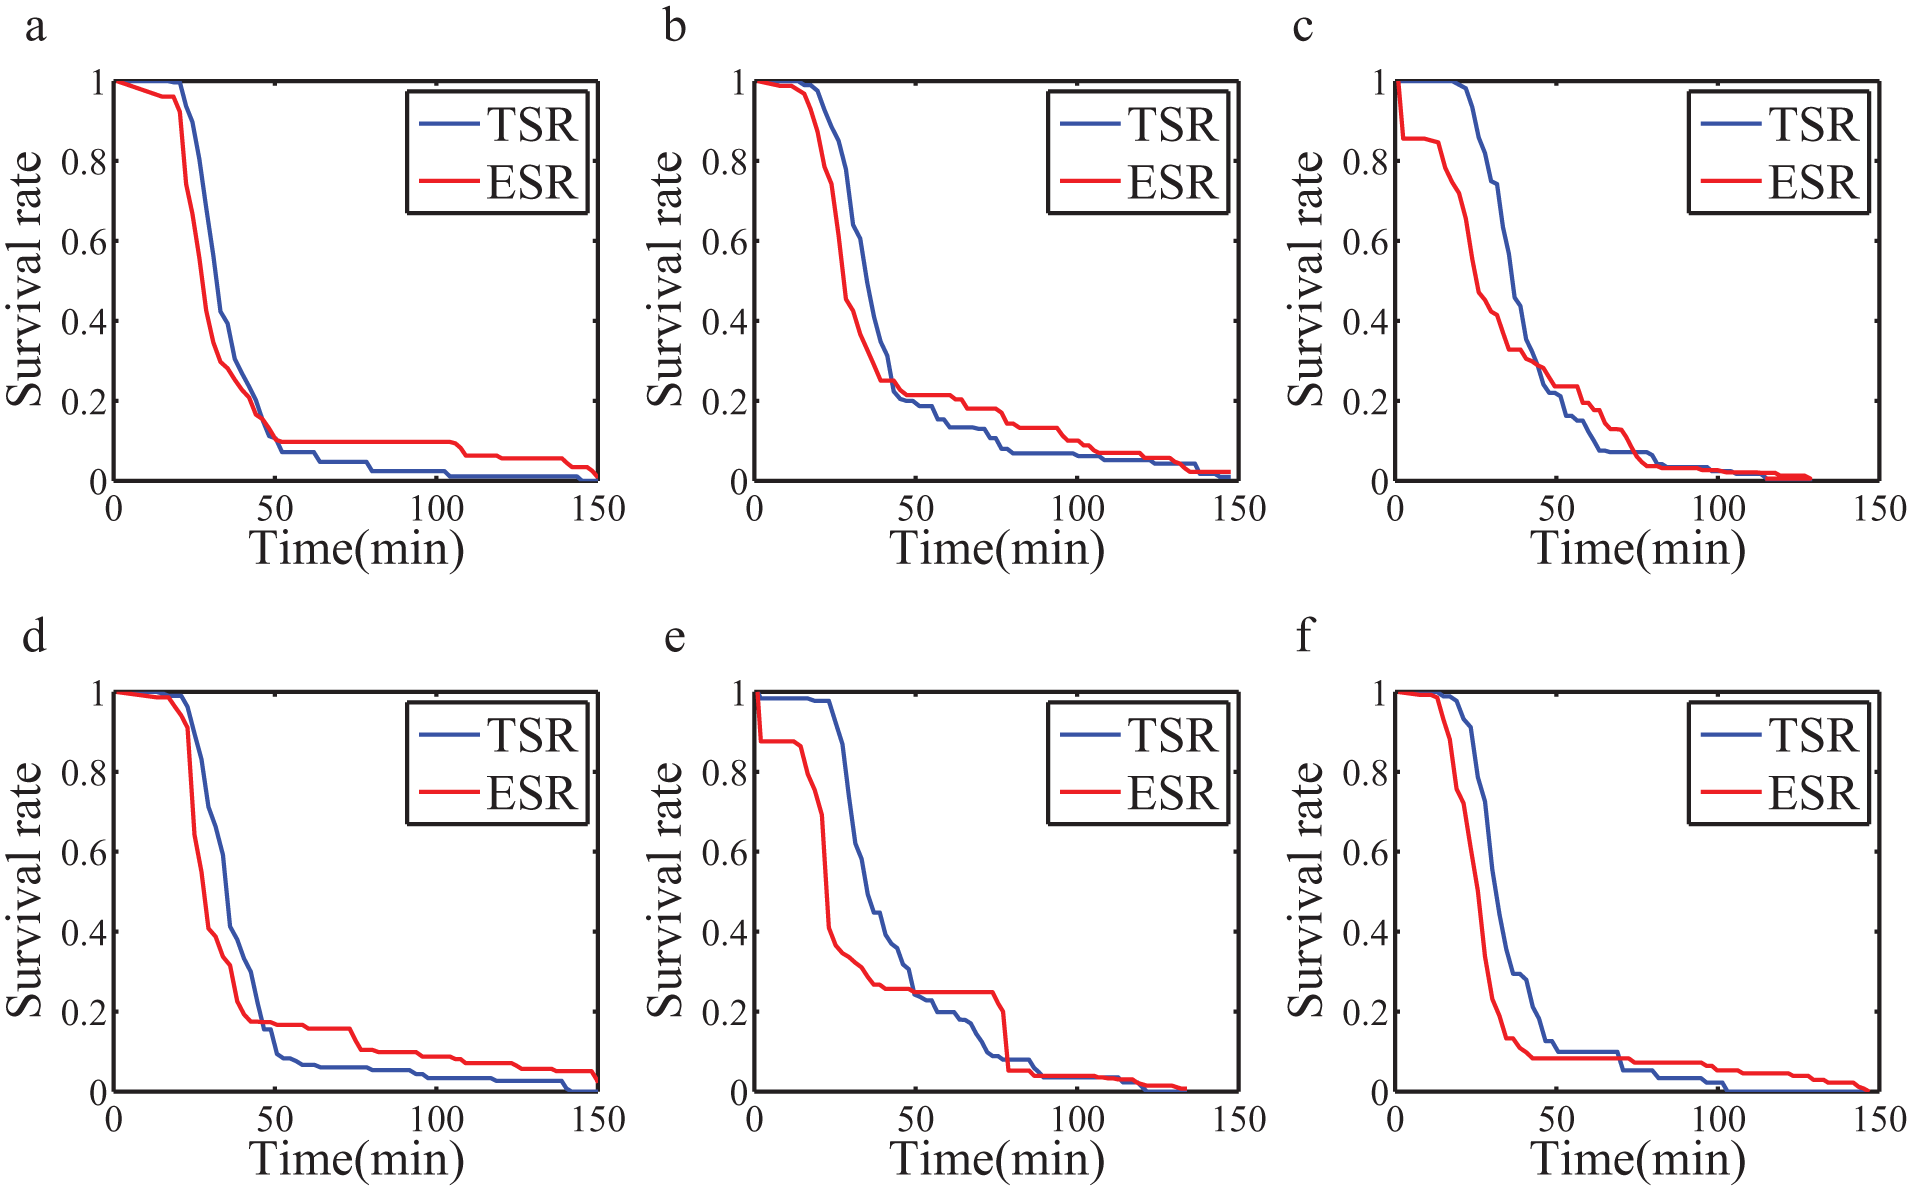
The survival rate of mosquito larvae in bioassays with different concentrations of spinosad. In each subimage, the blue curve represents the truth survival rate (TSR), and the red curve represents the estimated survival rate (ESR). Corresponding to the subimages, the concentrations of spinosad are (
Mean Precisions of the System for Wells with Different Number of Larvae.
The error, trErr, and letErr of the System for Different Concentrations of Spinosad.
In Figure 5 , the average accuracy of almost all videos for the six different concentrations of spinosad is greater than 0.8. From the average accuracy figure, we can see that the variations of concentrations do not influence the accuracy of the system. However, when the larvae enter the moribund state, they are reflected in varying degrees of convulsions. At this stage, the accuracy of the larval survival state is challenging. The average accuracy of our system declines to less than 0.7 in this stage, corresponding to the declines for all curves between 20 min and 40 min in Figure 5 .
The average accuracy for the wells with different numbers of larvae is about 86.9%, as shown in Table 1 . The results show that the accuracy of the estimated larval survival states remains stable even though the larval number in the wells varies. This means that the accuracy of our system is not affected by the number of mosquito larvae in each well.
The curves of the ESR and TSR for each concentration are shown in Figure 6 . In each subimage, the red curve is the TSR, which is labeled by a human, and the blue curve is the survival rate estimated by the system.
In Table 2 , the error of each different density is not related to the letErr. This means that letErr is not optimized when the error is minimized, as the system result is always expressed by the time the survival rate is equal to the lethality rate. However, the variation of trErr is similar to the letErr for our data set, which is more appropriate for evaluating the approach than the error. The mean letErr is about 8 min for our approach when the lethality rate is set to 50%. Also, the whole system can reach real time because the analysis procedure needs only 12 s for each short video.
To evaluate the system, the spinosad bioassays are used in the experiments, and the spinosad insecticides is an example. Our system is suitable for detecting and analyzing larval survival states in bioassays for different kinds of insecticides. Then, as the system focuses on the locational changes of the larvae, it can detect the survival states of many other genuses of mosquitoes. Also, our system can be applied to monitor bioassays not only with 96-well plates but also with other kinds of multiwell plates. These advantages will enable our system to have a wide range of applicability. For example, the system can sort the death time of the larvae in different wells when it is applied to monitor bioassays for screening insecticides. In addition, the developed system not only can be used in the mosquito larval bioassays but also can be applied to detect and analyze the behaviors of a large amount of other tiny animals, such as zebrafish embryos and drosophila larvae. For example, similar to the work by Spomer et al., 26 our system can be used for detecting zebrafish embryos from the imaging data of 96-well plates.
Conclusions
In this article, we presented a system to automatically acquire and analyze the video data of a large amount of mosquito larvae in the bioassays with multiwell plates. The proposed system efficiently detects the larval survival state of each well in each video by using the activities of larvae. A new algorithm of image registration for locating wells has been presented. To evaluate the analysis system, the survival state of larvae in each well is estimated by both the system and human. The estimated results of human are regarded as the benchmark. When the benchmark is 100%, the accuracy of our system is more than 85%. And three kinds of evaluation criteria have been presented to measure the approach by the survival rate in different concentrations of spinosad. Bioassays using six concentrations of spinosad have been used to evaluate the system. The experiments have shown that our system is stable and convenient for bioassays with different concentrations of insecticide. For its good performance, this system can be applied to detect and analyze the behavior of various larvae.
Footnotes
Declaration of Conflicting Interests
The authors declared no potential conflicts of interest with respect to the research, authorship, and/or publication of this article.
Funding
The authors disclosed receipt of the following financial support for the research, authorship, and/or publication of this article: This work is supported by the Shenzhen Key Lab of Information Theory & Future Network Arch under Grant ZDSYS201603311739428 and the Shenzhen Engineering Laboratory of Broadband Wireless Network Security.