
Abstract
This study presents a sensor strip for user-friendly, naked-eye detection of Xylella fasitdiosa, the bacterial causal agent of Pierce’s disease in grapevine. This sensor uses anti–X. fastidiosa antibodies conjugated to a polydiacetylene layer on a polyvinylidene fluoride strip to generate specific color transitions and discriminate levels of the pathogen. The detection limit of the sensor is 0.8 × 10⁸ cells/mL, which is similar to bacterial load in grapevine 18 days following bacterial inoculation. This sensor enables equipment-free detection that is highly desirable for in-field diagnostic tools in resource-limited settings.
Introduction
Xylella fastidiosa is a gram-negative, xylem-limited bacterium that was listed as one of the top 10 scientifically and economically important plant pathogenic bacteria in 2012. 1 It is the causal agent of Pierce’s disease (PD) in grapevine and is also responsible for a number of other economically devastating agricultural diseases, including phony peach disease, plum leaf scald, almond leaf scorch, and citrus variegated chlorosis.2,3 In addition, it has been implicated in a recent outbreak of olive quick decline syndrome in Italy. 4 Particularly, widespread PD epidemics have resulted in severe economic losses in grape production across the United States and parts of Mexico and Central America. 5 In California, where the primary vector for transmission is the glassy-winged sharpshooter, Homalodisca vitripennis, up to 50% of the vines in some vineyards have been reported with PD-related symptoms in a given year.3,6,7 Symptoms of PD include marginal leaf necrosis, leaf scorching, berry desiccation, and stunting of vines.5,8
Current methods to diagnose PD include detection of X. fastidiosa in plant tissue samples through optical or fluorescence microscopy, direct culturing, and enzyme-linked immunosorbent assay (ELISA).9–11 However, culturing and microscopy are time-consuming and, thus, inefficient. 11 ELISA is the currently favored method for high-throughput X. fastidiosa detection; nevertheless, this procedure requires a laboratory environment and trained operators to complete.9,12,13 More recently, quantitative polymerase chain reaction (qPCR) has been suggested as a highly sensitive detection method as compared to ELISA, but it has not been adopted widely due to costly and complicated protocols for DNA extraction and amplification.12,14 With the high incidence of PD in the United States and particularly California, a user-friendly, in-field device for X. fastidiosa detection would be an advantageous tool to prevent grapevine loss from the pathogen.
This study reports the development of a polydiacetylene (PDA)-coated “dipstick” sensor strip for quick and easy detection of X. fastidiosa. PDA is a class of amphiphilic lipid polymers known for their unique blue-to-red color transitions in response to stimuli such as high pH,15,16 high temperature,17–19 and molecular binding events.20,21 These chromatic properties have resulted in the popular use of PDA in a range of colorimetric biosensing applications in the form of liposomes,22–24 Langmuir–Blodgett films,25,26 strips,27–29 and others.30,31 The additional fluorescence “turn-on” characteristic of red-phase PDA is attributable to its use in the development of fluorescence-based sensors.32–34 Even more, recent investigations have taken advantage of the biocompatibility of PDA liposomes and used them in biomedical drug delivery systems.35,36 Its application as an injectable in planta sensor to monitor pathogenic infection of plants also has been suggested recently. 37 In this study, anti–X. fastidiosa antibodies were conjugated to the surface of PDA-coated strips of polyvinylidene fluoride (PVDF). When incubated in liquid cultures containing X. fastidiosa, the strips exhibited blue-to-pink transitions that were readily discernable by the naked eye. Recently, we reported a PDA strip sensor conjugated with DNA aptamer probes to selectively detect zinc ions in test samples. 27 The current study extends the capacity of this platform by using antibodies to demonstrate the detection of live bacteria, which is particularly relevant to agricultural disease diagnostics.
Materials and Methods
Materials
Diacetylene monomer, 10,12-pentacosadiynoic acid (PCDA), was purchased from Spectrum Chemicals (Gardena, CA), and 1,2-dimyristoyl-sn-glycero-3-phosphocholine (DMPC) was obtained from Avanti Polar Lipids (Alabaster, AL). Organic solvents and PVDF transfer membranes (EMD Millipore, 0.45 µm) were purchased from Fisher Scientific (Pittsburgh, PA). Anti–X. fastidiosa antibody was purchased from Agdia (Elkhart, IN). PD3 media, Luria–Bertani (LB) media, and LB agar were obtained from Difco Laboratories (Detroit, MI). All other compounds are research grade and were purchased from Sigma-Aldrich (St. Louis, MO).
Preparation of PCDA–NHS
Conversion of PCDA to a succinimide ester was carried out as previously reported. 27 Briefly, 0.25 g (0.72 mmol) of PCDA, 0.26 g (1.35 mmol) of N-(3-dimethylaminopropyl)-N’-ethylcarbodiimide hydrochloride (EDC-HCl), and 0.12 g (1.07 mmol) of N-hydroxysuccinimide (NHS) were dissolved in 4 mL of methylene chloride. The solution was stirred with a magnetic stirrer for 2 h at room temperature. The solvent was evaporated by a stream of nitrogen, and the residue was purified by extraction with ethyl acetate to yield PCDA–NHS monomers as a white solid; 1H nuclear magnetic resonance (NMR) (400 MHz, chloroform-d) δ ppm 0.89 (t, 3 H), 1.21–1.79 (m, 36 H), 2.25 (t, 4 H), 2.61 (t, 2 H), and 2.84 (br. s., 4 H) ( Supplementary Figure S1 ).
Preparation of Sensor Strips for X. fastidiosa Detection
A solution of PCDA–NHS (0.3 µmol), PCDA (3.3 µmol), and DMPC (2.4 µmol) was prepared in 500 µL chloroform. The total lipid concentration of the resulting solution was 6 mM. PVDF membrane was cut into strips using a guillotine cutter and scissors. The strips were dipped into and immediately removed from the diacetylene solution, then allowed to dry under ambient conditions in a fume hood (<10 s). The strips were then incubated in a solution containing 0.04 mg/mL of polyclonal anti–X. fastidiosa antibody for 4 h at room temperature or overnight at 4 °C. Following conjugation, the strips were incubated in 18.3 nM ethanolamine for 1 h to inactivate remaining NHS sites and remove any unconjugated antibody, rinsed in deionized water, and allowed to dry in the dark. Subsequent photopolymerization of the strips under a mask with 254 nm ultraviolet (UV) light (Spectroline E-series, 6 W) for 60 s yielded blue-colored tips ( Figure 1 ).
Preparation of X. fastidiosa–sensing strips. (
Bacterial Cultures
X. fastidiosa subsp. fastidiosa (Temecula-1) was streaked from a stock stored at −80 °C onto six PD3 agar plates and incubated at 28 °C for 6 days. Subsequently, 1 mL of PD3 media was added to each plate, and the cells were harvested by scraping them into the liquid. The liquid cell culture was then transferred from each plate into a conical tube and vortexed gently to resuspend cell clumps. The final volume of the culture was adjusted to 10 mL by addition of PD3 media with an OD600nm = 0.68. The concentration of the culture was determined to be 4.1 × 10⁸ cells/mL using a hemocytometer. The culture was stored at 4 °C until use to prevent additional cell growth.
Pantoea stewartii subsp. stewartii (DC283) and Escheri-chia coli BL21 (DE3) were used to test the specificity of the sensor strip. P. stewartii and E. coli were grown on solid LB agar at 28 °C and 37 °C, respectively. These were then used to inoculate an overnight culture in LB media shaken at the same temperature at 180 rpm for P. stewartii or 200 rpm for E. coli. The OD600nm was measured at 3.37 and 1.70, respectively. The concentrations of the cultures were determined to be 4.7 × 10⁸ cells/mL for P. stewartii and 3.6 × 10⁹ cells/mL for E. coli. The cultures were stored at 4 °C until use.
X. fastidiosa Detection and Sensor Analysis
Prepared strips were dipped into solutions containing various concentrations of X. fastidiosa from 0 to 4.1 × 10⁸ cells/mL in LB media at room temperature. All tests were performed in triplicate. Color images of strips were recorded using a Nikon D5100 digital camera after 1 h, 2 h, 3, h, and 4 h incubation in X. fastidiosa solutions. Data from collected images were extracted using ImageJ software as 8-bit red-green-blue (RGB) values ( Supplementary Table S1 ). Red chromatic shift (RCS) was calculated using digital colorimetric analysis, as previously described. 38 Briefly, the relative intensity of the red component (r) was first calculated as
The RCS was then determined by
where r0 (negative control) and rmax (positive control) were obtained from strips dipped in LB media and 1 M NaOH, 38 respectively. NaOH (pH = 14) readily induces blue-to-red PDA transitions and is commonly used as a positive control for the development of PDA sensors.38,39
Principal component analysis (PCA) was applied to the RGB data set ( Supplementary Table S1 and Supplementary Figure S2 ) using the Microsoft Excel add-in Multibase package (Numerical Dynamics, Tokyo, Japan). PCA is used to reduce the dimensionality of multivariate RGB data sets for statistical visualization.29,40,41 The transformation converts the data to a new PCA score plot, on which the axes are determined by orthogonal factors drawn from the data that maximize the variance of the data set.42,43
Results and Discussion
The prepared strips ( Figure 1 ) were incubated in liquid cultures of X. fastidiosa of varying concentrations from 0 to 4.1 × 10⁸ cells/mL. The strips were imaged after each hour throughout a 4 h period. After 4 h, they displayed a range of colors from blue to pink corresponding to increasing concentrations of X. fastidiosa culture ( Figure 2 ). The detection limit of the sensor was determined as the lowest concentration of bacterial cells that resulted in a color transition discernable by the naked eye. Accordingly, the detection limits at each hour were 1.2 × 10⁸ cells/mL after both 1 h (12.3% RCS) and 2 h (17.6% RCS), and 0.8 × 10⁸ cells/mL after 3 h (16.0% RCS) and 4 h (17.1% RCS). This indicates that an RCS of approximately 10–15% or greater is readily discernable by the naked eye, which also has been reflected in previous studies.24,44
X. fastidiosa detection by strips. (
After 4 h of incubation in X. fastidiosa solution, the strips displayed four distinct colors and three color transitions. The first transition was at 0.8 × 10⁸ cells/mL, the detection limit of the sensor, at which a blue-to-indigo transition occurred. This is reflected by a 17.1% RCS between strips incubated in 0 cells/mL (LB media) and 0.8 × 10⁸ cells/mL. The second transition occurred at 1.8 × 10⁸ cells/mL, at which an indigo-to-purple transition is denoted by a 9.6% RCS between strips in 0.8 × 10⁸ cells/mL and strips in 1.8 × 10⁸ cells/mL. The final purple-to-pink transition was at 2.7 × 10⁸ cells/mL, at which a 12.1% RCS is observed between strips in 1.8 × 10⁸ cells/mL and those in 2.7 × 10⁸ cells/mL. The multicolored spectrum displayed by the strips allows for semiquantitative naked-eye detection of X. fastidiosa, in which each color may indicate bacterial titer within the plant.
The detection limit of the strips at 0.8 × 10⁸ cells/mL after 4 h is comparable to the bacterial titer found in X. fastidiosa–infected grapevine tissue approximately 18 days after inoculation.7,45 Moreover, approximately 24 days after inoculation, the rate of disease transmission of infected grapevine increases considerably. 7 Notably, this 24-day transmission threshold aligns well with the second color transition (indigo to purple) of our sensor. This indicates that this sensor technology may not only have applications for direct pathogen detection but also could be advantageous for overall disease management. Specifically, a purple or pink transition may indicate that an increase in transmission rate is imminent. The sensor detection threshold for X. fastidiosa in planta is still relatively high in regard to early detection or presymptomatic detection, which warrants future optimization of the sensor to increase sensitivity.
PCA was used to distinguish the color transitions between successive X. fastidiosa concentrations with finer resolution than is discernable by the naked eye ( Figure 3 ). For this analysis, the first principal component (PC1) is expressed as PC1 = 0.76 × R + 0.44 × G − 0.47 × B, and the second principal component (PC2) as PC2 = −0.01 × R − 0.72 × G – 0.69 × B. The two-dimensional PCA score plot indicates that PC1 accounts for 53.8% of the total data variance and PC2 accounts for 41.3%. Notably, the PCA plot displays six distinct groups. This suggests that six distinct colors can be distinguished after 4 h by PCA quantification, as compared to four distinct colors detected by the unaided eye. In particular, the PCA plot confirms additional distinctions between strips incubated with 0.8 × 10⁸ cells/mL and 1.2 × 10⁸ cells/mL, as well as between strips incubated with 2.7 × 10⁸ cells/mL and 4.1 × 10⁸ cells/mL. PCA can be applied in future investigations of this sensing platform to provide finer discrimination of X. fastidiosa levels by the strips that are indistinguishable with the unaided eye. Furthermore, objective PCA of the sensor’s chromatic output can minimize the subjectivity of naked-eye color discriminations. Specifically, a smartphone application to provide user-friendly PCA of smartphone image inputs of the strips would facilitate aided in-field analysis and provide more accurate interpretations of the sensor results.
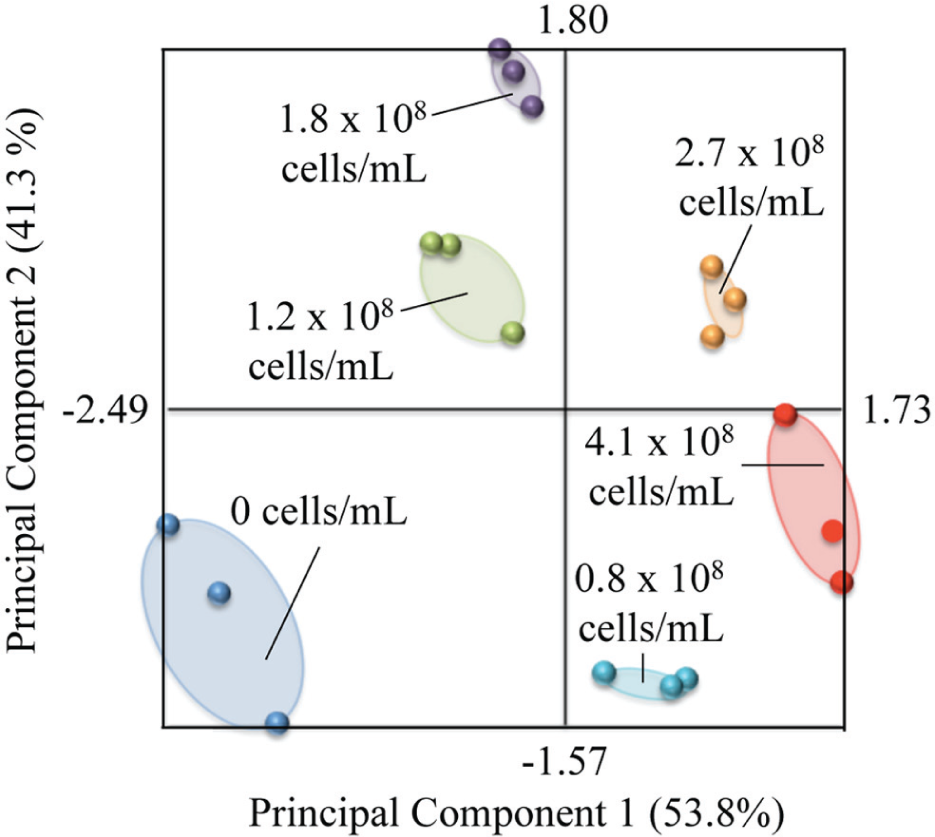
Principal component analysis (PCA) transformation of red-green-blue (RGB) values ( Supplementary Table S2 ). PCA facilitates additional discrimination of the sensor’s colors that is not discernable by the naked eye.
Finally, to test the specificity of the sensor with bacteria belonging to other taxonomic groups, strips were incubated with bacterial cultures containing 4.1 × 10⁸ cells/mL of either a plant-associated bacterium, P. stewartii (the causal agent for Stewart’s wilt in maize 46 ) or a laboratory strain of E. coli. RCS analysis of the strips after 4 h of incubation indicates that significant color transitions did not occur in cultures containing bacterium other than X. fastidiosa ( Figure 4 ). Specifically, RCS of strips incubated in 4.1 × 10⁸ cells/mL of X. fastidiosa are 7 times higher than those incubated in 4.1 × 10⁸ cells/mL of P. stewartii and 42 times higher than those in 4.1 × 10⁸ cells/mL of E. coli.
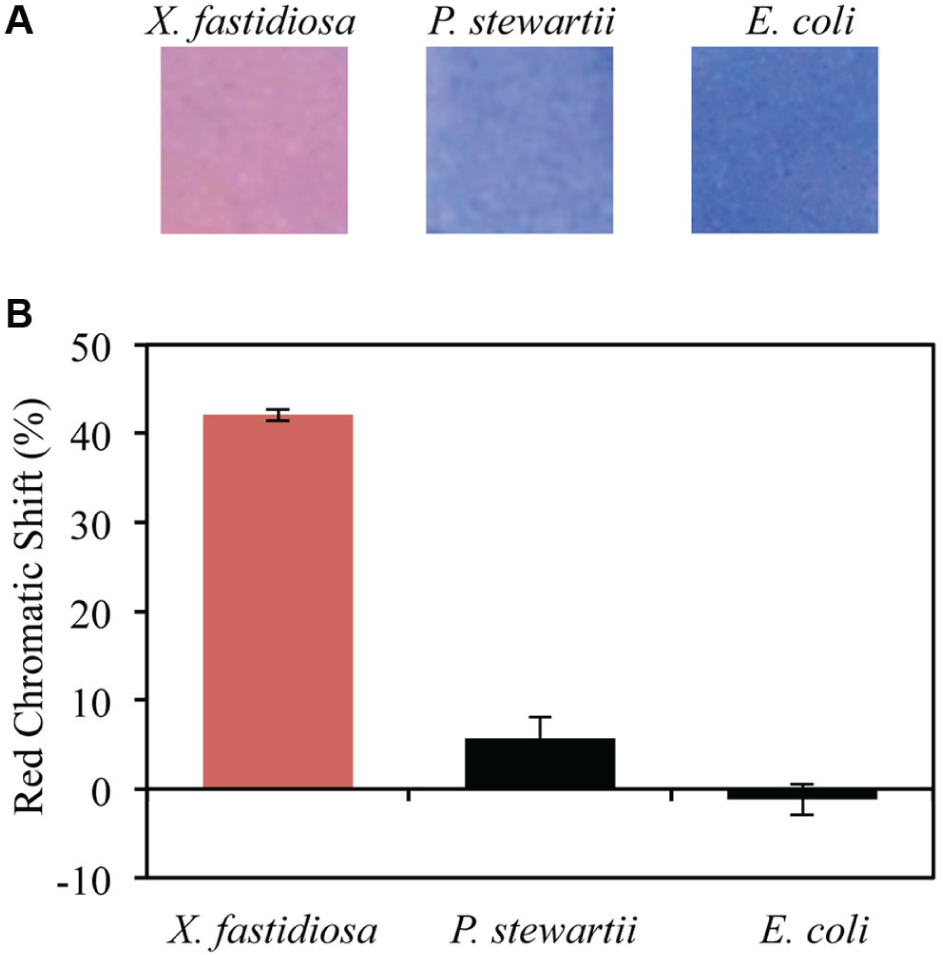
Specificity of the strips. (
Future development of this device includes testing the specificity of the strips against bacteria belonging to the Xanthomonadaceae, close relatives of X. fastidiosa, or other subspecies of X. fastidiosa. Improvement of the detection antibody itself is one approach to enhance the specificity of the X. fastidiosa detection. Alternatively, the development of an X. fastidiosa–specific DNA aptamer would offer an avenue to increase both the specificity and stability of the detection probe for in-field settings. Indirect methods to increase the specificity of the sensor involve conjugation of functional groups to the sensor’s matrix diacetylene head groups. One method is to tailor the surface charge of the sensor to decrease nonspecific interactions with unwanted objects. 47 Another method is to increase the strength of intermolecular bonding between matrix diacetylene head groups. 48 Particularly, increasing the strength of hydrogen bonds between diacetylene head groups will increase the energy input required to perturb the PDA backbone and cause a color shift. This would effectively increase sensor specificity. The latter approach, however, can also decrease sensor sensitivity, which will be taken into consideration in our future development.
In summary, we report a new sensor strip for naked-eye detection of X. fastidiosa. The detection limit of our sensor after 4 h of incubation is 0.8 × 10⁸ cells/mL, which is comparable to bacterial titer 18 days after vector transmission of the disease. 7 Even more, the color transitions exhibited by the strip are expected to provide critical information regarding disease transmission of infected grapevine. In addition, PCA suggests the potential to further discriminate X. fastidiosa levels through quantification of an image input. By foregoing the need for expensive detection instruments and reagents outside of leaf sample processing, this sensor platform is expected to have great potential for in-field use.
Footnotes
Supplementary material is available online with this article.
Declaration of Conflicting Interests
The authors declared no potential conflicts of interest with respect to the research, authorship, and/or publication of this article.
Funding
The authors disclosed receipt of the following financial support for the research, authorship, and/or publication of this article: This work was partially supported by the Bill & Melinda Gates Foundation through the Grand Challenges Explorations program (grant no. OPP1059995) and the UC Riverside Research and Economic Development Collaborative Seed Grant. Access to NMR facilities was provided by the UC Riverside Analytical Chemistry Instrumentation Facility.
References
Supplementary Material
Please find the following supplemental material available below.
For Open Access articles published under a Creative Commons License, all supplemental material carries the same license as the article it is associated with.
For non-Open Access articles published, all supplemental material carries a non-exclusive license, and permission requests for re-use of supplemental material or any part of supplemental material shall be sent directly to the copyright owner as specified in the copyright notice associated with the article.