
Abstract
A cell-based assay to measure cytochrome P450 3A4 (CYP3A4) induction was developed to screen for potential CYP3A4 inducers. This 96-well format assay utilizes HepG2 cells transfected with a gene construct of CYP3A4 proximal promoter linked to green fluorescence protein (GFP) gene, and the expression of the GFP is then measured quantitatively. Bergamottin at 5 to 25 µmol/L produced low induction relative to the positive control. Both curcumin and lycopene were not found to affect the expression of GFP, suggesting no induction properties toward CYP3A4. Interestingly, resveratrol produced significant induction from 25 µmol/L onward, which was similar to omeprazole and may warrant further studies. In conclusion, the present study demonstrated that this cell-based assay can be used as a tool to evaluate the potential CYP3A4 induction properties of compounds. However, molecular docking data have not provided satisfactory pointers to differentiate between CYP3A4 inducers from noninducers or from inhibitors, more comprehensive molecular screening may be indicated.
Introduction
Cytochrome P450 (CYP) enzymes are a group of heme-containing enzymes responsible for the metabolism of a variety of endogenous and exogenous substrates including pharmaceuticals. Generally, these enzymes catalyze the conversion of compounds to metabolites of increased polarity which are then rapidly eliminated. Drug metabolism is a major determinant of drug clearance and is an important factor that influences the pharmacokinetics of drugs. In human, the cytochrome P450 3A4 (CYP3A4) is the most abundant enzyme present in both liver and intestine, and it represents approximately 30% to 50% of the total CYP enzymes in these tissues. 1 -3 About 50% of clinically used pharmaceuticals are metabolized by CYP3A4, therefore, interactions with these enzymes by other drugs or herbal components could lead to significant changes in the drug’s pharmacokinetic and pharmacodynamic properties. 4,5
A variety of interactions of herbs or foods with drugs have been well documented. 6 -9 Herbal medicines contain phytochemicals that are capable of inhibiting or inducing drug-metabolizing enzymes. A typical and well-known example is the herbal antidepressant, St John’s wort (Hypericum perforatum L). It modulates CYP3A4 activity, leading to a decrease in plasma drug concentration. 10 -12 St John’s wort is known to cause significant reduction in the plasma concentration of indinavir, 13 cyclosporine, 14 -16 amitryptiline, 17 and imatinib mesylate. 18 It is of an increasing importance that herbal components in traditional or alternative medicine be evaluated for their effects on these cytochromes as such data would be useful for both health care professionals and the public.
Cytochrome enzyme induction-mediated interaction is an important factor affecting drug biotransformation. 19,20 Nuclear receptor such as pregnane X receptor (PXR) is involved in regulating CYP3A gene expression and is known to play a major role in the transcriptional mechanism of CYP3A4 induction. 21 -24 Most CYP3A4 inducers bind to this nuclear receptor and regulate the gene transcription and expression of the enzyme, resulting in an increased metabolism rate and subsequently, poor drug efficacy and loss of pharmacological effect. Certain chemicals, rifampicin for instance, activate PXR in a ligand binding manner. 25 The activated PXR heterodimerizes with retinoid X receptor (RXR) and binds to xenobiotic response elements, which is located within the CYP3A4 promoter region. This binding causes cooperative interaction with the promoter region of CYP3A4 and activates the transcriptional activity of CYP3A4. 26 -29 Thus, early identification of PXR activators is important to predict possible interactions with CYP3A4 and this can be complimented using in silico tools.
To determine whether a new chemical entity is a CYP inducer, the messenger RNA (mRNA) changes are usually measured. 30 According to Fahmi and co-workers, mRNA fold-induction is more sensitive and informative as compared with enzymatic activity data. 31 However, to validate the mRNA expression, Western blot analyses are usually carried out, which are qualitative and rely very much on the quality of the antibodies used. In this study, a medium throughput assay to measure the CYP3A4 protein expression was developed to complement the polymerase chain reaction (PCR)-based methods. This assay utilizes HepG2 cell transfected with a gene construct of CYP3A4 proximal promoter linked to green fluorescence protein (GFP) gene where the expression of the GFP will be regulated by the human CYP3A4 proximal promoter and the signal intensity of GFP can be quantitatively measured. Several natural compounds were evaluated for their binding properties on PXR in silico and subsequently, their possible induction effects on CYP3A4 were determined.
Materials and Methods
Materials and Cell Culture
OptiPlate 96F was purchased from PerkinElmer (Finland). Dexamethasone, rifampicin, nifedipine, omeprazole, furafylline, quinidine, β-naphthoflavone, dimethyl sulfoxide (DMSO), kanamycin, and natural compounds such as bergamottin, curcumin, lycopene, and resveratrol were purchased from Sigma-Aldrich (St. Louis, MO, USA). Ketoconazole was obtained from LKT Laboratories (St. Paul, MN, USA). Minimal essential medium (MEM), fetal bovine serum (FBS), penicillin and streptomycin solution, 0.25% (v/v) trypsin–EDTA, Geneticin (G418 sulfate) and Opti-MEM I Reduced Serum Medium (Opti-MEM) were from Gibco (Waltham, Massachusetts, USA). QIAamp DNA Mini kit, QIAprep Spin Miniprep kit, and Plasmid Midi kit were from Qiagen (Germany). Wizard SV Gel and PCR Clean-Up System, and CellTiter 96 AQueous One Solution Cell Proliferation Assay (MTS) were purchased from Promega (Madison, WI, USA). Lipofectamine LTX with PLUS reagent was obtained from Invitrogen (Waltham, Massachusetts, USA). T4 DNA Ligase and ProteoJET mammalian cell lysis reagents were purchased from Fermentas (Waltham, Massachusetts, USA). PciI and NheI restriction enzymes were purchased from New England Biolabs (Ipswich, Massachusetts, USA). Plasmid pAcGFP-C1 containing a G418 sulfate resistant gene was obtained from Clontech (Mountain View, CA, USA). The human PXR expression vector, pSG5-hPXR, was a gift from Steven A. Kliewer (University of Texas Southwestern Medical Center, Texas, USA). The HepG2 cells were obtained from the American Type Culture Collection (ATCC, Manassas, VA, USA) and were cultured in MEM supplemented with 10% (v/v) FBS, 100 U/mL of penicillin, 100 µg/mL of streptomycin, 1% (v/v) sodium pyruvate, 1% (v/v) sodium bicarbonate, and 1% (v/v) nonessential amino acid. The cells were incubated at 37°C in a humidified incubator supplemented with 5% (v/v) CO2.
Construction of Recombinant Plasmid, pAcGFP-P3A4
Human genomic DNA was isolated from HepG2 cell line using QIAamp DNA Mini kit (Germany) according to manufacturer’s protocol. To amplify human CYP3A4 proximal promoter region, primers were designed using Primer-Basic Local Alignment Searching Tools (BLAST; www.ncbi.nlm.nih.gov/tools/primer-blast) with the following sequence: forward primer 5′-AAA CAT GTG ACC TGC AGT GAC CAC-3′, reverse primer 5′-AAA GCT AGC GTG TTG CTC TTT GCT-3′. All primers were synthesized by Bioneer (Korea). These primers were designed based on the CYP3A4 promoter sequence as reported by Hashimoto and coworkers 32 which encompasses bases −1108 to +54 with additional restriction site for PciI and NheI. The PCR conditions consisted of initial activation at 95°C for 5 minutes followed by 35 cycles of 94°C for 15 seconds, 58°C for 1 minute and 72°C for 70 seconds, and final extension at 72°C for 10 minutes. The ∼1.1 kb PCR fragment was purified using Promega Wizard SV Gel and PCR Clean-Up System (USA) following the manufacturer’s protocol. Subsequently, the purified PCR product and the GFP vector, pAcGFP-C1 (Clontech) were digested with restriction enzyme PciI and NheI. The human cytomegalovirus (CMV) promoter from pAcGFP-C1 was removed in this step. The digested PCR fragment was subsequently cloned into pAcGFP-C1 lacking the CMV promoter by ligation at 4°C overnight. Subsequently, the ligation mixture was used for bacterial transformation using Escherichia coli strain DH5α. The bacterial colony containing the insert was propagated and the recombinant plasmid was isolated. The plasmid was further analyzed using restriction enzyme digestion and by DNA sequencing.
Cell Proliferation Assay
Cell proliferation assay was carried out to determine the minimum concentration of G418 sulfate required to select stably transfected HepG2 cells. Briefly, HepG2 cell was plated onto a 96-well plate (Corning, NY, USA) and incubated at 37°C in humidified incubator supplemented with 5% (v/v) CO2. When cells reached approximately 70% confluence, the medium was removed and replaced with medium containing only 0.5% (v/v) FBS. The cells were incubated for a further 4 hours before treated with various concentrations of G418 sulfate. Cell culture media with G418 sulfate was changed every 3 days. After 7 days, the cell proliferation was measured using Promega CellTiter 96 AQueous One Solution Cell Proliferation Assay. The absorbance was measured at 490 nm using EnVision2104 Multilabel plate reader (PerkinElmer, Waltham, MA, USA). The cell proliferation curve was plotted using curve fitting program, and IC50 value was calculated using GraphPad Prism 3.0.
Transfection of pAcGFP-P3A4 by Electroporation
The pAcGFP-P3A4 recombinant plasmid was transfected into HepG2 cells using electroporation as described by Cemazar et al. 33 Briefly, an approximate number of 2 × 10⁶ cells and 5 µg of plasmid DNA were subjected to a single electric pulse of 240 V for 30 ms using Gene Pulser Xcell Electroporation System (Biorad, Hercules, CA, USA). Subsequently, the cells were grown in a 6-well plate (Nunc, Rochester, NY, USA) and incubated for 48 hours before replacing with medium containing an optimized concentration of G418 sulfate. The medium was changed every 3 days for several weeks. Stable clones were observed under inverted fluorescence microscope using excitation filter 470 to 490 nm and emission filter at 520 nm (Olympus IX 71, Japan). The colonies of cells with positive GFP signal were manually selected and cultured continuously in G418 sulfate-containing medium for more than 3 months. Finally, homogenously GFP-expressing cells (hCYP3A4-HepG2) were used for the cell-based assay.
Optimization of GFP Signal Intensity in 96-Well Plate Format
The optimizations of GFP signal measurement were based on sample preparation (live cell or cell lysate) and reading mode (bottom reading mode [live cells], bottom reading mode [cell lysate], and top reading mode [cell lysate]). HepG2 cells and HepG2 cells stably transfected with pAcGFP-C1 (AcGFP-HepG2) and hCYP3A4-HepG2 cells were seeded into 96-well clear bottom black plate for direct bottom reading mode (live cells) and 96-well clear plate for cell lysate. Briefly, the cells were incubated at 37°C in humidified incubator supplemented with 5% (v/v) CO2. After 48 hours, cells were washed twice with prewarmed phosphate-buffered saline (PBS). For bottom reading mode (live cells), 100 µL of prewarmed PBS was added into each well followed by GFP intensity measurement using excitation filter 475 nm (bandwidth = 5 nm) and emission filter 505 nm (bandwidth = 5 nm) using EnVision 2104 multilabel plate reader (PerkinElmer, Finland). For bottom reading mode of cell lysate, cells were washed twice with prewarmed PBS and then lysed with 100 µL of ProteoJET mammalian cell lysis buffer (Fermentas). Next, the plate was agitated at 800 rpm using Thermomixer (Eppendorf, Germany) for 15 minutes. Cell lysate was collected by centrifuging the plate at 1400 rpm for 20 minutes before transferring 80 µL of the cell lysate into a new 96-well clear bottom black plate, and the GFP intensity was measured as described previously. In addition to bottom reading, top reading mode was also carried out using cell lysate in 96-well black opaque plates. The signal over background (S/B) ratio was determined by dividing the signal from hCYP3A4-HepG2 over HepG2 cells.
Transfection of hPXR and Validation of Assay
Human PXR expression vector, pSG5-hPXR, was transfected into the stable cells as part of assay optimization. Briefly, an optimized amount of PXR expression vector diluted with Opti-MEM solution, PLUS reagent and Lipofectamine LTX were mixed with the cells prior to the assay. For assay validation, near confluent HepG2 and hCYP3A4-HepG2 cells were seeded into plates and after 24 hours, cells were transfected with the optimized amount of pSG5-hPXR and incubated for further 24 hours. Prior to treatment with compounds, cells were cultured in MEM containing 0.5% (v/v) FBS for 4 hours. Subsequently, the cells were treated with compounds dissolved in DMSO or methanol (for ketoconazole only) and in all experiments, the final solvent concentration was not more than 0.1% (v/v). The GFP intensity was measured according to the optimized format after 48 hours. The hCYP3A4-HepG2 cells were treated with both clinically known CYP3A4 inducers (dexamethasone, rifampicin, nifedipine, and omeprazole) and inhibitor (ketoconazole). Various non-inducers or non-inhibitors such as furafylline and quinidine and a known aryl hydrocarbon receptor (AhR) activator such as β-naphthoflavone were also evaluated. Subsequently, natural compounds such as bergamottin, curcumin, lycopene, and resveratrol were assessed for their possible CYP3A4 induction activities.
Molecular Docking and Simulation of Compounds Within PXR Molecule
The structures of compounds were constructed using ACD/ChemSketch Freeware Version 11.01 (Advanced Chemistry Development, Inc, Canada) and optimized using PRODRG server (http://davapc1.bioch.dundee.ac.uk/prodrg/). 34 The crystal structure of human PXR in complex with hyperforin (Protein Data Bank [PDB] ID: 1M13) 35 was retrieved from the RCSB PDB; http://www.rcsb.org). 36 Molecular docking simulation on human PXR was carried out using the AutoDock 4.2.6 software package, 37 whereas the docking files were prepared using the AutoDockTools 1.5.6 RC3 package. A grid map of 60 × 60 × 60 points at the position of 10.096, 76.853, and −1.643 in the x, y, and z coordinates with a spacing of 0.375 Å between the grid points was set. The Lamarckian genetic algorithm was used for the ligand conformational search and 100 independent docking runs were made. The docked conformations of the ligands were ranked into clusters based on the increasing order of binding energy. The molecular interactions of the ligands with human PXR were analyzed using the Accelryls Discovery Studio 4.0 (Accelrys, Inc, San Diego, CA, USA). Parameters such as hydrogen bonding and hydrophobic interactions with human PXR residues, free energy of binding (FEB), estimated inhibition constant (K i ), and bond distance were compared with positive and negative controls.
Data Analysis
Fold change was calculated by dividing the mean relative fluorescence unit (RFU) values from compound treated cells to the RFU values from DMSO or methanol (for ketoconazole)-treated cells.
38
-40
Data were expressed as the mean
Results
Molecular Cloning of Recombinant Plasmid, pAcGFP-P3A4
After double digestion with restriction enzyme PciI and NheI, human CMV promoter was removed from the commercial plasmid (Figure 1A). The pAcGFP-C1 without CMV promoter was used to ligate with human CYP3A4 promoter to produce recombinant plasmid, pAcGFP-P3A4, which is approximately 5.3 kb in size. Double digestion of pAcGFP-P3A4 with PciI and NheI produced 2 fragments at about 1.1 and 4.2 kb, respectively, indicating that the human CYP3A4 proximal promoter was successfully inserted into the pAcGFP-C1 (Figure 1A and B). The PCR amplification using primer set as described earlier confirmed the presence of human CYP3A4 proximal promoter in this recombinant plasmid (Figure 1C). The insert was subsequently sequenced and validated using BLAST in National Center for Biotechnology Information and confirmed to be human CYP3A4 proximal promoter.
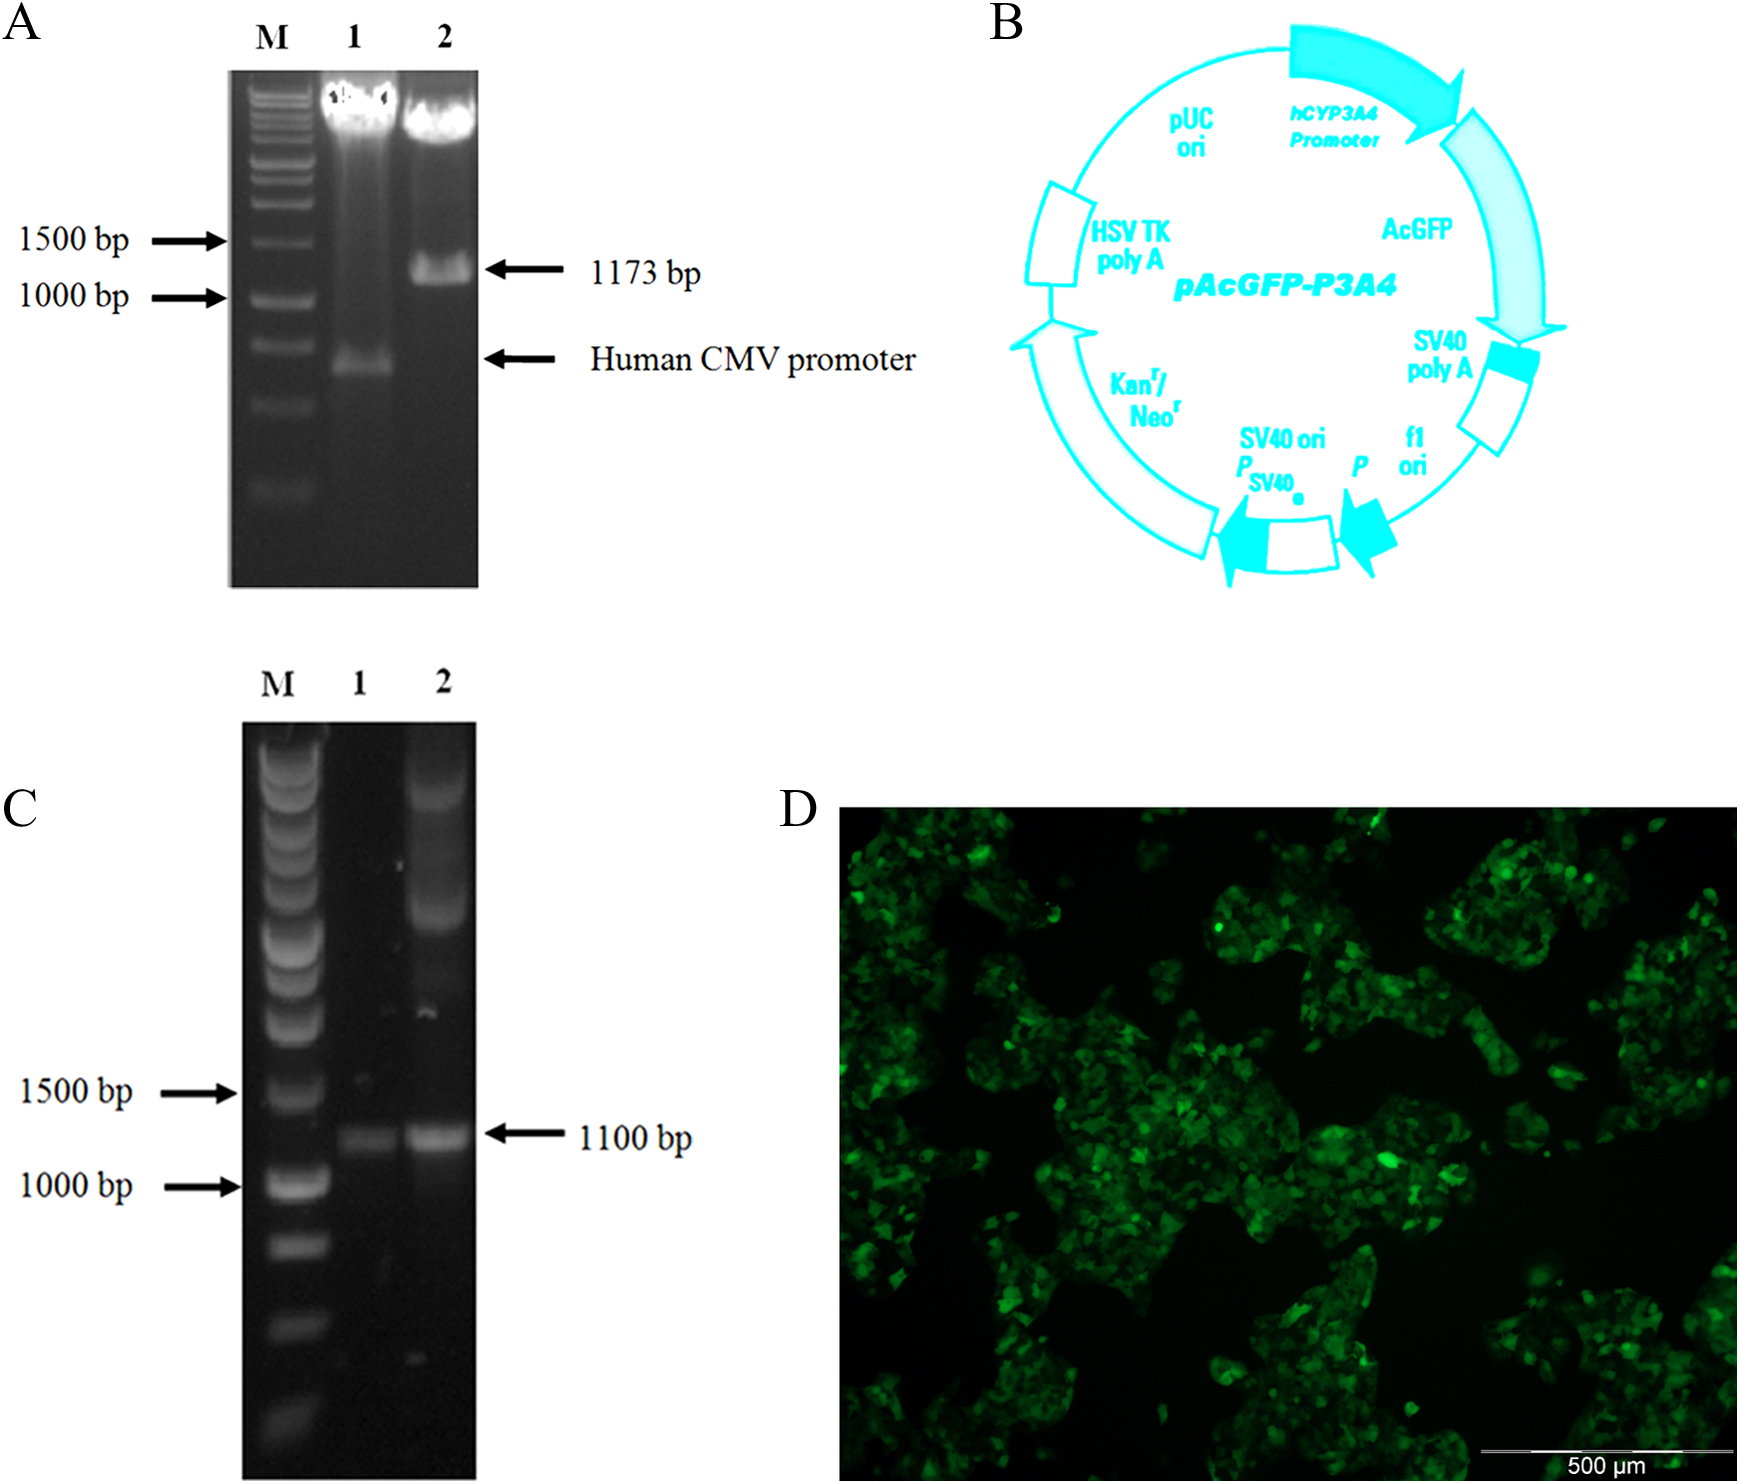
A, Double digestion of plasmid with restriction enzyme PciI and NheI produced 2 fragments at 1.1 kb and 4.2 kb (Lane 1: restricted enzyme (RE) digested pAcGFP-C1; Lane 2: RE digested pAcGFP-P3A4. B, Plasmid map of pAcGFP-P3A4, which is approximately 5.3 kb in size. C, PCR amplification on genomic DNA extracted from HepG2 (Lane 1) and pAcGFP-P3A4 (Lane 2) confirmed the presence of human CYP3A4 proximal promoter in this recombinant plasmid. D, HepG2 cells were successfully transfected with the recombinant plasmids and expressing GFP. PCR indicates polymerase chain reaction; GFP, green fluorescence protein.
Establishment of the Recombinant Cell Line and Optimization of GFP Measurement Mode in 96-Well Plate Format
The HepG2 cells were successfully transfected with the recombinant plasmid, pAcGFP-P3A4, using electroporation. After continuous culture in 400 µg/mL G418 sulfate for 3 months, the recombinant hCYP3A4-HepG2 cell line was established as shown in Figure 1D. The concentration of G418 used (IC50) was determined using the cell proliferation assay as described earlier. These cells were homogenously expressing GFP, which was expected as CYP3A4 is known to be continuously expressed in HepG2 cells. The optimization of GFP signal measurement was based on sample preparation and reading mode. The S/B ratio for each reading mode was determined to select the optimal detection mode, which reflects how robust the signal produced by the sample distinct from the background. The S/B ratio for direct bottom reading mode using live cells was 5.22. As for bottom reading mode using cell lysate, the S/B ratio was the lowest (3.87) as compared with the top reading mode using cell lysate in black opaque plate, which produced the highest value (10.56). These results indicated that cell lysate with top reading mode using black opaque plate was the optimum measurement mode of GFP signal intensity in a 96-well plate format. This optimized reading format was used in subsequent experiments. Since the cells were lysed and the intensity of released GFP was measured in this assay, the microscopic images of cells before and after treatment were not compared.
Validation of Assay With Known Human CYP3A4 Inducers and the Effects of Natural Compounds on the GFP Expression
The protein expression of human CYP3A4 represented by the signal intensity of GFP was determined using the optimized hCYP3A4-HepG2 cell–based assay as described earlier. This assay system was further validated using clinically known human CYP3A4 inducers (dexamethasone, rifampicin, nifedipine, and omeprazole), human CYP3A4 inhibitor (ketoconazole), as well as drugs such as furafylline, quinidine, and β-naphthoflavone as noninducers for their CYP3A4 activity. The effects of these compounds on human CYP3A4 expression were evaluated by measuring the GFP signal intensity as described earlier. Overall, the signal intensity measurements for all positive controls did not exceed 2-fold change as compared with baseline reading. However, a clear trend of an increasing expression for all the inducers was observed.
As expected, the hCYP3A4-HepG2 cells treated with dexamethasone elicited significant induction of GFP, with a mean fold change of 1.61 ± 0.20 at 5 µmol/L as compared with untreated cells (Figure 2A). Concentrations starting from 0.1 μmol/L and above produced a rather narrow range of induction from 1.39 ± 0.05 to 1.34 ± 0.16-fold change, respectively. Similarly with rifampicin, concentration as low as 0.1 µmol/L produced an induction of 1.44 ± 0.08-fold, and induction appears to be consistent as the concentration increases (Figure 2B). Nifedipine demonstrated a much higher range of induction ranging from 1.59 ± 0.07 to 1.63 ± 25-fold change from 0.1 to 25 µmol/L (Figure 2C). As for omeprazole, induction was insignificant from 0.1 to 10 µmol/L but was significantly induced from 25 µmol/L and onward (1.29 ± 0.14 to 1.37 ±0.13-fold changes; Figure 2D). On the other hand, as an AhR activator, β-naphthoflavone produced a dose-dependent increase in the expression of GFP with significant induction from 5 µmol/L onward, and the highest induction was recorded at 1.64 ± 0.14-fold (Figure 2E). As for ketoconazole, significant inhibition of GFP expression was only observed from 25 µmol/L onward, although the magnitude was rather small (Figure 2F). Both furafylline and quinidine have no significant effects on GFP expression using this assay, and this was expected (Figure 2G and H).
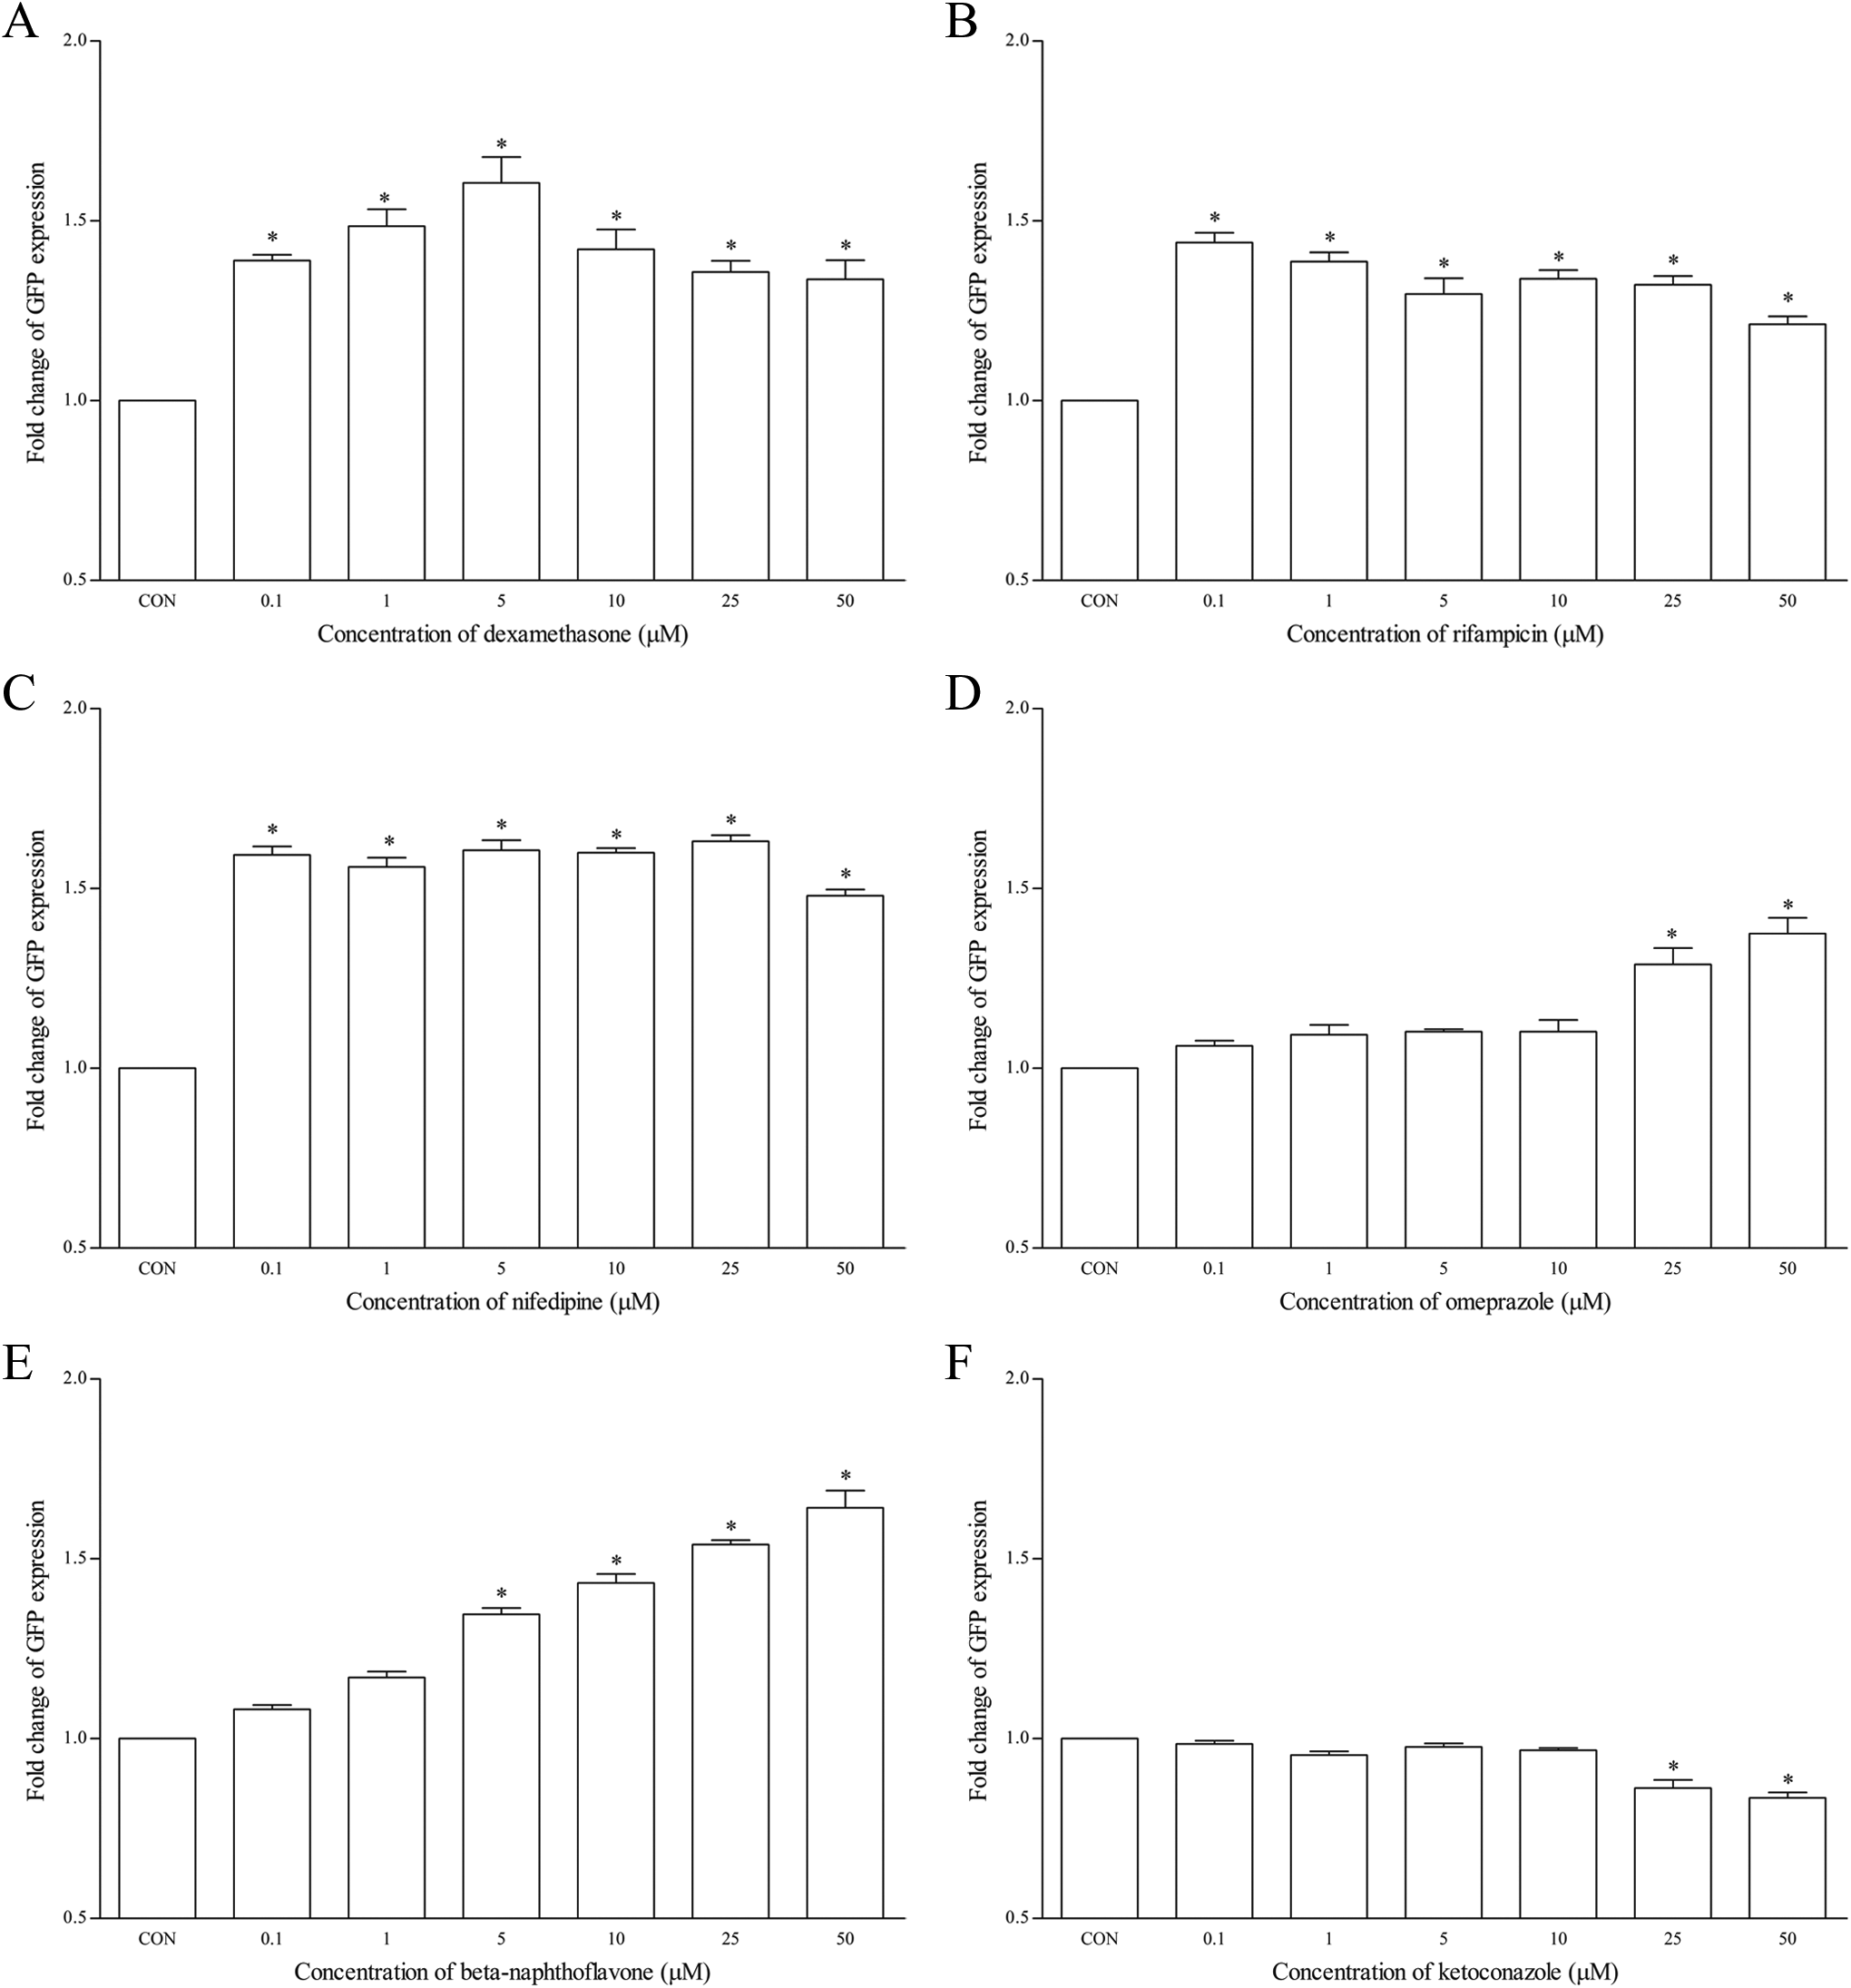
The effects of (A) dexamethasone, (B) rifampicin, (C) nifedipine, (D) omeprazole, (E) β-naphthoflavone, (F) ketoconazole, (G) furafylline, and (H) quinidine on GFP expression using hCYP3A4-HepG2 cell-based assay after 48 hours of treatment. Data are presented as the mean fold change of GFP expression ± SD of 3 independent experiments. *P < .05. CON indicates control; GFP, green fluorescence protein.
Subsequently, the recombinant cells were treated with natural compounds using a range of concentrations as described previously. Bergamottin at 5 to 25 µmol/L produced low induction relative to the positive control (Figure 3A). As for curcumin and lycopene, both of these compounds did not appear to affect the expression of CYP3A4 (Figure 3B and C). Interestingly, resveratrol produced significant induction only from 25 µmol/L onward, with highest induction of 1.77 ± 0.06-fold change at 50 µmol/L (Figure 3D).
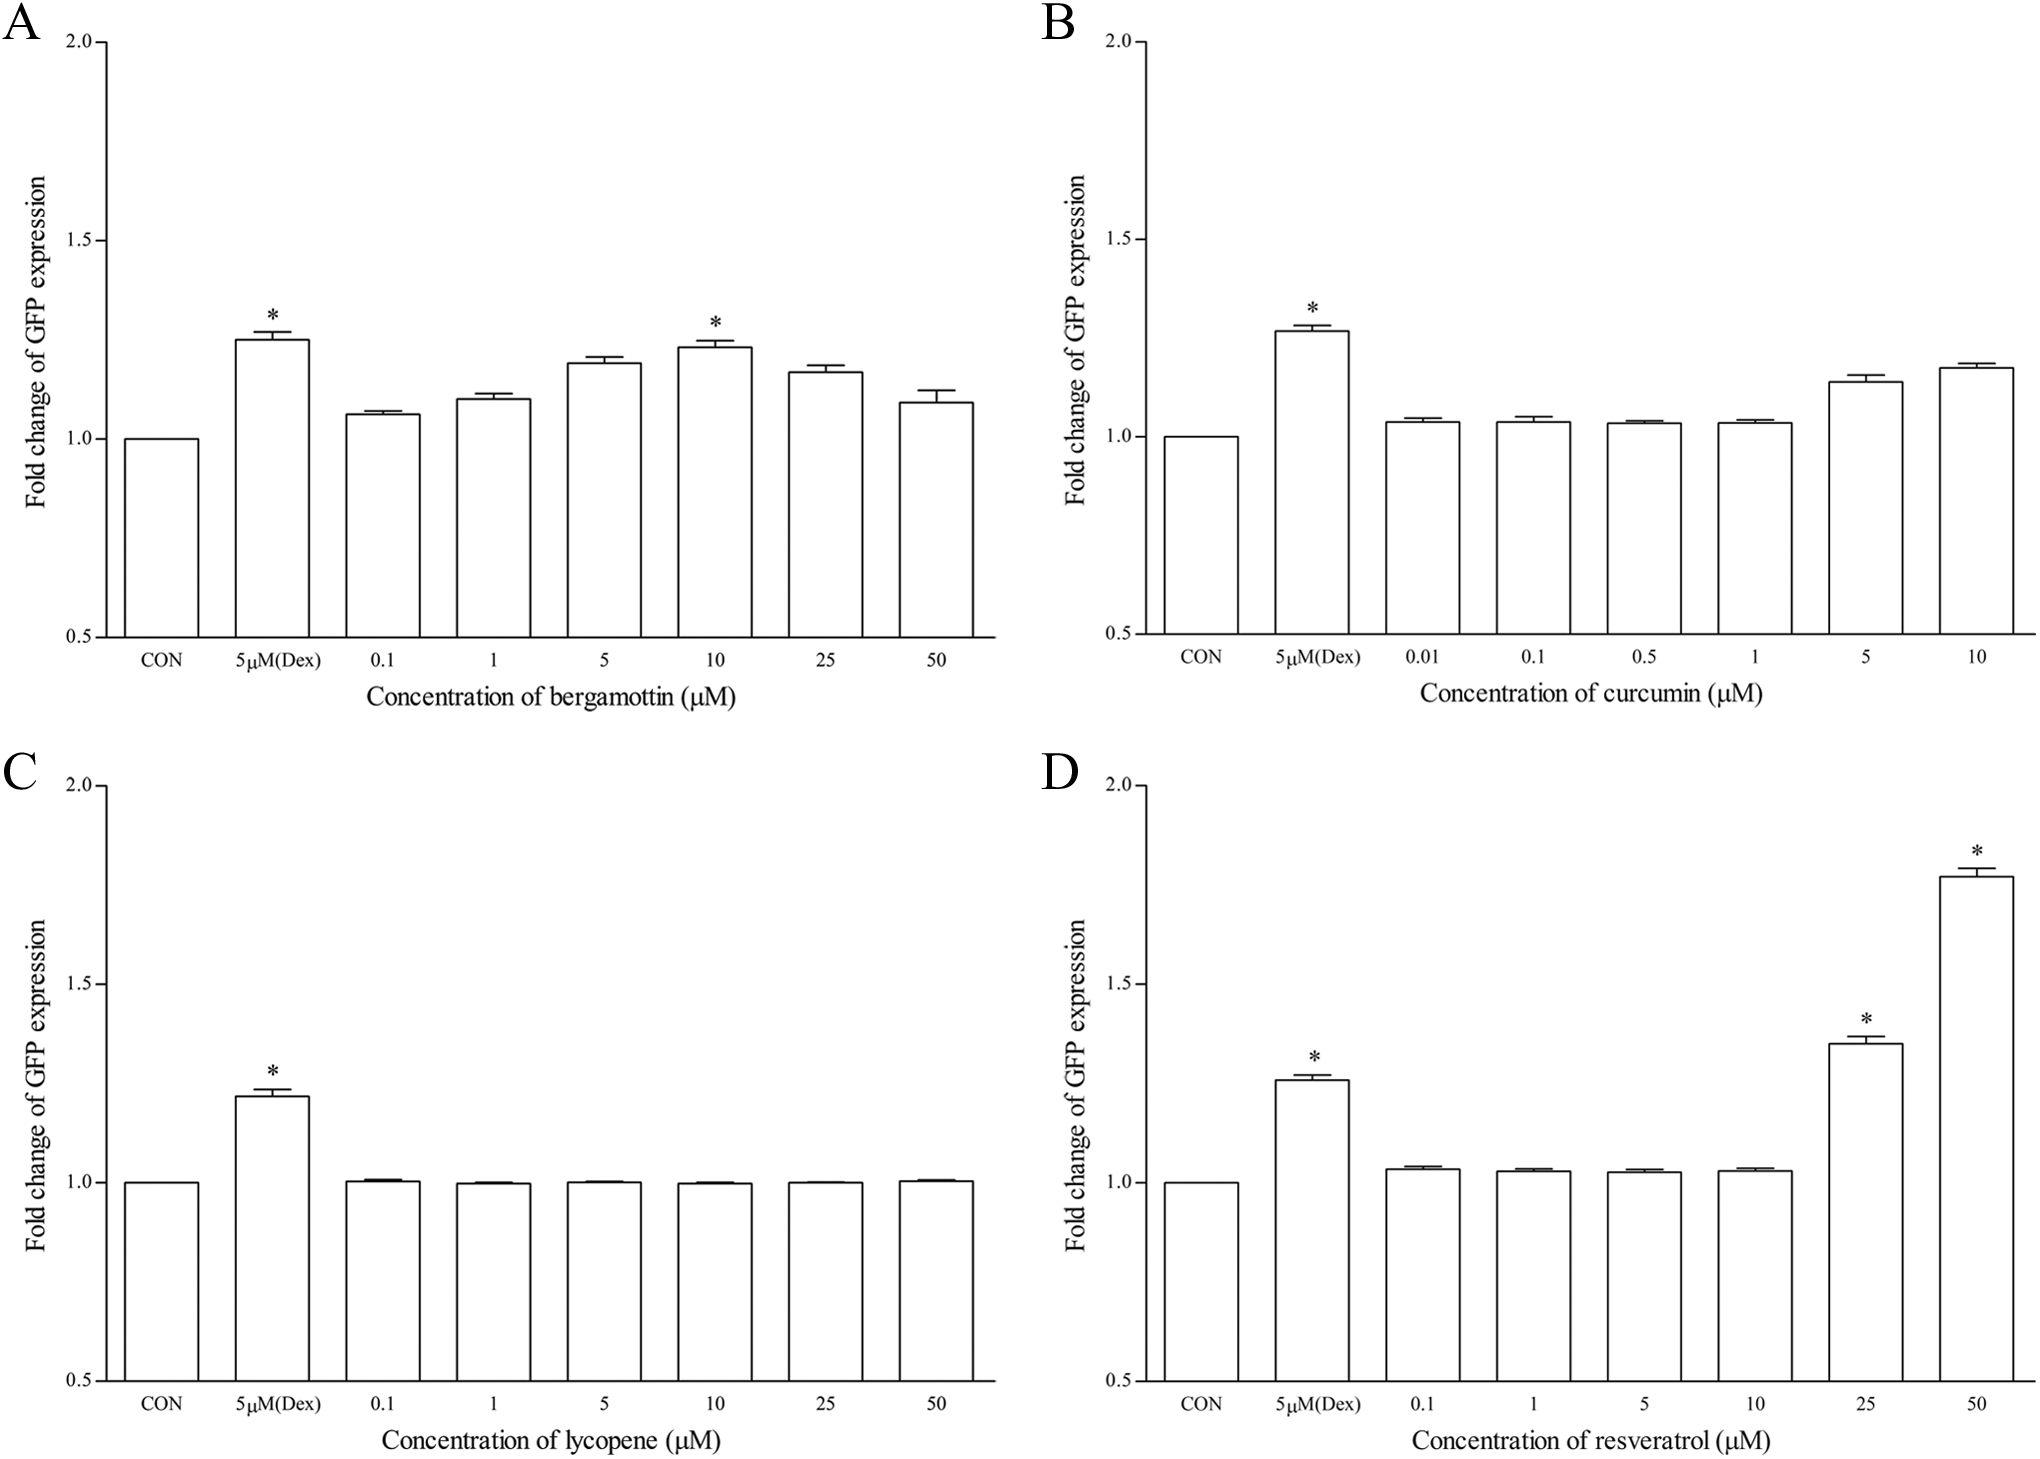
The effects of (A) bergamottin, (B) curcumin, (C) lycopene, and (D) resveratrol on GFP expression using hCYP3A4-HepG2 cell-based assay after 48 hours of treatment. Data are presented as the mean fold change of GFP expression ± SD of 3 independent experiments. *P < .05. CON indicates control; Dex, dexamethasone; GFP, green fluorescence protein.
The calculated z'-factor for this assay using positive controls such as dexamethasone, rifampicin, and nifedipine ranged from 0.45 to 0.91. However, omeprazole has a calculated z'-factor of approximately 0.00, indicating that omeprazole may not be suitable to be used as a positive control in this assay. As with natural compounds, namely resveratrol and bergamottin, this assay produced z'-factor values of 0.75 and 0.28, respectively. Evaluating this assay using ketoconazole produced a z'-factor value of 0.16, indicating that this assay may not be reliable to determine the inhibition of protein expression of CYP3A4. Surprisingly, a known AhR inducer, β-naphthoflavone has a z'-factor value of 0.36 for the assay. As for the rest of the compounds, z'-factor values were not determined as the expressions of GFP were hardly significant.
Molecular Docking of Natural Compounds Within PXR Molecule
The cocrystallized ligand (hyperforin) was separated and redocked into the binding pockets of the human PXR molecule as a part of a procedure to validate the Autodock 4.2 docking tool. A total of 100 docked conformations of compounds were clustered based on a root mean squares deviation tolerance of 2.0 Å, and the structurally similar docked conformations were ranked into clusters based on the increasing order of binding energies. In the redocked hyperforin–PXR complex, 3 hydrogen bonding were observed. Both Ser247 and His407 formed hydrogen bonds with the oxygen atom from the 6-member ring carbonyl group of the compound, whereas Cys284 is linked with the oxygen atom with another carbonyl group (Figure 4A). The shortest bond distance is between His407 and the oxygen atom, which was 1.92 Å (Figure 4A). In addition, hyperforin appears to form a large number of hydrophobic interactions within the PXR molecule, and its calculated Ki and FEB were 0.00436 µmol/L and −11.41 kcal/mol, respectively (Table 1).
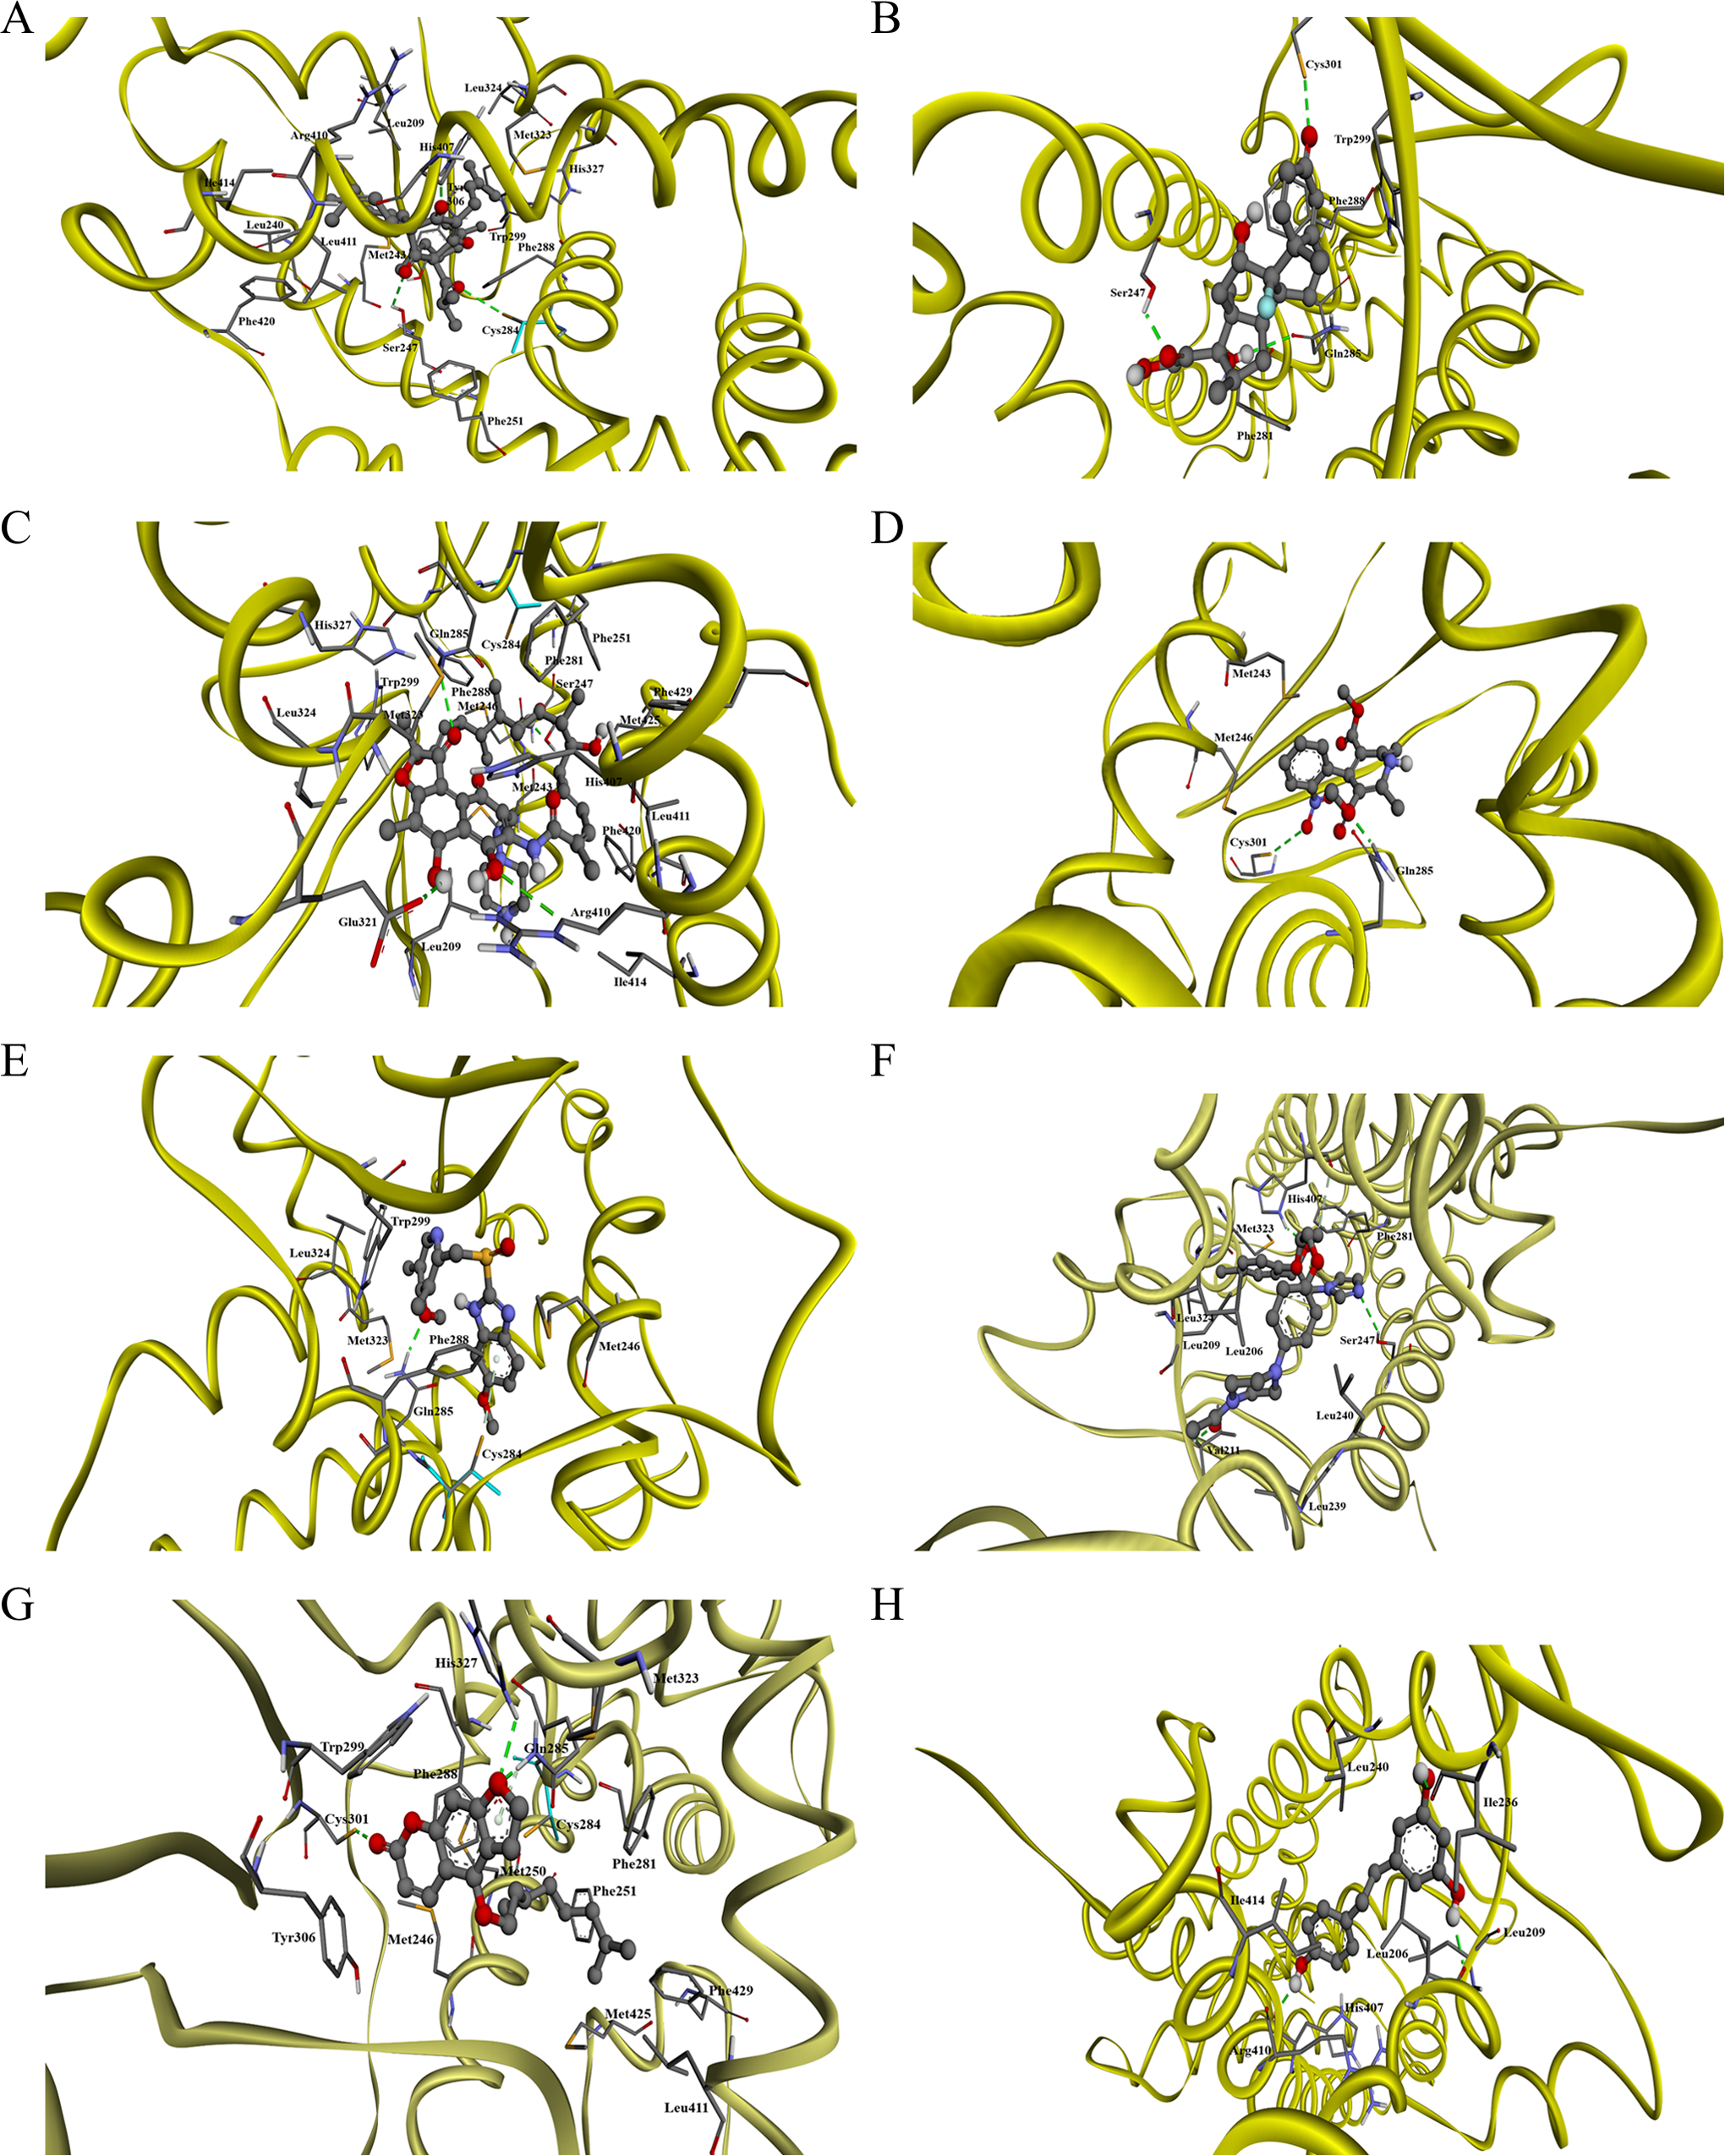
Molecular docking of (A) hyperforin, (B) dexamethasone, (C) rifampicin, (D) nifedipine, (E) omeprazole, (F) ketoconazole, (G) bergamottin, and (H) resveratrol in the ligand binding cavity of PXR. The conformation of compounds is shown in ball and stick representation. Atoms are colored as grey for carbon, blue for nitrogen, red for oxygen, and white for hydrogen. The hydrogen bond is depicted as a green line. Amino acid residues interacting with the compounds in the ligand binding cavity are highlighted. PXR indicates pregnane X receptor.
A Summary of the Molecular Interactions of Compounds With PXR Residues.a
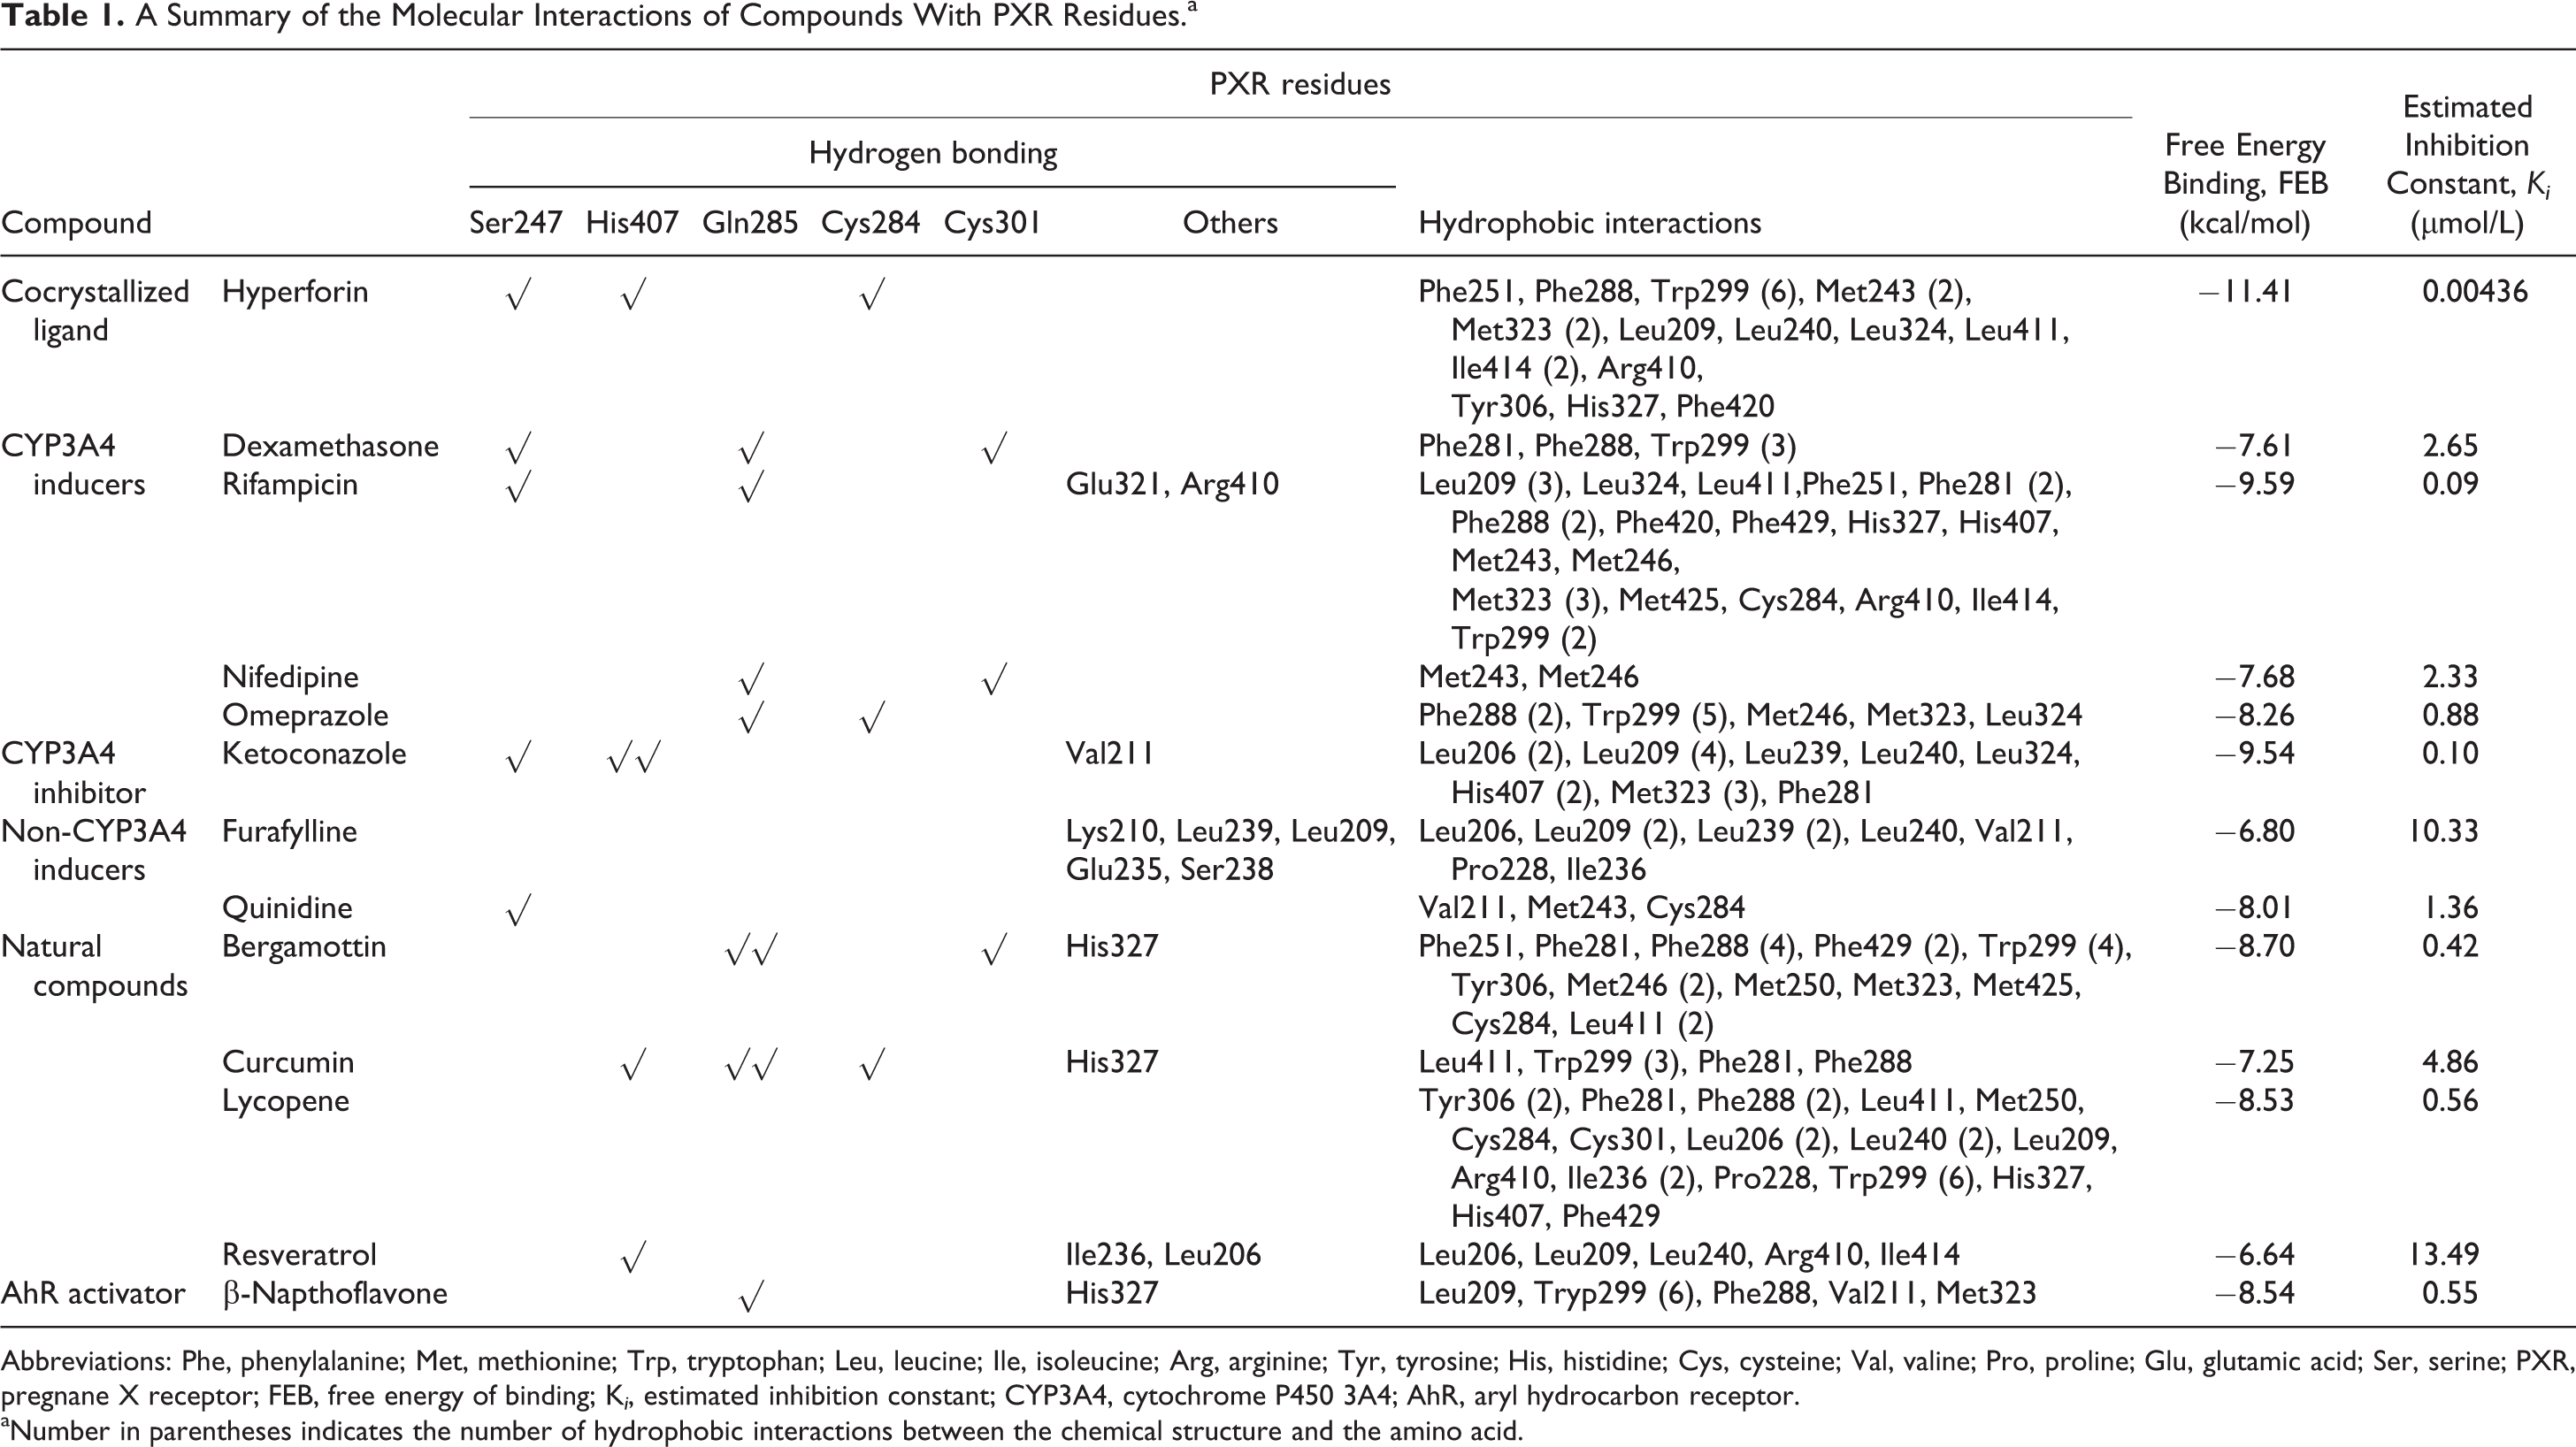
Abbreviations: Phe, phenylalanine; Met, methionine; Trp, tryptophan; Leu, leucine; Ile, isoleucine; Arg, arginine; Tyr, tyrosine; His, histidine; Cys, cysteine; Val, valine; Pro, proline; Glu, glutamic acid; Ser, serine; PXR, pregnane X receptor; FEB, free energy of binding; K i , estimated inhibition constant; CYP3A4, cytochrome P450 3A4; AhR, aryl hydrocarbon receptor.
aNumber in parentheses indicates the number of hydrophobic interactions between the chemical structure and the amino acid.
Subsequently, the binding modes of other compounds within the active site of the PXR molecule were determined. Generally, CYP3A4 inducers–PXR complex (dexamethasone, rifampicin, nifedipine, and omeprazole) had a calculated FEB ranging from −7.61 to −9.59 kcal/mol, which was lower than that of the hyperforin–PXR complex (Table 1, Figure 4B-E). Both rifampicin and omeprazole appeared to have lower Ki values, 0.09 and 0.88 µmol/L, respectively, as compared with nifedipine and dexamethasone with Ki values of 2.33 and 2.65 µmol/L, respectively. The in silico results did not provide clear indication of the non-CYP inducers in this case, except for furafylline, the Ki calculated was quite high at 10.33 µmol/L and low FEB of −6.80 kcal/mol. All CYP inducers form hydrogen bonds with at least 2 of the main amino acids from the PXR molecule, namely, Ser247, His407, Gln285, Cys284, and Cys301. Massive hydrophobic interactions were also observed for both hyperforin and rifampicin. For noninducers, furafylline has no interactions with the few main amino acids but the same cannot be said for quinidine, which has a single hydrogen bonding with Ser247. On the other hand, the nitrogen atom of the imidazole group of ketoconazole forms a hydrogen bond with Ser247 and the oxygen atom of the 5 member ring structure forms 2 hydrogen bonds with His407. It also has a large number of hydrophobic interactions with PXR molecule with high FEB (−9.54 kcal/mol) and low Ki (0.10 µmol/L; Figure 4F and Table 1).
As for the natural compounds, compounds with reasonably high FEB (−8.53 to −8.70 kcal/mol) include bergamottin and lycopene, and the values seemed to correspond with the derived Ki values of below 1.0 µmol/L, indicating a possibility of strong binding activity (Table 1, Figure 4G). Resveratrol appears to have a large Ki (13.49 µmol/L) and low FEB (−6.64 kcal/mol), indicating poorer binding activity with PXR as compared with the rest of the compounds (Table 1, Figure 4H). Bergamottin forms 2 hydrogen bonds with Gln285 and a single bond with both Cys301 and His327. Curcumin has 5 hydrogen bonds, with His407, Gln285, Cys284, and His327, respectively. As for lycopene, no interactions were observed with the main group of amino acids. Interestingly, both lycopene and bergamottin are found to have a large number of hydrophobic interactions with the PXR molecule. On the other hand, resveratrol formed a single hydrogen bond with His407, Ile236, and Leu206 and has a limited number of hydrophobic interactions (Table 1).
Interestingly, in silico simulation noted a possible interaction between β-naphthoflavone and PXR molecule, with low Ki (0.55 µmol/L) and moderate FEB value (−8.54 kcal/mol). This compound has a single hydrogen bond with Gln285 and a moderate number of hydrophobic interactions with PXR.
Discussion
Pharmacokinetic drug–drug interactions are adverse clinical events caused by abnormally increased or decreased human plasma drug concentrations as a consequence of coadministration with another drug. 42 Drug interactions can occur during drug absorption, metabolism, distribution, and elimination processes. Hence, an important concern in drug discovery and development is to ensure the chemical entity minimally affects the activities of the cytochrome enzymes during drug metabolism. Human CYP3A4 is the most abundant CYP enzyme and is responsible for the metabolism of a large number of currently used drugs and a major determinant of elimination or systemic clearance and bioavailability of drugs. This explains why this CYP enzyme is routinely emphasized in drug–drug interaction studies. 39,43 Hence, it is a crucial process to test any new chemical entities in biological systems to evaluate their regulatory activities on human CYP3A4 before regulatory approval to prevent possible therapeutic failure or toxicity. 26,39,44,45
The induction of drug metabolizing enzymes is considered to be a case of pharmacokinetic interactions with unique features in comparison with inhibition of metabolizing enzymes. 46 The CYP enzyme induction is a slower process and takes longer time to affect drug metabolism as compared to CYP inhibition, which can happen rapidly. The CYP induction is known to increase the risk of reactive metabolite toxicity as a result of induction-mediated imbalance of detoxification and activation. 47 In cases of prodrugs, enhanced metabolic activation by induction can lead to increased toxicity, where an increase in the metabolism of the parent compound leads to an increase in exposure of the toxic metabolite. 46 New chemical entities are routinely screened for their CYP inducing activities using RT-qPCR where the mRNA changes were measured. 31,48 Although RT-qPCR is a robust and quantitative way of determining mRNA levels, protein expression measurement and quantification will further complement this assay.
PXR, a member of the nuclear receptor superfamily of proteins, predominantly regulates both basal and inducible expression of CYP3A4 and several other key CYP enzymes such as CYP2C9, CYP2B6, and CYP3A5 as well as drug transporters such as multi-drug resistance gene 1 and organic anionic transporting polypeptide 1A2. 49 -51 PXR is activated by a large number of structurally diverse compounds, including endobiotics and bile acids. 52 Many PXR agonists have been reported, including the antibiotics such as rifampicin; the antineoplastic drugs cyclophosphamide and tamoxifen; the anti-inflammatory agent dexamethasone; the antihypertensive drugs nifedipine and spironolactone; and herbal components such as hyperforin from St John’s wort. 53 -55 A number of PXR antagonists have also been reported such as ketoconazole, 56 camptothecin, 57 and active components from milk thistle such as silybin and isosilybin. 58 The clinical implications of modulating the transcription of drug-metabolizing enzymes are important for minimizing drug–drug interactions. In view of the wide array of molecules that bind PXR, the ability to predict potential interactions and adverse drug reactions is critical for toxicology assessments in drug discovery and development. 59 Various predictive computational models for PXR have been developed to define key features of ligands that bind to PXR and often pharmacophore models indicate 4 to 5 hydrophobic features and at least 1 to 2 hydrogen-bonding moieties. 60 -62 In this study, a simple in silico approach was undertaken to evaluate the binding of compounds on the PXR molecule and then compared with the corresponding CYP3A4 expression. The recombinant cells were transfected with pSG5-hPXR as part of the assay to ensure that endogenous PXR will not be a limiting factor for the CYP3A4-GFP expression.
The human CYP3A4 proximal promoter used in this cell-based assay comprised of the major and minor transcriptional initiation sites including ER6 element in the xenobiotic-responsive enhancer module, human P450 nuclear factor specific element, glucocorticoid response element, hepatocyte nuclear factor 4 (HNF4), HNF5 estrogen response element, basic transcription element, CAAT, and TATA box. 32,44,63 Synthetic glucocorticoid such as dexamethasone is a ligand for both glucocorticoid receptor (GR) and PXR. It has a sequential effect on the induction of CYP3A4 kinetics; at submicromolar concentration (0.1 μmol/L), dexamethasone fully activates GR while at supramicromolar concentration (above 10 μmol/L), it activates PXR. 45,64 Using this cell-based assay, dexamethasone elicited significant induction of GFP signal, with the highest mean fold change of 1.61 ± 0.20 at 5 µmol/L as compared with untreated cells, which is consistent with various studies. 39,45 As with rifampicin, it is known to induce human CYP3A4 through activation of PXR, 25,65 and the GFP induction is significantly demonstrated at as low as 0.1 µmol/L even though the fold change barely reached 1.5-fold change. Interestingly, Kim and coworkers found that rifampicin did not produce significant CYP3A4 induction in HepG2 cells transfected with a plasmid pCYP3A4-Luc containing approximately 1 kb of the CYP3A4 proximal promoter region (−863 to +64 bp) in front of a reporter gene, luciferase. However, with cotransfection with steroid and xenobiotic receptor (SXR), the induction effects of rifampicin were much higher as compared with the control. 40 Relatively modest activation by rifampicin of reporter gene constructs containing the proximal PXR response element alone was also reported by various researchers. 66,67 This could be explained by Goodwin and coworkers who indicated the existence of a potent enhancer module, 8 kb distal to the transcription start point, which mediates the transcriptional induction of CYP3A4 by activators of hPXR. This transcription factor binding site includes at least 2 elements, the distal nuclear receptor binding element 1 and 2 (dNR1 and dNR2), which was not included in the promoter region that we have used due to the limitations in transfecting large sized plasmids. 29
Nifedipine, another known human CYP3A4 inducer, induced the expression of GFP significantly and consistently between 0.1and 50 µmol/L, devoid of dose-dependent effects. On the other hand, omeprazole produced significant induction at only 25 µmol/L and above and the magnitude of induction is below 1.5-fold change. Higher doses may need to be used as Raucy and coworkers reported that omeprazole induced the expression of CYP3A4-mediated luciferase activity up to 200 µmol/L. 44 However, using higher doses of controls is a limitation in such assays as it will complicate the interpretation of results, as such high doses do not reflect the actual physiological concentrations. In addition, omeprazole is also known to induce CYP1A2 in addition to CYP3A4. 68 Based on the z'-factor as well, omeprazole may not be suitable to be used as a positive control in this assay.
Ketoconazole, a known human CYP3A4 inhibitor, is typically known to inhibit the enzymatic activity of CYP3A4 by binding onto the CYP3A4 enzyme. 39 However, recent studies have indicated that ketoconazole is also a PXR antagonist. Ketoconazole was found to antagonize PXR-dependent gene transcription and reduces the CYP3A4 mRNA expression in various studies. 56,69,70 As observed in the cell-based assay, the expression of CYP3A4 was inhibited only at higher concentrations such as 25 and 50 µmol/L. Since the magnitude of the inhibition and the calculated z-factor is small, measurement of inhibition of expression may not be applicable using this assay. On the other hand, non-human CYP3A4 inducer or inhibitors such as furafylline and quinidine did not produce any induction on the expression of GFP, further indicates the consistency of the assay.
Interestingly, β-naphthoflavone, a known AhR activator, appeared to induce the GFP expression in this assay. β-Naphthoflavone is known to induce CYP1 family enzymes in HepG2, HepaRG, and human hepatocyte cells. 71 In addition, other studies also suggested that β-naphthoflavone induces CYP1A1, 1A2, 1B1, and other AhR-regulated genes and not CYP3A enzymes. 72,73 Our initial hypothesis was that β-naphthoflavone may not exert any PXR activation on the assay, however, the results showed otherwise. Koe and coworkers discovered that β-naphthoflavone elicited a slight induction on the CYP3A4 mRNA expression although statistically it was insignificant. 74 Another study by Sinz and coworkers did mention that β-naphthoflavone produced some inductive responses of CYP3A in rat models although data ranged from no response to a minor response. 75 In addition, several studies showed aberrant characteristics of β-naphthoflavone, namely, it concentration-dependently induced mRNA levels of UGT1A1 in HepG2 cells up to 6.0-fold and is found to induce CYP2B6 in human hepatocytes. 68,76 In this study, although the induction of GFP was significant, indicating a possible inductive property on CYP3A4 or activation on PXR and further supported by the in silico interaction, which indicated surprisingly low Ki value, more studies may be needed to verify this.
In silico molecular docking showed that hyperforin forms a large number of hydrophobic interactions within the PXR molecule, and its calculated Ki and FEB are 0.00436 µmol/L and −11.41 kcal/mol, respectively. Massive hydrophobic interactions were also observed for rifampicin. In general, CYP inducers–PXR complex (rifampicin, omeprazole, nifedipine, and dexamethasone) had a calculated FEB ranging from −7.61 to −9.59 kcal/mol, which was lower than that of the hyperforin–CYP3A4 complex. Both rifampicin and omeprazole appeared to have lower Ki value, 0.09 and 0.88 µmol/L, respectively, as compared with nifedipine and dexamethasone with Ki values of 2.33 and 2.65 µmol/L, respectively. The in silico results did not appear to provide clear indication of the non-CYP inducers in this case, except for furafylline, the Ki calculated was quite high at 10.33 µmol/L and low FEB of −6.80 kcal/mol. All CYP inducers appeared to form hydrogen bonds with at least 2 of the main amino acids from the PXR molecule, namely, Ser247, His407, Gln285, Cys284, and Cys301. On the other hand, the differences in the interactions between agonists and antagonists such as ketoconazole cannot be clearly determined in this in silico study. Although Ekin and coworkers have indicated that agonist pharmacophores have predominant hydrophobic features and that PXR antagonists may require more hydrogen bonding interactions than agonists (or at least a different distribution of these molecular features), this was not demonstrated in this study. 59
Curcumin was demonstrated to have more hydrogen bond interactions with PXR as compared with ketoconazole but exhibiting no effects on CYP3A4 expression using this assay. Lycopene has massive number of hydrophobic interactions but was not proven to regulate GFP expression at all concentrations. Similarly, bergamottin has many hydrophobic interactions and 2 hydrogen bonds formed with Gln285 in PXR molecule induced GFP expression albeit at lower levels as compared with other natural compounds and clinical inducers at similar concentrations. Bergamottin, a component of grape fruit juice, is a known CYP3A4 enzyme inhibitor. 77
A recent study has indicated that hydrophobic amino acid residues present at the binding pocket are important for ligand binding. 78 Residues that are most important for interactions are Arg410, His407, Ile414, Met246, Ser247, Met243, Gln285, His327, Phe288, Met323, Tyr306, Trp299, and Val211, which were consistent with this study. 78 In addition, hydrogen bonding to Gln285 is thought to be indispensable for PXR activation, and most ligands were found to form a second hydrogen bond to His407. However, it is said that hydrophobic interactions are not essential for receptor activation but contribute to ligand affinity. Highly active compounds share up to 5 hydrophobic features that allow the ligand to occupy large area of the predominantly hydrophobic binding pocket. 62 Curcumin has these few features but unfortunately, PXR activation was not demonstrated using this assay. This may not be surprising as curcumin was found to inhibit CYP3A4 at the enzymatic level instead of inducing the enzyme. 79 Cho and coworkers found that concurrent administration of curcumin and tamoxifen in rats significantly decreased the metabolite formation of tamoxifen implying that curcumin inhibits the CYP3A4-mediated metabolism of tamoxifen to its active metabolite, 4-hydroxytamoxifen. 79 In another study, curcumin inhibited the CYP3A4-mediated metabolism of everolimus. 80 Interestingly, curcumin serum metabolites containing glucuronides/sulfates of curcumin and demethoxycurcumin were found to activate the CYP3A4 expression and not curcumin. 80 On the other hand, resveratrol has 3 hydrogen bonds with His407, Ile236, and Leu206; and limited number of hydrophobic interactions but it is shown to induce CYP3A4 expression at high concentrations which is rather similar with omeprazole in this case. This is interesting as resveratrol is also known to inhibit the CYP3A4 enzyme 81 and further studies may need to be carried out on this compound.
The PXR binding properties of the above compounds and the results of the assay were not well defined. The limited success with structure-based modeling approaches to predict human PXR activators is thought to be attributed to the large and promiscuous site of this protein. 82 The PXR appears to have the ability to change the ligand binding pocket to adapt to ligands, and ligands may bind in multiple conformations within the ligand binding domain of hPXR, may have contributed to the conflicting results for some compounds. 56 Furthermore, using traditional structure-based virtual screening methods like docking that treat the receptor as rigid for purposes of modelling may add to the complexity of the overall prediction of whether a small molecule is likely to be classified as a hPXR agonist. 83 Multiple modelling approaches including quantitative structure–activity relationship, pharmacophore modelling, and machine learning are considered to be better choices. 83
In conclusion, the present study demonstrated that a cell-based-GFP assay to quantitatively measure CYP3A4 protein expression may be used as an additional tool to evaluate the potential CYP3A4 induction properties of compounds. Positive controls that can be used in this assay include dexamethasone, rifampicin, and nifedipine. However, in silico molecular docking data on PXR have not provided satisfactory pointers to differentiate between CYP3A4 inducers from noninducers or from inhibitors as more comprehensive molecular screening may be indicated.
Footnotes
Acknowledgements
The authors would like to acknowledge Dr. Steven A Kliewer from University of Texas Southwestern Medical Center, for kindly providing the human PXR expression vector.
Authors’ Note
Tan, ML contributed to conception and design contributed to interpretation, drafted the manuscript, and critically revised the manuscript. Seah, TC contributed to acquisition, analysis, and interpretation, and drafted the manuscript; Tay, YL and Tan, HK contributed to acquisition, analysis, and interpretation and critically revised the manuscript; Wahab, HA contributed to conception and design, contributed to acquisition and analysis, and critically revised the manuscript; Tengku Muhammad, TS contributed to conception and design, contributed to analysis, and critically revised the manuscript. All authors gave final approval and agree to be accountable for all aspects of work ensuring integrity and accuracy.
Declaration of Conflicting Interests
The author(s) declared no potential conflicts of interest with respect to the research, authorship, and/or publication of this article.
Funding
The author(s) declared the following financial support with respect to the research, authorship, and/or publication of this article: This work was supported in part by the R&D Initiatives and Sciencefund Grant (02-05-23-SF0002) from the Ministry of Science, Technology and Innovation Malaysia.