
Abstract
After injury to the central nervous system (CNS), both neuron-intrinsic limitations on regenerative responses and inhibitory factors in the injured CNS environment restrict regenerative axon growth. Instances of successful axon regrowth offer opportunities to identify features that differentiate these situations from that of the normal adult CNS. One such opportunity is provided by the kinase inhibitor RO48, which dramatically enhances neurite outgrowth of neurons in vitro and substantially increased contralateral sprouting of corticospinal tract neurons when infused intraventricularly following unilateral pyramidotomy. The authors present here a transcriptomic deconvolution of RO48-associated axon growth, with the goal of identifying transcriptional regulators associated with axon growth in the CNS. Through the use of RNA sequencing (RNA-seq) and transcription factor binding site enrichment analysis, the authors identified a list of transcription factors putatively driving differential gene expression during RO48-induced neurite outgrowth of rat hippocampal neurons in vitro. The 82 transcription factor motifs identified in this way included some with known association to axon growth regulation, such as Jun, Klf4, Myc, Atf4, Stat3, and Nfatc2, and many with no known association to axon growth. A phenotypic loss-of-function screen was carried out to evaluate these transcription factors for their roles in neurite outgrowth; this screen identified several potential outgrowth regulators. Subsequent validation suggests that the Forkhead box (Fox) family transcription factor Foxp2 restricts neurite outgrowth, while FoxO subfamily members Foxo1 and Foxo3a promote neurite outgrowth. The authors’ combined transcriptomic-phenotypic screening strategy therefore allowed identification of novel transcriptional regulators of neurite outgrowth downstream of a multitarget kinase inhibitor.
Introduction
Regeneration after injury in the adult mammalian central nervous system (CNS) is rare, in contrast to other situations including the developing CNS, the invertebrate CNS, and the adult peripheral nervous system. RNA sequencing (RNA-seq) and microarray analysis have been applied in studies of axon regeneration in attempts to capture the transcriptomic signature associated with successful axon growth after injury.1−18 These approaches enable identification of regeneration-associated genes (RAGs), whose change in expression is correlated with axon growth. At least some RAGs are presumably critical for successful axon regeneration. Transcription factors are thought to be particularly important RAGs, owing to their essential roles in regulating expression of other genes. Indeed, several transcription factors have been found to regulate the neuronal growth response after axonal injury, including Jun, Stat3, CREB, ATF3, Sox11, Smad1, KLF family members, p53, and more, with others likely yet to be identified.19−27 Further, transcription factor binding site (TFBS) enrichment analysis points to active transcription factors with target genes displaying accessible promoter regions, since inactive transcription factors or those that cannot bind to the DNA promoters will not be able to transcribe their target genes. In principle, by layering TFBS enrichment analysis on top of RNA-seq differential gene expression analysis, high-resolution detection of changes in gene expression can be leveraged for identification of the critical transcription factors driving axon growth after injury to provide potential targets for investigative or therapeutic purposes.
In previous work, we used a bioinformatics/machine learning platform called idTRAX28−30 to identify seven “target” kinases whose inhibition was correlated with promotion of neurite growth in vitro. We also identified a small-molecule kinase inhibitor (RO0480500-002; RO48) that was able to inhibit five of these seven target kinases, and which promoted neurite growth more strongly than any other kinase inhibitor tested.28,31 When RO48 was administered via continuous infusion over a period of 4 weeks into the lateral ventricle of mice subjected to a unilateral pyramidotomy, collateral sprouting of the uninjured corticospinal tract was significantly increased. 28 Although RO48 acts as a kinase inhibitor, it is plausible that the long-term changes in axon growth induced by RO48 are associated with transcriptional changes modulating the intrinsic neuronal growth state. Here we sought to investigate potential transcriptional mechanisms underlying RO48-enhanced neurite outgrowth in cultured CNS neurons, leading to the potential identification of novel transcriptional regulators of CNS axon growth.
Even with information about expression and potential activity, it remains difficult to identify novel transcription factors important for regulating neurite or axon growth from first principles. As one approach, an unbiased screen can be used to identify those transcription factors that should be prioritized. We therefore performed a knockdown screen to specifically identify novel transcription factors associated with RO48-enhanced neurite outgrowth in primary mammalian CNS neurons. We hypothesized that transcription factors putatively driving differential expression of genes in RO48-treated hippocampal neurons are mechanistically linked to enhanced neurite outgrowth, so that knockdown of relevant transcription factors would lead to promotion or reduction in neurite outgrowth in RO48-treated neurons. We also screened the same transcription factors without RO48 treatment to assess whether their effects on neurite outgrowth were RO48-specific. Overall, our results suggest that RO48, through its kinase-inhibitory activities, can regulate long-term transcriptional events, leading to enhanced axon growth in primary neurons.
Materials and Methods
Dissection and Dissociation of Hippocampus from Embryonic Rat Brain
Cells were prepared based on a modified version of a previously reported protocol. 32 All animal-related work was performed in accordance with the University of Miami Institutional Animal Care and Use Committee. The University of Miami follows the Guide for the Care and Use of Laboratory Animals, 8th Edition and is an Association for Assessment and Accreditation of Laboratory Animal Care International (AAALAC)-accredited institution. Female Sprague−Dawley rats (Charles River Laboratories, Wilmington, MA) on gestational day 18 were used for preparation of embryonic hippocampal neurons. At the appropriate gestational stage, adult pregnant rats were euthanized using CO2 inhalation and the uterus removed into a sterile dish containing room temperature Hank’s balanced salt solution (HBSS) buffered with 20 mM HEPES (Gibco, Dublin, Ireland, 15630-080). This buffer was used for the remaining dissection steps until the dissociation stage.
Embryonic brains were extracted from the fetuses using a fine pair of iridectomy scissors to open the skin and curved forceps to remove the brain. The overlying falx cerebri meninges were removed using thin-tip number 5 forceps (Dumont) and the cerebral hemispheres separated from the brainstem. The remaining meninges were carefully removed from both cerebral hemispheres before separating the hippocampi from the adjacent cortex using iridectomy scissors. At this stage of development, the borders of the hippocampus are clearly delineated. An average of 18−26 hippocampi were placed in 37 °C prewarmed Hibernate E (BrainBits, Springfield, IL, HECA) containing 0.25% trypsin (Corning, 25-054-C) and 0.5 mg/mL DNase (Sigma Aldrich, St. Louis, MO, D5025) with gentle agitation every 5 min. After 15 min, the intact hippocampi were rinsed five times with Hibernate E supplemented with 1× B27 (Gibco, 17504044). The cells were then dissociated via trituration by repeatedly passing the hippocampi in ~1 mL of solution through a fire-polished Pasteur pipette until no intact tissue or clumps remained (four to eight passes). The cell concentration was quantified using a hemocytometer, and viability was assayed using 0.4% trypan blue.
Embryonic Hippocampal Neuron Culture and Treatment
Neurons were prepared from the hippocampi of embryonic day 18 (E18) rats as described earlier. Twenty-four hours prior to dissociation of neurons, culture dishes or eight-chambered slides (Thermo Scientific, Waltham, MA, 154453PK) were coated with 0.5 mg/mL poly(
Dissociated neurons were diluted to the appropriate concentration in NbActiv4 (BrainBits, Nb4-500) that had been equilibrated for at least 1 h before at 37 °C with 5% CO2. If the volume of cells being diluted in NbActiv4 exceeded 10% of the total diluent volume, the appropriate number of cells were concentrated via room temperature centrifugation at 80 rcf for 5 min before resuspension in the necessary volume of NbActiv4. Unless otherwise noted, hippocampal neurons were plated at 2000 cells per well in 150 µL, in a PDL-coated 96-well plate (Corning, Corning, NY, 353075). The perimeter wells on 96-well plates were not used to culture neurons and instead were filled with 150 µL of NbActiv4 to reduce interplate variabilities. Neurons were grown at 37 °C in 5% CO2 air with H2O saturation. For neurons receiving either DMSO (Sigma Aldrich, D2650-5X5ML) or RO48 (RO0480500-002, Roche, Basel, Switzerland) treatment, unless otherwise stated, DMSO or RO48 diluted in equilibrated NbActiv4 was added to culture media 3 h after neurons were added to the dish. DMSO at the concentrations used as a control treatment had no effect on the neuronal parameters presently investigated (data not shown).
Immunofluorescent Labeling of Hippocampal Neurons, Soma, and Neurites
After the appropriate number of days in vitro (DIV), neurons were removed from the incubator and media was aspirated until 50 µL remained. Neurons were fixed using 4% paraformaldehyde/4% sucrose in PBS at room temperature. After 20 min, the neurons were washed three times with PBS and then permeabilized for 5 min at room temperature (0.5% Triton X-100, 0.2% fish gelatin, and 0.02% sodium azide in PBS). Neurons were washed three times with PBS and blocked for 1 h at room temperature (0.03% Triton X-100, 0.2% fish gelatin, and 0.02% sodium azide in PBS). Blocking buffer was aspirated and primary antibody was added in additional blocking buffer solution at a 1:1000 concentration unless otherwise stated. For neurite tracing, the primary antibody added was rabbit anti-BIII-tubulin (1:2000; Sigma Aldrich, T2200-200UL) or mouse anti-BIII-tubulin (1:2000; made in-house 33 ), depending on the requirements of additional primary antibodies. Primary antibody incubation occurred at 4 °C for 24 h. Neurons were washed five times with PBS, and goat-derived fluorescent-labeled (Alexa Fluor 488 or AlexaFluor 546) secondary antibody (1:1000; Life Technologies, Carlsbad, CA, A11029, A-11030) in room temperature blocking buffer was added for the appropriate species in which the primary antibody was produced. Hoechst 33342 nuclear dye (Invitrogen, Waltham, MA, H3570) was also added to the secondary antibody solution to counterstain cell nuclei. After 1 h, the neurons were washed five times with PBS. Primary antibody was omitted from negative control neurons, which showed no detectable staining signal.
High-Content Imaging Analysis of Hippocampal Neurons
Imaging and analysis of neurite outgrowth were performed according to a method previously utilized by our lab. 34 As described before, rat embryonic E18 hippocampal neurons were cultured on PDL-coated 96-well plates. Plates were fixed and then immunostained to label nuclei, soma, and neurites. Stained neurons were imaged in two different channels using a Cellomics ArrayScan VTI (Thermo Scientific Cellomics, Pittsburgh, PA) to automatically image nonadjacent mosaic fields in each well of a 96-well plate with a 5× objective. Nuclei and fluorescent-labeled BIII-tubulin staining were detected automatically using the Neuron Profiling Bioapplication (version 3.5). Typically, between 100 and 300 nucleated BIII-tubulin-stained cells with a total neurite length ≥10 µm (valid neurons) are measured per well.
Neuron Culture for RNA-Seq, Sample RNA Processing, and Library Preparation
Neurons derived from a single litter’s embryonic hippocampal neuron preparation were considered biological replicates. Neurons from the same hippocampal preparation were plated in triplicate, but the resulting cell lysate was pooled before isolation of RNA. Embryonic hippocampal neurons were plated in 1 mL of NbActiv4 media at 1 × 10⁶ cells per well in a 12-well PDL-coated plate as previously described. Neurons were treated with either DMSO (0.025%) or RO48 (10 µM) added to wells as 1 mL of CO2-equilibrated, 37 °C NbActiv4, 3 h after neurons were added to the culture dish. Neurons were grown for 2 DIV before RNA isolation.
RNA was collected from neurons according to the manufacturer’s instructions using the PureLink RNA Mini Kit (Invitrogen, 12183018A). Briefly, after 2 DIV the culture media was aspirated, and neurons were washed once with ice-cold PBS. After removing the PBS, lysis buffer from the kit was added and left on each well for 1 min. Each well was scraped with a pipette tip and the cell lysate was collected. RNA was immediately purified using elution and wash buffers in spin cartridges provided in the kit and per the manufacturer’s instructions. Possible DNA contaminants were removed using DNaseI treatment (Qiagen, Hilden Germany, 79254). Purified RNA was eluted in RNAase-free water, and the quality was assessed via an Agilent 2100 Bioanalyzer (RRID:SCR_013575). Samples had a minimum RIN score ≥ 7.5 (RQN ≥ 9.3). The RNA quantity in each sample was evaluated using a Qubit 3.0 Fluorometer.
Library preparation and RNA-seq were performed by Novogene (Sacramento, CA) using the Illumina TruSeq library preparation protocol. Coding mRNA with polyadenylated tails was isolated and fragmented and then reverse transcribed, resulting in cDNA libraries for each sample. The libraries were sequenced using the next-generation Illumina NovaSeq 6000 platform (RRID:SCR_016387), with a depth of 20 million reads targeted. After removal of library contaminants (e.g., adaptors) from the raw read counts, an average of 25.5 million paired-end 150 base pair reads were generated per sample. A quality control (QC) check for errors during sequencing using the FastQC Java tool (RRID:SCR_014583) and Novogene internal quality checks showed that all sequencing samples were of excellent quality according to sequencing standards, and no quality-based trimming was necessary. Thus, all samples were used for downstream analysis.
RNA-Seq Gene Expression Quantification
Raw RNA-seq reads were mapped and quantified with reference to the Rattus norvegicus reference genome (assembly Rnor_6.0, annotation Ensembl release 97) (
Preprocessing and Differential Expression Testing of RNA-Seq Data Sets
The preprocessing and evaluation of gene expression were carried out with the computational methods implemented in R (RRID:SCR_001905) and packages available through BioConductor (https://www.bioconductor.org/) (
Normalized and batch-corrected gene sets underwent likelihood ratio testing for differential expression analysis using the exact negative binomial test as implemented in the EdgeR package, with default parameters to identify genes with significantly different expression in the RO48-treated samples relative to the DMSO-treated samples. After applying a Benjamini−Hochberg false discovery rate correction of p values, significantly differentially expressed genes were selected as those with an adjusted p value <0.05 and an absolute value of log2(fold change [FC]) ≥ 0.58, for RO48 relative to DMSO control comparison.
Heatmap Construction
For building the heatmap from the RNA-seq samples, only genes considered differentially expressed were used as input. The gene expression for each sample was normalized to the average expression value of a gene value across the DMSO-treated control samples and then log2-transformed. Genes were considered differentially expressed in the RO48 samples if the absolute value of the FC in expression was ≥1.5 or ≤0.67 (log2[FC] ≥0.58 or ≤−0.58) relative to DMSO and had a false discovery rate (Benjamini−Hochberg correction) of p adjusted <0.05. A heatmap of differentially expressed genes was created using the heatmaply R package. Samples and genes were hierarchically clustered using complete linkage analysis and optimal-leaf-order of the Seriation R package as implemented in heatmaply to calculate the maximum distance between clusters before merging dendrogram branches.
Biological Process Functional Enrichment Analysis
Genes considered differentially expressed were categorized as either upregulated or downregulated based on whether their expression values were increased or decreased, respectively, in the RO48-treated samples compared with DMSO-treated samples. The upregulated and downregulated gene sets were analyzed separately using the Metascape tool 38 (RRID:SCR_016620) that incorporates gene ontology (GO) annotation of genes to identify enrichment of biological processes in a gene set. Metascape analysis was run using default parameters, except a custom set of background genes were supplied, consisting of the 13,220 low-count-filtered genes used for differential expression analysis. Available GO terms were analyzed for statistical enrichment (corrected p value <0.05) and used for hierarchical clustering based on similarities among their gene memberships. Terms were then cast into tree clusters (0.3 kappa score), and a subset of representative terms was used to convert the clusters into a network layout.
TFBS Enrichment Analysis
The oPossum TFBS enrichment analysis tool 39 (v3.0, RRID:SCR_010884) was used to identify overrepresentation of transcription factor DNA-binding motifs in promoter regions corresponding to the differentially regulated gene sets. The genomic sequences used as input to represent the promoter region for enrichment analysis were the region inclusive of the 1000 base pairs upstream and 1000 base pairs downstream of the transcription start site of differentially expressed genes. This 2000 base pair sequence was chosen because it is likely to contain a high proportion of the DNA regulatory sequences recognized by transcription factors to regulate expression of the gene.
The respective genomic sequences for the differentially expressed genes were extracted from the rat genome (Rnor_6.0) using the BEDTools genomic computational utilities suite (RRID:SCR_006646). Sequences used as input for TFBS enrichment analysis can range widely in mononucleotide GC content between species and gene set, with different means and standard deviations. If a control background comparison is not chosen to resemble the mean and standard deviation of the target list of genes, then certain transcription factor binding motifs may be falsely biased toward over- or underrepresentation in the enrichment analysis. So that the same background was used for both the upregulated and downregulated gene sets, the entire list of differentially expressed gene 2000 base pair genomic sequences was used to create a unitary background reference sequence set. Background sequences were chosen to 1:1 match the GC-nucleotide content of the input gene sequences, though the specific background sequences were chosen at random from the RNA-seq low-count-filtered list of 13,220 genes.
The upregulated gene set sequences and downregulated gene set sequences were analyzed for enriched TFBSs separately using the sequence-based single-site analysis feature of the oPossum tool with the matrix match stringency increased to 90%. As input for the position frequency matrices used as motif references for transcription factors during analysis, the 2018 Core Vertebrate data set was downloaded from JASPAR (RRID:SCR_003030). This is a smaller collection (579 motifs) of curated, nonredundant transcription factor DNA-binding preferences modeled as matrices, compiled from chromatin immunoprecipitation sequencing experiments and other related data sets. TFBS motifs were assessed based on the Fisher score and Z score to determine enriched motifs within a gene set compared with the background. Only the TFBS motifs that were greater than the mean + SD of the Fisher score and Z score of all motifs assessed were considered enriched.
The transcription factors with a motif enriched within a differentially expressed gene set were selected as a primary list of transcription factors putatively responsible for driving the expression of differentially expressed genes. Since transcription factors with similar DNA-binding motifs prefer similar promoter sequences, this primary list was expanded to include transcription factors with similar DNA-binding preferences that were not included in the JASPAR 2018 Core Vertebrate database used as the position frequency matrix reference. These transcription factors were primarily identified by searching within the DNA-binding motif family of another transcription factor that had been identified as enriched by the TFBS enrichment analysis. Motif sequences within the JASPAR 2018 Core Vertebrate database that shared a high degree of similarity to an enriched motif were also included in the final list of transcription factors for downstream assessment. Similarity was determined by the Levenshtein distance between motif cores, the sequence of nucleotides with ≥75% nucleotide frequency consensus in a position, after removing the surrounding “shores” of nucleotides with <75% position frequency consensus. After these additions, we ended up with a list of 115 transcription factors from the initial list of 82 enriched TFBS motifs.
Embryonic Hippocampal Neuron Gene Knockdown Using siRNA
The Accell synthetic siRNA RNA interference system (Horizon Discovery, Waterbeach, UK) was used for species-specific efficient gene knockdown in difficult-to-transfect neurons. Unless otherwise noted, Accell siRNA was ordered in the SMARTpool format, which contains equal concentrations of four siRNA oligonucleotides that each target a different portion of an expressed gene. This provides an advantage in potency and specificity of knockdown. Further proprietary modifications to the siRNA, including lipophile conjugation, facilitate the uptake, stability, specificity, and, ultimately, knockdown efficiency of siRNAs. Accell siRNAs have low toxicity and do not require additional nucleofection reagents for successful transfection of neurons. Accell siRNAs were received at room temperature and stored at −20 °C until resuspension. A 40 µM stock of siRNA was created by resuspending the lyophilized siRNA in an appropriate volume of 1× siRNA buffer (Horizon Discovery, B-002000-UB-100) diluted with RNase-free and endonuclease-free water. For siRNAs used within 3 weeks of resuspension, the stock was stored at 4 °C. Stocks were kept at −20 °C for a longer storage period, avoiding more than one freeze−thaw cycle.
Transfection of neurons was carried out under the same experimental conditions as described previously, with low-density embryonic hippocampal neuron cultures grown on PDL-coated plates or chambered slides. To add Accell siRNA to hippocampal neuron culture, the stock was first diluted in preequilibrated 37 °C NbActiv4. siRNA diluted in media was added to neurons on DIV 1 for a final concentration of 1 µM unless otherwise noted. Neurons were incubated for 5 DIV before being fixed, to allow for sufficient time for the gene knockdown and subsequent decrease in protein expression to take effect. Evaluation of the effective siRNA concentration and knockdown efficiency and the timeline were assessed using either siRNA targeting Doublecortin or ribosomal protein S6 kinase 1 (S6K1;
Evaluation of Doublecortin Knockdown via Immunofluorescence Analysis of Hippocampal Neuron Soma Intensity
Embryonic (E18) hippocampal neurons were cultured on PDL-coated 96-well plates or eight-chambered slides at 2000 or 5000 cells per well, respectively, in NbActiv4 medium at 37 °C. siRNA targeting Doublecortin (DCX; Horizon Discovery, E-080153-01-0005) was added to neurons after 1 DIV or on the same day as neurons were plated and fixed at 2, 3, or 4 DIV after addition of siRNA to assess knockdown. After neurons were fixed, they were permeabilized, blocked, and stained as previously described. Neurons were stained overnight at 4 °C in blocking buffer with rabbit anti-DCX (1:1000; Cell Signaling, Danvers, MA 4604S) and mouse anti-BIII-tubulin (1:2000; made in-house) to visualize the neurites and soma. After five washes with PBS, secondary antibodies (goat anti-mouse Alexa Fluor 488 and goat anti-rabbit Alexa Fluor 546) and Hoechst were added in blocking buffer for 1 h at room temperature. Neurons were washed five times and coverslipped if a chambered slide was used.
The level of knockdown was calculated as the normalized expression of DCX in neurons treated with DCX-targeted siRNA compared with reference neurons treated with nontargeting control siRNA (Horizon Discovery, D-001910-10-05). The expression of DCX in neurons was quantified by measuring protein levels as assessed by immunofluorescence. Neurons were imaged and analyzed using the Cellomics automatic tracing assay described earlier, except only the cell body mask was used for downstream analysis. DCX expression for each neuron was quantified within the DCX channel as the total intensity of the pixels within the traced cell mask, calculated as the sum of the individual intensity values. Using average pixel intensity instead of total intensity yielded similar results.
Evaluation of S6K1 Knockdown and S6 Phosphorylation via Western Blotting Analysis of Lysates from Hippocampal Neurons
Embryonic (E18) hippocampal neurons were cultured on a PDL-coated 48-well plate at 0.25 × 10⁶ cells per well in 250 µL of NbActiv4 medium at 37 °C. For hippocampal neurons treated with DMSO (0.02%) or RO48 (2 µM), neurons were treated 3 h after being plated. For hippocampal neurons treated with either S6K1-targeted siRNA (Horizon Discovery, E-099323-00-0005) or nontargeting control siRNA, neurons were treated on DIV 1 at a final siRNA concentration of 1 µM, per the manufacturer’s instructions. At DIV 5 the medium was aspirated, and cells were washed with PBS once. Immediately after being washed, neurons were lysed with preheated SDS loading buffer (100 mM Tris HCl, pH 6.8, 4% SDS, 20% glycerol, 10% B-mercaptoethanol, 0.04% Bromophenol Blue) containing protease (Roche, 11-873-580-001) and phosphatase (Clontech, Mountain View, CA) inhibitors. Each well monolayer was scraped using a pipette tip, and the same tip was used to transfer the cell lysate to a 1.5 mL Eppendorf tube placed in a heat block. Samples were kept at 95 °C for 10−15 min before moving samples onto ice for 10 min. Samples were stored at −20 °C until needed.
Sodium dodecyl sulfate−polyacrylamide gel electrophoresis was performed using precast NuPAGE Bis-Tris 15-well gels with a 4%−12% polyacrylamide gradient (Invitrogen, NP0336BOX) run at 150 V constantly in MOPS running buffer (Invitrogen, NP0001) until the tracking dye reached the bottom (approximately 1 h). Protein was transferred from the gel to a prewet nitrocellulose membrane using a vertical wet transfer apparatus run at 50 mA for 2 h, with 26 mM sodium bicarbonate as the transfer solution. After protein transfer, membranes were blocked with Odyssey blocking buffer (LiCor, Lincoln, NE, 927-50000) for 1 h. Blocking solution was removed and membranes were incubated on a shaker overnight at 4 °C in Odyssey blocking buffer 0.1% Tween-20 with added primary antibody (mouse anti-pan-S6, 1:250, Cell Signaling; rabbit anti-phospho[S240/244]-S6, 1:1000, Cell Signaling; mouse anti-BIII-tubulin, 1:5000, made in-house). The next day, membranes were washed four times in PBS with 0.1% Tween-20 (PBST) for 5 min each time to remove remaining unbound and nonspecifically bound antibody, and incubated in Odyssey blocking buffer 0.1% Tween-20 0.01% SDS with secondary antibodies (1:10,000, goat anti-mouse 680RD, goat anti-rabbit 800CW, LiCor, 926-32220, and 926-32211) at room temperature for 1 h with shaking. BIII-tubulin in the IR-700 channel was used to develop total protein reference bands, and phosphorylated protein was measured in the IR-800 channel. Membranes were washed three times for 5 min each in PBST and once for 5 min in PBS before imaging using an Azure 600 gel imaging system (Azure Biosystems, Dublin, CA). Protein size was calculated using a reference ladder (Bio-Rad, Hercules, CA, 1610373) to verify accurate protein band location. Band intensity for each protein was measured using ImageJ (RRID:SCR_001935) and normalized to the intensity of BIII-tubulin for each sample. The relative phosphorylation level of protein S6 for each sample was calculated by normalizing the IR-800 channel signal from the phosphorylated S6-binding antibody to the IR-700 channel signal from the total S6-binding pan-S6 antibody.
Experimental Setup of siRNA Transcription Factor Knockdown Screen for Effects on Embryonic Hippocampal Neuron Neurite Outgrowth
A total list of 115 transcription factors was assembled from TFBS enrichment analysis. There were 77 transcription factors chosen for enrichment in the upregulated gene set and 41 transcription factors chosen for enrichment in the downregulated gene set, with 3 transcription factors redundant between the two gene sets. Accell rat-specific SMARTpool siRNAs targeting these specific transcription factors were spread across six pairs of identical 96-well plates, using only the inner 60 wells. Perimeter wells were filled with NbActiv4 media without neurons while the plates were being incubated. Each of the 12 plates (6 pairs of plates) was divided into two halves of 30 wells between columns 6 and 7, such that one side of 30 wells (columns 2−6) eventually received DMSO control treatment while the other half (columns 7−11) received RO48 treatment.
Since identical plates were created in pairs, identical wells (wells receiving the same siRNA plus DMSO or the same siRNA plus RO48) were separated across the pair of plates. This was done to minimize the potential confounding effect of interplate differences on downstream analysis, a large source of experimental variation in hippocampal neuron cultures. Prior to pharmacological treatment, the two halves of a given plate are identical, and the organization of siRNAs on one half is transposed onto the other half (e.g., wells B2 and B7 were treated with the same siRNA). Each plate half of inner 30 wells contained 5 nontargeting control siRNA wells and 19 or 20 different transcription factor-targeting siRNAs; thus, each treatment condition could be compared with the mean of 5 control wells in that same half-plate. The remaining wells received hippocampal neurons and pharmacological treatment but did not receive an siRNA treatment. Experiments consisted of four separate embryonic hippocampal preparations for a total of four biological replicates and eight technical replicates per combined siRNA and pharmacological treatment.
As described previously, neurons were plated at 2000 cells per well in 150 µL of preequilibrated NbActiv4 at 37 °C. After 1 DIV, 50 µL of media was removed and neurons were treated with siRNA in 20 µL of NbActiv4 media for a final concentration of 1 µM. After 3 DIV, neurons were treated with either DMSO (0.02%) or RO48 in 20 µL of NbActiv4 media for a final concentration of 2 µM. After 5 DIV, neurons were fixed and stained, using methods described earlier, to assess neurite total length and additional morphological properties.
Statistical Analysis of siRNA Transcription Factor Knockdown Screen for Effects on Embryonic Hippocampal Neuron Neurite Outgrowth
Within each well on all plates across all hippocampal neuron preparations, every identified “object” was subjected to a high-pass total neurite length filter of ≥10 microns. This was used to identify “valid” neurons for the computation of average total neurite length and avoid inclusion of dead neurons and debris and neurons with neurites below the limit of reliable resolvability using a 5× objective. The value of 10 microns was an empirically defined value based on previous reports from our lab using the Cellomics imaging and automated neurite tracing system. 34 Wells with neurons that did not receive an siRNA treatment (either transcription factor-targeting or nontargeting control) were not included during downstream analysis. All downstream analysis of wells on each plate at this point was done separately for DMSO-treated wells and RO48-treated wells. To be counted as valid, a well must also contain the larger of 75 valid neurons or the number of valid neurons 2 standard deviations below the mean number of valid neurons within the appropriate control wells on a given plate.
Since large differences in cell density for low-density hippocampal cultures can affect neurite outgrowth and/or total neurite length measurement, an additional high-pass filter was created on a per-plate basis that removed wells in which the tally of valid neurons identified was less than the mean of the five nontargeting control siRNA wells minus 2*SD, removing an average of about four wells per plate. Average neurite total length for each well was normalized to the mean of the five nontargeting control siRNA wells on each half-plate. The control siRNA wells were located in the same position across all plates and served as a reference value to control for interplate variability. However, the nontargeting control siRNA, or one or a combination of the four oligos in the SMARTpool, appeared to negatively affect neurite outgrowth, and thus the control siRNA wells were removed from downstream analysis after normalization of neurite total length values on each plate.
Without a negative control siRNA to compare neurite outgrowth to, the entire population of transcription factor-targeting siRNAs was used to evaluate total neurite length values. Within each hippocampal neuron preparation (one biological replicate), the mean neurite total length (two technical replicates) for each transcription factor-targeting siRNA + DMSO or transcription factor-targeting siRNA + RO48 was transformed to a robust Z score:


The robust Z score (eq 1) for a single siRNA treatment was computed as the deviation from the median (the difference between the neurite total length [NTL] for that siRNA minus the median neurite total length of all the siRNAs for that hippocampal neuron preparation) divided by the median absolute deviation (MAD). The median absolute deviation (eq 2) was calculated as the median absolute value of all the siRNA median deviations for that neuron preparation. The robust Z score is a modified Z score that is robust to the effect of outliers on Z-score calculation. The four biological replicate robust Z scores for a given siRNA treatment were averaged to yield a single mean robust Z score.
To determine “hit” transcription factors that increased or decreased neurite outgrowth relative to the entire population of transcription factors tested, siRNAs were evaluated for a statistically significant difference in neurite total length compared with the population median (neurite total length = 0) using a two-sided one-sample t test. Comparisons of neurite total length between DMSO and RO48 treatments for a given siRNA were evaluated using a pairwise two-sample Welch t test.
siRNA Screen Validation
Rat embryonic (E18) hippocampal neurons were plated at 2000 cells per well in PDL-coated 96-well plates as described previously. Three separate preparations (biological replicates) of hippocampal neurons with 15 total technical replicates were used to validate hits. For each treatment, neurons were plated in quintuplicates on a plate. After 1 DIV, hippocampal neurons were treated with siRNA targeting a hit transcription factor, negative control transcription factor Oxr1 (Horizon Discovery, E-101648-00-0005), or one of the four siRNA oligonucleotide sequences (D-001910-01-05, D-001910-02-05, D-001910-03-05, D-001910-04-05) that together compose the nontargeting negative control siRNA SMARTpool. On DIV 3, neurons were treated with either DMSO (0.02%) or RO48 (2 µM). Neurons were fixed on DIV 5 and stained with BIII-tubulin to visualize neurites, as described previously. Nontargeting control siRNA oligonucleotide sequence 3 (UGGUUUACAUGUUUUCCUA) was determined to be the negative influence on neurite outgrowth among the control siRNA SMARTpool sequences, and therefore was included in downstream analysis separately as a comparison. Nontargeting control siRNA oligonucleotide sequences 1, 2, and 4 (UGGUUUACAUGUCGACUAA, UGGUUUACAUGUUUUCUGA, UGGUUUACAUGUUGUGUGA) were considered “true” negative controls due to their similarity in neurite total length to the neurite total length of Oxr1, a transcription factor previously determined to not affect neurite outgrowth when overexpressed in embryonic neurons.40−42 Similar to the siRNA screen analysis, a per-plate high-pass filter was created to remove wells with valid neuron counts below the mean minus 2*SD of wells that were treated with control siRNA oligonucleotide sequence 1, 2, or 4. Neurite total length values for each well on a plate were normalized to the mean neurite total length of wells treated with control siRNA oligonucleotide sequence 1, 2, or 4.
Results
Identification of RO48-Induced Changes to Gene Expression in Embryonic Hippocampal Neurons
Previous work with the kinase inhibitor RO48 revealed a robust ability to promote both neurite outgrowth in vitro and axon outgrowth in vivo in a murine model of spinal cord injury.
28
To determine gene expression changes associated with inhibition of target kinases by RO48, we generated samples for RNA-seq by treating embryonic rat hippocampal neurons in high-density cultures for 2 days with RO48 or vehicle control. To analyze differences in expression of genes between samples, DMSO vehicle-treated samples were used as the reference and genes were assessed using likelihood ratio testing to determine the genes in the RO48 samples that had statistically significant increases or decreases in expression compared with the DSMO samples. There were 817 genes with increased expression (“upregulated” genes) and 1102 genes with decreased expression (“downregulated” genes), detected at a threshold of false discovery rate of <5%. Differentially expressed genes were visualized using a heatmap of per-sample expression, and hierarchical clustering of samples revealed that samples clustered together according to treatment group, indicating a high degree of similarity in differential gene expression across samples (
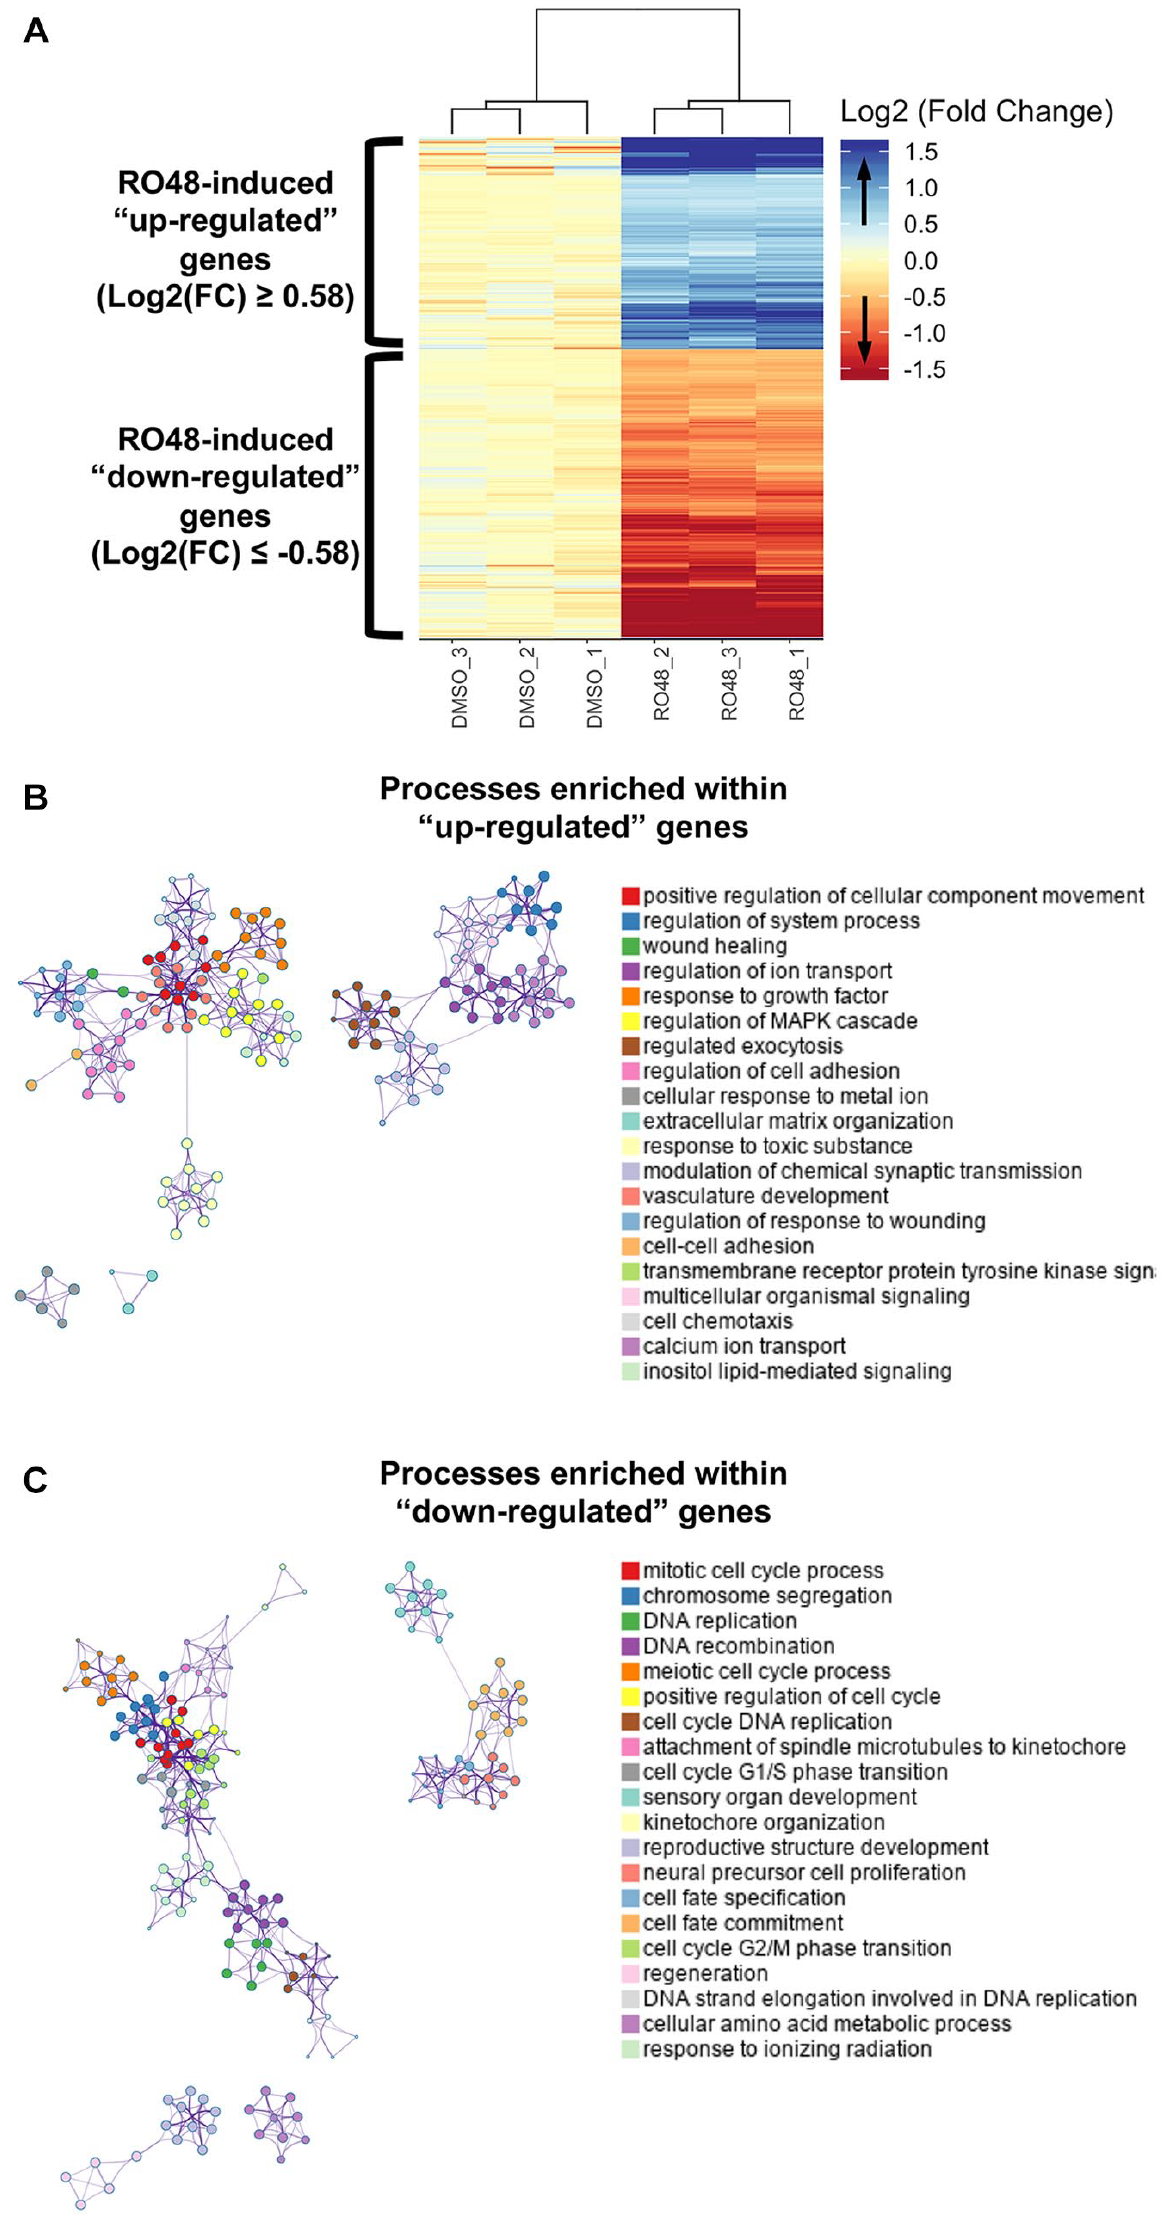
Differential regulation of genes in rat hippocampal neurons after RO48 treatment. (
Functional gene categories involved in the transcriptional regulation induced by RO48 treatment were determined using Metascape Gene Ontology software
38
for gene set enrichment analysis of biological processes. Differentially expressed genes were divided into the upregulated gene set and the downregulated gene set to identify biological processes putatively associated with increased or decreased cellular activities, respectively. Examination of biological processes enriched within the upregulated genes revealed a wide diversity of activities associated with neuronal function, including positive regulation of cellular component movement, regulated exocytosis, regulation of cell adhesion, and modulation of chemical synaptic transmission (
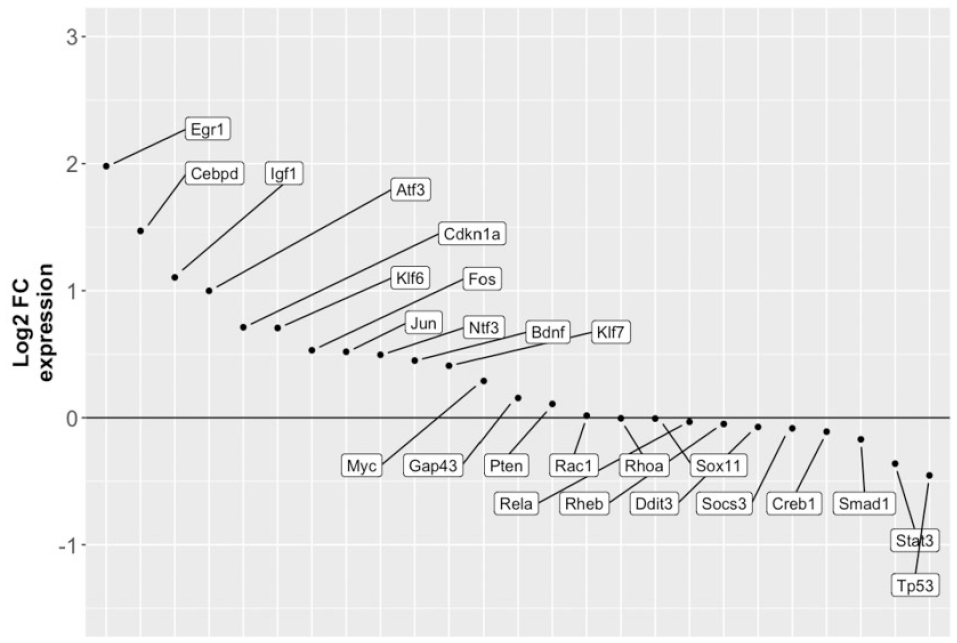
RO48 regulates the expression of genes associated with axon regeneration. Following the differential expression analysis depicted in Figure 1, about two dozen genes with prior evidence of association with axon growth and regeneration (RAGs) were surveyed for the log2(FC) of their expression. Most of these were upregulated in our data set.
Putative Transcriptional Regulators of RO48-Enhanced Neurite Outgrowth Identified Using DNA-Binding Site Enrichment Analysis of Differentially Expressed Genes
RNA-seq is capable of describing broad changes in the expression of genes associated with differences in treatment conditions, but does not adequately identify relevant therapeutic targets or transcriptional mechanisms underlying the observed phenotype. One clue to the mechanisms underlying regulated gene expression is the binding of activated transcription factors to DNA. Transcription factors recognize TFBS motifs found in the promoter regions of genes, and the organization of TFBSs throughout the genome creates a mechanism for transcription factors to regulate the transcription of target genes. We hypothesized that TFBS motifs enriched within the differentially expressed gene modules associated with RO48 treatment would help to identify transcription factors putatively mediating the observed differences in gene expression. Differentially upregulated and downregulated genes were analyzed separately using the oPossum tool
39
to identify TFBS motifs enriched within putative gene promoters (2000 base pairs centered on each gene transcription start site of a differentially expressed gene). We examined TFBSs both for broad enrichment among a significant number of differentially expressed genes and for overall enrichment among the population of TFBSs in these gene sets (
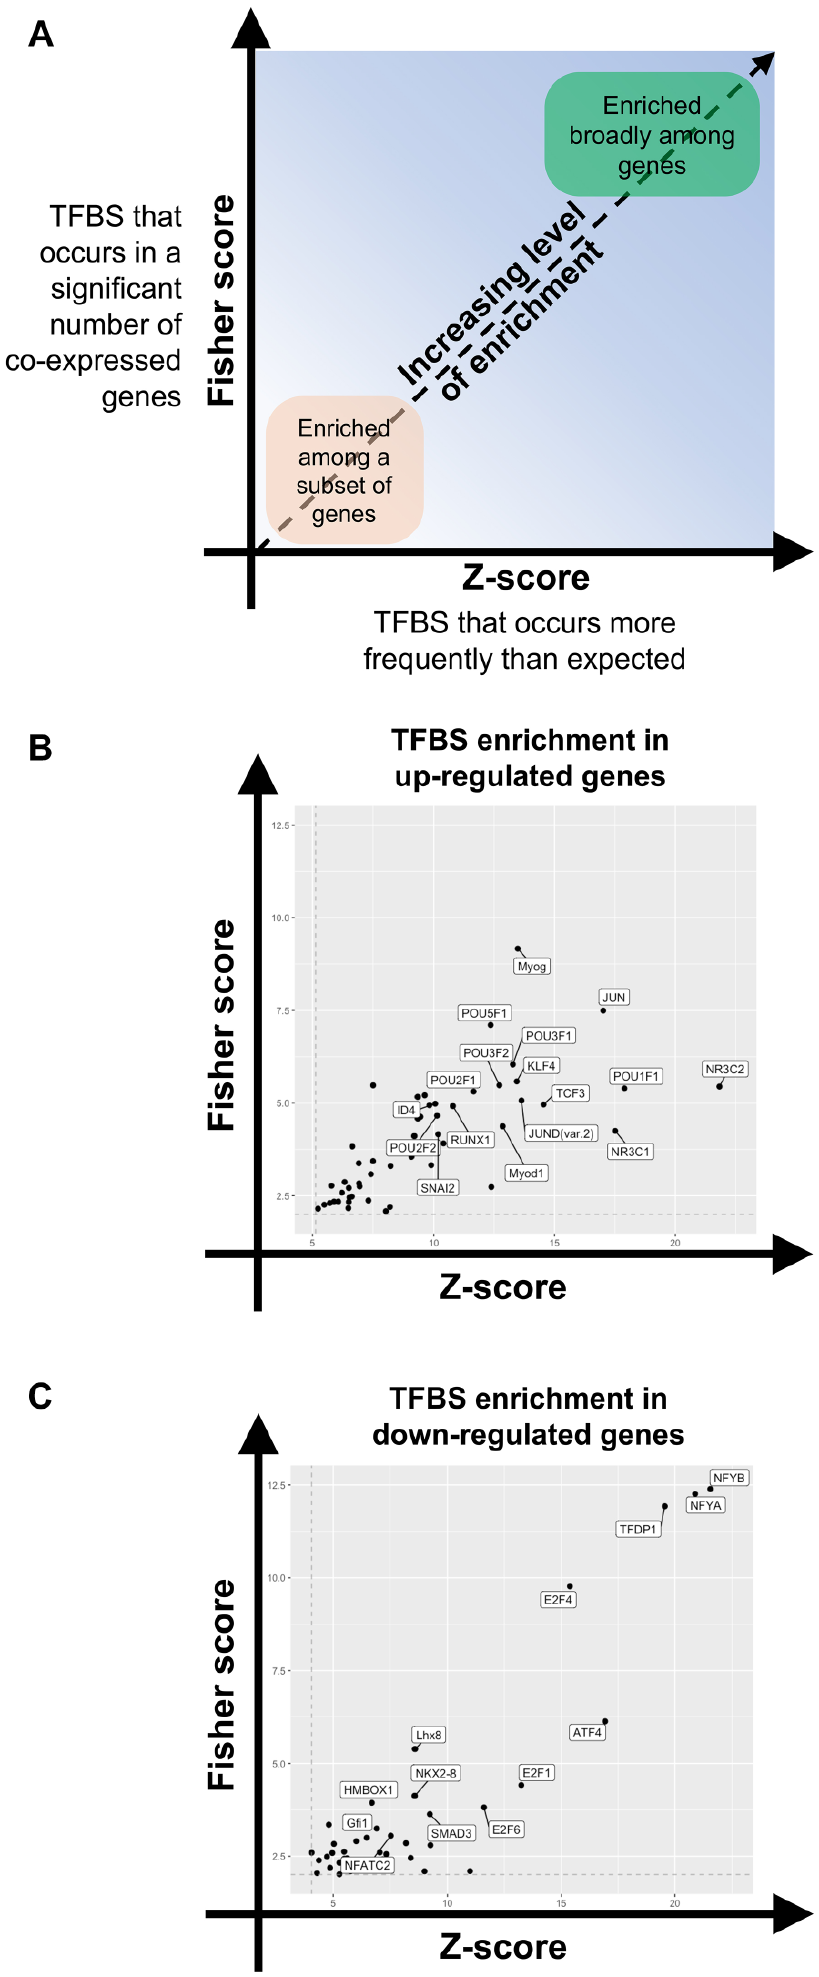
TFBS enrichment identifies putative regulators of gene expression after RO48 treatment in hippocampal neurons. Promoters of upregulated and downregulated differentially expressed genes in RO48-treated hippocampal neurons were separately assessed for enrichment of TFBS motifs. TFBS motifs were assessed based on Fisher score (y axis) and Z score (x axis) thresholding to determine enriched motifs. (
TFBS enrichment analysis revealed 42 DNA-binding motifs that were enriched within the upregulated gene set and 40 DNA-binding motifs that were enriched within the downregulated gene set (
Loss-of-Function siRNA Screen for Transcription Factors Regulating Neurite Outgrowth
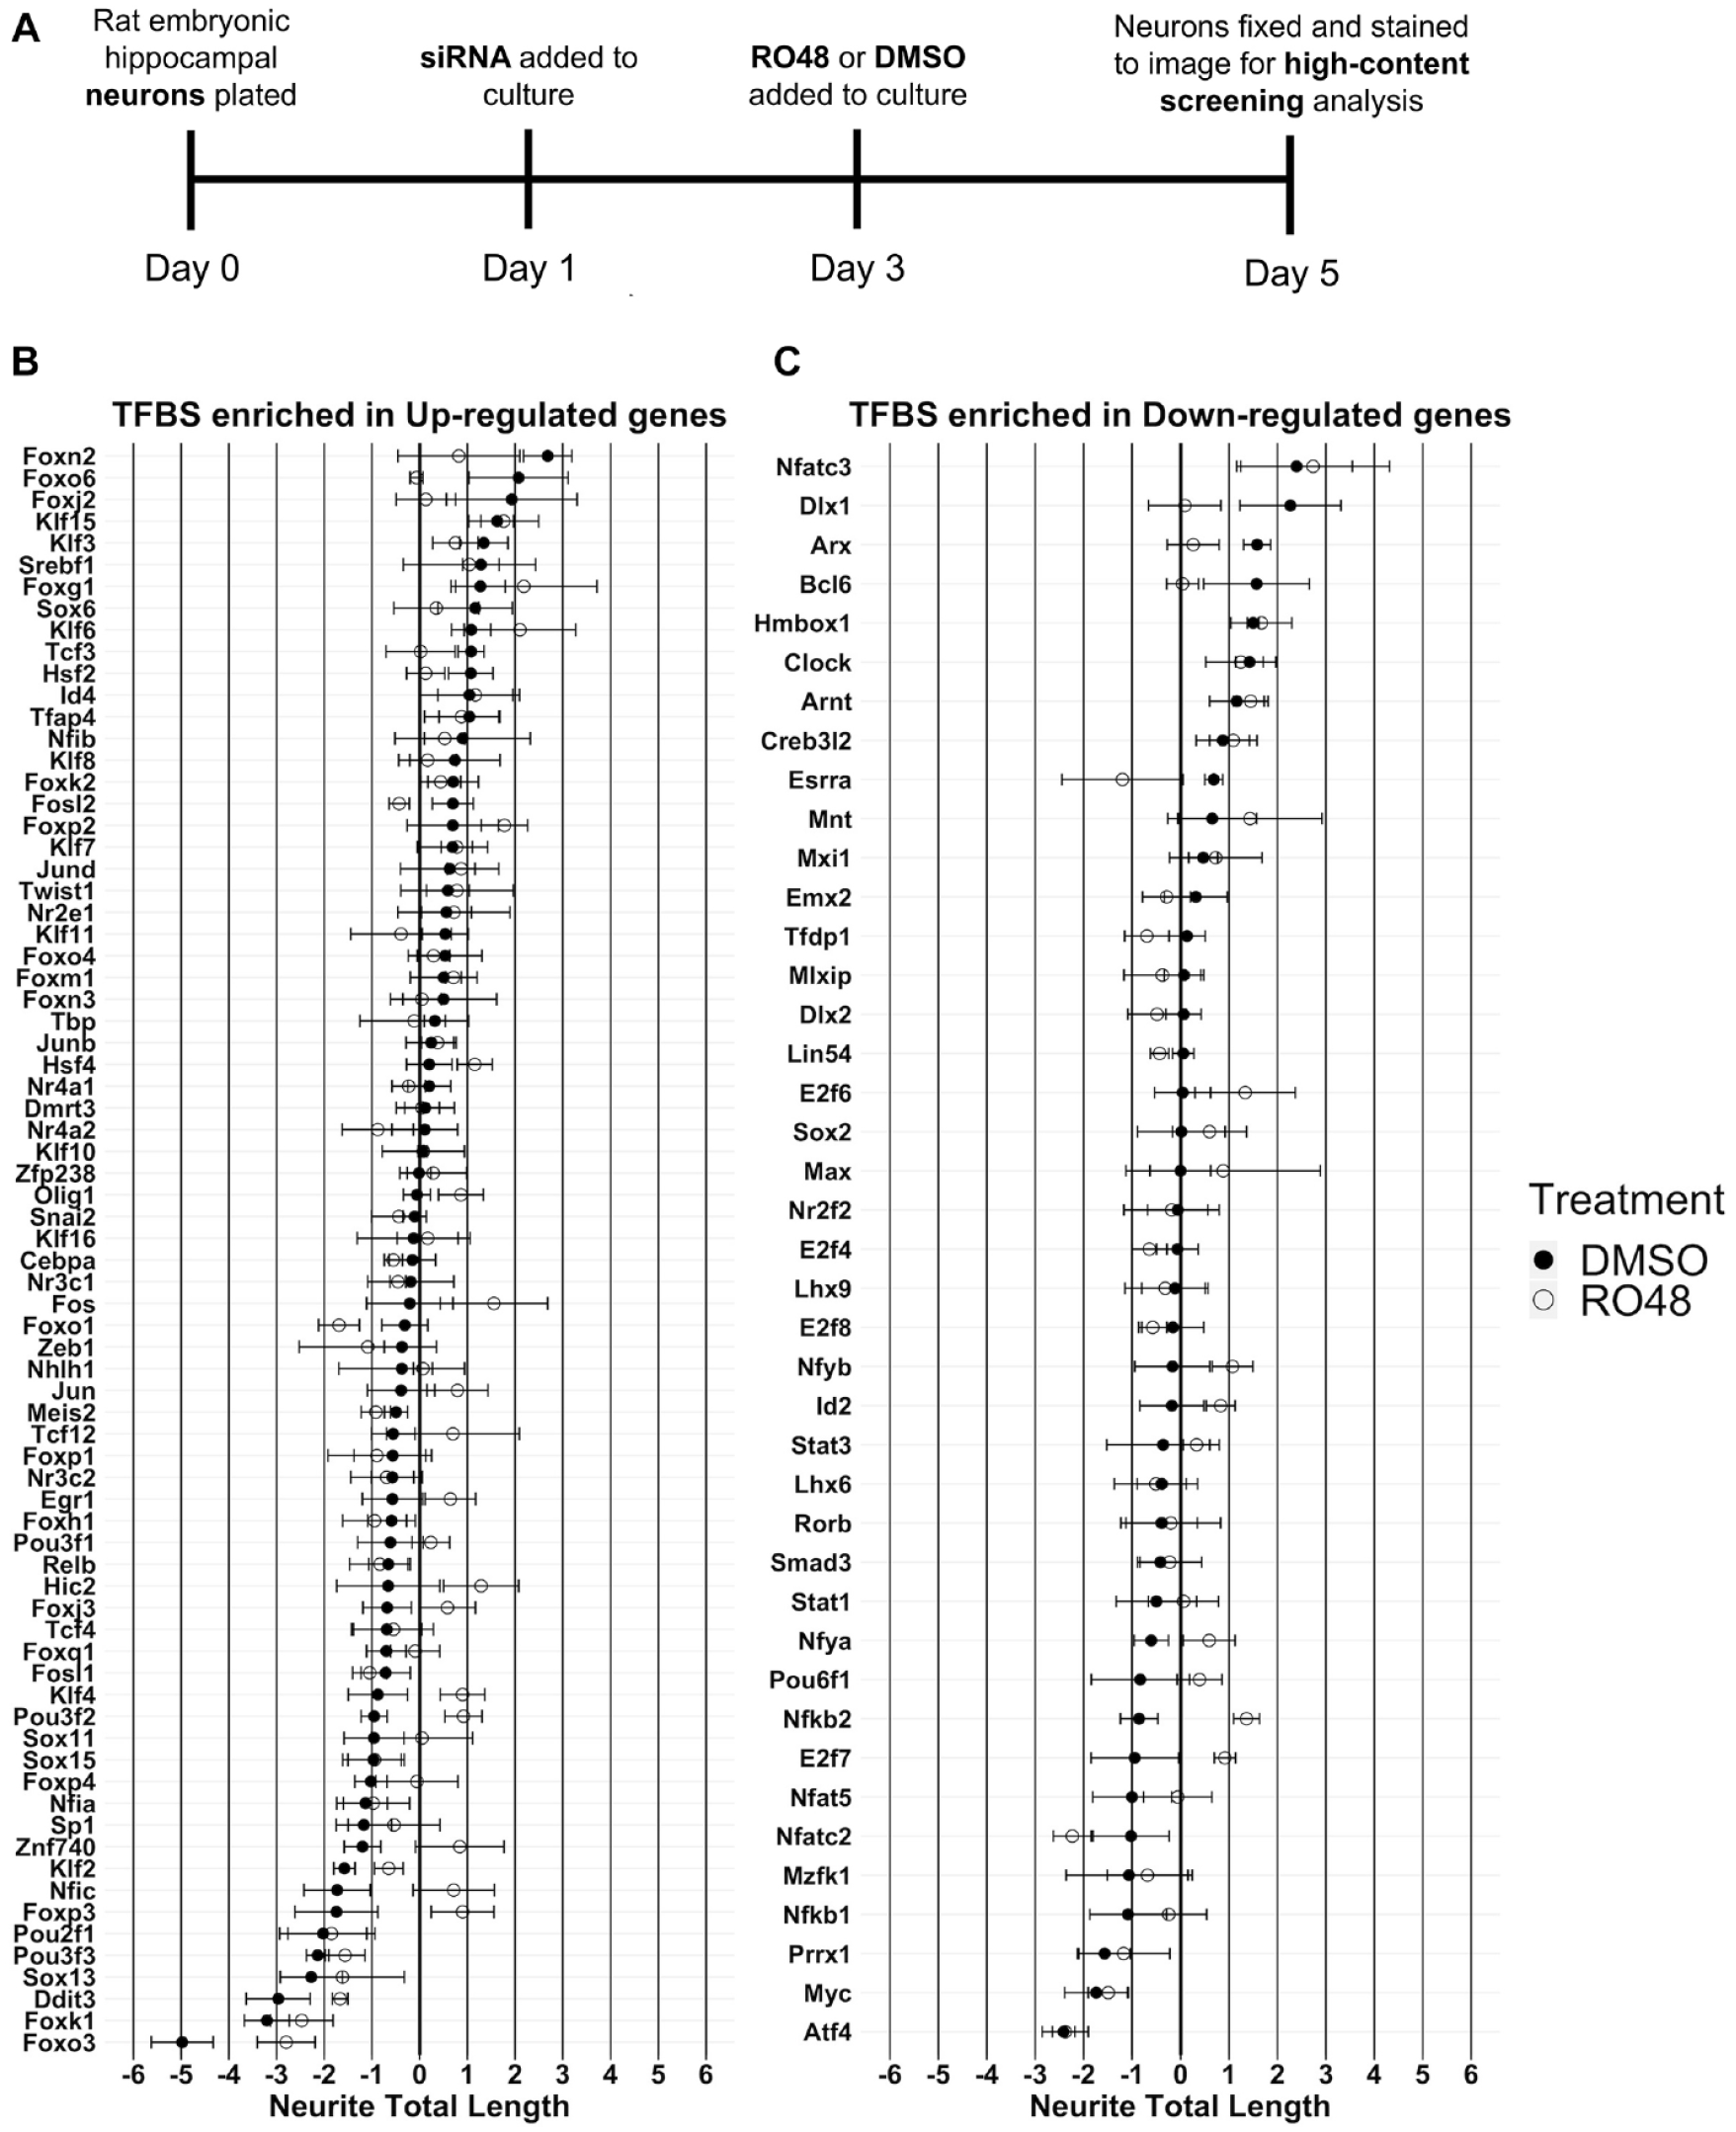
To determine if the transcription factors identified using TFBS enrichment of differentially expressed genes are functionally linked to neurite outgrowth, a loss-of-function siRNA screen was employed to evaluate the effect of knockdown of each of 115 transcription factors on RO48-enhanced or baseline (DMSO treatment) neurite outgrowth. This list of 115 transcription factors was compiled from the 82 enriched TFBSs as outlined in Materials and Methods. Prior to the screen, we evaluated the ability of siRNAs to knock down the expression of two test genes, DCX and S6K1, for which we had reliable antibody tests. These experiments determined that substantial knockdown can occur in our cultures by 2 DIV (
In the screen, embryonic hippocampal neurons were plated at low density in PDL-coated 96-well plates and treated on the first day in vitro (DIV1) with siRNA targeting one of the identified transcription factors or a nontargeting control siRNA. On DIV3, neurons were treated with DMSO or RO48 before neurite outgrowth was assessed on DIV5 (
(
One-sample statistical comparison of each transcription factor effect to the median baseline (robust Z score = 0) identified eight hits that promoted neurite outgrowth in DMSO treatment (Foxn2, KLF15, Arx, Hmbox1, Clock, Srebf1, Tcf3, Esrra), eight hits that reduced neurite outgrowth in DMSO treatment (Pou3f2, KLF2, Pou3f3, Sox13, Atf4, Ddit3, Foxk1, Foxo3), five hits that promoted neurite outgrowth in RO48 treatment (Foxp2, Arnt, Nfkb2, E2f7, Foxm1), and seven hits that reduced neurite outgrowth in RO48 treatment (Myc, Ddit3, Foxo1, Nfatc2, Atf4, Foxk1, Foxo3) (
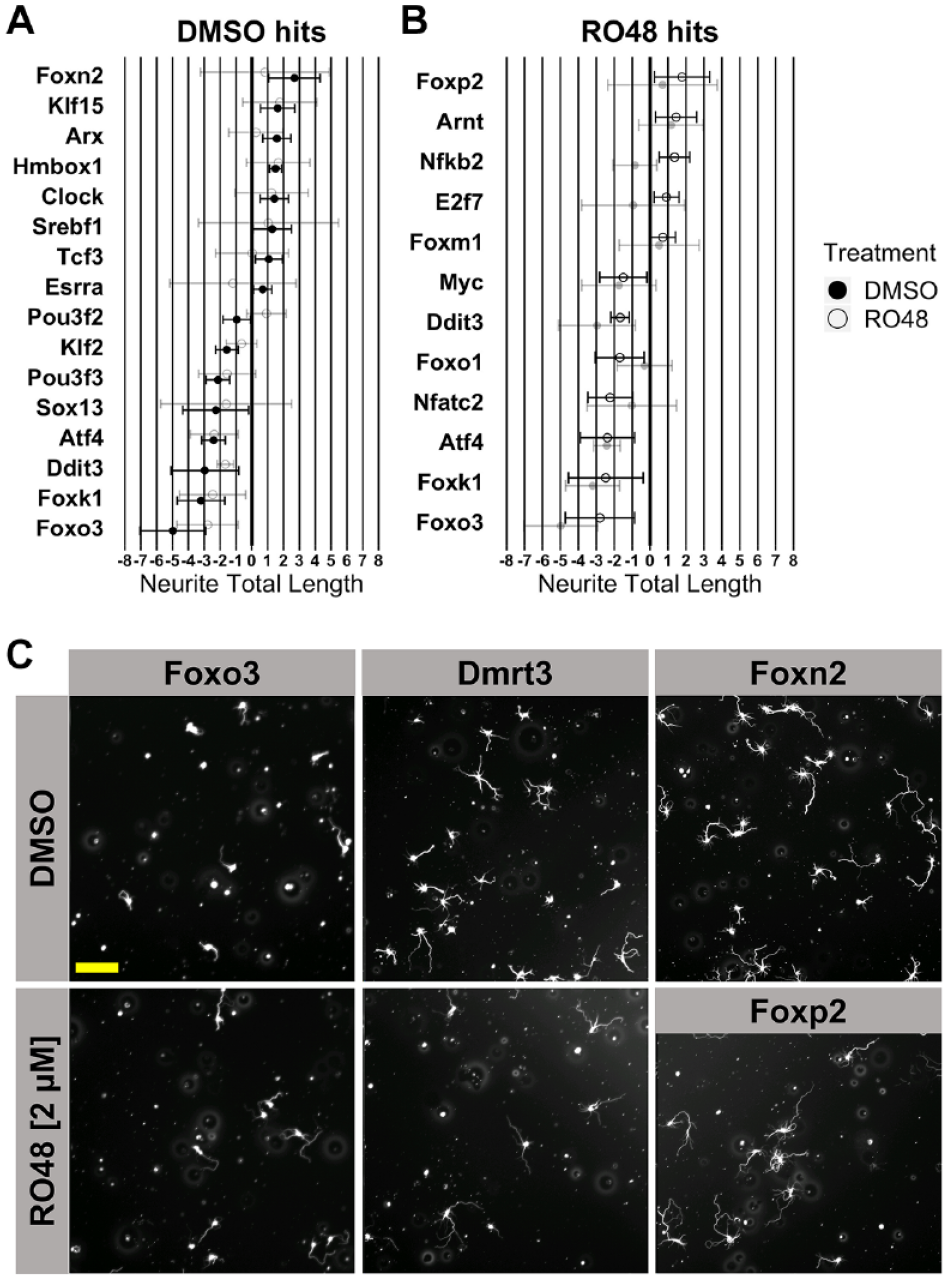
Knockdown of transcription factors predicted to drive differential gene expression after RO48 treatment affects neurite outgrowth. (
siRNA Screen Hit Validation
Without a reliable baseline control for comparison of transcription factor effects in the initial siRNA screen, it was necessary to validate hit transcription factors to further evaluate their effects on neurite outgrowth. Among the hit transcription factors identified from the siRNA screen, Foxp2, Foxn2, Foxo3, Foxo1, and Nfatc2 were chosen for further validation. Foxp2 and Foxn2 were chosen because they were hits that caused the largest promotion of neurite outgrowth in RO48 and DMSO treatments, respectively. Similarly, Foxo3 was chosen for validation because it produced the largest reduction of neurite outgrowth in both RO48 and DMSO treatments. Lastly, Foxo1 and Nfatc2 were chosen because of the decreases in neurite total length produced in RO48 treatment but not DMSO treatment, which could indicate an RO48-specific role for these two transcription factors in promoting neurite growth.
In the validation screen, we used “scramble” oligos 1, 2, and 4 for a negative control baseline because they did not negatively affect neurite outgrowth (
One-sample statistical comparison of hit transcription factor effect to the normalized control siRNA value (neurite total length = 1) was used to evaluate significance. Overall, the transcription factor hits for which knockdown decreased neurite growth in the siRNA screen exhibited similar decreases in neurite length upon validation, although a direct comparison is not possible because of a difference in normalization techniques (
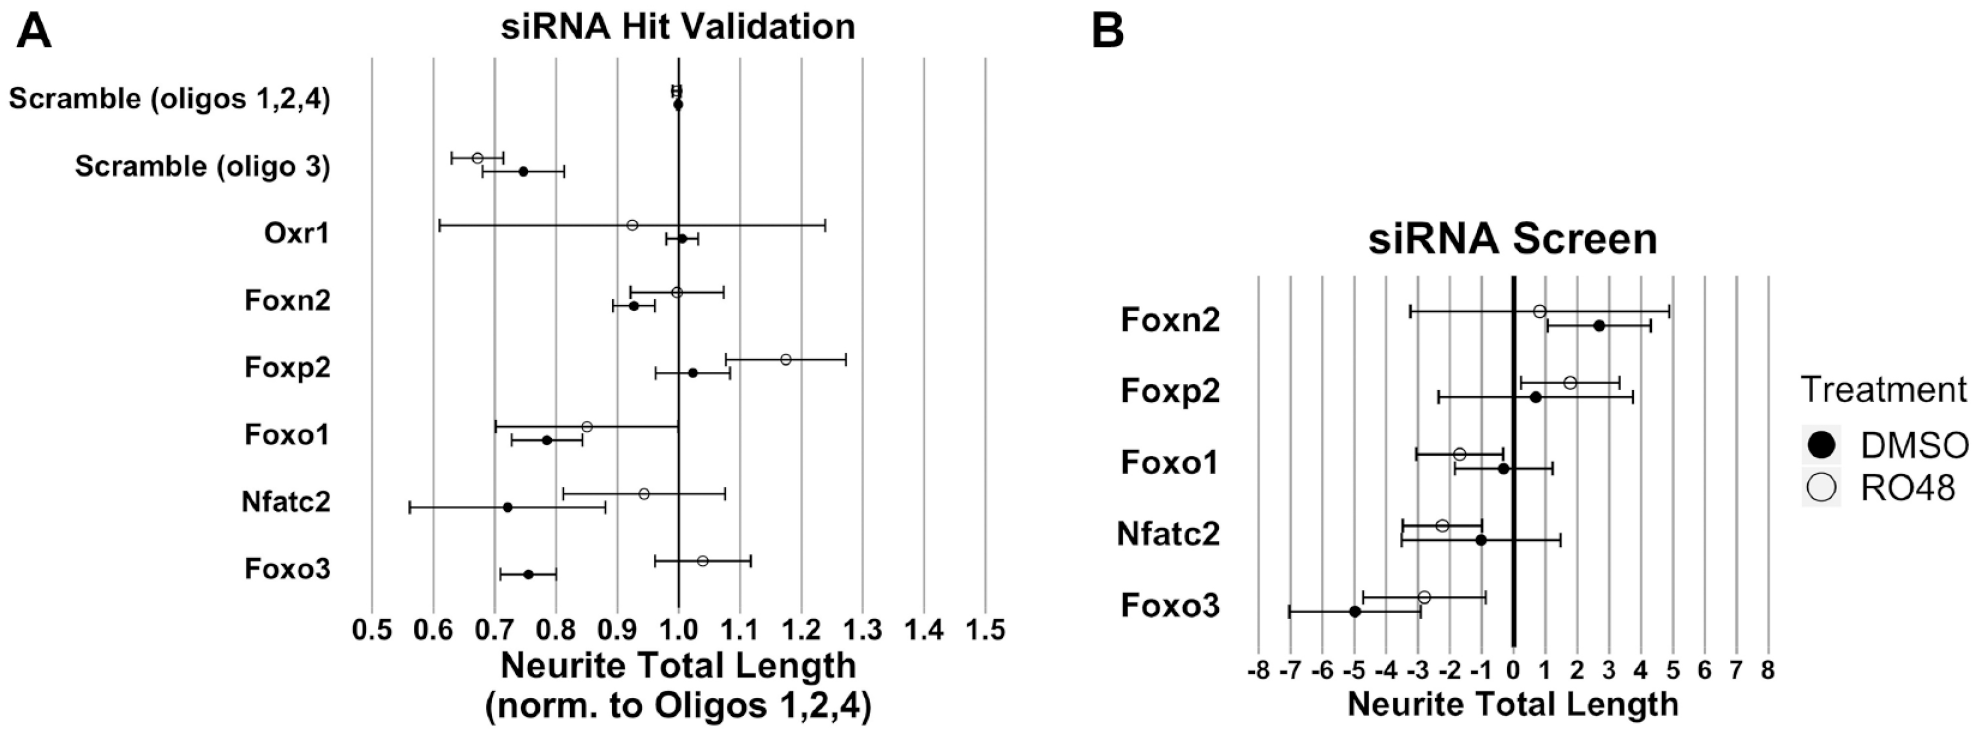
Validation of siRNA transcription factor target hits. A validation experiment was performed using siRNAs with significant effects from the initial screen. (
Discussion
The control of axon formation likely involves coordinated use of a large cohort of expressed genes rather than a select few, as suggested by studies designed to characterize a transcriptional regeneration program.2−4,9 Identification of this relevant cohort presents a substantial challenge. We approached this issue by examining the effects of a multitarget kinase inhibitor (RO48) with unusual efficacy in promoting neurite/axon growth. Our differential gene expression analysis revealed almost 2000 genes with significantly altered expression in hippocampal neurons after treatment with RO48. Interestingly, RO48 increased the expression of many, but not all, previously known RAGs, suggesting that its axon growth-enhancing effect taps into at least some known axon regulatory processes.
To gain more insight into axon growth mechanisms induced in RO48-treated neurons, we considered the ensemble of up- or downregulated genes as a whole for enrichment of cellular processes. Functional gene categories enriched within the upregulated genes included a number of axon growth-related cellular functions, suggesting that RO48 is able to promote diverse signaling processes required for axon growth. On the other hand, the functional gene categories enriched within the downregulated genes were more limited and centered on mitotic processes. It is plausible that RO48 inhibits cell cycle-associated functions found in precursor cell populations derived from the embryonic hippocampus,43,44 while accelerating differentiation processes associated with mature neuronal phenotypes. 45
We used TFBS enrichment analysis to identify overrepresented DNA-binding motifs in the promoter regions of differentially regulated genes with RO48 treatment. Although the TFBSs were associated with either upregulated or downregulated genes, we cannot determine whether RO48 increases or decreases the activity of a specific transcription factor, since transcription factors can act as activators and/or repressors of gene transcription. An advantage of the enrichment analysis, though, is its basis in “activity-based” changes in gene expression that incorporate promoter accessibility and transcription factor expression/activity, so enrichment of a TFBS likely represents the outcome of meaningful upstream regulation of one or more transcription factors. Since a relatively small cohort of transcription factors has previously been determined to have a role in axon growth, the majority of those we identified were mechanistically novel. Potential identification of novel axon growth-regulatory transcription factors suggests that transcriptional reprogramming induced by RO48 may involve pathways not previously studied in the context of axon growth. Conversely, a small group of transcription factors we identified (Jun, Atf4, KLF4, Stat3, Myc) has been associated with axon growth and/or regeneration, suggesting that RO48 may also activate known pathways. Potentially, these pathways are “enhanced” in RO48-treated hippocampal neurons, just as neurite outgrowth is enhanced relative to that seen in control neurons.
Among transcription factors previously identified as RAGs, a number have been shown to be involved in axon growth, including CREB, KLF6/7, Sox11, c-Jun, ATF3, STAT3, and p53.19,22,24,26,27,42,46,47 However, other transcription factors such as tumor suppressors may be growth restrictive, redirecting cellular resources and competing with other cell functions or repressing expression of growth-associated proteins. 48 It is clear that axon regenerative capacity can be limited by neuron-intrinsic mechanisms, so that lifting the brakes on these mechanisms may enable and even facilitate axon growth, a phenomenon demonstrated by kinase inhibitors that promote growth in the context of ROCK, PKC, or S6K1 inhibition.28,49−51
As is typical of screens, even with curated gene lists, the majority of transcription factors we tested in our phenotypic assay were not hits. This could be because transcription factors were not knocked down sufficiently for a biologically meaningful attenuation in activity or because normal expression of the transcription factor is not required for regulating neurite outgrowth in hippocampal neurons. The majority of the transcription factors tested, hits and nonhits, have limited or no documented evaluation for roles in axon growth mechanics, so our study should provide a useful addition to the understanding of networks regulating neurite outgrowth in CNS neurons. Interestingly, neither the pro-regenerative transcription factors KLF6, KLF7, c-Jun, Sox11, and STAT3 nor the growth-restricting transcription factors KLF4 and KLF16 19 appeared as hits in our screen. Knockdown of c-Jun, KLF4, KLF7, and STAT3 also failed to alter neurite outgrowth in an siRNA screen performed in neuron-like F11 cells. 52 These data support the idea that even well-designed screens will suffer from false negatives and cannot be considered comprehensive assessments.
Approximately 20% of the transcription factors tested were identified as hits in our screen, a high percentage presumably linked to the methods used to select these transcription factors for screening. Of the five transcription factors chosen for validation studies, only Foxn2 failed to show related activity in the second screen. Nfatc2 knockdown appeared to inhibit outgrowth in RO48-treated neurons in the screen and reduced outgrowth in controls upon retesting. Nfatc2 has been previously linked to promotion of axon growth in sensory and commissural neurons during development, consistent with our knockdown findings.53,54 These results suggest that further exploration of Nfatc2 function in CNS axon growth is warranted. Knockdown of Foxo1 and Foxo3 decreased neurite outgrowth in the validation test; the results were mostly consistent with results from the initial screen. The FoxO family comprises tumor suppressors that act as an integration hub for signals associated with cell growth, metabolism, and oxidative stress. 55 Downstream of insulin/insulin-like growth factor signaling, they are phosphorylated by evolutionarily conserved PI3K-AKT signaling, which causes the exclusion of FoxO proteins from the nucleus and prevents their transcriptional activation of stress resistance and metabolism genes. A knockdown of the single FoxO gene in Caenorhabditis elegans resulted in a reduction in growth cone formation, in line with the validated results found in our screen. 56 In a previous screen, however, overexpression of Foxo3 did not produce a change in neurite outgrowth in postnatal cortical neurons, suggesting that Foxo3 may be necessary but not sufficient for neurite outgrowth. 48 Interestingly, two other FoxO members in our screen, Foxo4 and Foxo6, were not hits, suggesting distinct roles in neurite outgrowth among family members.
Knockdown of another Fox family transcription factor, Foxp2, promoted neurite outgrowth with RO48 treatment in the screen and on retest, supporting a growth-restrictive role of Foxp2. Previous functional studies have implicated Foxp2 in neurite outgrowth during development; in one case, overexpression of Foxp2 decreased neurite growth in embryonic cortical projection neurons, which would be in line with our results showing increased growth upon Foxp2 knockdown. 57 Conversely, two other studies showed that overexpression of Foxp2 in neuron-like cell lines (SH-SY5Y and Neuro2a cells) promoted process outgrowth, and that neurons cultured from the mouse brain ganglionic eminence showed less neurite growth when constitutively expressing a Foxp2 protein with impaired function.58,59 The fact that knockdown of Foxp2 promoted neurite outgrowth in our cultures only with RO48 treatment suggests a possible synergism between the growth-promoting effects of RO48 and Foxp2 downregulation. Overall, our experiments support the idea that kinase inhibitors exert effects on neuronal phenotype at least partly through regulation of transcription factor activity and validate the use of phenotypic screens in concert with informatic analysis of neuronal gene expression.
Supplemental Material
sj-pdf-1-jbx-10.1177_24725552211026270 – Supplemental material for Phenotypic Screening Following Transcriptomic Deconvolution to Identify Transcription Factors Mediating Axon Growth Induced by a Kinase Inhibitor
Supplemental material, sj-pdf-1-jbx-10.1177_24725552211026270 for Phenotypic Screening Following Transcriptomic Deconvolution to Identify Transcription Factors Mediating Axon Growth Induced by a Kinase Inhibitor by Jeffrey A. Lowell, Nicholas O’Neill, Matt C. Danzi, Hassan Al-Ali, John L. Bixby and Vance P. Lemmon in SLAS Discovery
Footnotes
Acknowledgements
We acknowledge and appreciate the excellent technical assistance provided by Yan Shi (Miami Project High Content Screening Core) and Melissa Muñoz. We gratefully acknowledge library preparation and sequencing services provide by the Sylvester Comprehensive Cancer Center, Onco-Genomics Shared Resource.
Supplemental material is available online with this article.
Declaration of Conflicting Interests
The authors declared no potential conflicts of interest with respect to the research, authorship, and/or publication of this article.
Funding
The authors disclosed receipt of the following financial support for the research, authorship, and/or publication of this article: This work was supported by NINDS (R01NS100531), NICHD (R01HD057632), and the Buoniconti Fund to Cure Paralysis. VPL holds the Walter G. Ross Distinguished Chair in Developmental Neuroscience.
References
Supplementary Material
Please find the following supplemental material available below.
For Open Access articles published under a Creative Commons License, all supplemental material carries the same license as the article it is associated with.
For non-Open Access articles published, all supplemental material carries a non-exclusive license, and permission requests for re-use of supplemental material or any part of supplemental material shall be sent directly to the copyright owner as specified in the copyright notice associated with the article.