
Abstract
Upon maturation, primary neuronal cultures form an interconnected network based on neurite outgrowth and synaptogenesis in which spontaneous electrical activity arises. Measurement of network activity allows quantification of neuronal health and maturation. A fluorescent indicator was used to monitor secondary calcium influxes after the occurrence of action potentials, allowing us to examine activity of hippocampal cultures via confocal live cell imaging. Subsequently, nuclear staining with DAPI allows accurate cell segmentation. To analyze the calcium recording in a robust, observer-independent manner, we implemented an automated image- and signal-processing algorithm and validated it against a visual, interactive procedure. Both methods yielded similar results on the emergence of synchronized activity and allowed robust quantitative measurement of acute and chronic modulation of drugs on network activity. Both the number of days in vitro (DIV) and neutralization of nerve growth factor (NGF) have a significant effect on synchronous burst frequency and correlation. Acute effects are demonstrated using 5-HT (serotonin) and ethylene glycol tetra-acetic acid. Automated analysis allowed measuring additional features, such as peak decay times and bursting frequency of individual neurons. Based on neuronal cell cultures in 96-well plates and accurate calcium recordings, the analysis method allows development of an integrated high-content screening assay. Because molecular biological techniques can be applied to assess the influence of genes on network activity, it is applicable for neurotoxicity or neurotrophics screening as well as development of in vitro disease models via, for example, pharmacologic manipulation or RNAi.
Keywords
Introduction
The adult central nervous system (CNS) is characterized by a number of dynamic processes underlying the plasticity needed to support learning and memory. 1 Even in the absence of extrinsic afferents, the brain is able to generate extensive spontaneous network activity patterns. 2 A slow rhythmic bursting activity has been shown in the isolated hippocampus, indicating its genuinely intrinsic nature. Impairments in spontaneous network activity are reported in various CNS disorders, for example, in schizophrenia. 3
Dissociated cultures of hippocampal neurons offer a convenient in vitro model to study spontaneous electrical activity in interconnected neurons. Network activity can be recorded in a noninvasive manner via multielectrode arrays (MEAs). 4 Using these, the spike activity of dozens of cells can be recorded simultaneously, with sufficient time resolution. A major drawback of this technique is poor spatial resolution, because spikes, measured at relatively large micro-electrodes, may arise from multiple neurons, whereas the majority of the neurons in the dish remain unobserved.
Calcium is an important second messenger. In neurons, calcium can provide insights into network activity when monitored with fluorescent indicators in combination with live cell fluorescence microscopy.5,6 High-resolution imaging of these intracellular processes that is minimally affected by photobleaching or phototoxicity can be obtained with a microlens-enhanced dual spinning disk confocal microscope. A computer-assisted stage allows (semi-) automated image acquisition using standard 96-well plates, involving a powerful and robust approach to measure network activity by means of imaging action potential–associated changes in intracellular calcium concentration in primary neuronal cultures in which functional synapses have been formed. 7
Primary hippocampal neurons initially show spontaneous oscillations in intracellular calcium concentration without any synchronicity. After several days in culture, these evolve into synchronized bursts of interconnected neurons.7,8 This maturation process relies on underlying processes such as proper neuronal survival, neurite outgrowth, synapse formation, dendritic spine formation, and so forth. Generation of synchronized network bursts can be considered as a higher-order parameter to assess the (patho-) physiology of neurons in vitro. 9
Because impaired network activity is a frequently observed feature of numerous CNS disorders,10,11 we postulate that hippocampal cultures are an ideal model for screening the effects of pharmacologic compounds on neuronal network activity. Drugs can be applied either acutely (e.g., to measure the involvement of a specific neurotransmitter in the maintenance of the activity) or chronically, during the critical phases of network development, to assess the role of compounds in network formation.
To meet the requirements of today’s pharmaceutical R&D, a screening system needs to be reliable and have sufficient throughput. In a high-content context, a neuronal screening system needs to comprise culturing and imaging of hippocampal neurons in 96-well plates, automated analysis, and storage and management of the generated data.
We describe a validated image- and signal-processing algorithm for the automated analysis of calcium recordings to discover neuroactive drugs, which can be integrated in an existing high-content screening (HCS) platform.
Materials and Methods
Preparation of Primary Hippocampal Cultures
Hippocampi were dissected from wild-type E18 FVB mouse pups in HEPES (7 mM) buffered Hanks Balanced Salt Solution, followed by trypsin digestion (0.05%, 10 min, 37 °C) and mechanical dissociation by trituration through two fire-polished glass pipettes with decreasing diameter. After centrifugation of the cell suspension (5 min at 200g), the pellet was resuspended in minimal essential medium supplemented with 10% heat-inactivated normal horse serum (Innovative Research, Novi, MI) and 30 mM glucose. Cells were plated in poly-D-lysine–coated 96-well plates (Greiner Cell Coat, µClear, Belgium), at 10,000 cells per well and kept in a humidified CO2 incubator (37 °C, 5% CO2). After 4 h, medium was replaced with B27-supplemented neurobasal medium, containing sodium pyruvate (1 mM), glutamax (2 mM), and glucose (30 mM). To suppress proliferation of nonneuronal cells, arabinosylcytosine (2 µM; Sigma-Aldrich, Belgium) was added after 4 d. All cell culture supplies were purchased from Life Technologies (Invitrogen, Merelbeke, Belgium).
Calcium Imaging
Cells were loaded with 2 µM Fluo4-AM in Neurobasal B27 medium at 37 °C and 5% CO2. 12 After 30 min, medium was replaced with recording medium, containing (in mM) CaCl2 0.9, MgCl2 0.5, KCl 2.67, NaCl 138, KH2PO4 1.47, Na2HPO4-7H2O 8, and glucose 10.
Cells were imaged on an inverted dual spinning disk microscope (UltraVIEW-ERS, PerkinElmer, UK), for 5 or 8 min, at 25× magnification and 2 frames/s, with 25 to 35 neurons in each image field. To distinguish neurons from nonneuronal cells, 30 µM glutamate was added during the last minute of recording, following the method of Pickering et al. 13 In later experiments, DAPI (2.5 µg/mL DAPI, 1% TritonX-100, 4% paraformaldehyde) was added after finishing the recording, yielding an image of the nuclei in the recorded field.
Culture Treatment and Pharmacology
To study the acute effects on the neuronal bursting process and validate the presented algorithm, ethylene glycol tetra-acetic acid (EGTA; 1 mM; Sigma-Aldrich) or serotonin (5-HT; 30 µM; Sigma-Aldrich) was added to distinct wells, after 3 min of baseline calcium recording. The effects of EGTA and 5-HT were followed for 4 min before the final glutamate stimulus. In the case of EGTA, extra CaCl2 (5 mM) was included in the glutamate solution. For chronic experiments, cultures were incubated starting the fourth day in vitro with neutralizing mouse monoclonal antibodies (ABs) against nerve growth factor (anti-NGF; 3 to 9 µg/mL; Peprotech, London, UK). A nonbinding mouse monoclonal antibody (anti-BAX; 9 µg/mL; Abcam, Cambridge, UK) was included as a negative control (further referred to as non-sense AB). None of the used antibodies contained NaN3. Effects were followed during days 5 to 7 in vitro.
Manual, Interactive Analysis of Calcium Recordings
Using Volocity (PerkinElmer, Waltham, MA) software, regions of interest (ROIs) were manually drawn around each cell, based on the Fluo-4 signal. The resulting graphs, showing fluorescence over time, were exported to Axograph X software (Berkeley, CA) for further processing. Neuronal or nonneuronal cells were distinguished visually, based on the response to 30 µM glutamate at the end of each recording. 13 Traces of nonneuronal cells, showing a transient calcium flux upon glutamate addition, were discarded. The remaining neuronal traces were individually and visually scored; neurons were considered active if they showed at least one peak, and the percentage of active neurons was calculated. Neuronal traces were normalized with respect to the baseline fluorescence intensity, and mean values within each ROI were plotted as a function of time. Three results were calculated from the trace: the amplitude of the glutamate response, the synchronous bursting frequency (the number of synchronous bursts per minute), and the synchronous bursting amplitude (the average amplitude of synchronous bursts). Synchronicity of bursting was scored using a scoring system from which the definitions are shown in Table 1 . Recordings were analyzed blinded for treatment or days in vitro (DIV).
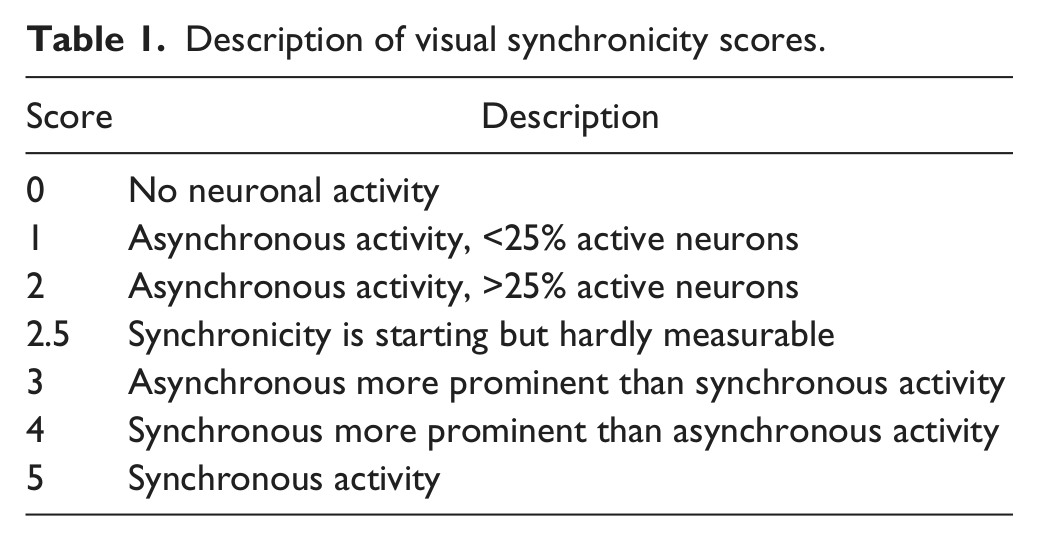
Description of visual synchronicity scores.
Automated Analysis
Calcium recordings were analyzed with an image and signal analysis algorithm implemented in Matlab (MathWorks, Natick, MA). About 30 parameters were reported (
Analysis and Management of Results
Phaedra is a system developed in house for high-content imaging and flow cytometry that offers data visualization and reduction tools and integrates Matlab, R, and Knime for custom image and signal analysis and data mining. 14 Plate- and well-level data are saved in a database (Oracle, Redwood Shores, CA). Through the user interface, one can select the input directory and seven algorithm parameters. The input folder contains image files of all wells of a plate in Zeiss LSM or image cytometry standard (ICS) format. 15 Each image file contains a 3D (2D + time) fluorescence image of that well. After analysis, images and overlays resulting from analysis are compressed and saved in JPEG-2000, 16 while raw and calculated kinetic and cellular data are saved in hierarchical data format 17 files for fast, easy, and flexible access and charting. Drawings in scalable vector graphics format 18 representing cell signals are attached to each well.
Processing a Plate: Input Parameters
Three parameters pertain to the recording: the frame rate of the camera (number of frames/min), the time point of glutamate administration, and the chronic or acute nature of the experiment. In acute experiments, the signal is divided into two parts that are analyzed separately. The first part is an internal control, whereas the second part starts with addition of the drug. For acute experiments, the program specifies a small time period between the two conditions that has to be neglected. Because it starts with drug addition, this period allows the drug to reach the cells and therefore is not representative for any of the two parts.
Four parameters tune the analysis to the signal at hand.
Because rise and decay characteristics are known, the “maximum decay time” filters out decay times from slowly varying signals.
Glutamate addition results in a rapid, large increase of the signal. This high signal level remains in neuronal cells, whereas it is transient in nonneuronal cells. The “maximum drop percentage” indicates the relative loss in mean fluorescence intensity a cell is allowed to have after glutamate addition to be still considered a neuronal cell.
Two parameters steer the peak detection. A local maximum in the signal is considered to be a genuine peak when the amplitude of the signal is above a minPeak intensity level.
The minPeak2NoiseRatio is a factor that is multiplied by an estimation of the noise variance, assuming additive Gaussian noise. 19 The maximum of the resulting value and the minPeak parameter is used as a peak threshold; lower maxima are considered as false peaks.
When input parameters have been selected, the 3D (2D + time) image is read from the ICS file corresponding to the well.
Determining a Cell Mask: Nuclei and Cell Segmentation
A combination of two algorithms is used to delineate borders of cells. One option is using a DAPI-marked cell nuclei image; otherwise, the routine segments the cells using the calcium images only. Within the DAPI image, individual nuclei are segmented by blob detection. The Gaussian smoothed Hessian (matrix of second-order derivatives) of the image is calculated using a scale (standard deviation) of five pixels. Pixels belong to bloblike objects when two conditions are met: Second-order derivatives must be negative and lower than a noise level, and the determinant of the Hessian must be positive. This algorithm is very sensitive to blobs and rather insensitive to the choice of noise cutoff levels, resulting in a binary image in which even faintly stained nuclei are not only distinguished from the background but also clearly separated from each other.
Subsequent labeling results in an image in which all pixels of a connected object have the same value and different objects are represented with different label values. Because these blobs are usually smaller than the real nuclei, area correction is executed. The first correction is the local background correction of the DAPI image by subtracting a Gaussian smoothed image (scale larger than nucleus diameter) from the original. Within this background-corrected image, nuclei are detected using a noise threshold, resulting in a binary mask image in which the nucleus boundary is accurately determined but objects may contain multiple touching nuclei. The final binary image is obtained by growing the blobs (containing well-separated nucleus spots) into the binary mask image, without connecting regions again. In this final image, objects represent single cells with a well-defined border.
Segmentation can also be performed in the absence of DAPI by blob detection in the logarithmically transformed calcium image. The maximum projection of the calcium and label overlay image is stored in a JPEG-2000 format. 16
Intensity variations (“Calcium waves”) are studied over time within object masks by integrating the signal at each time point. This 1D signal is a function of time and may contain different phases.
Signal Phases
Depending on the experiment (acute or chronic), either two or three time phases can be distinguished. The initial phase is the time stretch used to calculate spontaneous bursting. A middle phase occurs only during acute experiments, when the immediate drug-induced response change is observed. The last phase of all experiments is acquisition of the glutamate response.
Determining the Glutamate Addition Time and Intensity Jump
Although glutamate addition is an input parameter, addition is performed manually, resulting in variation. To determine addition time exactly, the whole image is integrated over X and Y dimensions, leaving a 1D time-intensity signal. A nine-point, second-degree Savitzky-Golay 20 smoothed signal stretch is examined just before and after expected glutamate addition and used to calculate the point with maximum increase. We expect the intensity rise to be complete 2 s after maximum increase. Starting at this point, the decay of the glutamate-induced signal is inspected.
Elimination of Nonneuronal Cells
Objects in which glutamate caused less than 20% increase are discarded from further analysis. The intensity decay of remaining cells is measured by calculating the difference between mean intensity during the first 5 s after glutamate and the mean of the last 5 s of the experiment. If the decrease is smaller than the maximum drop percentage, the cell is considered to be a genuine neuronal cell. Other cells are removed from analysis. An image representing real neuronal cells is constructed. The signal stretch before glutamate addition is used to measure neuronal activity.
Neuronal Cell Signal Background Subtraction and Smoothing
Each cell signal is filtered using a minimum filter with elliptic shape and 11 frames (5.5 s) radius to correct for background drift. To enable robust peak location, the signal is smoothed using a nine-point, second-degree Savitzky-Golay filter. 20 For acute experiments, from this stage onward, analysis is performed separately for the signal stretches before and after drug addition. For each active cell, peaks are characterized.
Rejecting Inactive Neuronal Cells
A dual approach is adopted to identify cells without peaks. First, the user enters an absolute minPeak input value. Second, assuming additive Gaussian noise, an estimation of the noise variance for each cell signal is calculated 19 and multiplied by the minPeakToNoiseRatio factor, resulting in a cell-specific noise-based minimum threshold. The maximum of these two quantities is designated as the cell-specific threshold. Cells with only lower signal values are considered nonactive.
Peak Detection in Active Neuronal Cells
Noise-tolerant peak detection returns the location and amplitude of each peak. Spurious peaks are filtered out by comparing amplitudes with the cell-specific threshold. The program generates plots showing peaks and decay points (where signals fall back to 50% of previous peak amplitudes) indicated on top of cell signals. Cell peak and decay values are used to calculate frequency and amplitude statistics.
Cell Calcium Wave Statistics
Burst frequency is expressed as the number of peaks per minute. Only decays below the user-supplied maximum decay time threshold are included. The mean, standard deviation, and median of remaining decays are calculated, as is the percentage of the long decays. Finally, the mean distance between peaks defines the average burst interval.
Statistics Applied to Active Neuronal Cells
Aggregated over all cells results in mean, standard deviation, median, and median of deviation from the median of the average, standard deviation and median burst amplitude, frequency, burst interval, and decay time of all cells.
Calcium Wave Synchronicity Score
Synchronicity is calculated on a transformed signal of reacting cells. Normalization is achieved by dividing the signal by the median of the burst amplitude of that cell.
For each cell x, the calcium signal is recorded as a function of time (t) and represented as a vector X(t), or X in short. The synchronicity of a group of calcium bursts is reflected in the mean or the median of all elements of the correlation matrix R, where R(x,y) represents the Pearson correlation between signals from cells x and y. Each element R(x,y) is related to the covariance matrix element C(x,y):

For vectors X(t),Y(t) representing signals from cells x and cell y, C(x,y) is

E(X) is the expected value of X(t), the mean signal of cell x. C(x,y) is a measure of simultaneous change of cells x and y. If higher values of one cell mainly correspond to higher values of the other cell, and the same holds true for smaller values (i.e., the cells tend to show similar calcium patterns), covariance is positive. In the opposite case, when higher cell values of one cell correspond to lower values of another, cells show out-of-phase calcium waves, and covariance and correlation coefficient are negative.
Synchronous Burst Frequency (SBF) in the Pooled Signal
SBF is calculated using the pooled signals from all neurons. It is probable—but not guaranteed—that peaks with high amplitudes that survive in this signal point to events that occur in multiple cells simultaneously. This is the frequency feature measured in manual experiments and in the literature7,21 and useful in the validation of the new system.
Statistical Analysis and Validation of the Automated Analysis
To test hypotheses about the difference between the manual (interactive) and automated procedure, the analysis of variance (ANOVA) procedure from R was used. 22
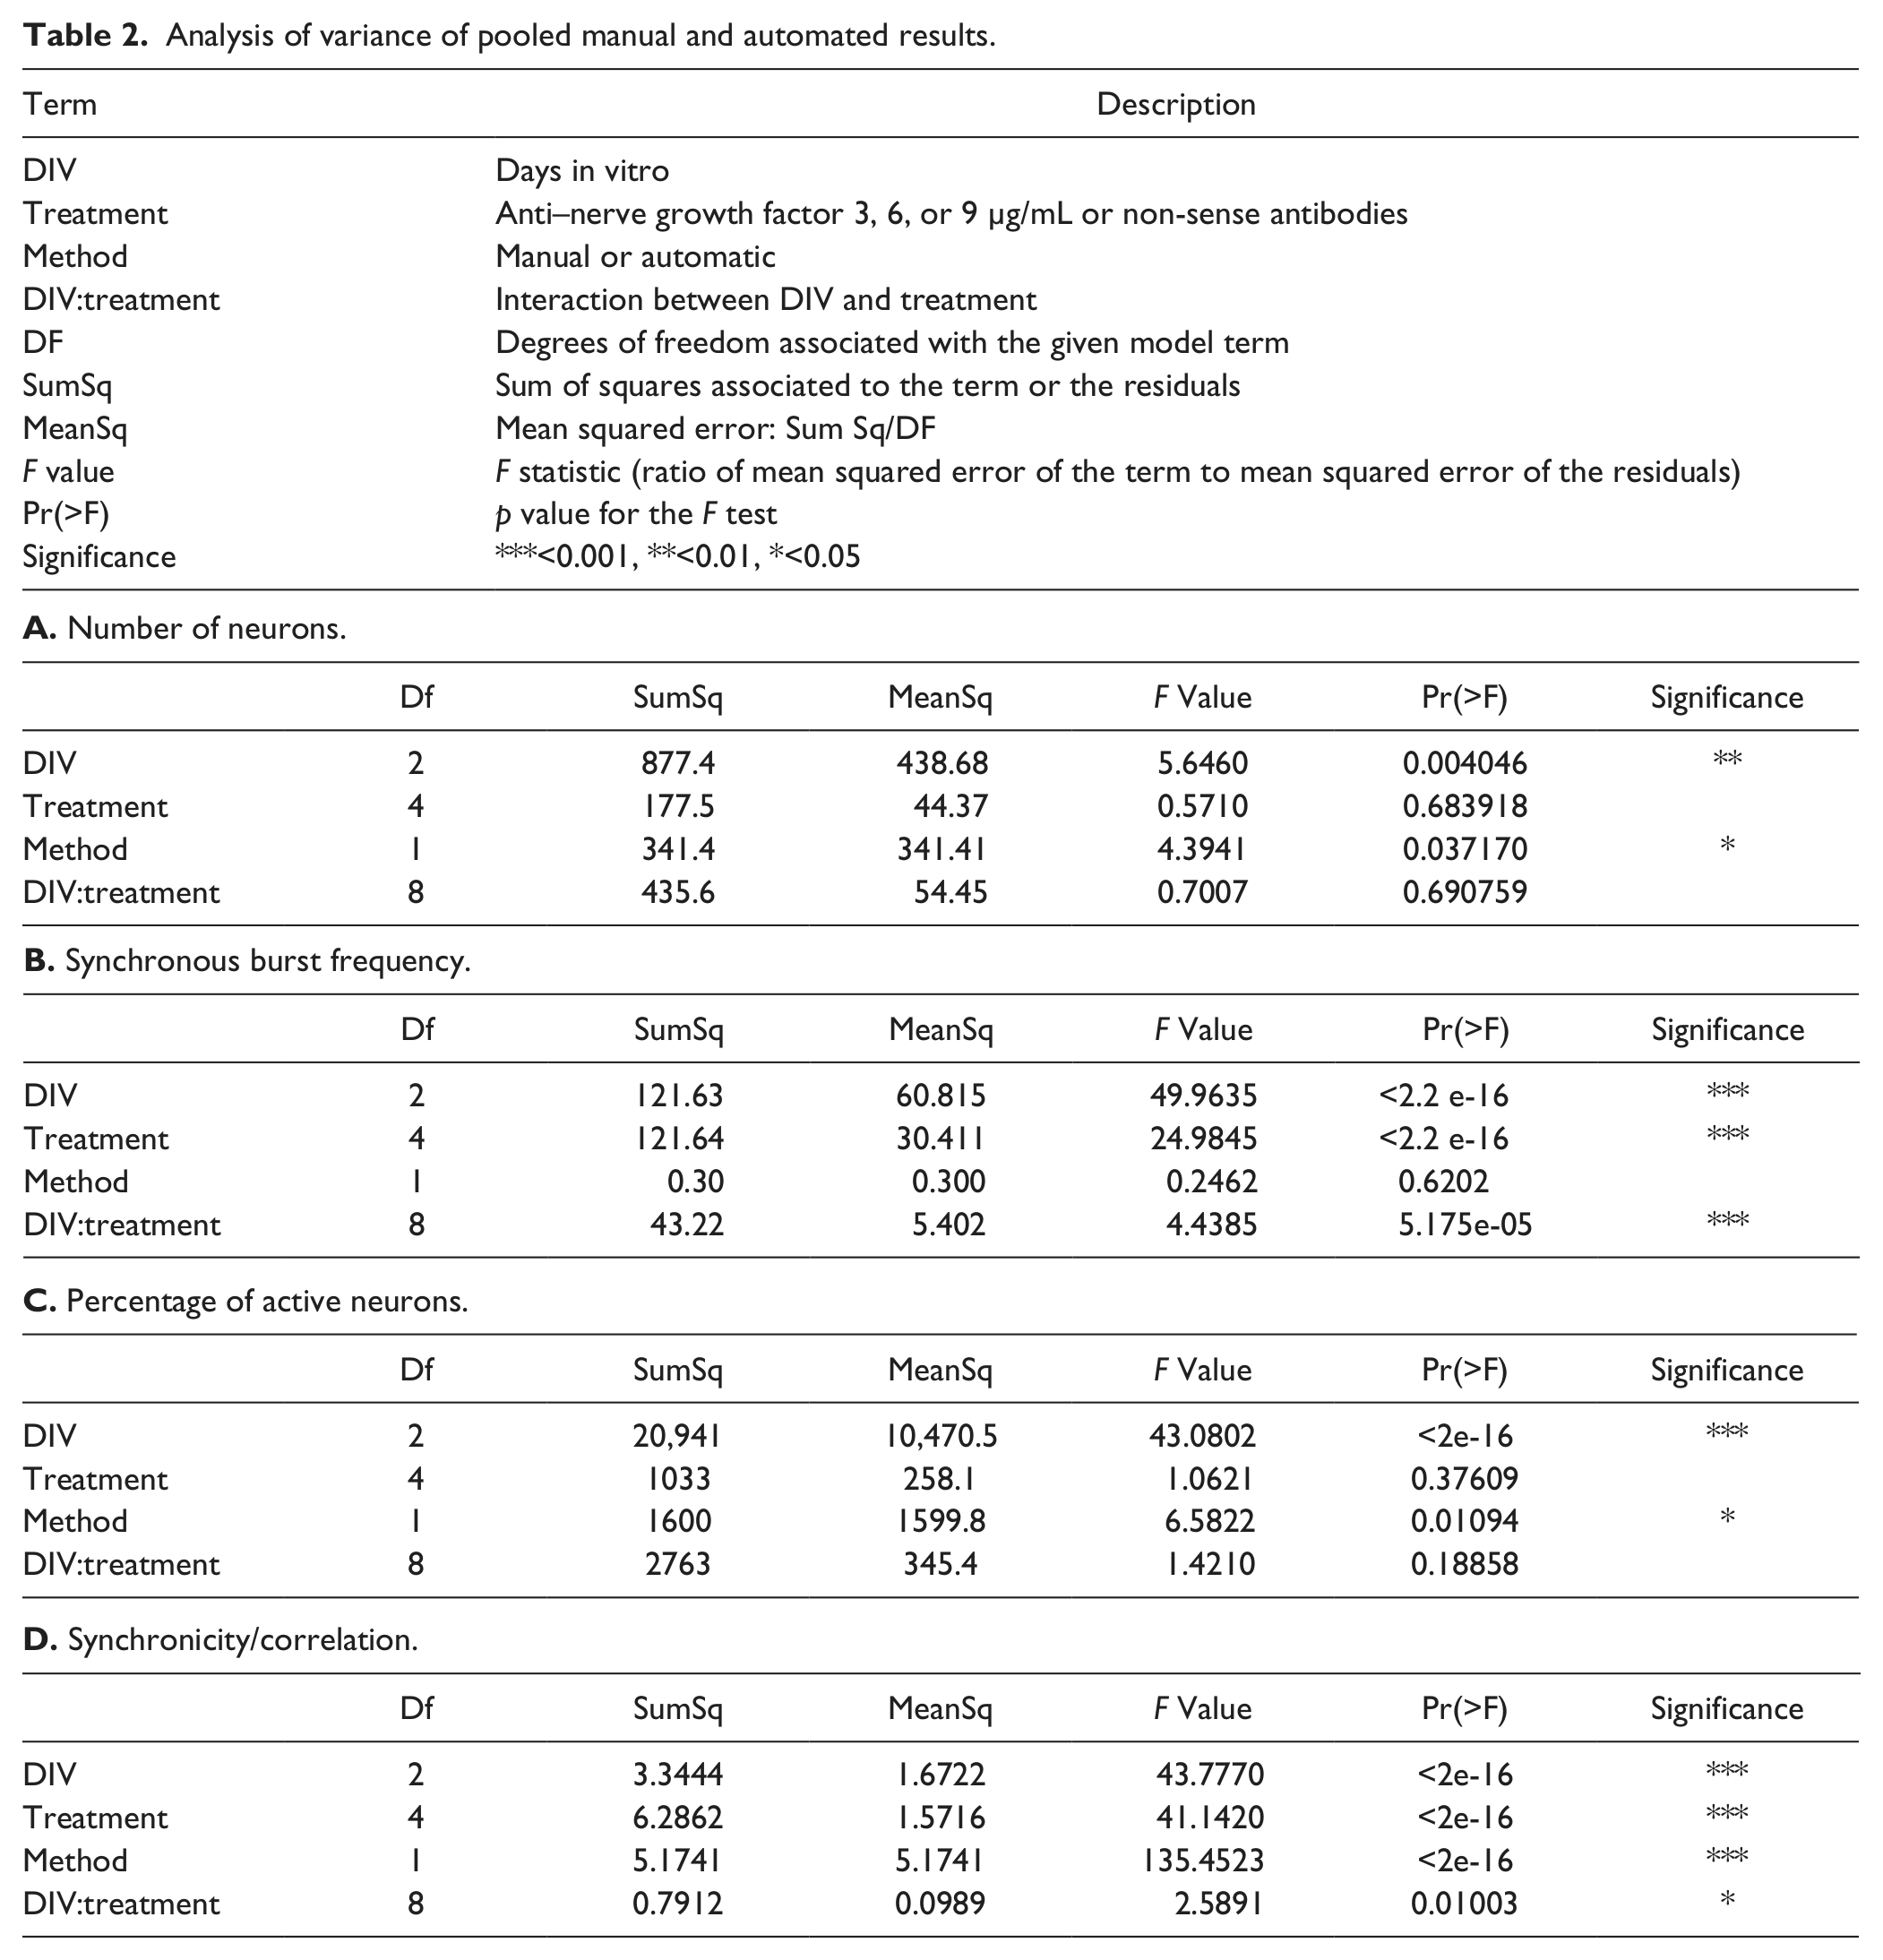
To correctly formulate statements about the validity and unbiasedness of our algorithm as compared with the semi-interactive analysis, divergent results must be interpreted as a function of the different methodologies. Using ANOVA, output from the automated system was compared with results from the interactive, manual analysis. Factors taken into consideration were DIV, treatment (anti-NGF or non-sense AB), and method (manual or automatic). In total, 243 observations for each parameter were used, with at least six measurements for each combination of factors.
Results
ANOVA Analysis of Manual and Automated Methods
Number of Neurons
Two distinct routes were taken to determine the total number of neurons per field of view. The first is interactively selecting (indicating ROIs inside) cellular objects in the manual method or segmenting cellular objects by blob analysis in the automated procedure. Later, neurons are distinguished from nonneuronal cells by interpreting their glutamate response over time. ANOVA ( Table 2A ) shows that the methods yield different results in terms of the final number of neurons (p = 0.037). However, the difference is only approximately 10% of the total number of neurons per image counted manually ( Fig. 1A ). The difference may be explained by the fact that tiny object masks resulting from dim cells, as well as cells touching the image boundary, are treated differently in the automatic procedure, resulting in slightly different numbers. In addition, the selection criterion for neuronal cells (relative glutamate response drop threshold) may be influenced by the size, shape, and position of the selected ROI, which is different between procedures. Automated segmentation, based largely on the 2D intensity shape of the object, is less influenced by absolute contrast value and has higher sensitivity for less intensely loaded neurons. Occasionally, neurons might not be completely separated by the automated segmentation, in which case two neurons are interpreted as one.
Analysis of variance of pooled manual and automated results.
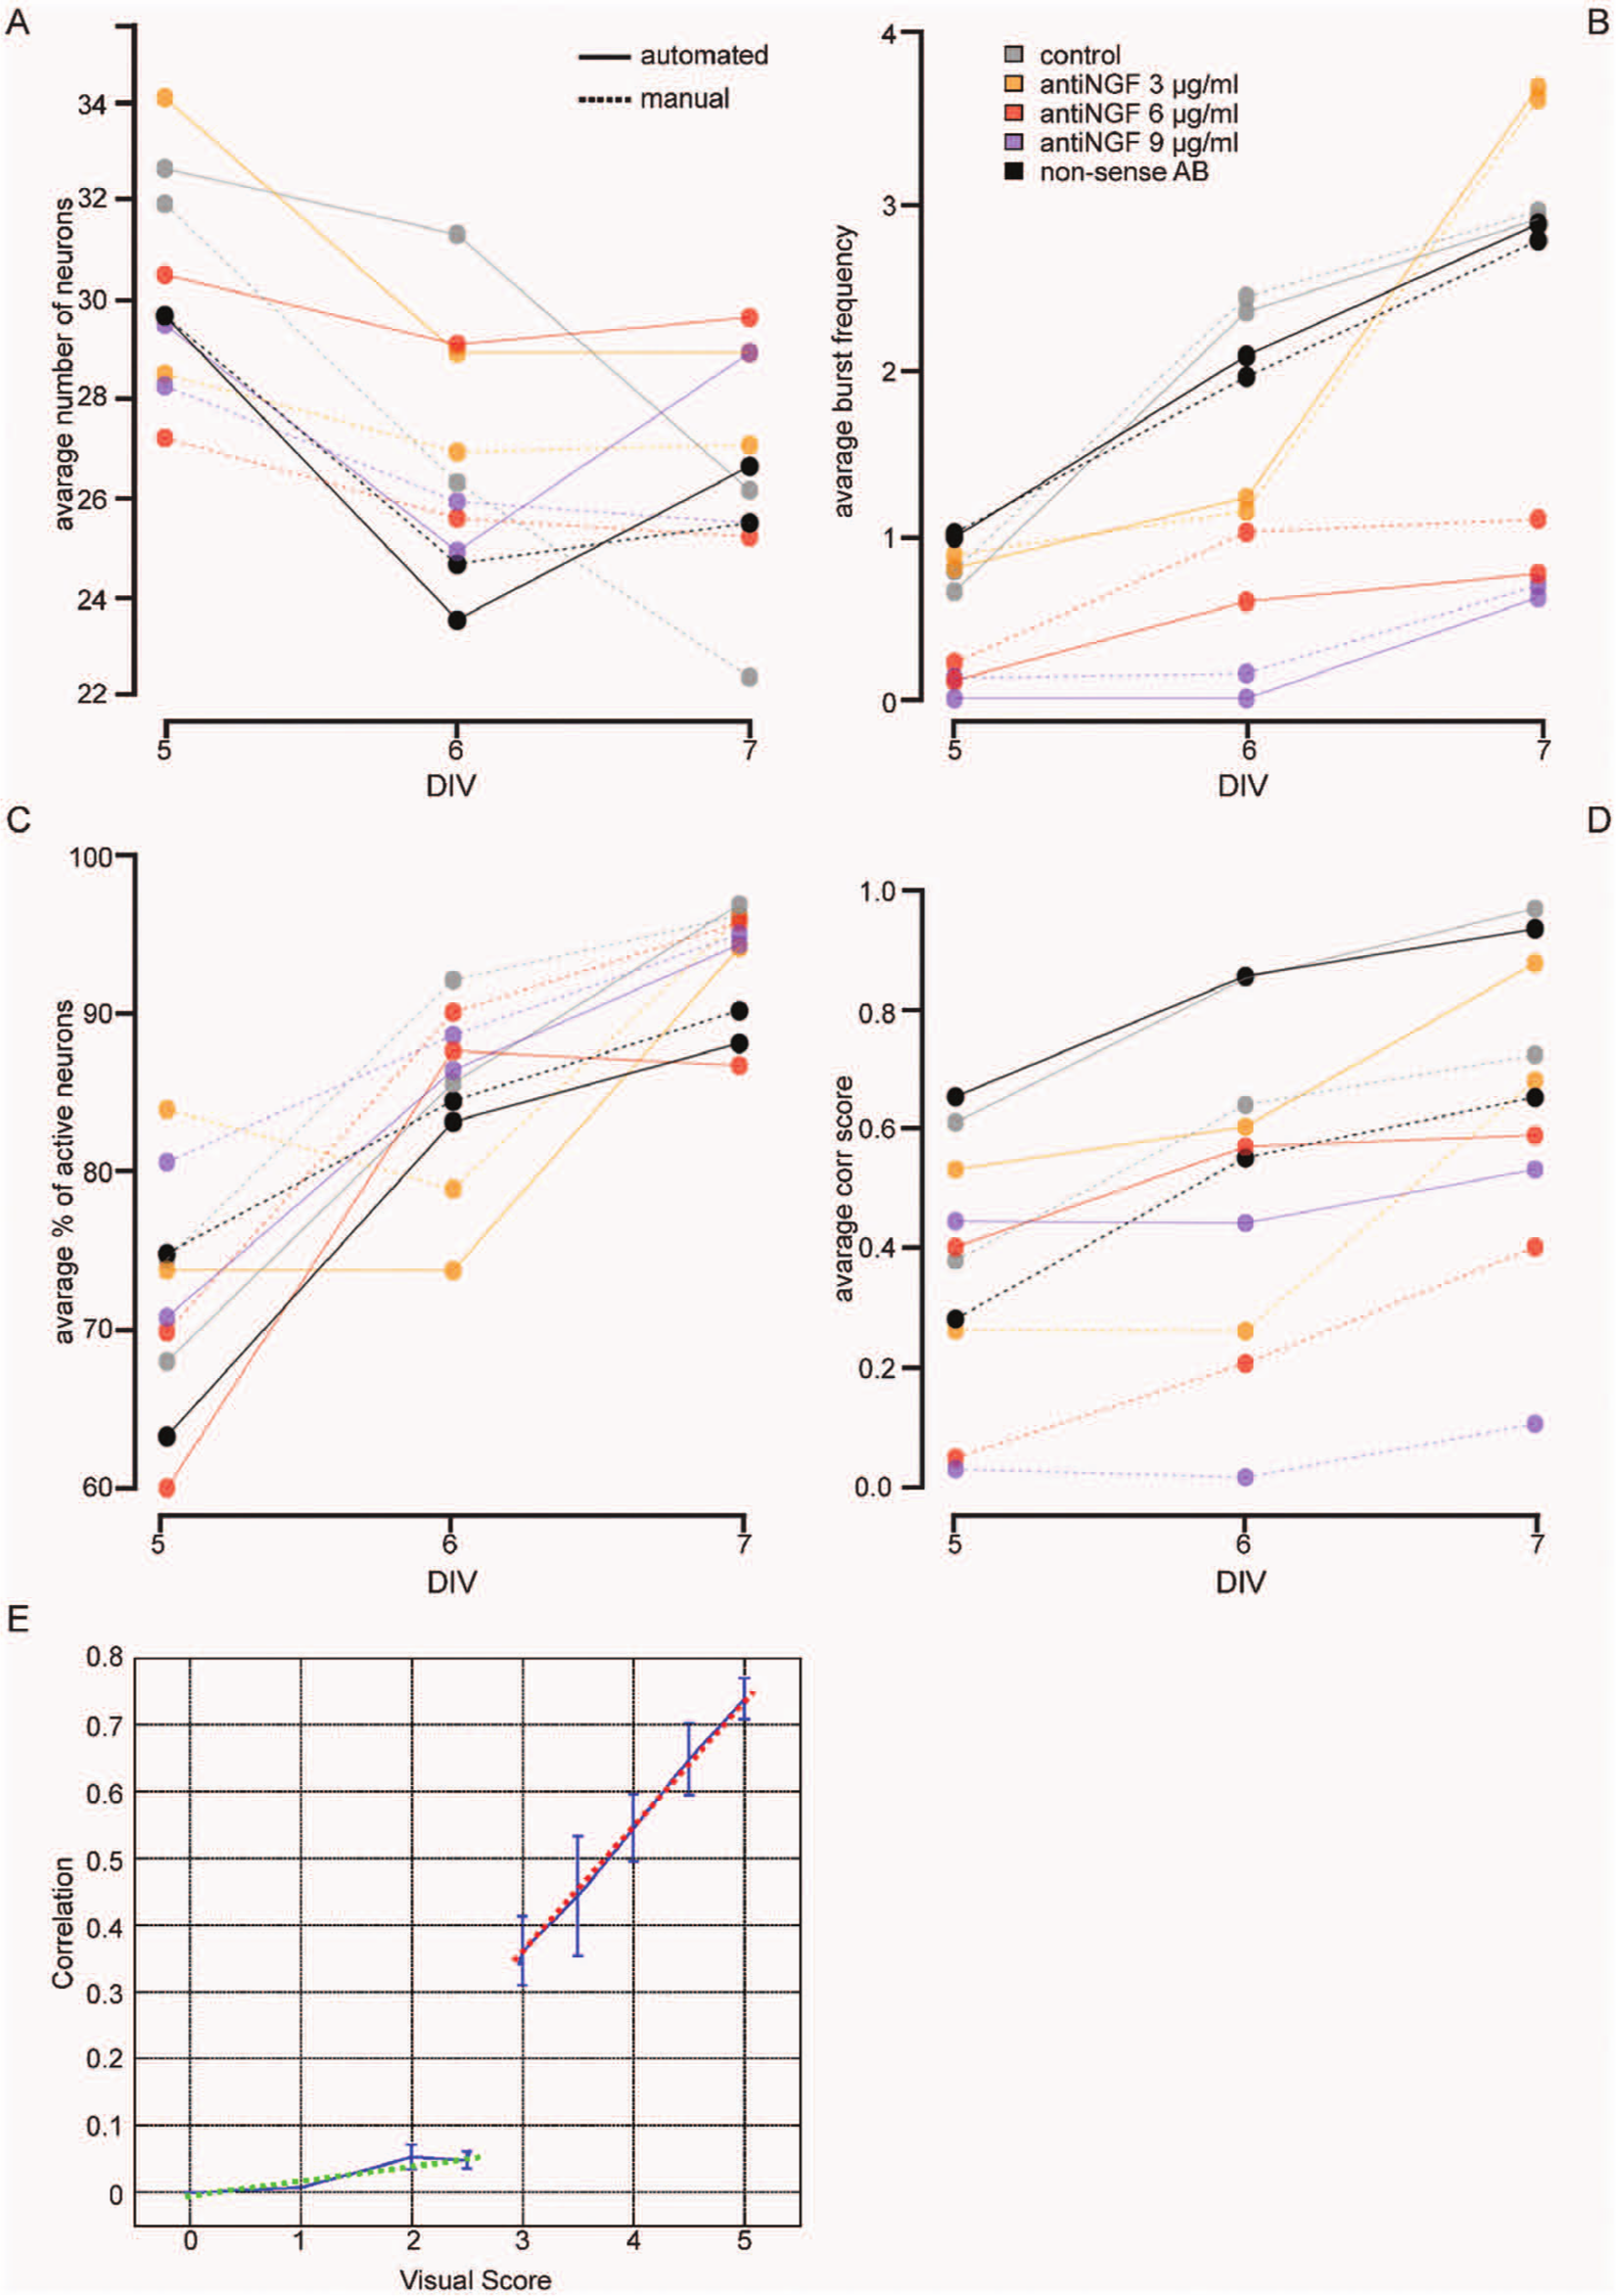
Method comparison and validation. (
NGF deprivation does not influence the total number of neurons ( Table 2A ; p = 0.684), and there is no interaction between time and treatment (p = 0.691). However, over time, a slight (~10%) but significant reduction in the number of neurons is observed, regardless of the method used ( Table 2A ; p = 0.004). This could be due, for example, to suboptimal culturing conditions, resulting in a few dead cells, which are not counted as neuronal cells.
Synchronous Burst Frequency
Figure 1B shows that chronic treatment with a nonactive substance, such as non-sense AB, has no influence on the average SBF. The SBF increases significantly over time (DIV), whereas anti-NGF treatment reduces the SBF in a dose-dependent way. ANOVA ( Table 2B ) shows that these effects are significant (p < 2.2e-16). Analysis revealed no statistical difference between the methods (p = 0.620). Both the figure and table indicate a clear interaction between the two factors (treatment and DIV). The effect of treatment becomes more pronounced as the number of DIV increases (p = 5.2e-05) due to the fact that the SBF of control and nonactive substances increases over time, whereas it remains low when higher doses of anti-NGF are administered.
Percentage of Active Neurons (PAN)
A cell is classified as an active neuron if it is a neuronal cell (i.e., reacts appropriately to the glutamate response) and exhibits at least one calcium burst.
ANOVA ( Table 2C ) indicates that PAN differed between the two methods (p = 0.01). Figure 1C shows the difference is about 10% (i.e., 2 or 3 of the 30 active neurons were classified differently). This difference is probably too small to introduce serious bias and might again be explained partly by the ROI size, shape, and position. The manual procedure also suffers from some inter- and intraobserver variability. A study of individual signals shows that differences are due in part to more faint cells being recognized by automated detection. Because these might preferentially be dying or nonactive cells, this results in a lower fraction of active neurons. The differences between methods seem to become smaller over time, so the choice of endpoint could be important to rule out all bias from the method. Because burst amplitude is known to increase over time, the source of the variation in the sensitivity in peak detection can be pinpointed more easily.
In agreement with the literature, 3 longer culture periods result in an increased PAN ( Table 2C ; p < 2e-16). Time and treatment do not appear to interact. Anti-NGF treatment in se does not change PAN (p = 0.376). However, a strong effect of both time and treatment on the synchronicity was observed (see the next section).
Visual Synchronicity versus Correlation Value
ANOVA analysis of all pooled measurements shows that the visual scores and correlation measurements differ statistically ( Table 2D ; p < 2e-16). This is explained by the definitions ( Table 1 ) and by a plot of the manual scores versus the automatically calculated correlation ( Fig. 1E ). Two basically unrelated effects are mixed in the visual scores: PAN and the synchronicity of firing. Score definitions less than 3 are influenced only by the number of active neurons, whereas score definitions greater than 3 are determined entirely by synchronicity of firing, regardless of the fraction of active neurons. The green dotted line indicates a very high positive correlation in the high score range as opposed to almost no correlation in the lower range (red). This discrepancy is correctly reflected in the ANOVA. Manual scores were transformed into a [0, 1] range in Figure 1D . This plot indicates that control and non-sense treatment have the highest score and correlation, whereas a dose-dependent effect of anti-NGF can be observed ( Table 2D ; p < 2e-16). This table also shows that the treatment effect is influenced by time (interaction between treatment and DIV, p ~ 0.01). In itself, time also has a statistically significant effect on both visual score and correlation.
Figure 1E shows the relationship between visual score and automatically calculated correlation. Over the higher range, the correlation coefficient (r) between the synchronicity score and the automatically calculated correlation value is 0.76 (95% confidence limits: 0.66–0.84). Visually established scores are intrinsically subjective and susceptible to more variation, and underlying mechanisms might be different from correlation measurement. For instance, the amplitude of synchronous bursts might lead the user to rate the synchronicity differently than the correlation score. In the automated procedure, cell signal amplitudes are normalized before calculation of the mutual correlation, minimizing bias toward brighter cells. Nevertheless, the hypothesis that there is no linear relationship can be rejected (p = 1.5e-18).
The lower visual score range up to 2.5 might serve as a kind of negative control because, by definition ( Table 1 ), we do not expect any correlation here. Indeed, the mean automated correlation is lower than 0.05 everywhere in this score range, ruling out false-positives in the automated method.
Because the percentage of active neurons is part of the manual score definition, the biphasic plot further allows us to make interpretations about the relationship between correlation and PAN. The good linear fit in the upper part excludes any significant nonlinear relationship between these two parameters because this should have resulted in a bad linear fit. However, there might be a linear interaction. The absence of a linear relationship in the lower part of the graph, where PAN for visual scores of 2.5 and lower, by definition, varies roughly between 0% and 50%, suggests otherwise. It would be hard to explain why there would be a linear interaction when the PAN is higher than 50% and none before that. This makes any interaction unlikely and suggests that correlation is independent of the fraction of active neurons and that these two parameters can be measured independently, which obviously is an asset.
Examples
Effects of Acute Treatment with 5-HT
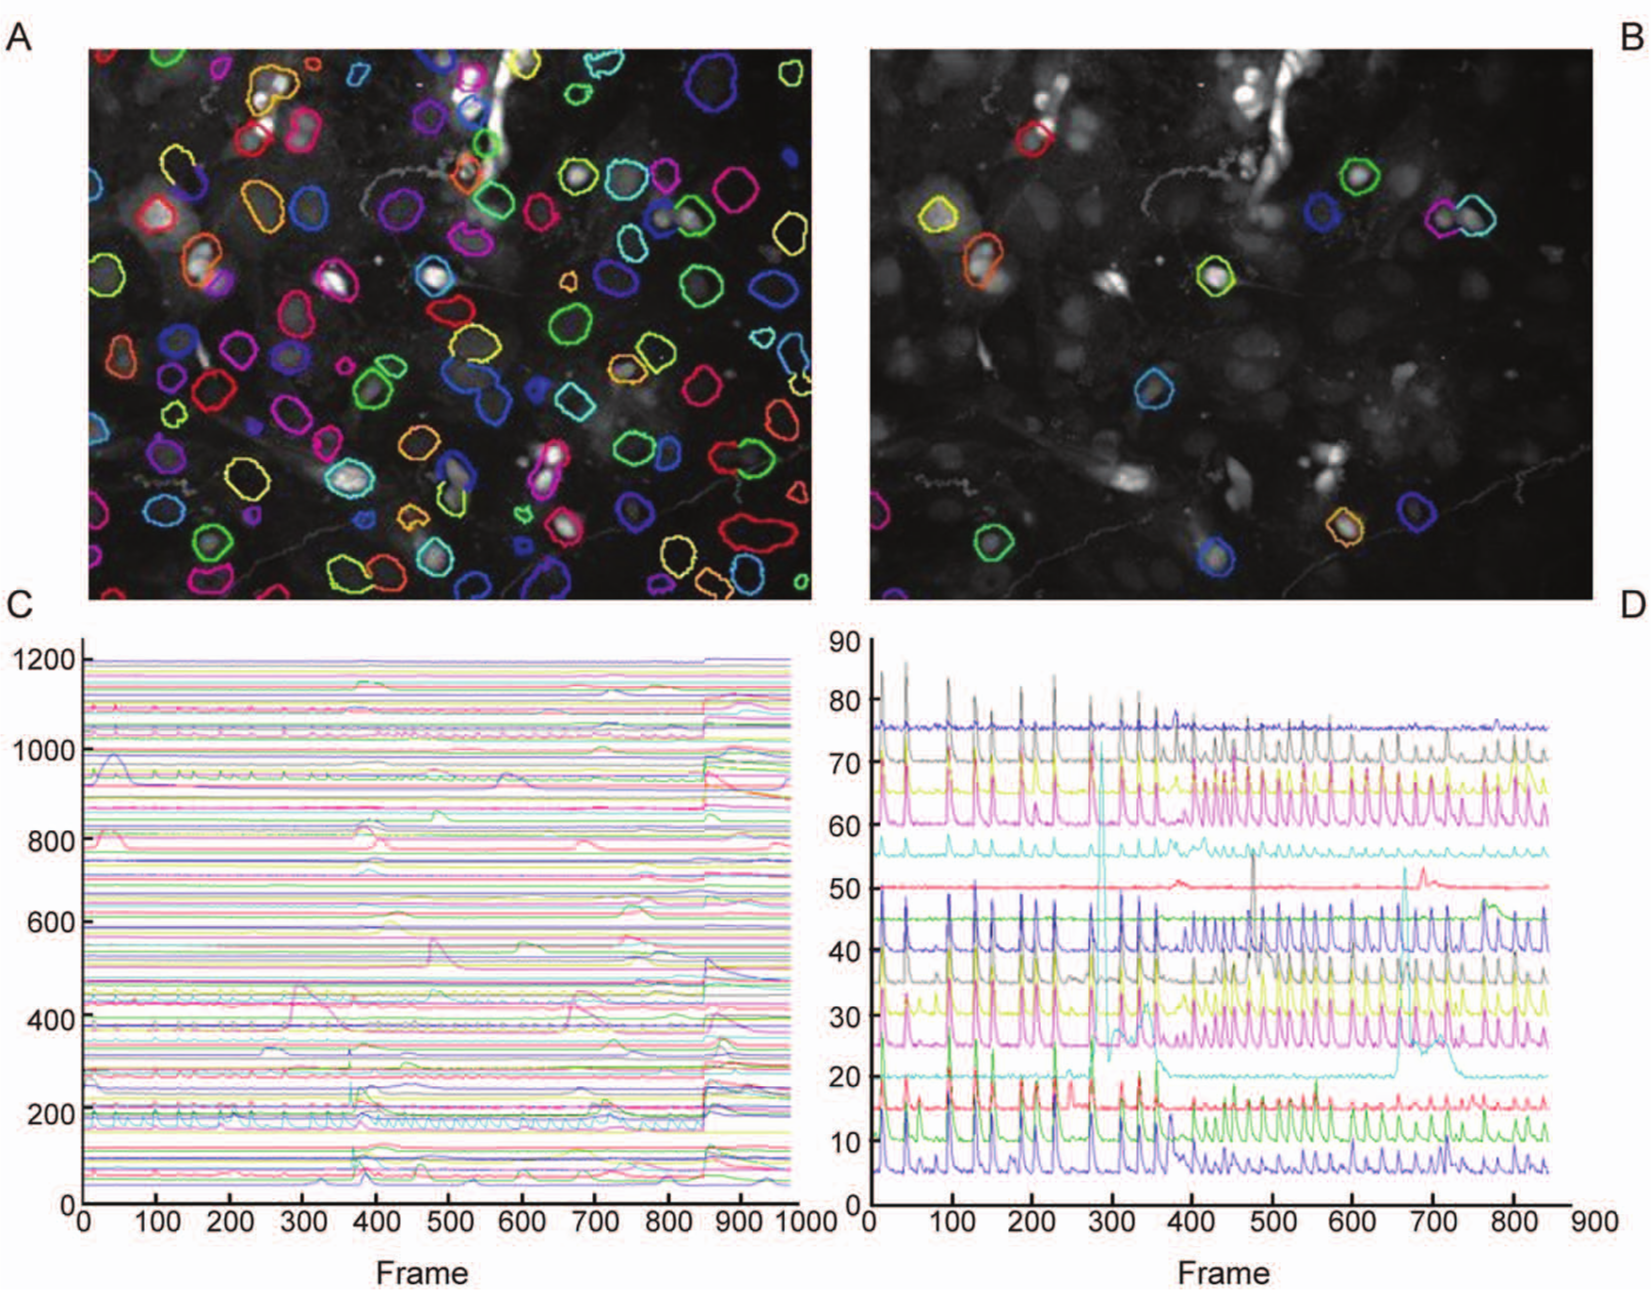
An example of drug addition during the course of the experiments is presented here. Figure 2A highlights all identified cells. The raw signal within these ROIs is shown in Figure 2C . 5-HT and glutamate were added at 360 and 840 frames, respectively (each frame = 0.5 s). Some cells do not express a glutamate jump, whereas in some other cells, the induced peak rapidly diminishes. Nonneuronal cells were excluded on the basis of size and shape of the glutamate jump ( Figure 2B , D ). Figure 2B shows the 15 neuronal cells that have at least one peak during the whole experiment. Note that the two adjacent cells in the upper right quadrant are regarded as two individual objects (different label color). In acute experiments, an active cell is a cell that has at least one genuine peak before drug addition. After removal of the glutamate part and background subtraction, the signals from the 12 active cells are shown in Figure 3A and B . These signals have been smoothed to remove spurious peaks and are split up into “before” and “after” time ranges. Detected peaks and decay points are indicated with red and green dots. In Figure 3C and D , the peak amplitudes are shown after normalization. Firing synchronicity can now be observed much clearer (e.g., bottom three signals). Correlation is measured using these normalized signals. Peak and decay times are also calculated after accumulation of all signal traces ( Fig. 3E , F ). In accordance with the literature, 23 all graphs indicate that 5-HT reduces the median amplitude of calcium bursts by more than 50%, whereas the median burst frequency increases by 67%. The median correlation is reduced from 0.92 to 0.42 because of the fact that some cells cease to fire whereas some others fire more irregularly. This is reflected in a tripling of the frequency standard deviation.
Acute effects of 5-HT at 7 days in vitro. (
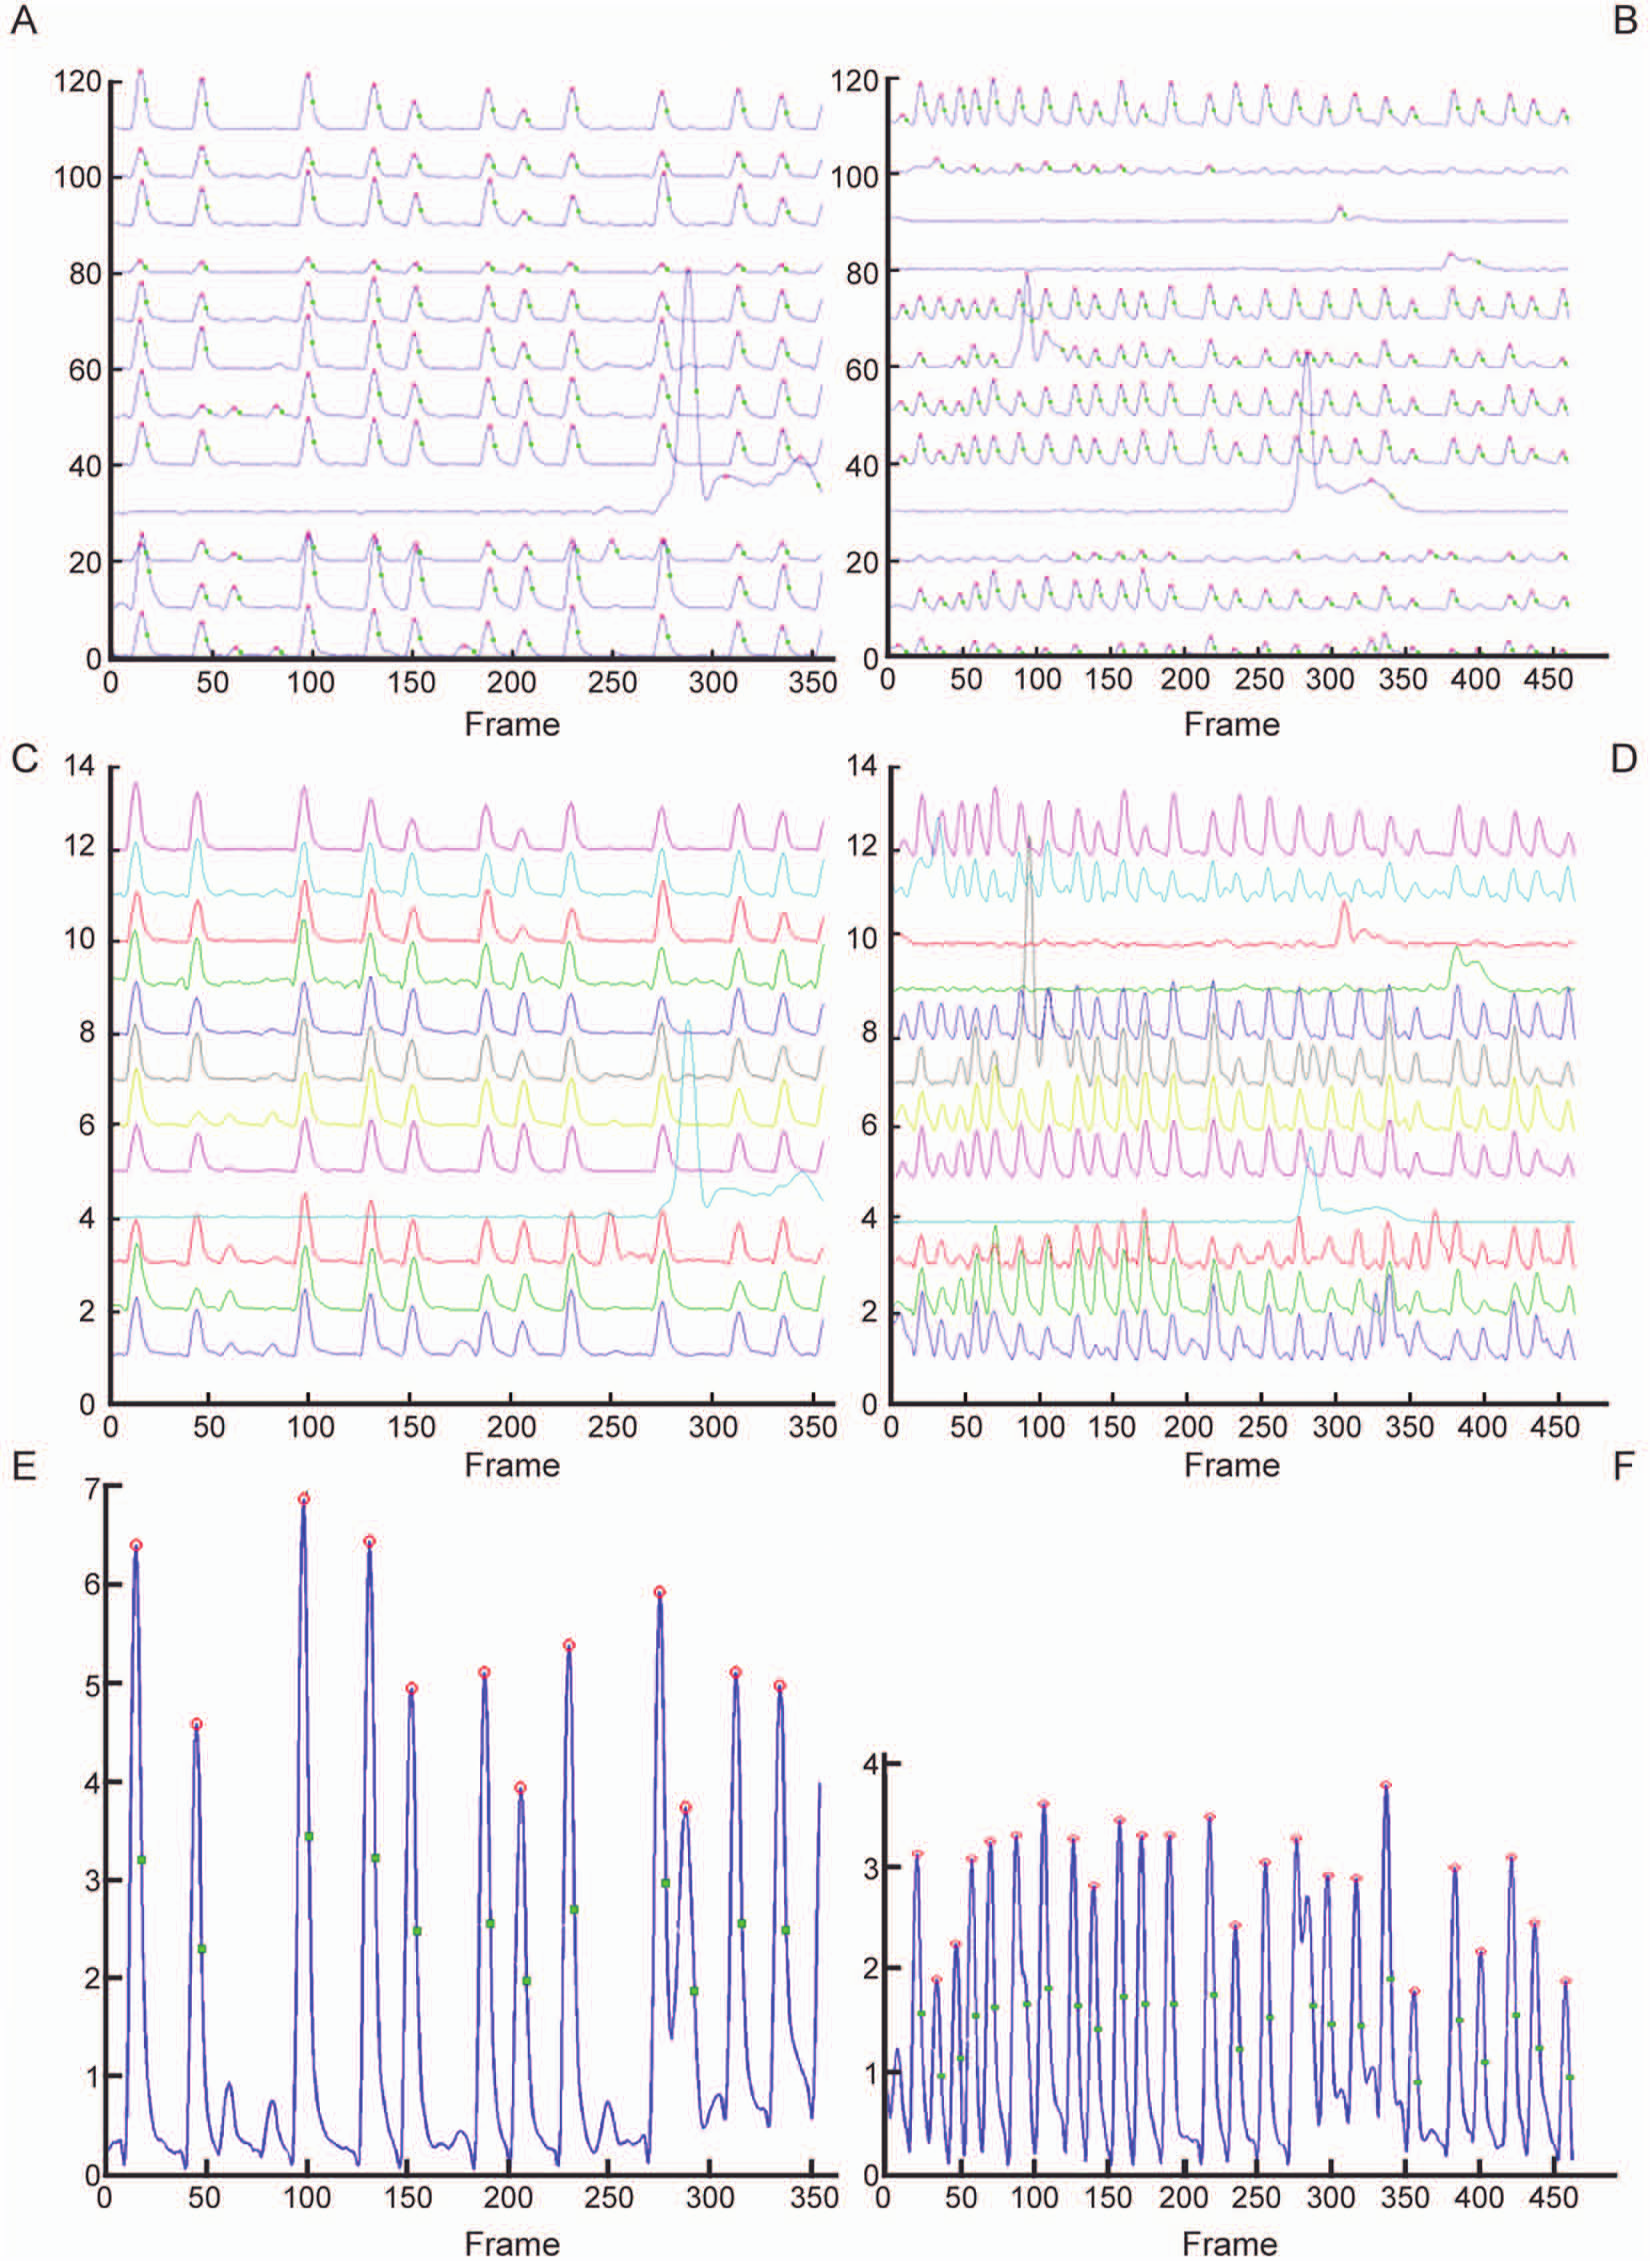
Acute effects of 5-HT at 7 days in vitro (continued). (
Acute Treatment with EGTA
EGTA is a chelating agent with a high affinity for calcium. When calcium in the recording medium is reduced, the action potential–associated calcium oscillations will be abrogated and eventually become undetectable. Figure 4A shows all detected neuronal cells. Figure 4B contains the background-subtracted traces, without the glutamate part but before smoothing. As can be seen in Figure 4C versus Figure 4D , EGTA addition results in a 65% decrease of the fraction of active neurons. The median burst frequency is a factor 10 lower after EGTA addition. In the cells that remain active, the median peak amplitude is more than halved. Firing has become almost completely asynchronous; the median correlation is reduced from 0.67 to 0.01. Pooled signals before and after EGTA addition are shown in Figure 4E and F . Because the treatment affects synchronicity, the pooled amplitude values are reduced by a factor of more than 15, and no peaks or other calculations are retained.
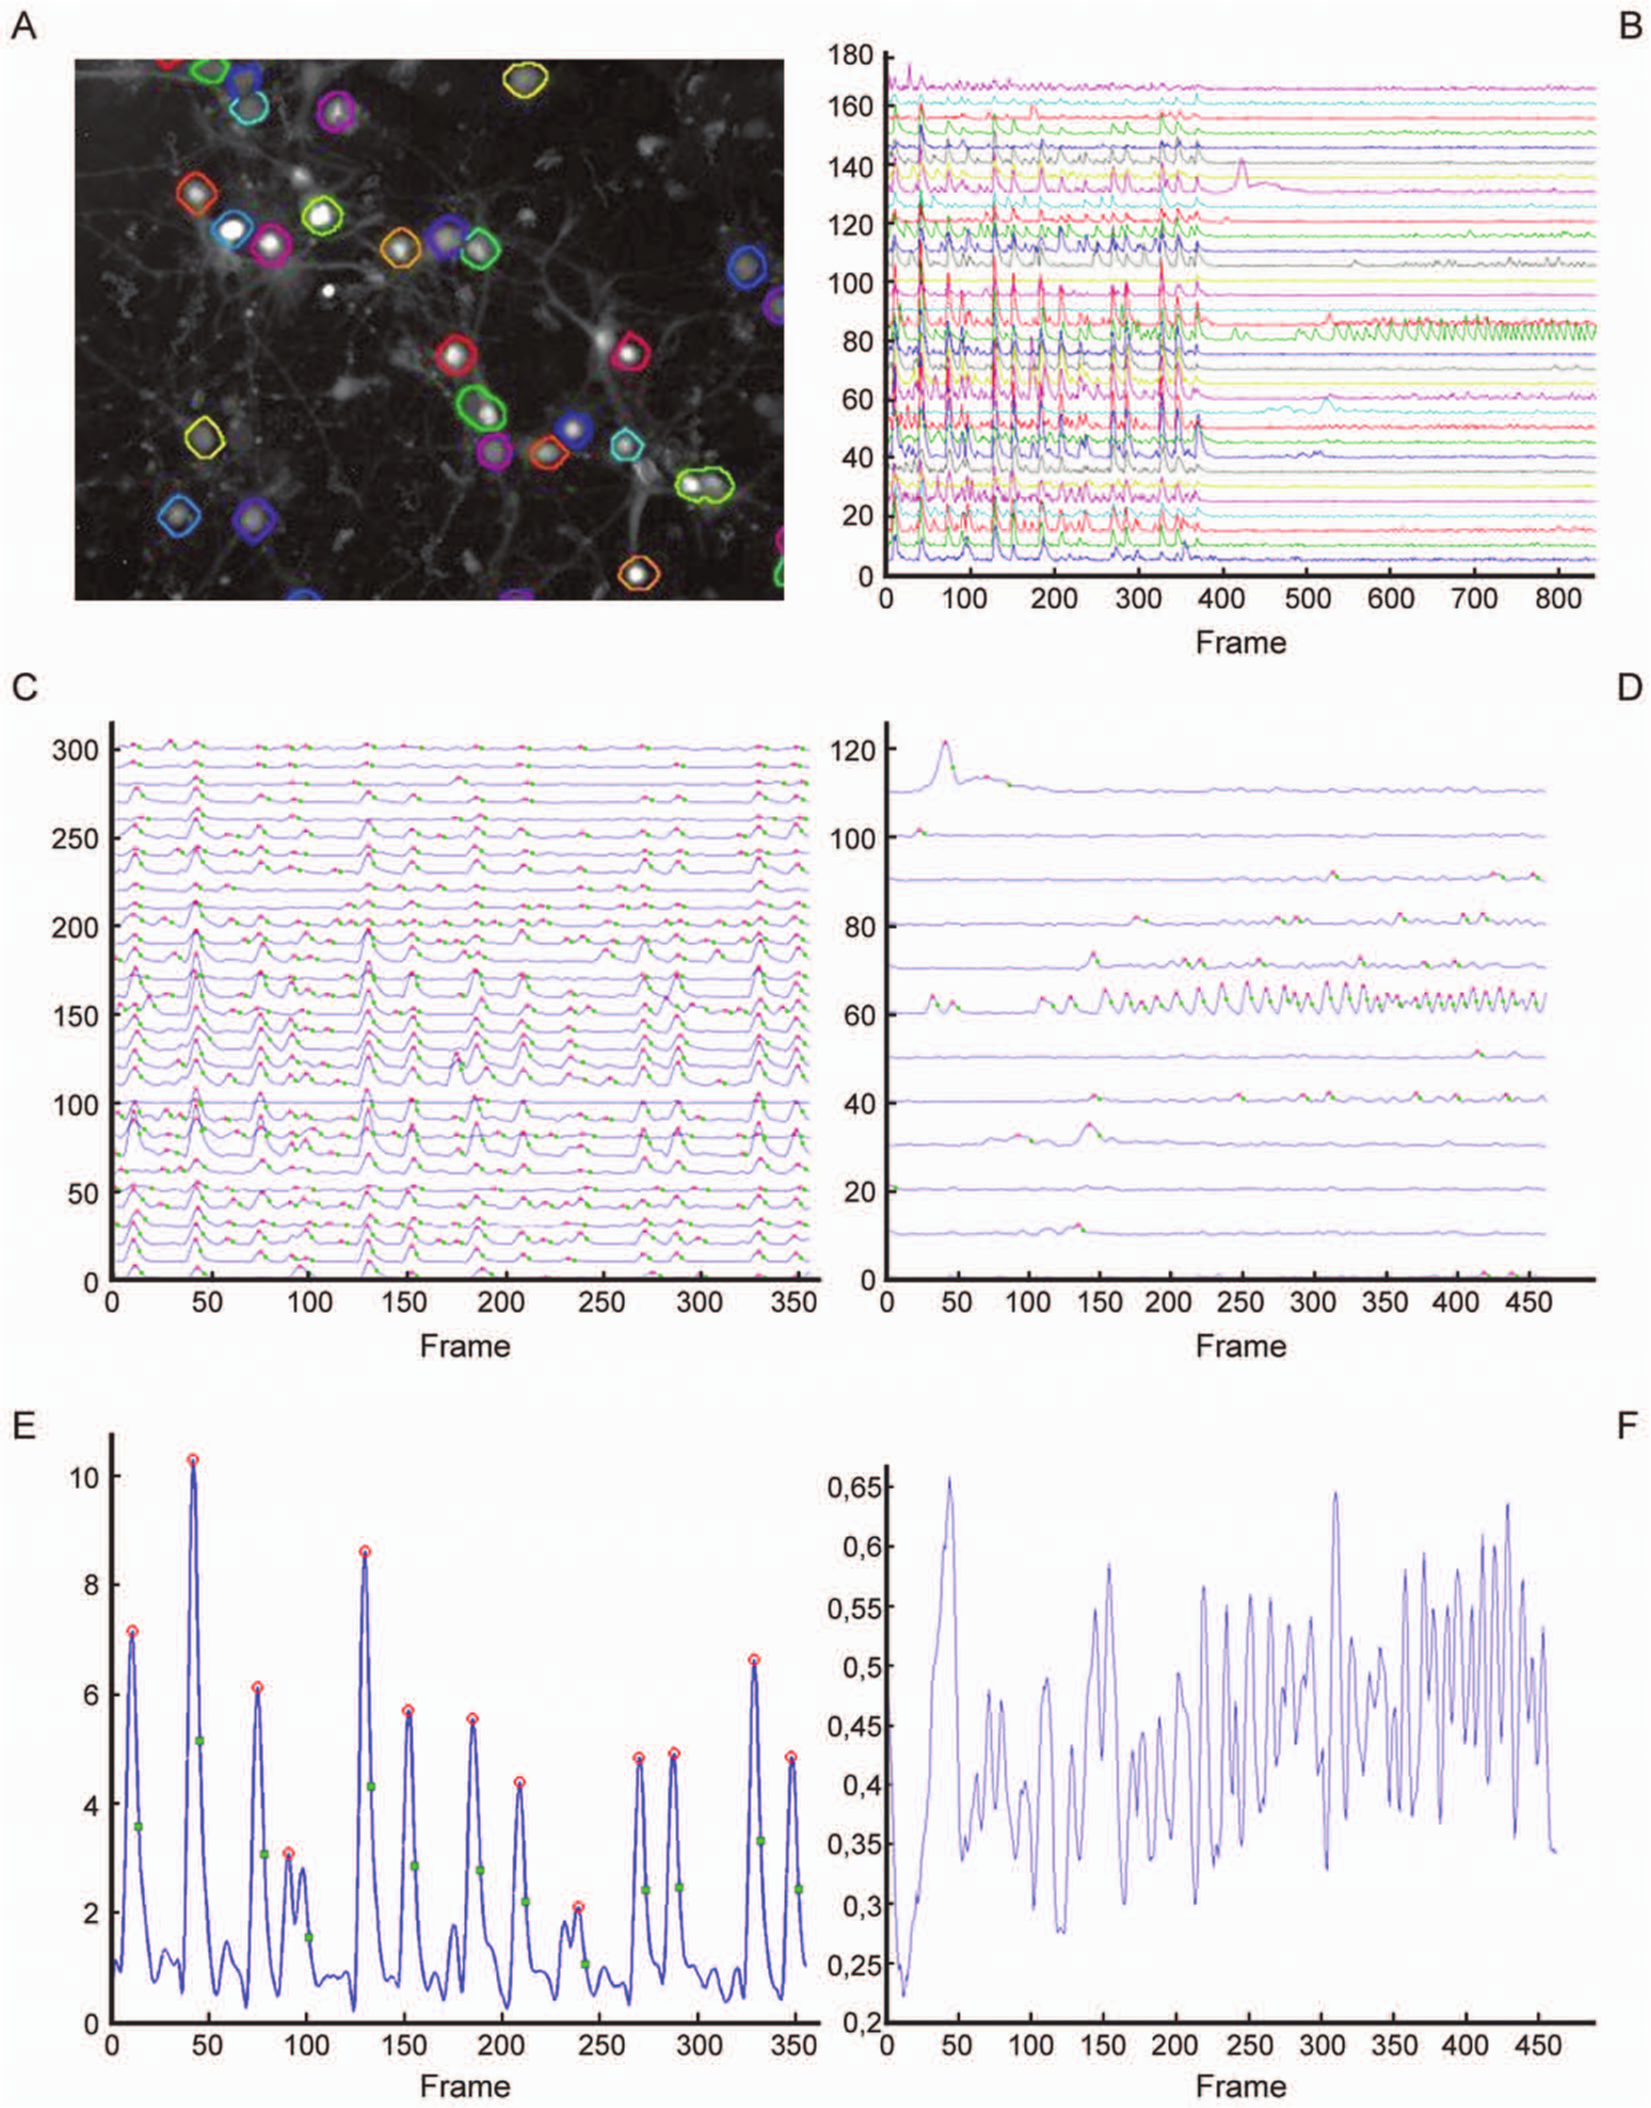
Acute effects of ethylene glycol tetra-acetic acid (EGTA) at 7 days in vitro. (
Discussion
Primary neuronal cultures present a strong and feasible in vitro platform to identify target proteins or screen compounds involved in synaptogenesis and synaptic plasticity. Often, these cultures are grown on MEAs to assess the spontaneous or evoked electrical activity at the network level.4,24 Although these devices offer a superior time resolution, the spatial resolution is limited by the fact that the received signal is often attributable to multiple neurons, whereas the majority of the neurons in the network remain undetected. The use of MEAs requires high amounts of cells per culture, which impedes HCS for practical and ethical reasons. The use of an imaging-based method offers supreme spatial resolution with sufficient temporal resolution. We preferred monitoring changes in calcium dynamics, rather than directly visualizing membrane potential, because of the poor signal-to-noise ratio of voltage-sensitive dyes. 25 Neuronal activity can be visualized via live cell imaging by monitoring calcium fluxes after a burst of action potentials. 6 Recently, Horikawa and Yamada 26 presented yellow Cameleon-Nano, an ultrasensitive calcium indicator. Via fluorescence resonance energy transfer or fluorescence-lifetime imaging microscopy, it is possible to detect very subtle calcium changes in the neurons that are correlated with physiological processes such as vesicle docking or intracellular signaling. However, to visualize gross neuronal activity at the network level in an HCS-compatible manner, we used the more robust and cost-effective Fluo-4.
We described an automated, robust procedure to analyze the acquired data. The algorithm was validated by comparison with manual, semi-interactive results. Statistical evidence shows that the automated method yields comparable values for comparable features in an observer-independent and time-invariant manner. Differences in total and active neuron counts are in the order of 10%. Taking into account all possible sources of variation, it is unlikely that the nonmeasured cells would all be of a specific subtype or that the small difference would lead to a serious bias of reported parameter values.
PAN is highly similar in both methods and shows an increase over the number of days in vitro. Differences are about 10% and likely to be similar or smaller than the manual interobserver variability. Our experiments do not reveal any significant difference in the burst frequency measurements. Manual and automated synchronicity scores are, in applicable ranges, linearly related. Automation allows independent measurement of synchronicity and PAN, a favorable aspect. Comparison of SBF in a mixed-effect model showed no significant difference.
Because visually established synchronicity scores are more subjective and based on different underlying mechanisms as compared with automated calculation of synchronicity, scores are different from the correlation, although similar trends are observed.
In summary, all findings are explained and in line with expectations, while differences are limited and accounted for. The size and location of the ROI influences the results, and visual scores are inherently somewhat more subjective; some intra- and interobserver variability can be expected. Apart from obvious assets, such as the ability to handle more samples as a result of increased speed and convenience, another advantage of the automated procedure is that more information (features) is extracted than previously possible (e.g., average burst frequency and amplitude of individual neurons or peak decay times). Both methods reveal described phenomena: Maturation is reflected in an increase of SBF and PAN, as well as in a shift from asynchronous to synchronous activity. 7
Network activity is influenced by adding compounds. The dose-dependent chronic effect of anti-NGF on synchronicity was established, whereas nonactive substances (e.g., non-sense AB) did not produce any effect. Acute effects of EGTA and 5-HT on number of active cells, amplitude, frequency, and synchronicity were studied, delivering expected outcomes.
Peak detection quality can be scrutinized when the signal intensity of peaks before compound addition is relatively low as compared with noise; very small peaks that do not occur in all active cells (before/after EGTA) are likely to be spurious. In Figure 4C and D , peaks in the smoothed signals are marked. As described, two input parameters are instrumental in suppressing false peaks. Parameter tuning is delicate when the noise is almost the same size as the peaks. A parameter that uses a ratio of height versus decay time could be of use to better discriminate between false and genuine peaks. Because all data are reported in an Excel file or uploaded to the HCS system, postprocessing can also be used to clean data. For stronger signals ( Fig. 3A , B ), an overwhelming majority of indicated maxima can safely be considered as real peaks, as they occur synchronously in almost all cells.
The EGTA experiment reveals a flaw of the commonly used pooling approach. Because the fraction of active cells, the amplitude, and the synchronicity of firing are all affected, values in the pooled signal and the signal-to-noise ratio do not allow calculations or conclusions to be made reliably after treatment anymore. Individual traces can still be accurately analyzed.
Because cultures can be reproducibly grown in 96-well plates and calcium recordings can be analyzed automatically, this approach can be integrated into an HCS assay. Molecular biological techniques could be used to assess the influence of genes on overall network activity, rendering this approach feasible in applications ranging from neurotoxicity screening over small interfering RNA screening to testing of compounds in in vitro disease models. The execution of a high-content and high-throughput screening assay should be possible after additional optimizations, such as automated cultivation and imaging, including liquid handling. Down-scaling to 384-well plates could also be an option.
Footnotes
Acknowledgements
We are grateful for the tremendous efforts of Frederick Michielssen and Ari De Groot, without whom the Phaedra HCS system would not have been realized.
Declaration of Conflicting Interests
The authors declared no potential conflicts of interest with respect to the research, authorship, and/or publication of this article.
Funding
The authors disclosed receipt of the following financial support for the research, authorship, and/or publication of this article: This study was supported by a Baekeland fellowship from the Agency for Innovation by Science and Technology in Flanders (IWT 090279; P.V.).
References
Supplementary Material
Please find the following supplemental material available below.
For Open Access articles published under a Creative Commons License, all supplemental material carries the same license as the article it is associated with.
For non-Open Access articles published, all supplemental material carries a non-exclusive license, and permission requests for re-use of supplemental material or any part of supplemental material shall be sent directly to the copyright owner as specified in the copyright notice associated with the article.