
Abstract
High-throughput phenotypic screening is a key driver for the identification of novel chemical matter in drug discovery for challenging targets, especially for those with an unclear mechanism of pathology. For toxic or gain-of-function proteins, small-molecule suppressors are a targeting/therapeutic strategy that has been successfully applied. As with other high-throughput screens, the screening strategy and proper assays are critical for successfully identifying selective suppressors of the target of interest. We executed a small-molecule suppressor screen to identify compounds that specifically reduce apolipoprotein L1 (APOL1) protein levels, a genetically validated target associated with increased risk of chronic kidney disease. To enable this study, we developed homogeneous time-resolved fluorescence (HTRF) assays to measure intracellular APOL1 and apolipoprotein L2 (APOL2) protein levels and miniaturized them to 1536-well format. The APOL1 HTRF assay served as the primary assay, and the APOL2 and a commercially available p53 HTRF assay were applied as counterscreens. Cell viability was also measured with CellTiter-Glo to assess the cytotoxicity of compounds. From a 310,000-compound screening library, we identified 1490 confirmed primary hits with 12 different profiles. One hundred fifty-three hits selectively reduced APOL1 in 786-O, a renal cell adenocarcinoma cell line. Thirty-one of these selective suppressors also reduced APOL1 levels in conditionally immortalized human podocytes. The activity and specificity of seven resynthesized compounds were validated in both 786-O and podocytes.
Keywords
Introduction
Apolipoprotein L1 (APOL1), when expressed in the liver, is a component of high-density lipoprotein (HDL) and provides innate protection against trypanosome infection.1,2 When trypanosomes ingest HDL particles, APOL1 is activated in the lysosome and then disrupts the integrity of lipid bilayers in the lysosome or elsewhere in the cell, resulting in trypanosome death. 1 Human infective African trypanosomes, which cause African sleeping sickness, have evolved mechanisms to evade APOL1-mediated death, and in response, variants of APOL1 (G1: S342G, I384M; G2: N388del, Y389del) evolved that are protective against these subspecies of trypanosomes. 3 These allelic variants of APOL1 are also known as renal risk variants (RRVs) because they are strongly associated with a higher risk of nondiabetic kidney disease, notably focal segmental glomerulosclerosis (FSGS)4,5 and HIV-associated nephropathy (HIVAN),5–7 and with earlier onset of end-stage renal disease. 3 Transplant studies,8,9 population studies, 10 and studies of in vivo models of APOL1-mediated kidney disease 11 strongly suggest that expression of APOL1 RRVs in podocytes, the cells that form the glomerular filtration barrier, is responsible for accelerating their own demise and, as a consequence, a more rapid decline of kidney function. Despite efforts to understand the biology, the pathophysiological mechanism of APOL1 RRVs remains unclear, which has contributed to the difficulties in developing APOL1-targeted therapeutics; however, studies of population genetics have identified a potential strategy. APOL1 has been shown to be nonessential, beyond a potential increased likelihood for trypanosomiasis, with the identification of human nulls. 12 The identification of these individuals provides evidence that a strategy that selectively reduces or eliminates APOL1 to treat renal disease patients expressing APOL1 RRVs would be safe.
PCSK9 small-molecule suppressors that have recently completed phase 2 trials13–15 provide proof of concept for the clinical development of small-molecule suppressors—more classically drug-like compounds that are able to specifically modulate levels of the target protein. Loosely, these molecules affect transcription, splicing, translation, and turnover of the target through a mechanism that does not necessarily involve interactions with the target. A well-designed phenotypic screen offers an efficient strategy to identify selective suppressors that may act on the target protein or through other mechanisms. These efforts and hit molecules can also lay the foundation for a targeted or focused drug discovery program with a positive control already in hand.
For a toxic gain-of-function target like APOL1, for which the pathological mechanism may not be completely understood but therapeutic value is clear, a small-molecule suppressor may be a suitable option. Here, we report the development, strategy, and execution of a cell-based, high-throughput phenotypic screen for small molecules that reduce APOL1 levels.
Materials and Methods
Cell Lines and Cell Culture Reagents
All culture media and supplies were purchased from Thermo Fisher Scientific (Waltham, MA). The human renal cell adenocarcinoma cell line 786-O was purchased from the American Type Culture Collection (Manassas, VA; CRL-1932). Cells were cultured in RPMI-1640 supplemented with 10% (v/v) fetal bovine serum (FBS). Cells were grown in 37 °C with 5% CO2.
Assay-ready frozen (ARF) 786-O cells were prepared at 10 × 106 cells/mL in cell-frozen media. The cells were stored in liquid nitrogen vapor until ready to use.
The conditionally immortalized (CI) human podocyte cell line AB 8/13 was kindly provided by Professor Moin Saleem from the University of Bristol. Cells were cultured in RPMI-1640 supplemented with 1× insulin–transferrin–selenium, 10% (v/v) FBS, and 1× penicillin/streptomycin. Cells were maintained at 33 °C with 5% CO2 and were differentiated at 37 °C with 5% CO2 for 8–10 days with media changes every 2–3 days.
The inducible HEK293-APOL1 overexpression cell line was generated at Thermo Fisher Scientific using the Jump-In T-REx HEK293 system. DNA encoding wild-type APOL1 was synthesized at GENEWIZ (South Plainfield, NJ) and cloned into the pJTI R4 DEST CMV TO pA vector, which was transfected into Jump-In T-REx HEK293 cells cultured in transfection media (Dulbecco’s modified Eagle’s medium [DMEM] with GlutaMAX supplemented with 10% [v/v] dialyzed FBS, 1× minimal essential medium [MEM] nonessential amino acid solution, and 25 mM HEPES). APOL1-expressing cells were selected in selection media (transfection media supplemented with 1× penicillin/streptomycin, 5 µg/mL blasticidin, and 2 mg/mL geneticin) and maintained in growth media (transfection media supplemented with 1× penicillin/streptomycin, 5 µg/mL blasticidin, and 200 µg/mL hygromycin B). Cells were grown in 37 °C with 5% CO2. APOL1 expression was induced by adding 750 ng/mL doxycycline to cell culture for 16–24 h.
Measurement of APOL1 Turnover Rate
Reagents
The Pierce Direct IP kit was purchased from Thermo Fisher Scientific. Ammonium bicarbonate, dithiothreitol (DTT), iodoacetamide (IAA), formic acid, phosphate-buffered saline (PBS), and sodium deoxycholate were purchased from Sigma-Aldrich (St. Louis, MO). The trypsin used for digestion was Promega Gold (Madison, WI).
Procedure (Kinetics of Wild-Type APOL1)
786-O or human CI podocyte cell line AB 8/13 was grown in RPMI-1640 media containing [
2
H3]-leucine, and the tracer was added in addition to the naturally labeled leucine in order to achieve ~20% enrichment. Cells were collected and lysed with lysis buffer from the Pierce Direct IP kit at various times (n = 2 at each point) after addition of the tracer and frozen. While 786-O cells were collected at 0, 1, 2, 4, 7, 16, 24, 48, and 72 h postaddition, human CI podocytes were collected at 0; 15 and 30 min; and 1, 2, 4, 7, 16, and 24 h time points. Intracellular APOL1 was immunoprecipitated from lysed cells with the Pierce Direct IP kit following the manufacturer’s instructions and subjected to tryptic digestion and liquid chromatography–mass spectrometry (LC-MS) analyses. Briefly, the cell lysate was precleared with the control agarose resin, followed by incubation with anti-APOL1 antibody (internally developed) coupled with AminoLink Plus coupling resin overnight at 4 °C. Bound APOL1 was eluted with 1% formic acid. Eluent from the IP step was reduced with 2 µL of DTT (5 mM final concentration) for 45 min at 60 °C and alkylated with 6.7 µL of IAA (10 mM final concentration) for 60 min at room temperature in the dark. Five microliters of trypsin (0.5 µg/μL) was added and incubated at 37 °C overnight. Finally, 1 µL of 20% formic acid was used to acidify the sample. Digested samples (3 μL) were injected onto a microfluidic device (150 µm × 100 mm packed with BEH C18, 1.7 µm particle, IonKey from Waters, Milford, MA) using a nanoAcquity UPLC system coupled to a triple quadrupole mass spectrometer (Xevo TQS, Waters). The gradient was 97% A (0.1% formic acid in water)/3% B (0.1% formic acid in acetonitrile) ramped linearly to 10% A at 5 min and then reequilibrated at the initial condition (total run time, 8 min; flow rate, 3 μL/min). The microfluidic device was maintained at 60 °C throughout the chromatographic gradient elution. An infusion microfluidic device (no packing material) was used to optimize emitter position, signal intensity, and transitions. The precursor and product ions were monitored with a Q1 low-mass resolution of 2.8 and a high-mass resolution of 14.7, collision energy of 25 eV, span set 0.2, and scan time of 17 ms. Note that previous studies identified candidate peptides for measuring isotope incorporation.
16
The data shown here (
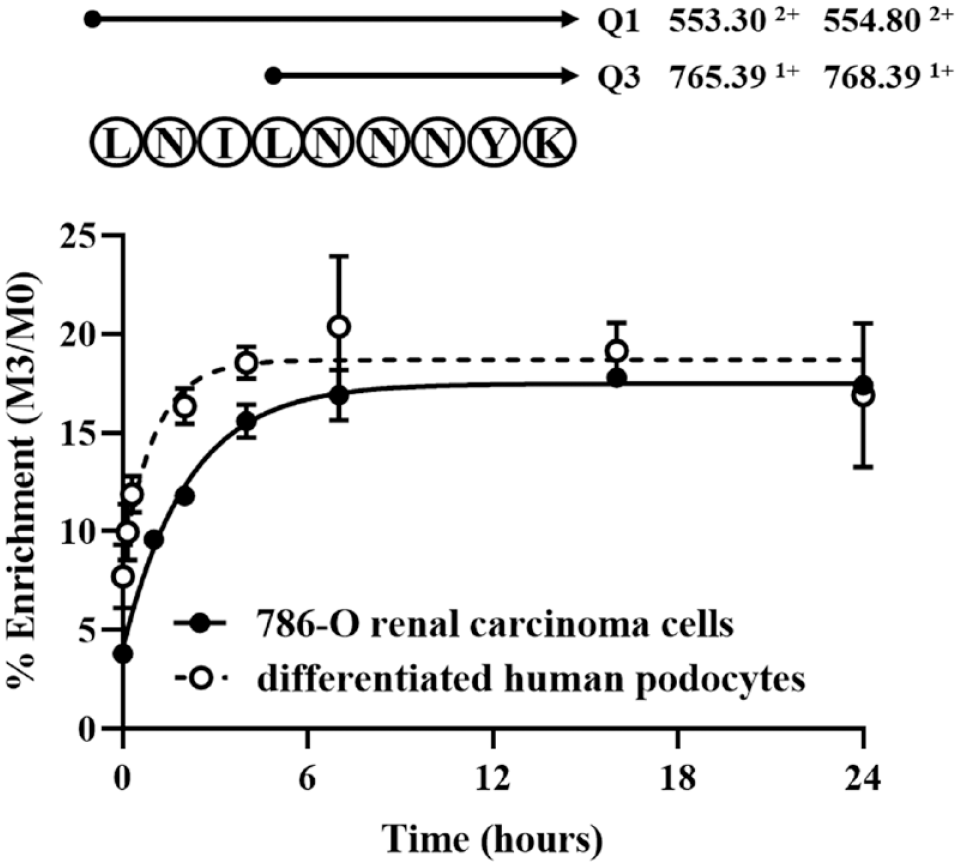
The tractability of the APOL1 suppressor approach was assessed by determining the turnover rate of APOL1. The APOL1 turnover rate was measured by [ 2 H3] Leu incorporation in both 786-O renal carcinoma cells (solid circle) and CI human differentiated podocytes (open circle). The notations “Q1” and “Q3” refer to the masses that are monitored in the transitions between the quadrupoles. The doubly charged parent peptide yields a singly charged daughter ion; the specific signals being fragmented are shown, and 553.30 and 554.80 represent the monoisotopic (unlabeled, M0) and [ 2 H3]-labeled (M3) versions of the peptide, respectively. Note that since the parent ion is doubly charged, the expected mass shift of 3 Da appears at 1.5; however, since the fragment ion is singly charged, the mass shift is 3 Da. The data are reported for a unique ApoL1 peptide LNILNNNYK (mean ± SEM, n = 3).
These studies assumed a metabolic steady state; therefore, the synthesis and degradation of APOL1 are considered equal over the time course of our measurements. The fractional synthesis (k) was determined by fitting the isotope labeling to a single pool model; under these conditions, the half-life is related to k using the following equation: half-life = 0.693/k.
HTRF Assays for APOL1, APOL2, and p53
The homogeneous time-resolved fluorescence (HTRF) assays for APOL1 and APOL2 were custom developed (
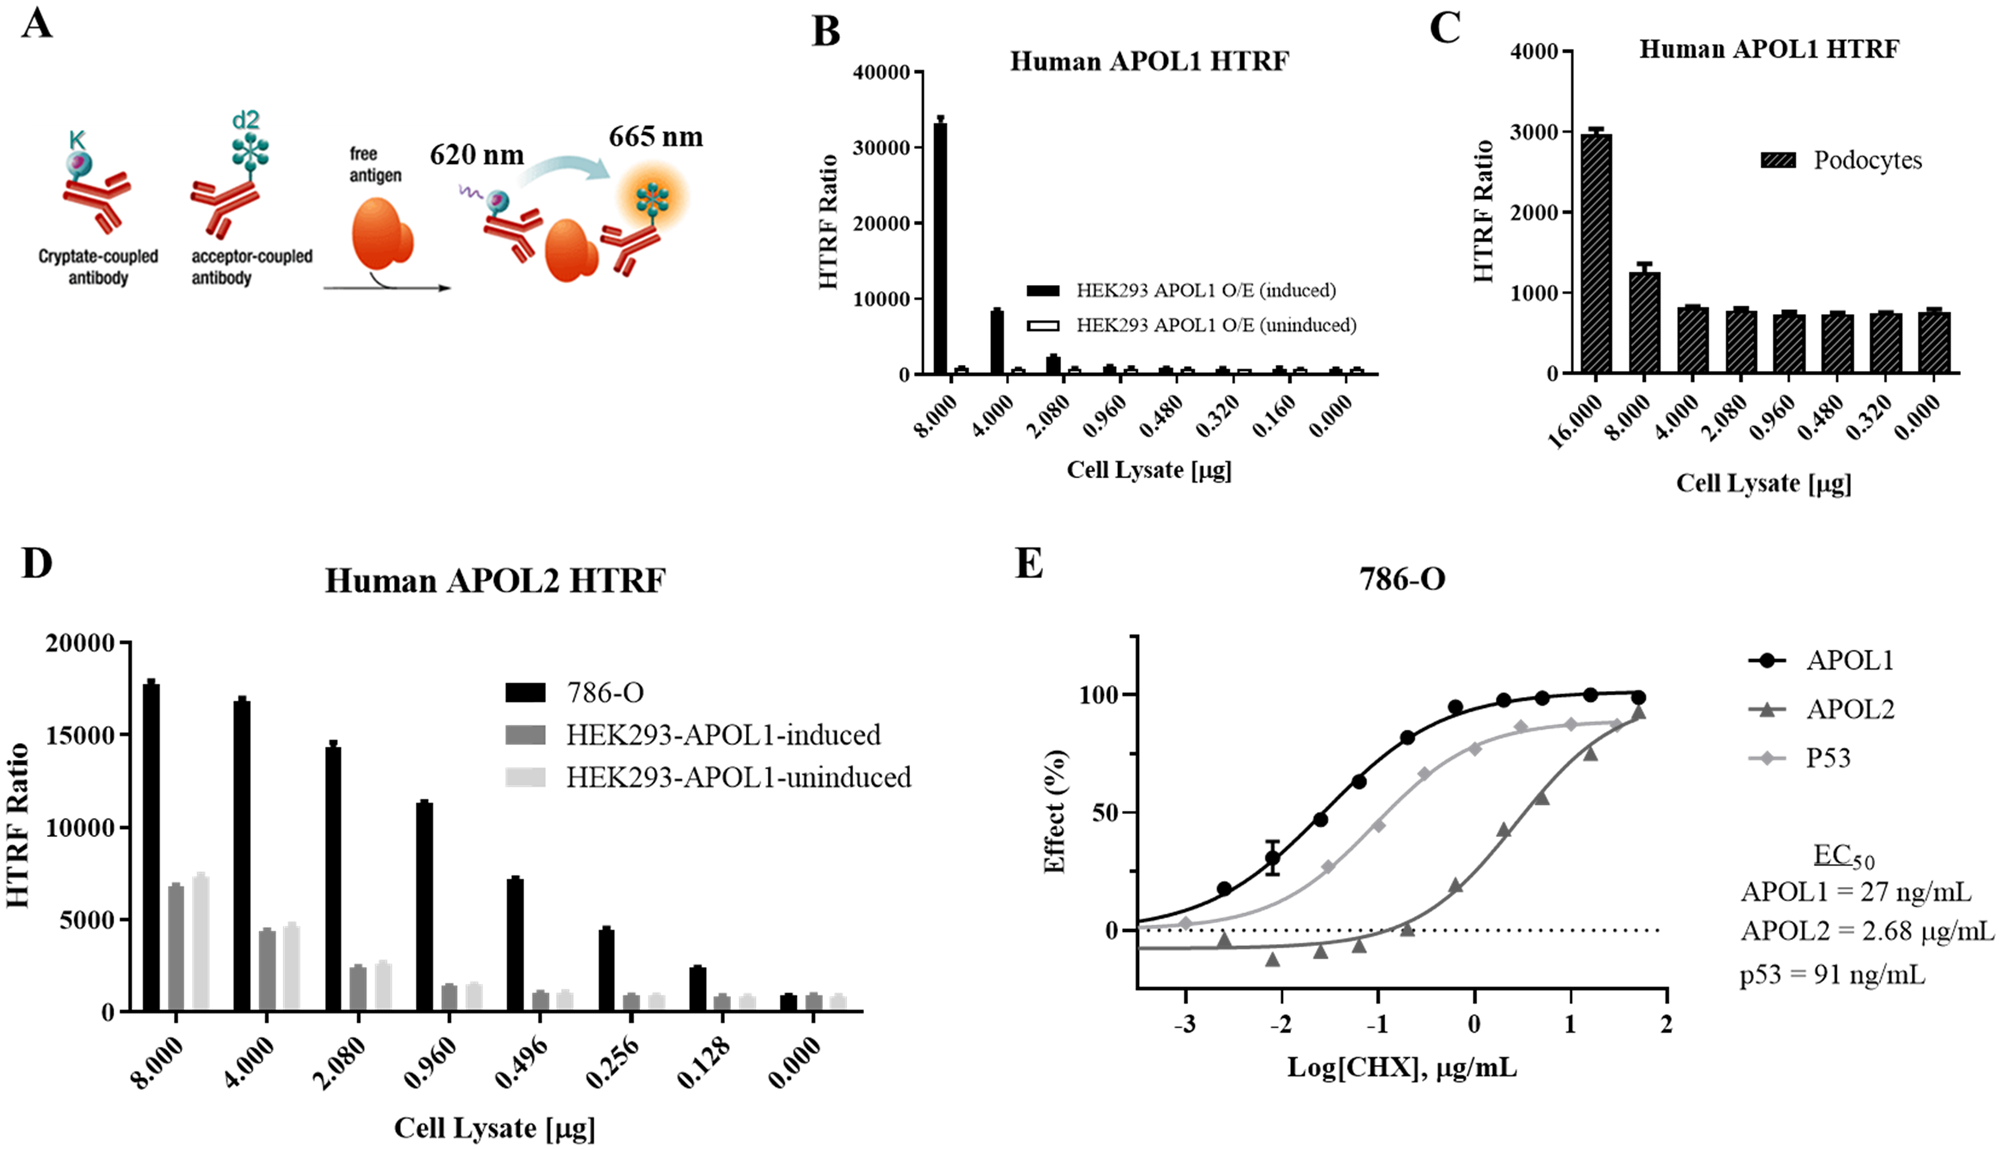
APOL1 and APOL2 HTRF assay development. (
The p53 HTRF assay kit was purchased from Cisbio.
HTRF Assay in 1536-Well Format
ARF 786-O cells were thawed and plated at 10,000 cells/well in 4 µL of complete media (RPMI + 10% FBS) into 1536-well white tissue culture (TC)-treated plates (Aurora, Scottsdale, AZ) and treated with test compounds for 24 h for APOL1 and p53 or 48 h for APOL2. Cell plates were incubated at 37 °C with 5% CO2. Fifty nanoliters of compounds in DMSO was dispensed with Echo acoustic dispensing (Labcyte, San Jose, CA). The compounds were tested in a single concentration (20 µM or 1 µM based on the library, as described in
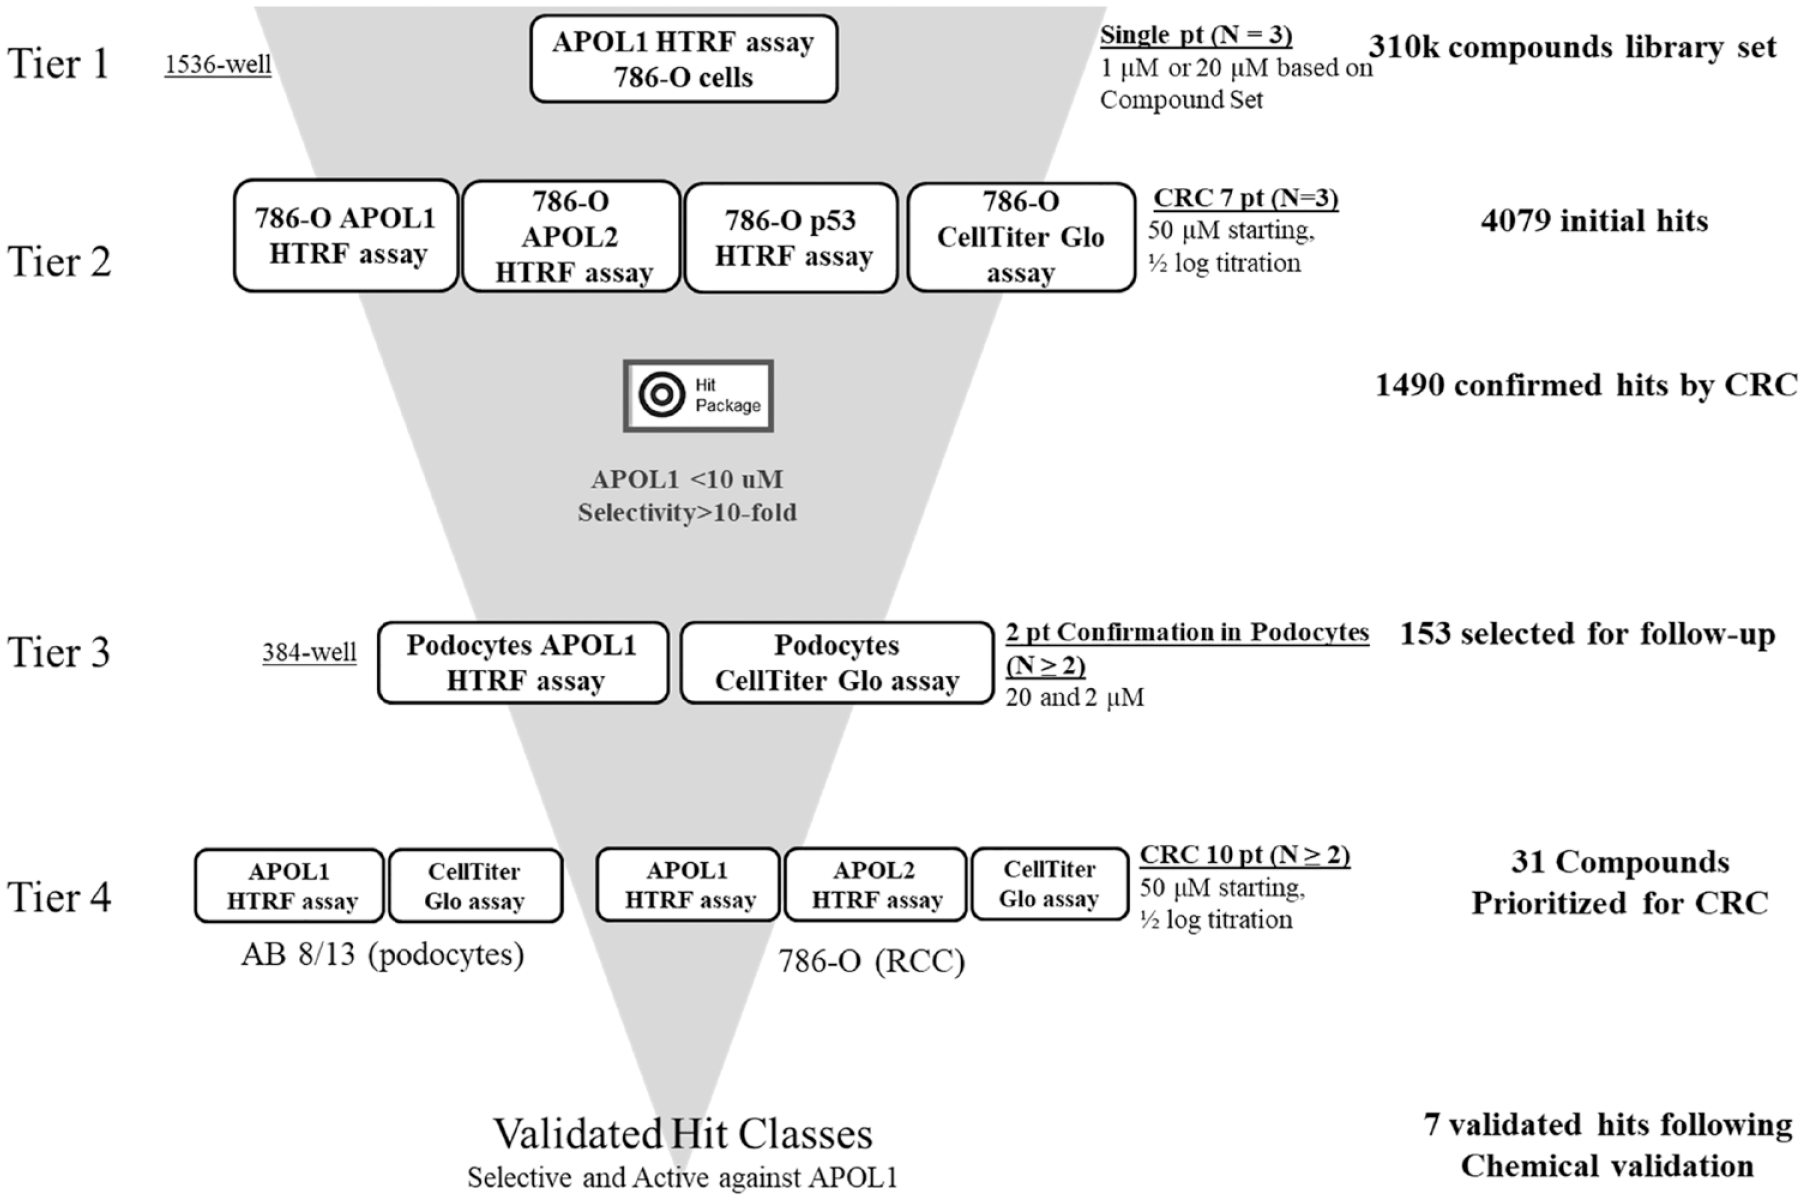
Hit-finding funnel for APOL1 suppressor screening.
All reagents and cells were dispensed with a Multidrop Combi Reagent Dispenser (Thermo Fisher Scientific) assembled with small-tube, metal tip dispensing cassette.
Differentiation of CI Podocytes
CI podocytes were bulk differentiated in large culture flasks (Nunc Cell Factory, Thermo Fisher Scientific; Falcon Multi-Flask, Corning, Teterboro, NJ) before being transferred to 384-well white TC-treated assay plates (Corning). Differentiated CI podocytes were dissociated from culture flasks using 0.25% trypsin–EDTA. Within 16 h following transfer, the CI podocytes were found to regain their podocyte-like morphology and expression of synaptopodin, as measured by quantitative PCR (data not shown).
HTRF Assay in 384-Well Format
The 384-well format assay was run using white TC-treated plates (Corning) and a MicroClime Environmental Microplate Lid (Labcyte). Test compounds in DMSO (25 nL) were transferred to the assay plates using Echo acoustic dispensing (Labcyte). Then a 30,000-cell (ARF 786-O or differentiated CI podocytes) resuspension in 25 μL of media containing 0.5% FBS was added to the assay plates. The cells were incubated with compound for 16 h (APOL1) or 48 h (APOL2). For HTRF assays, the media was removed using “light spin” centrifugation on the Blue Washer (BlueCatBio/Beckman Coulter). Then the cells were lysed with lysis buffer provided in the kit containing 2× HALT protease/phosphatase inhibitor cocktail for 45 min at 25 °C. Detection antibodies were combined in detection buffer at the concentration defined in the kit and added to the cell lysate. The assay plates were read at 665 nm and 620 nm with an EnVision plate reader (PerkinElmer, Waltham, MA) after 3 h of incubation with labeled antibodies at 25 °C. Similar to the assay in 1536-well format, relative inhibition was determined by normalizing the ratio of signals λ665 nm*10,000/λ620 nm for each well to the positive control (cycloheximide at 50 μg/mL, 178 μM).
Cell Viability Assay
Cell viability was detected with the CellTiter-Glo Luminescent Cell Viability Assay (Promega) following the kit manual. Cells were plated and treated with test compounds as described above for HTRF assays in 1536-well or 384-well plates. An equal volume of CellTiter-Glo reagent (4 µL/well in 1536-well plates and 25 µL/well in 384-well plates, respectively) was added to the assay plate. After 15 min, luminescence was read using a PHERAstar Microplate reader (BMG LABTECH) or an EnVision plate reader (PerkinElmer). Luminescence was normalized relative to the DMSO control.
High-Throughput Screening
The high-throughput screening was performed according to the hit-finding funnel (
The assays were validated with both DMSO plates (
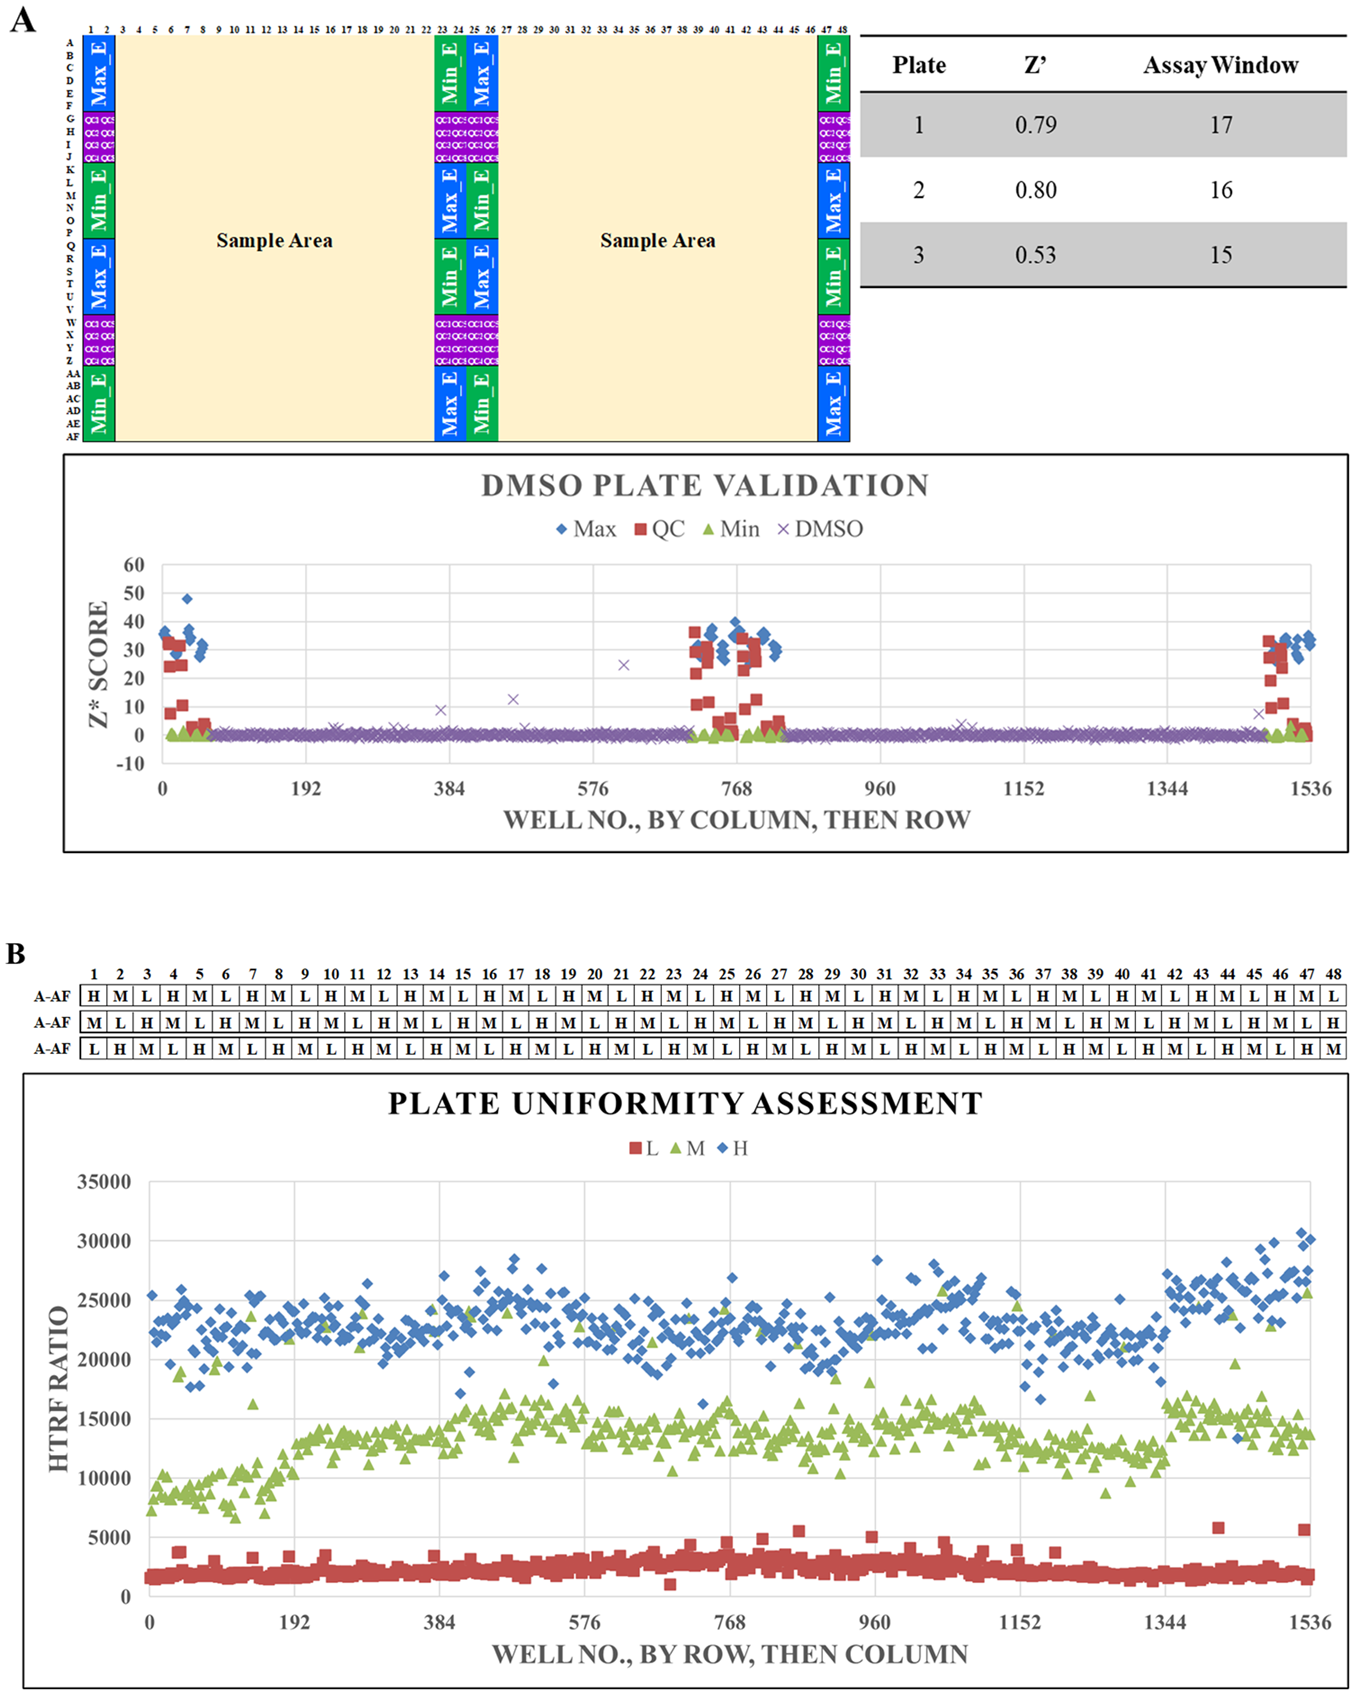
APOL1 HTRF assay miniaturization and validation for APOL1 suppressor screening in 786-O cells.
Data Analysis and Hit Selection Criteria
Z′-factor values were calculated according to Zhang et al 18 using the following formula:

where σPOS and σNEG refer to the standard deviations, and µPOS and µNEG are the means for positive and negative controls, respectively.
Hit selection from the primary screen was based on Z star (Z*) score, 19 which is calculated using the following formula:

where x refers to the observed value in each well, M refers to the median of the sample, and MAD is the median absolute deviation from the median.
The assumption is that the majority of the library compounds would be negative in a high-throughput screen; therefore, the standard deviation and median were derived from the sample area only. 19 The cutoff of hits was determined with DMSO plates. The general rule is that the hit rate of DMSO wells should not be higher than 0.5% with the selected cutoff Z*. In general, Z* cutoff would be at least 3.0 (i.e., 3σ) or higher. When compounds are tested multiple times, we have more confidence in compounds that hit a cutoff more than once, as it is much less likely for random noise to hit the cutoff more than once. In the current screen with N = 3 in the primary assay, only compounds that hit a cutoff at least twice were considered hits.
The B score is a positional bias-adjusted Z*. It would rescue the hits that would otherwise be ignored due to position effect. The algorithm of the B score tries to decompose the readout into the following components (for wells in the sample region):

It then takes the difference_from_medianwell to compute the B score. An “equivalent” cutoff of the B score is calculated to give an equivalent number of hits as Z*.
4P curve fitting with tier 2 CRC was conducted using ActivityBase software (IDBS Software Solution, Guildford, UK); curves of tier 3 and tier 4 CRCs were fit with Prism 8 (GraphPad Software, San Diego, CA). Percentage effect and EC50 were calculated based on the 4P curve fit. EC50 was assigned as >50 µM if Emax (fitted percentage effect at the highest concentration) of the curve was less than 25%.
Results
Tractability of APOL1 for Suppressor Approach
The length of a cell-based assay can vary from 1 day to a week or longer; however, longer duration is associated with higher variability. The ideal length of a screening assay should be shorter than 3 days.
17
In order to assess the feasibility of developing an assay measuring the change in cellular APOL1 levels, we first measured the turnover rate of APOL1 in both renal carcinoma cells 786-O and CI human podocytes by [2H3]-Leu incorporation and MS analysis (
APOL1 and APOL2 HTRF Assay Development
HTRF is a detection platform that allows for fast and accurate quantitation of analytes in a “no-wash” format. The principle of the HTRF assay
20
is shown in
The initial steps of assay development included the selection of proper antibody pairs and a suitable lysis buffer. Six APOL1 antibodies available either commercially or internally were labeled with d2 or cryptate and paired to assess their ability to produce a signal difference between positive and negative lysates. Cell lysates were prepared in two lysis buffers (LB2 and LB4) from CI podocytes and an inducible HEK293-APOL1 overexpression cell line with or without doxycycline. Lysates from doxycycline induced HEK293-APOL1 overexpression cells, and CI podocytes served as the positive samples and lysate from uninduced HEK293-APOL1 overexpression cells served as the negative sample. A pair of antibodies in LB4 exhibited the greatest signal-to-background window and were selected for further optimization. Antibody concentrations were independently tuned, resulting in an assay window of 45-fold between positive and negative control lysates from doxycycline-induced HEK293-APOL1 overexpression cells and nearly fivefold in CI podocytes versus the control. Shown in
For APOL2, 11 commercially available antibodies were labeled with d2 or cryptate and paired to test APOL2 signal in cell lysates from 786-O renal cell carcinoma cells. Inducible HEK293-APOL1 overexpression cells ± doxycycline were used to ensure specificity for APOL2 over APOL1. These cells also served as a low-expressing APOL2 control; HEK293 cells endogenously express APOL2,
21
although at a much lower expression level than in 786-O cells. One pair of antibodies as indicated in Materials and Methods achieved an eightfold assay window upon optimization. As shown in
Cycloheximide as a Positive Control for Suppression of Protein Expression and Identification of Useful Counterscreens
Cycloheximide is a bacterial natural product that inhibits eukaryotic protein synthesis by disrupting translation of mRNA.
22
Without new production, cellular levels of protein fall relative to their normal half-lives. When 786-O cells are exposed to cycloheximide for 16 h, dose-dependent reductions in cellular APOL1 levels as measured by HTRF are observed and decrease to nearly baseline levels (
APOL1 Suppressor Screen Hit-Finding Funnel
When designing the screening funnel (
The design of our screen utilized the APOL1 HTRF assay in 786-O cells as the primary tier 1 assay, in which the internal focused library of 310,000 compounds was run in triplicate at a single concentration (20 µM except for an annotated library of 5000 compounds, which was run at 1 µM). By running triplicates in the primary assay, it would not be necessary to run traditional confirmation steps, and we could proceed directly to CRC determination with active compounds determined by Z* and B scores 19 as tier 2. Assays (APOL1 HTRF assay and counterscreen assays: APOL2 HTRF, p53 HTRF, and CellTiter-Glo assays) at the CRC tier would be run in 786-O cells. The CRC assay was run as a 7-point half-log serial dilution starting from 50 µM (N = 3). A hit package was generated summarizing CRC results and categorizing confirmed hits based on their profiles relative to activity on APOL1 and the counterscreens. Tier 1 and tier 2 assays used to develop the hit package were run in 1536-well format; subsequent tiers were run in 384-well format. In tier 3, prioritized hits were validated in CI podocytes at two concentrations (20 μM and 2 μM) in the APOL1 HTRF assay, with CellTiter-Glo assay serving as the counterscreen assay to rule out hits causing cell toxicity. Confirmed hits were further validated in tier 4 with a 7-point CRC in both differentiated human CI podocytes (APOL1 HTRF and CellTiter-Glo) and 786-O cells (APOL1 HTRF, APOL2 HTRF, and CellTiter-Glo). As a final confirmatory step, selected molecules were chemically validated (repurification and confirmation of identity) and retested to yield “validated hit classes” of interest.
APOL1 HTRF Assay Miniaturization and Validation
Miniaturization from 384 to 1536
A critical factor to the feasibility of this screen was miniaturization from the 384-well to 1536-well format. Multiple factors affected the performance of the assay upon miniaturization, including cell number, plate types, and reagent dispensing protocol.
Because measuring the loss of APOL1 with high precision is critical to a suppressor screen, starting with a high basal APOL1 protein level well above the assay detection limit was critical. When miniaturizing an assay from 384-well to 1536-well format, decreasing the cell number proportionally to the volume of the plate well (i.e., ¼) is normal; however, in the case of the APOL1 assay, we found that the level of the protein would be too low to achieve a workable assay window. As result, a slightly higher cell number (10,000 cells/well) was applied and provided a reasonable assay window. Plate type was also found to affect sensitivity; of those tested, Aurora 1536-well high-base white plates afforded the lowest background, resulting in higher sensitivity. Additionally, cell and reagent dispensing protocols required optimization on a MultiDrop Combi to ensure accurate dispensing of the small volumes (1–4 µL/well) required by our protocol. Most notably, buffers containing detergent were degassed before dispensing to avoid accumulation of air bubbles in the tubing of the dispensing cassette.
Validation: Reproducibility and Robustness
As part of assay validation, the assay performance was determined by running three DMSO plates each (plate map in
Validation: Uniformity
Plate uniformity was tested with three different concentrations of cycloheximide in each plate according to the guidance from the Assay Guidance Manual.
17
The three concentrations were 50 µg/mL (“low” signal), 5 µg/mL (“medium” signal), and 0 µg/mL (1% DMSO only; “high” signal). Three different layouts of these concentrations were tested at N = 3 as described in Materials and Methods (layout shown in
Hits Selection and Validation
Following the hit-finding funnel described above, 4079 primary hits (1.33% hit rate) were selected for follow-up testing in CRC assays. As described in Materials and Methods, these hits were selected based on the Z* (3.5) and B (4.53) scores. Using these cutoffs, the estimated false-positive rate is lower than 0.5%. Additionally, only compounds with at least two of three replicates meeting cutoff criteria (Z* and/or B score) were considered “hits.” Compounds with only one of three replicates meeting the cutoff criteria were considered artifacts or resulted from dispensing errors.
CRC follow-up utilized 7-point half-log titration starting at 50 µM in the four assays as outlined in the hit-finding funnel (
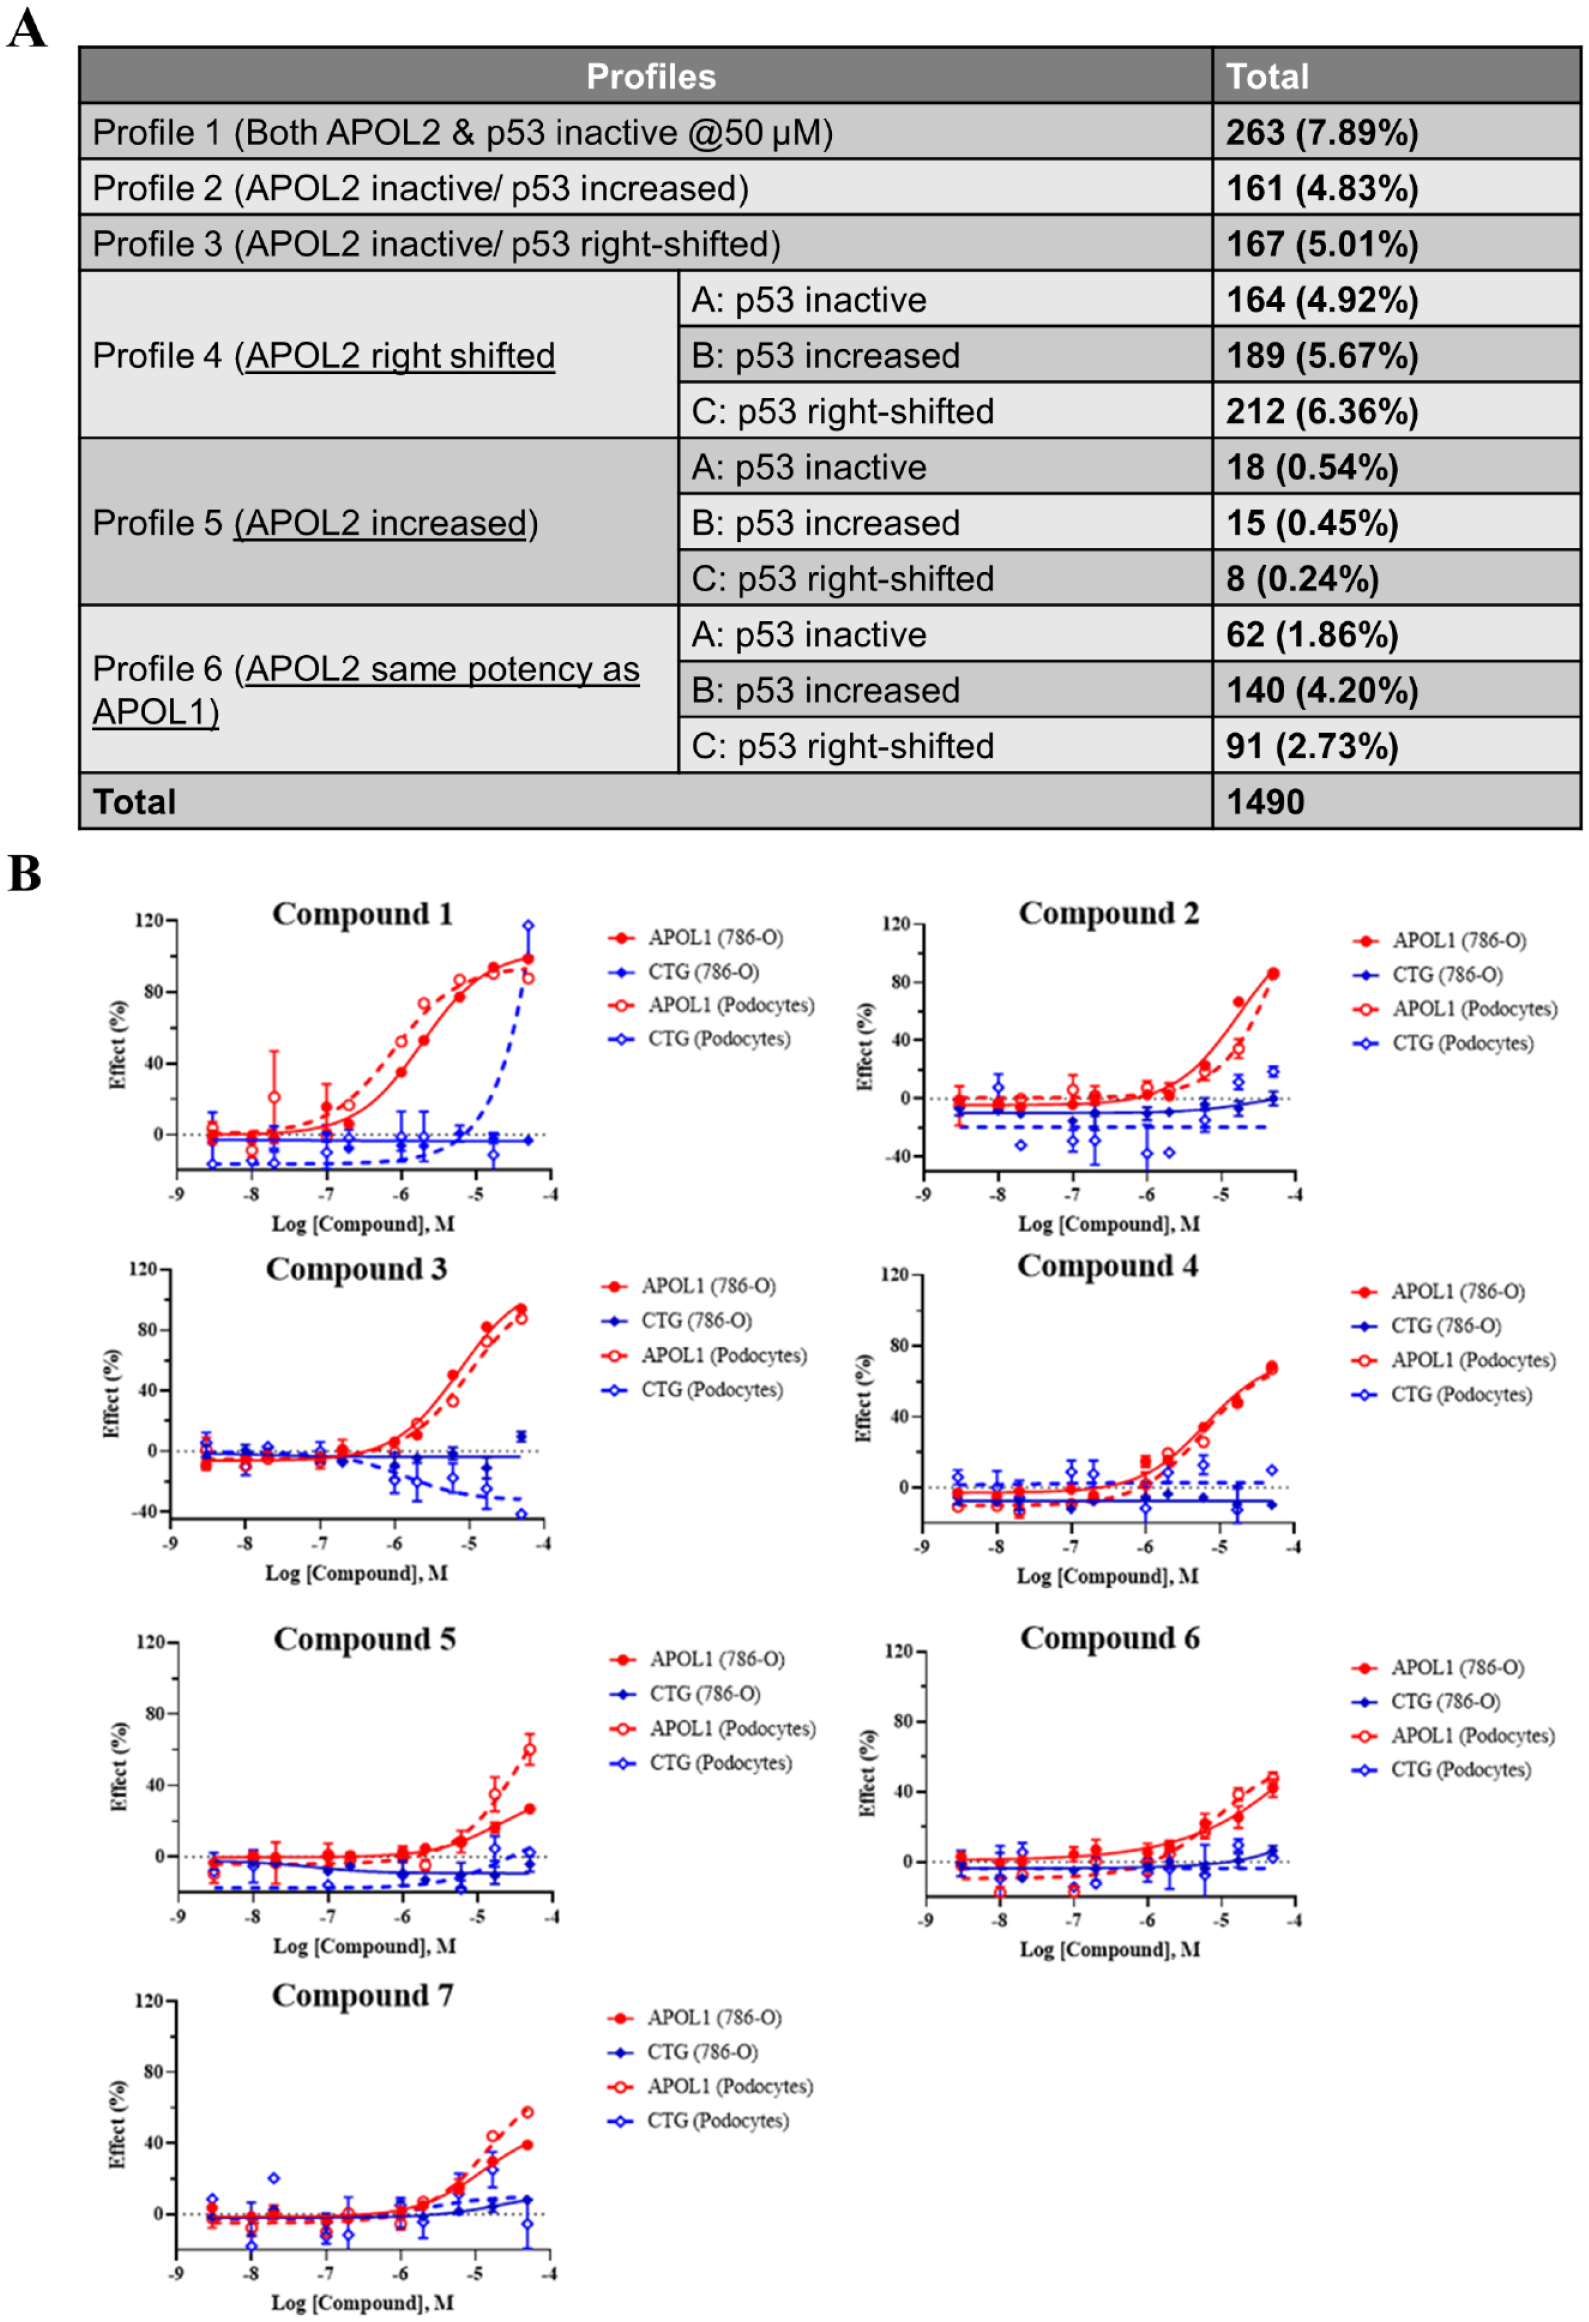
Hit selection and validation. (
The CRCs of hits with desired profiles were further validated in CI podocytes, the most scalable physiologically relevant cell line.
11
To effectively test compounds at scale in CI podocytes, we developed a protocol as described in Materials and Methods that utilized batch differentiation in large culture flasks before transferring to 384-well assay plates. We believed that these bulk differentiated cells could be used immediately in the assay and did not require additional incubation prior to compound addition, a step that would introduce additional variation. However, with still limited throughput, we focused on 153 “profile 1” and “profile 4A” hits that are of most interest with regard to activity and inhibition profile to confirm APOL1-suppressing activity at 2 and 20 μM in CI podocytes. Thirty-one active compounds were then prioritized for the CRC in both CI podocytes (APOL1 HTRF, CellTiter-Glo) and 786-O cells (APOL1 HTRF, APOL2 HTRF, p53, and CellTiter-Glo) in the 384-well format. The top seven candidates with the desired profile (APOL1 activity <10 μM, >10× selectivity against APOL2 and p53, and activity not related to cytotoxicity) (
Discussion
The growing utilization of genetic association studies to identify proteins or genes validated in the human population will continue to identify compelling new targets. 23 Especially for those targets traditionally viewed as “undruggable,” established and emerging strategies to modulate levels of the target protein may put them within reach. Notable examples spanning the large, beyond rule-of-five (BRof5) molecules (e.g., oligonucleotides,24,25 bivalent targeted degraders 26 ) and small-molecule (e.g., PCSK9,13–15 splice modulators 27 ) spaces have not only served as useful tools to understand target biology, but also made their ways into the clinic. Given the growing evidence supporting small-molecule suppressors as a therapeutic strategy, we were interested in applying this strategy to APOL1-mediated kidney disease because of the strong pathological association between high levels of expression of the RRVs and kidney disease3–7,28 and the evidence of healthy APOL1-null individuals. 12 This suppressor strategy contrasts with approaches targeting the pore-forming function of APOL1 relevant to trypanosome lysis29 and potentially the cause of accelerated loss of podocytes. In the development of VX-147, which is now entering phase 2a trials for APOL1-mediated FSGS, 30 Vertex reported using both a functional channel/pore assay to measure ion flux in APOL1 overexpression HEK293 cells as well as a trypanosome lysis (rescue) assay with recombinant APOL1 to develop these molecules. 31 Although the mechanism has not been explicitly described, this would be consistent with their language and with identifying inhibitors acting directly on APOL1. However, with the mechanism of APOL1 pathology yet to be unambiguously confirmed,11,32–35 a selective suppressor of APOL1 could also be an appropriate therapeutic strategy. In this study, we reported the development of a homogenous, high-sensitivity HTRF assay for rapidly measuring cellular APOL1 levels and a high-throughput phenotypic screen strategy toward the identification of potent, selective small-molecule suppressors of APOL1 in kidney-derived tissues.
To date, there have been no reports of technologies to measure endogenously expressed APOL1 that is amenable to high-throughput screening. HTRF is a robust, FRET-based platform that allows measurement of cellular proteins in a no-wash format using two target-specific antibodies. 20 For APOL1, we raised several high-affinity and selective antibodies and tested the various donor/acceptor pairs in combination with several commercially available antibodies. The best pair not only effectively detects endogenous APOL1 in both 786-O RCC cells and a CI human podocyte cell line, but also captures cycloheximide-dependent inhibition of APOL1 production. For APOL2, we used commercially available antibodies to produce an analogous detection system. These HTRF systems for both APOL1 and APOL2 were critical advances that allowed us to devise a suppressor screening strategy targeting endogenous APOL1, rather than an epitope or other tag for detection (e.g., NanoLuc).
Our screening funnel was designed to enrich for suppressors that selectively target APOL1 that would be effective in kidney cells. 786-O is a kidney-derived renal cell carcinoma cell line 36 that (1) expresses high amounts of endogenous APOL1 and (2) is a prolific immortalized cell line that could be used for large-scale primary screen in 1536-well format to efficiently test a 310,000-compound library. Two targets were selected for counterscreens: APOL2, a related family member, 21 and p53, which was found to have a short half-life similar to APOL1 and could also be measured by HTRF. 37 Selective hits were then tested for activity in a CI human podocyte cell line, as a model of the posited relevant cell type. 11 The requirement of cell differentiation and lower APOL1 expression of the podocyte model 38 has made it challenging to utilize these cells in a high-throughput phenotypic assay; to our knowledge, the highest throughput reported to date is an imaging-based assay in the 96-well format. 39 In the current study, we utilized bulk differentiated CI podocytes in a 384-well format HTRF assay, enabling us to more efficiently triage our primary screening hits in the most scalable, physiological relevant cells available. Following chemical validation and retesting in both 786-O and CI podocytes, we identified seven structurally distinct classes of molecules that exhibited selective suppression of APOL1 as confirmation of our strategy.
Despite the promising appearance of our APOL1 suppressors, critical follow-up is necessary to gain tractability toward a therapy for APOL1-mediated kidney disease. Testing of additional chemical matter is critical to build an understanding of the structure–activity relationship (SAR) to determine the critical core structures and the functional groups that afford activity and selectivity. This could also begin to provide support for hypotheses of potential targets or a framework for tools to probe their mechanism of action. If a better understanding of the mechanism can be achieved, this could provide a pathway to targeted therapeutics for not only APOL1 but also other “difficult” gain-of-function targets. In a parallel effort reported separately, we have also taken a functional genomics approach to APOL1 suppression using a genome-wide CRISPR (clustered regularly interspaced short palindromic repeats) screen as an orthogonal strategy for target and pathway identification and validation. A combination of small-molecule suppressor screening and a functional genomics screen to target identification and validation provides a robust strategy for gain-of-function genetic targets with an ambiguous pathological mechanism.
Supplemental Material
sj-pdf-1-jbx-10.1177_24725552211026245 – Supplemental material for High-Throughput Screening to Identify Small Molecules That Selectively Inhibit APOL1 Protein Level in Podocytes
Supplemental material, sj-pdf-1-jbx-10.1177_24725552211026245 for High-Throughput Screening to Identify Small Molecules That Selectively Inhibit APOL1 Protein Level in Podocytes by Jonathan Choy, Yanqing Kan, Steve Cifelli, Josephine Johnson, Michelle Chen, Lin-Lin Shiao, Haihong Zhou, Stephen Previs, Ying Lei, Richard Johnstone, Andy Liaw, Ashmita Saigal, Lufei Hu, Robert Ramos, Richard Visconti, William T. McElroy, Anthony Kreamer, Mary-Jo Wildey, Andrea Peier, Myung K. Shin, Jason Imbriglio, Zhao Ren, Maarten Hoek, Adam Weinglass and Xi Ai in SLAS Discovery
Footnotes
Acknowledgements
The authors thank Dr. Moin Saleem for kindly providing the human conditional immortalized podocyte cell line and Dr. David Bauman for his valuable advice on determination of the protein turnover rate.
Supplemental material is available online with this article.
Declaration of Conflicting Interests
The authors declared the following potential conflicts of interest with respect to the research, authorship, and/or publication of this article: The authors are employees of Merck and Co., Inc., and their research and authorship of this articles was completed within the scope of their employment with Merck and Co., Inc.
Funding
The authors received no financial support for the research, authorship, and/or publication of this article.
References
Supplementary Material
Please find the following supplemental material available below.
For Open Access articles published under a Creative Commons License, all supplemental material carries the same license as the article it is associated with.
For non-Open Access articles published, all supplemental material carries a non-exclusive license, and permission requests for re-use of supplemental material or any part of supplemental material shall be sent directly to the copyright owner as specified in the copyright notice associated with the article.