
Abstract
Problems with drug ADME are responsible for many clinical failures. By understanding the ADME properties of marketed drugs and modeling how chemical structure contributes to these inherent properties, we can help new projects reduce their risk profiles. Kinetic aqueous solubility, the parallel artificial membrane permeability assay (PAMPA), and rat liver microsomal stability constitute the Tier I ADME assays at the National Center for Advancing Translational Sciences (NCATS). Using recent data generated from in-house lead optimization Tier I studies, we update quantitative structure–activity relationship (QSAR) models for these three endpoints and validate in silico performance against a set of marketed drugs (balanced accuracies range between 71% and 85%). Improved models and experimental datasets are of direct relevance to drug discovery projects and, together with the prediction services that have been made publicly available at the ADME@NCATS web portal (https://opendata.ncats.nih.gov/adme/), provide important tools for the drug discovery community. The results are discussed in light of our previously reported ADME models and state-of-the-art models from scientific literature.
NPC, NCATS (National Center for Advancing Translational Sciences) Pharmaceutical Collection; PAMPA, parallel artificial membrane permeability assay; ADME, absorption, distribution, metabolism and excretion; QSAR, quantitative structure–activity relationship; RLM, rat liver microsomes.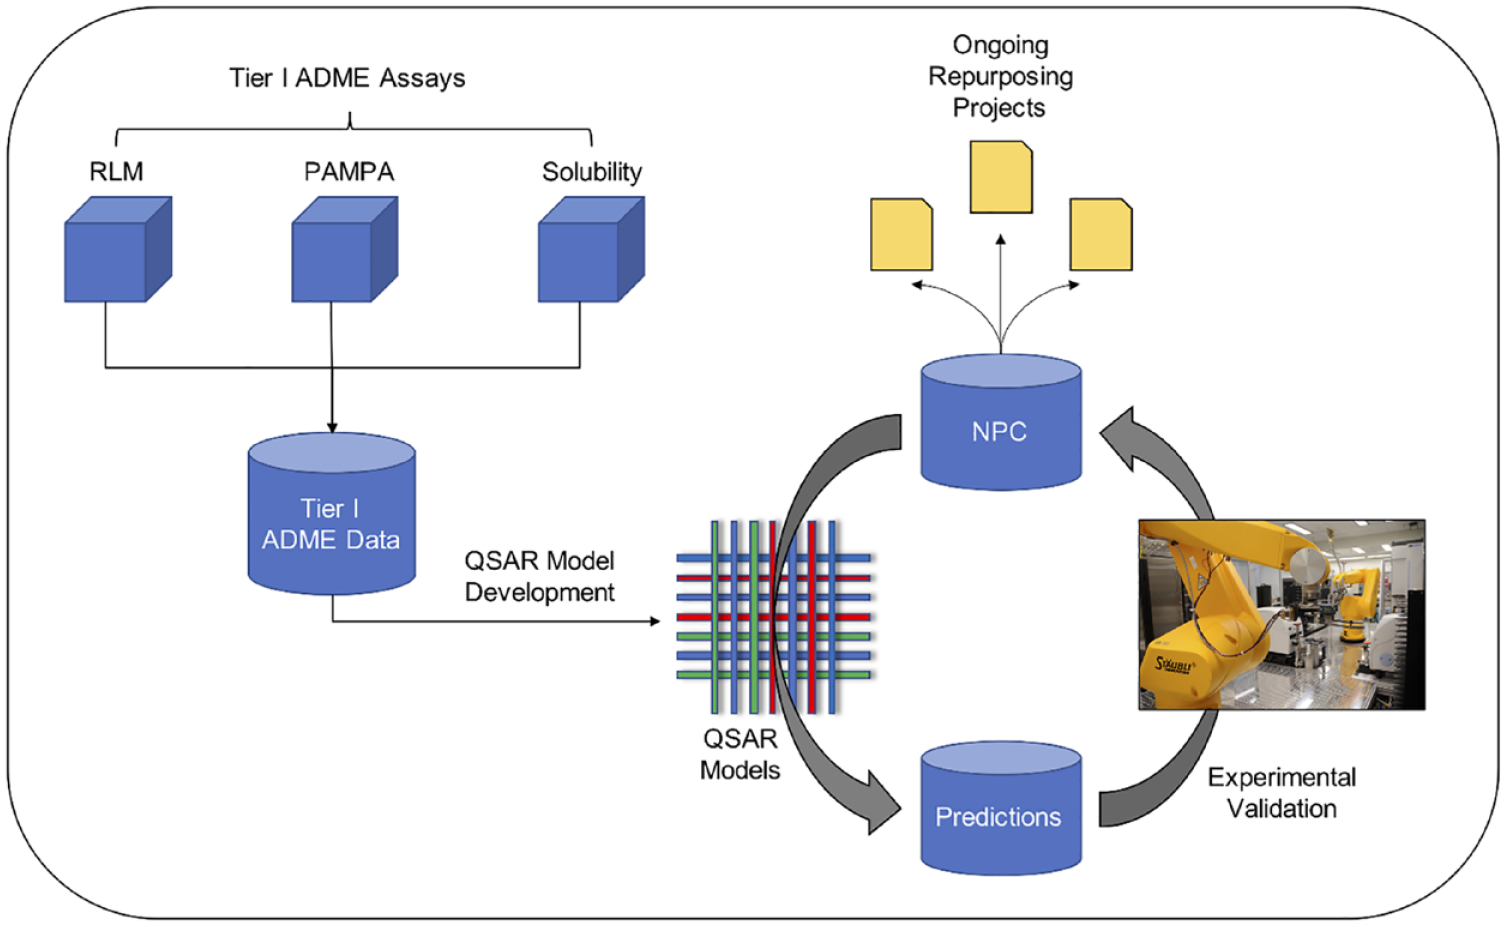
Introduction
The cost of bringing a new drug candidate from discovery into the market has risen steadily during the past few decades and currently stands at US$2.6 billion. 1 In addition to the astronomical costs, the attrition rate is extremely high, with only 1 out of 20 candidates reaching the market after entering clinical development. 2 Recent analyses identified safety and/or efficacy as leading culprits for the high attrition rate.3–5
A vital piece of the drug discovery and development puzzle is ADME studies. Before ADME studies were formally introduced into the preclinical optimization process, ~40% of compounds failed due to poor human pharmacokinetics. Since then, that number has gone down significantly to ~10%. 7 Rat liver microsomal (RLM) stability, the parallel artificial membrane permeability assay (PAMPA), and kinetic aqueous solubility constitute the Tier I ADME assays at the National Center for Advancing Translational Sciences (NCATS). After optimization in these assays, a compound would advance for assessment of additional ADME parameters in Tier II assays. While NCATS experimentally tests all synthesized compounds in Tier I ADME assays, these assays are both time- and resource-intensive. A valuable alternative is to rely on in silico models for the prediction of ADME properties, and this strategy is routinely implemented by pharmaceutical companies8,9 and at NCATS. The prediction results can be used to rank-order compounds for synthesis, and thus, project teams can get to their lead compound in fewer iterations.
In this study, we update in silico ADME prediction models previously published using new data generated from our in-house Tier I assays for various drug discovery and development projects. We assess the quality of these models using a subset of marketed drugs. The experimental data, the predictions, and the predictive models can serve as valuable resources that have been made publicly available for the drug discovery community at https://opendata.ncats.nih.gov/adme/.
Methods
Tier I ADME Assays
RLM stability: A single-time-point RLM stability assay was performed as described previously. 10
PAMPA permeability, pH 7.4: Stirring double-sink PAMPA (patented by Pion Inc., Billerica, MA) was used to determine permeability and performed as described previously. 11
Kinetic aqueous solubility: Kinetic aqueous solubility was determined using Pion Inc.’s patented µSOL assay as described previously. 12
Training Data
The Tier I data generated from the above-described assays constituted the training data for developing the prediction models. As of January 1, 2021, a total of 25,262, 21,696, and 25,853 measurements were available from RLM, PAMPA, and solubility assays, respectively. Each of these datasets was preprocessed in the same manner to obtain a final dataset that was used for building prediction models. The steps involved in preprocessing include standardization of chemical structures using the Layered Chemical Identifier (LyChI) toolkit (https://github.com/ncats/lychi), 13 followed by removal of duplicates and compounds with inconsistent assay outcomes (191 compounds from RLM data and 224 compounds from solubility data). Compounds used for validation of these models were also excluded from the training set by mapping them using LyChI. For RLM, we chose to use a 30-min threshold to separate unstable compounds from stable compounds, as described in our previous work. 10 Due to the wide range of effective permeability (P eff ) values in our PAMPA assay, the original values were converted into logarithmic scale. All compounds with a log P eff value lower than 2.0 were considered to have low to moderate permeability, and those with a value higher than 2.5 were considered as high-permeability compounds. Compounds with a value between 2.0 and 2.5 were omitted from the dataset to maintain consistency with our previous work. 11 We chose a threshold of 10 µg/mL to separate low-solubility compounds from high-solubility compounds. Due to omission of edge cases (i.e., compounds with target values very close to the cutoff), the PAMPA dataset is slightly smaller in size as compared to the RLM and solubility datasets. Distribution of the training data based on the individual classes can be seen in Figure 1 .
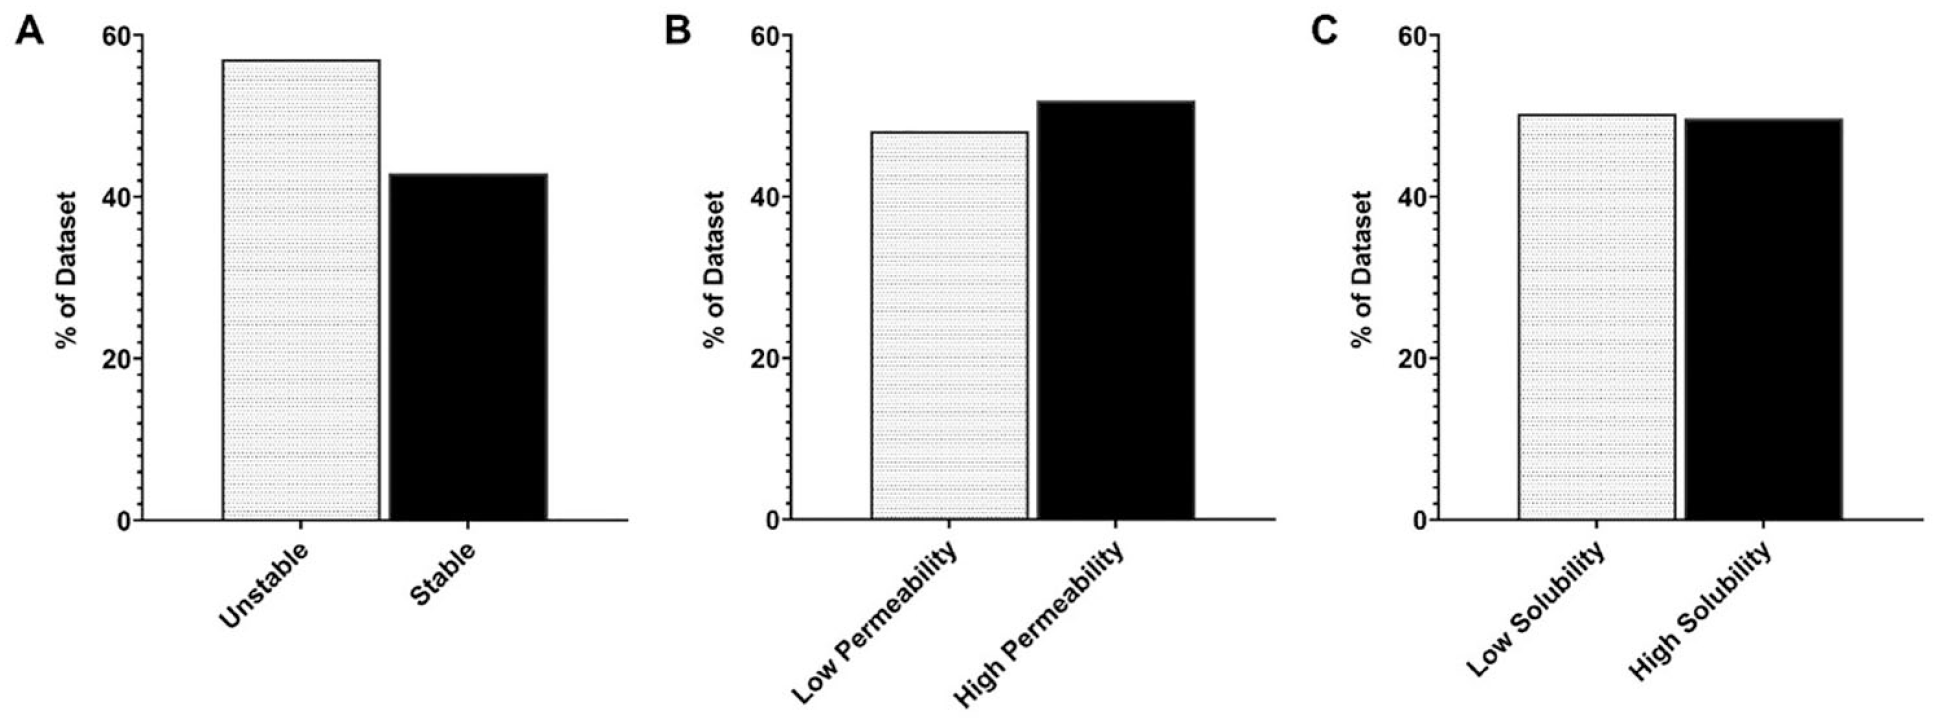
Distribution of training data: (
Validation Data
The NCATS Pharmaceutical Collection (NPC) contains ~2650 compounds that have been approved for clinical use by US, Canadian, Japanese, and European health regulatory authorities. This library is amenable to high-throughput screening (HTS) and is used as a screening and bioinformatics resource. During the past 10 years, NCATS received more than 300 collaboration requests to screen the NPC, which resulted in more than 200 collaborative projects. 14 NCATS uses marketed drugs to identify drug-repurposing opportunities, and often submits marketed drug hits into Tier I ADME assays for further assessment. NCATS has tested 220, 186, and 142 marketed drugs in our RLM, PAMPA, and solubility datasets, respectively, which can serve as an important validation dataset for model assessment purposes. The three datasets vary slightly, since chemists sometimes request individual assays depending on the needs of the project. Additional reasons for missing values include weak or no ultraviolet (UV) signal, weak or no mass spectrometry signal, highly insoluble compounds, compounds with high nonspecific binding, compounds with high affinity for the lipid layer (PAMPA), and so on. Since the assays are run in a high-throughput format using liquid handling systems, mis-pipetting and air bubbles can occur occasionally and cause high variation in duplicate values. Compounds with high variation in duplicate values were also excluded from our validation dataset. As mentioned earlier, these compounds were excluded from the training sets used to develop our QSAR models.
Modeling Methods
Random Forest
We used the random forest (RF) method for developing baseline models for all three endpoints. Simply put, RF is an ensemble of decision trees. 15 These trees are fitted on different subsamples of data, and overfitting is avoided by averaging to improve prediction accuracy. We used the Scikit-learn 16 (https://scikit-learn.org) implementation of RF to build models using 100 estimators and leaving the rest of the parameters to default. RDKit descriptors (https://rdkit.org) were used as features for RF models. The reason for choosing RF as the baseline models is their popularity among the machine learning methods used for modeling biological activity. 17 Ever since it was introduced as a classification and regression tool for predicting the biological activity of a compound based on its quantitative description, RF has become a powerful learning method that delivers performance and is among the state-of-the-art methods to date. 18 Recent benchmark studies that have extensively evaluated different machine learning methods for predicting molecular properties used RF to develop baseline models and reported that RF turned out to be the best-performing method for certain endpoints.19,20
Graph Convolutional Neural Networks
In our previous study, 10 we reported that graph convolutional neural networks (GCNNs) 21 performed consistently better than RF, deep neural networks, and recurrent neural networks in both traditional fivefold cross-validation (5-CV) and a time-split-based cross-validation. Therefore, we decided to use GCNN as the only modeling method in this study for all three endpoints. To confirm whether this observation held true, however, we used RF as a baseline model for comparison. GCNNs rely on the structural information available in molecules by directly operating on them. Molecular structures are represented as graphs (atoms constitute nodes, and bonds constitute the edges of a graph). For each atom, the features of the neighboring atoms are aggregated. Again, we used the same message-passing variant of GCNN made available through the ChemProp 22 Python package (https://github.com/chemprop/chemprop) by using default parameters. 20 This variant, known as a message-passing neural network, operates in two phases. In the first phase, information is transmitted across the molecule to build a neural representation, followed by the second phase in which the final representation is used to make predictions. An overview of the two modeling methods used in this study is presented in Figure 2 .
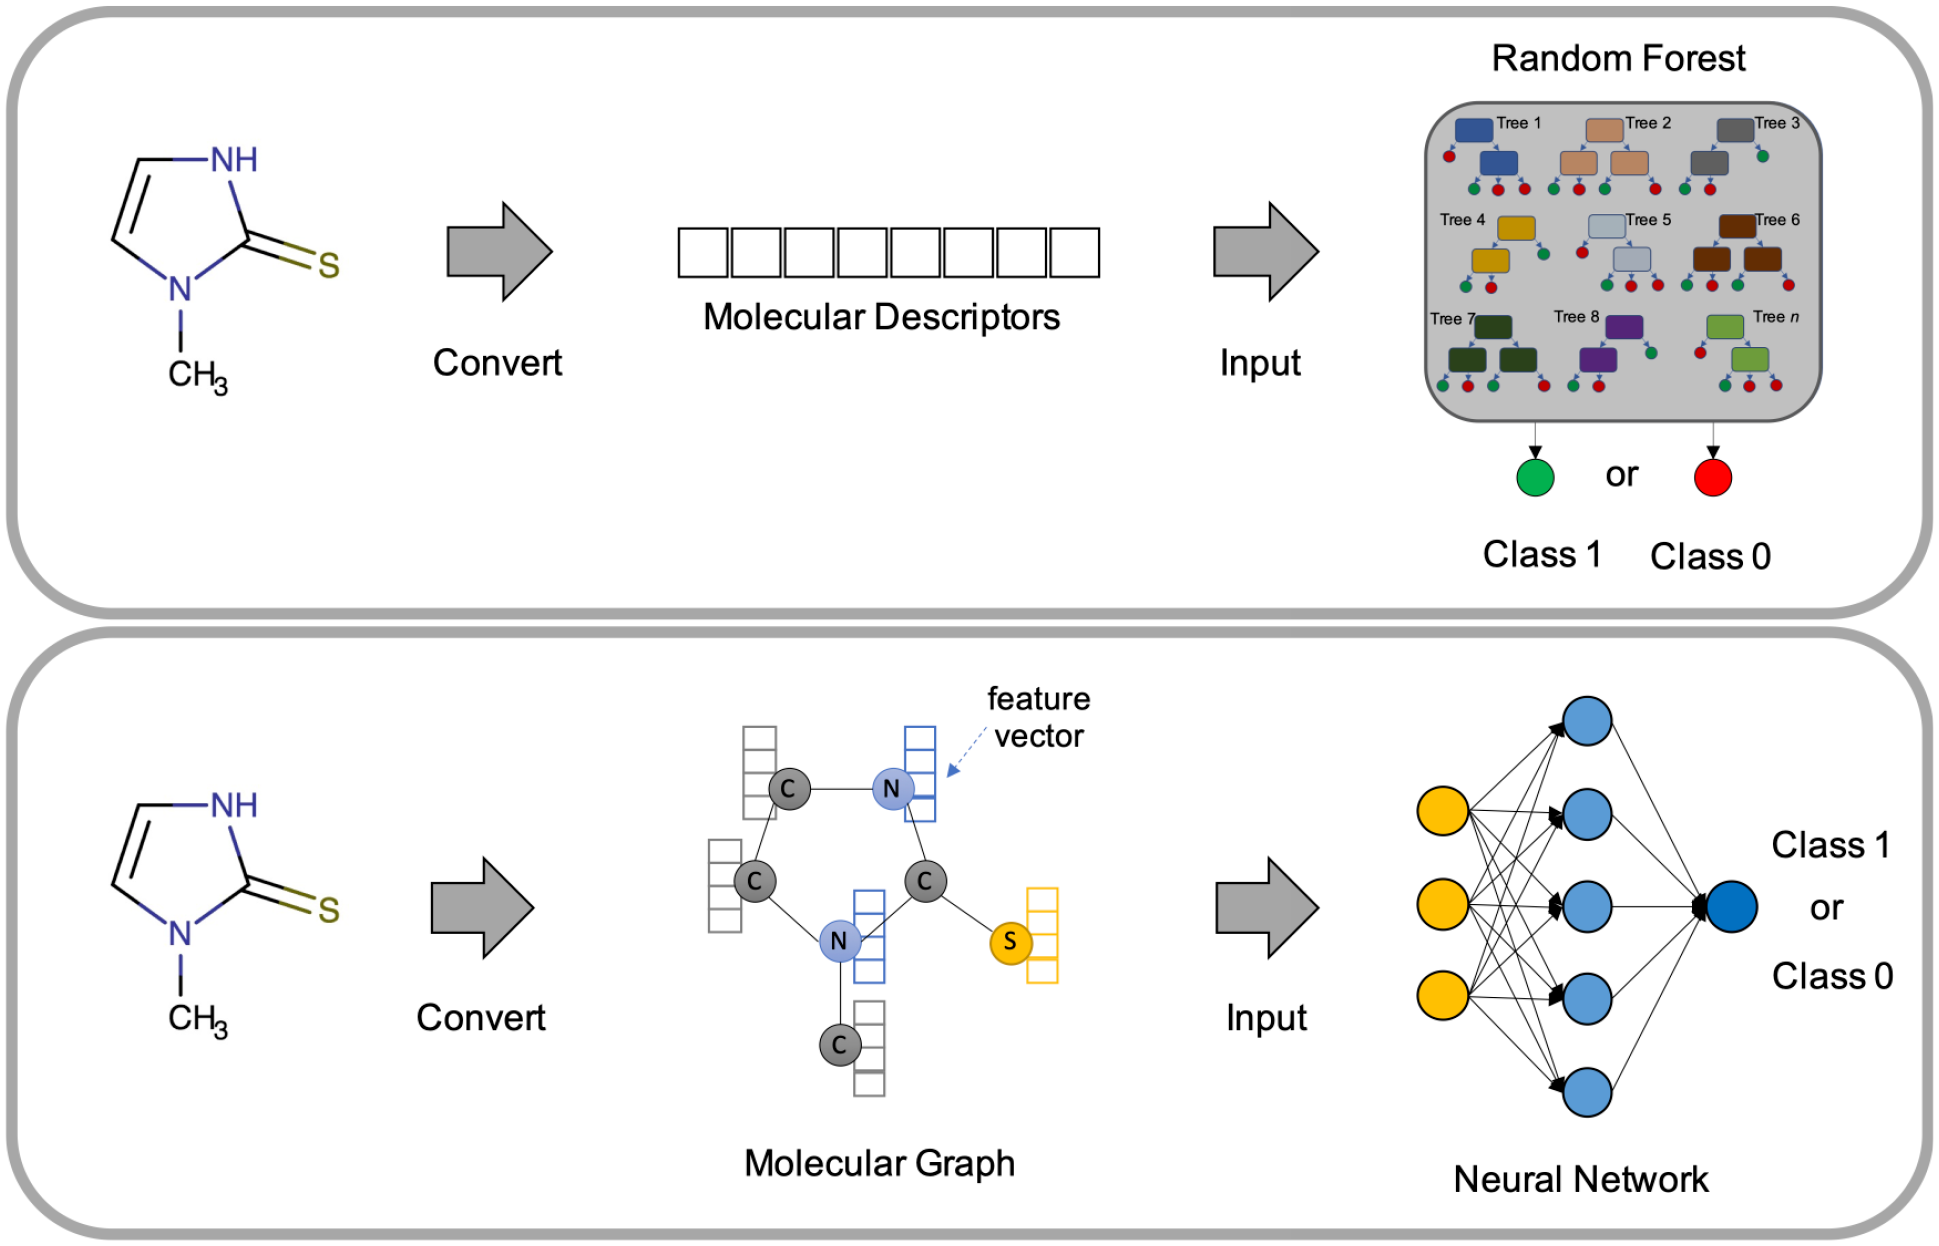
Overview of the random forest and graph-based neural network modeling methods.
Modeling and Validation
Each Tier I ADME dataset was randomly split into an internal training and test set at an 80:20 ratio using the “train_test_split” module available in Scikit-learn. The split was performed another four times with the shuffle parameter set to True, which resulted in a total of five internal training and test sets. Thus, a total of five models was generated for each Tier I endpoint following a 5-CV scheme. In each fold, the internal training set was used to build a model that was validated on the internal test set. The performance of the models on these five test sets was averaged to report cross-validation performance. Finally, the complete datasets were used to build prediction models that were then used to predict the test set comprising of marketed drugs.
The model performance was assessed using different statistical measures. A receiver operating characteristic (ROC) curve, which plots the true-positive rate against the false-positive rate, was used to estimate the predictive power of the classification models. The area under the ROC curve (i.e., AUC-ROC) is a numerical value between 0 and 1. The higher the value, the better the predictive power. Sensitivity indicates the proportion of true positives correctly predicted as positive. Specificity is the ability of the model to correctly predict true negatives as negative. Balanced accuracy (BACC) is an average of the sensitivity and specificity. It is a useful alternative to accuracy when the datasets in hand have a large degree of class imbalance. Cohen’s kappa is another metric used in this study that measures agreement between the actual classes and the classes predicted by the classifier.
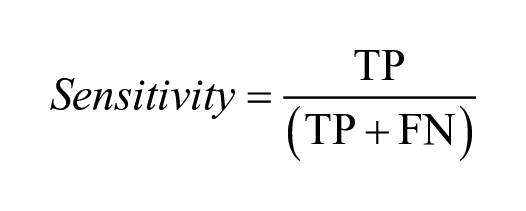

where TP: true positives; FN: false negatives; TN: true negatives; and FP: false positives. In the case of kappa, pa is the proportion of observations in agreement, and p∈ is the proportion in agreement due to chance.
Results and Discussion
Molecular Property Distribution
Throughout the past 9 years, Tier I ADME data have been generated for >20,000 compounds across a multitude of drug discovery projects and chemotypes. To assess the molecular property distribution of our dataset, molecular weight, log P, total polar surface area (TPSA), the number of hydrogen bond donors (HBDs) and hydrogen bond acceptors (HBAs) were calculated using an in-house compound dataset annotation tool called NCATS Find.
23
The property distribution plots reveal our dataset to be diverse (
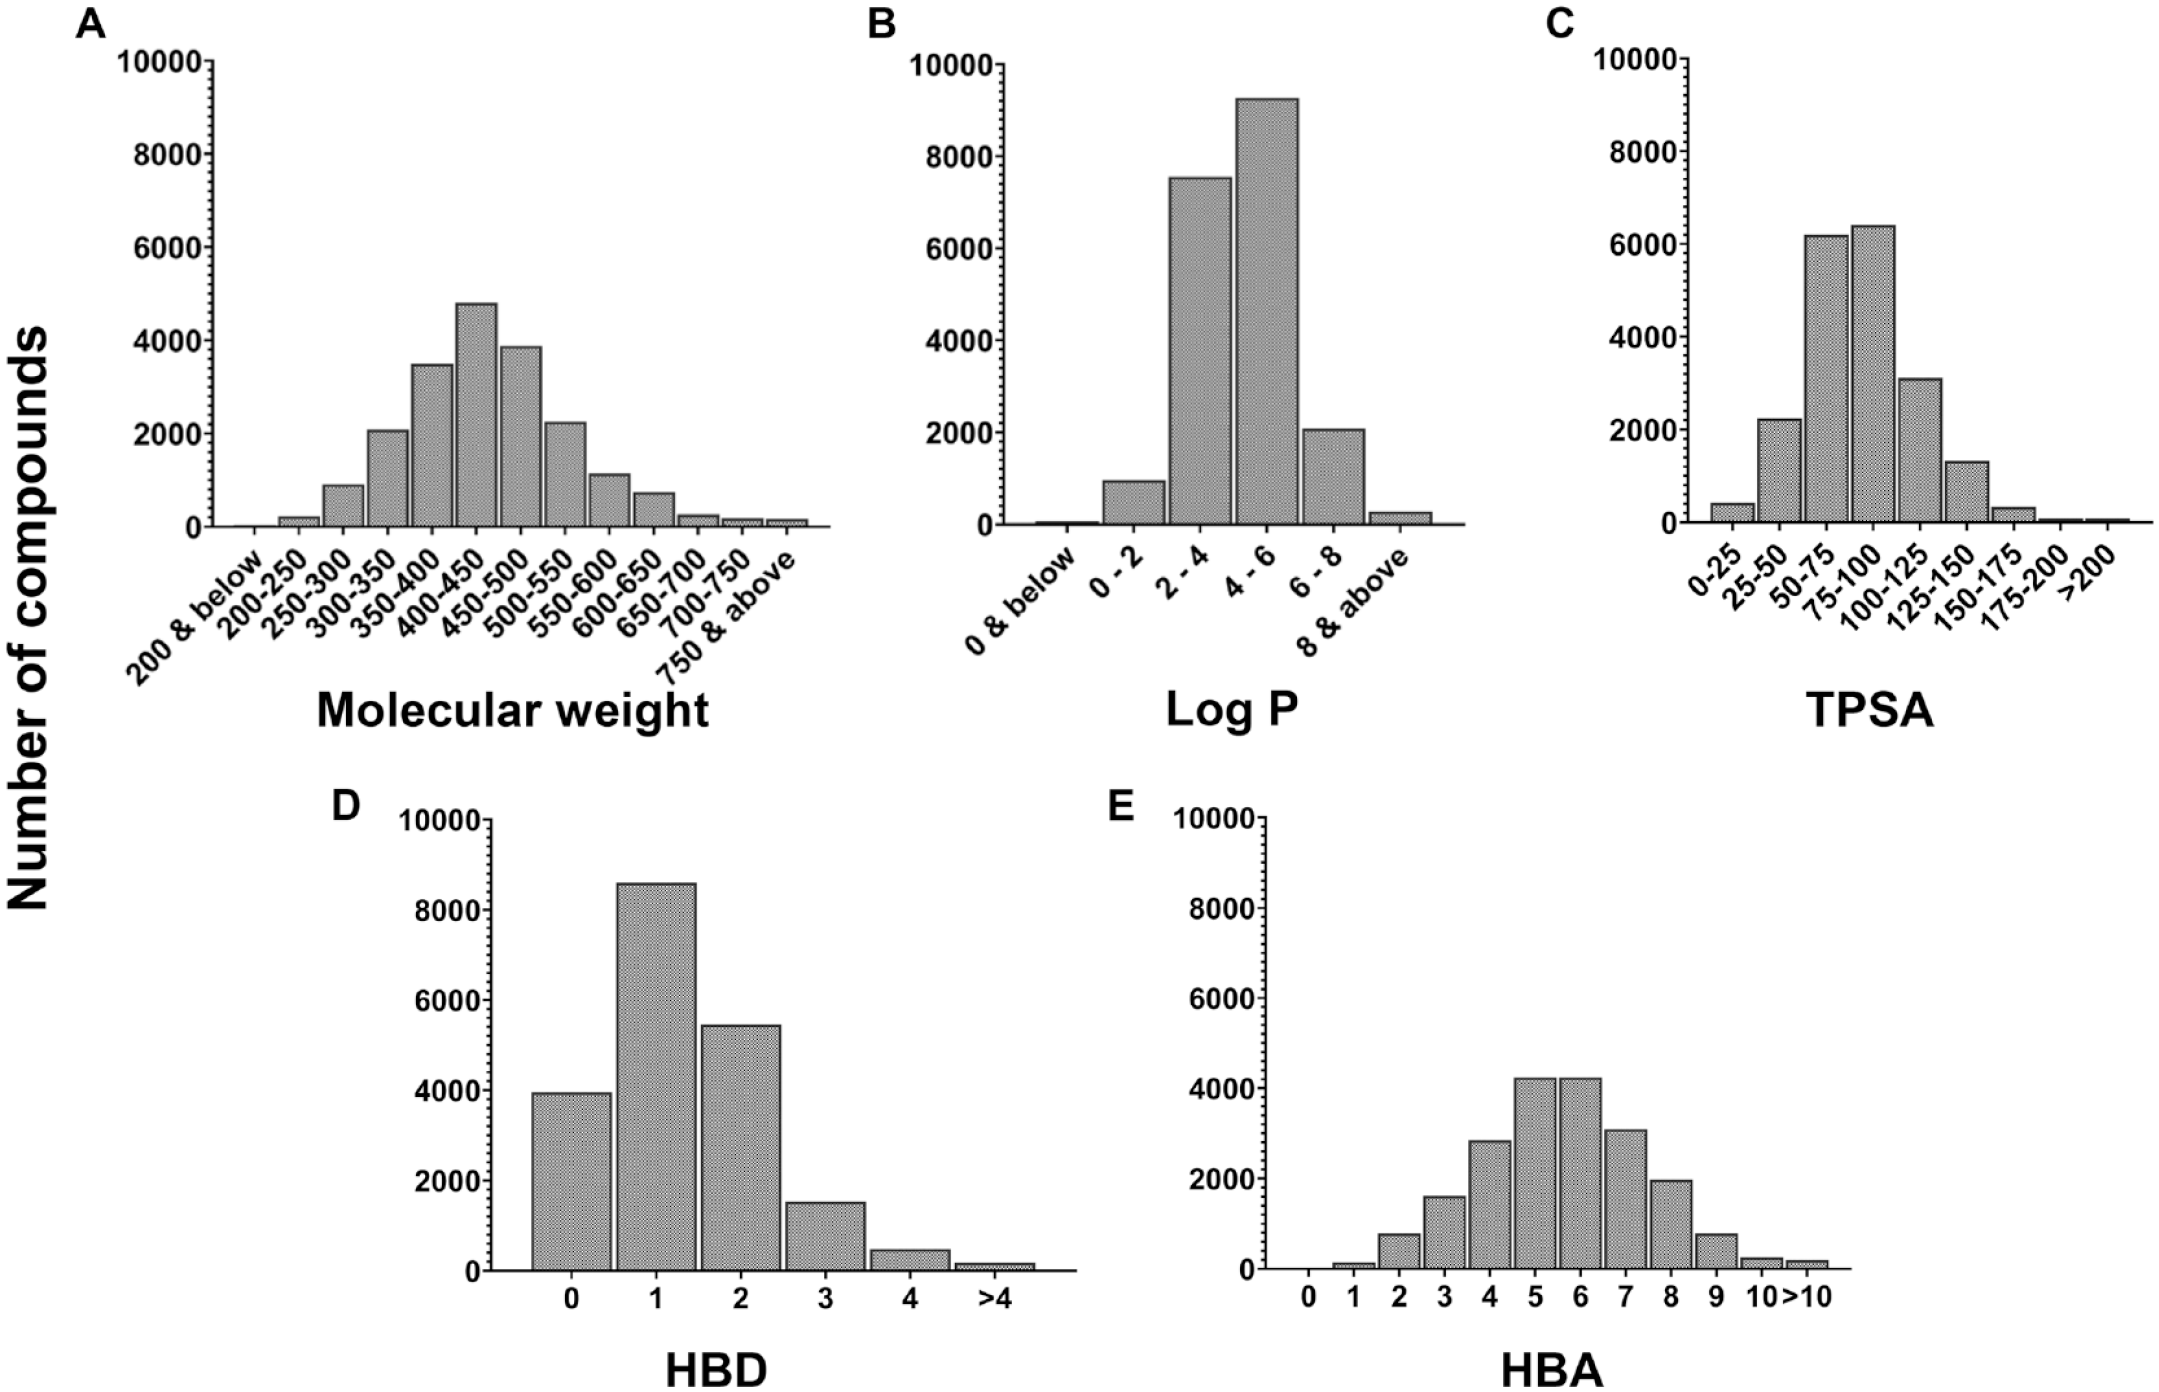
Molecular property distributions of the ADME datasets (>20,000 compounds), including (
Assay Performance
Control compounds were run routinely in each Tier I ADME plate. While the RLM stability assays had six control compounds, PAMPA permeability and solubility assays had three control compounds in each plate. Minimum significant ratio (MSR) 24 is a statistical parameter used to quantify assay variability or reproducibility. MSR for all control compounds barring one was <3, which reveals exceptional assay reproducibility among more than 500 experimental plates ( Table 1 ). Control compounds with values higher or lower than the limit of quantification—that is, high-stability controls for RLM (t1/2 > 30 min), or poorly soluble and poorly permeable controls (values <1) in PAMPA and solubility assays—were excluded from MSR analysis.
Reproducibility of Control Compounds in the Three Tier I ADME Assays.
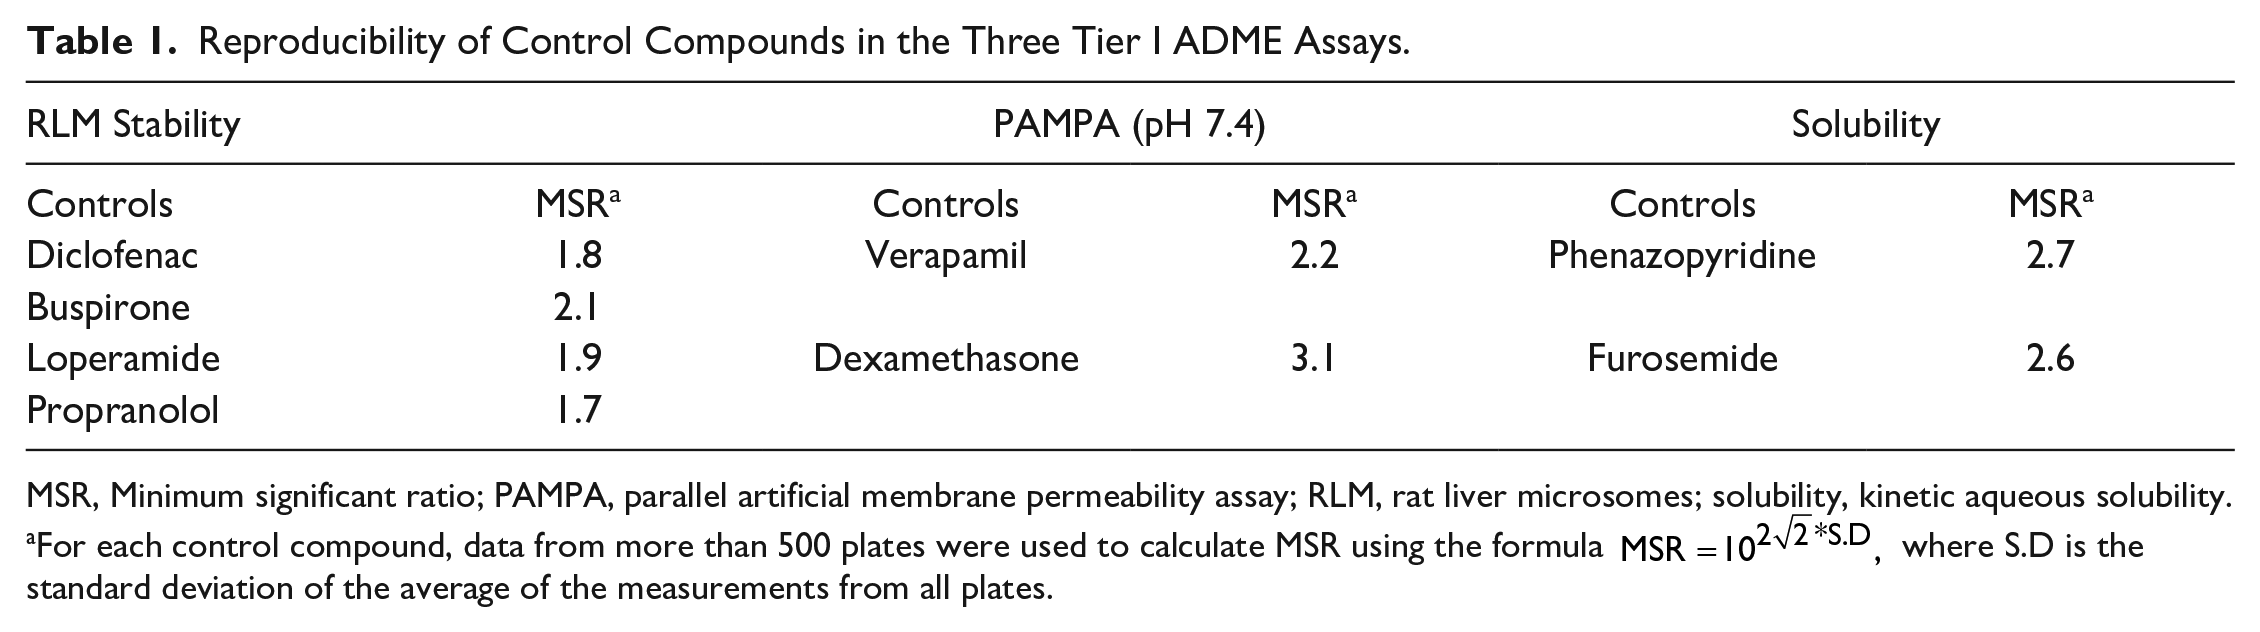
MSR, Minimum significant ratio; PAMPA, parallel artificial membrane permeability assay; RLM, rat liver microsomes; solubility, kinetic aqueous solubility.
For each control compound, data from more than 500 plates were used to calculate MSR using the formula
Cross-Validation (CV) Results
Following a 5-CV scheme, we evaluated both RF and GCNN models for all Tier I assay endpoints (
Results from Fivefold Cross-Validation for Random Forest and Graph Convolutional Neural Network Models.
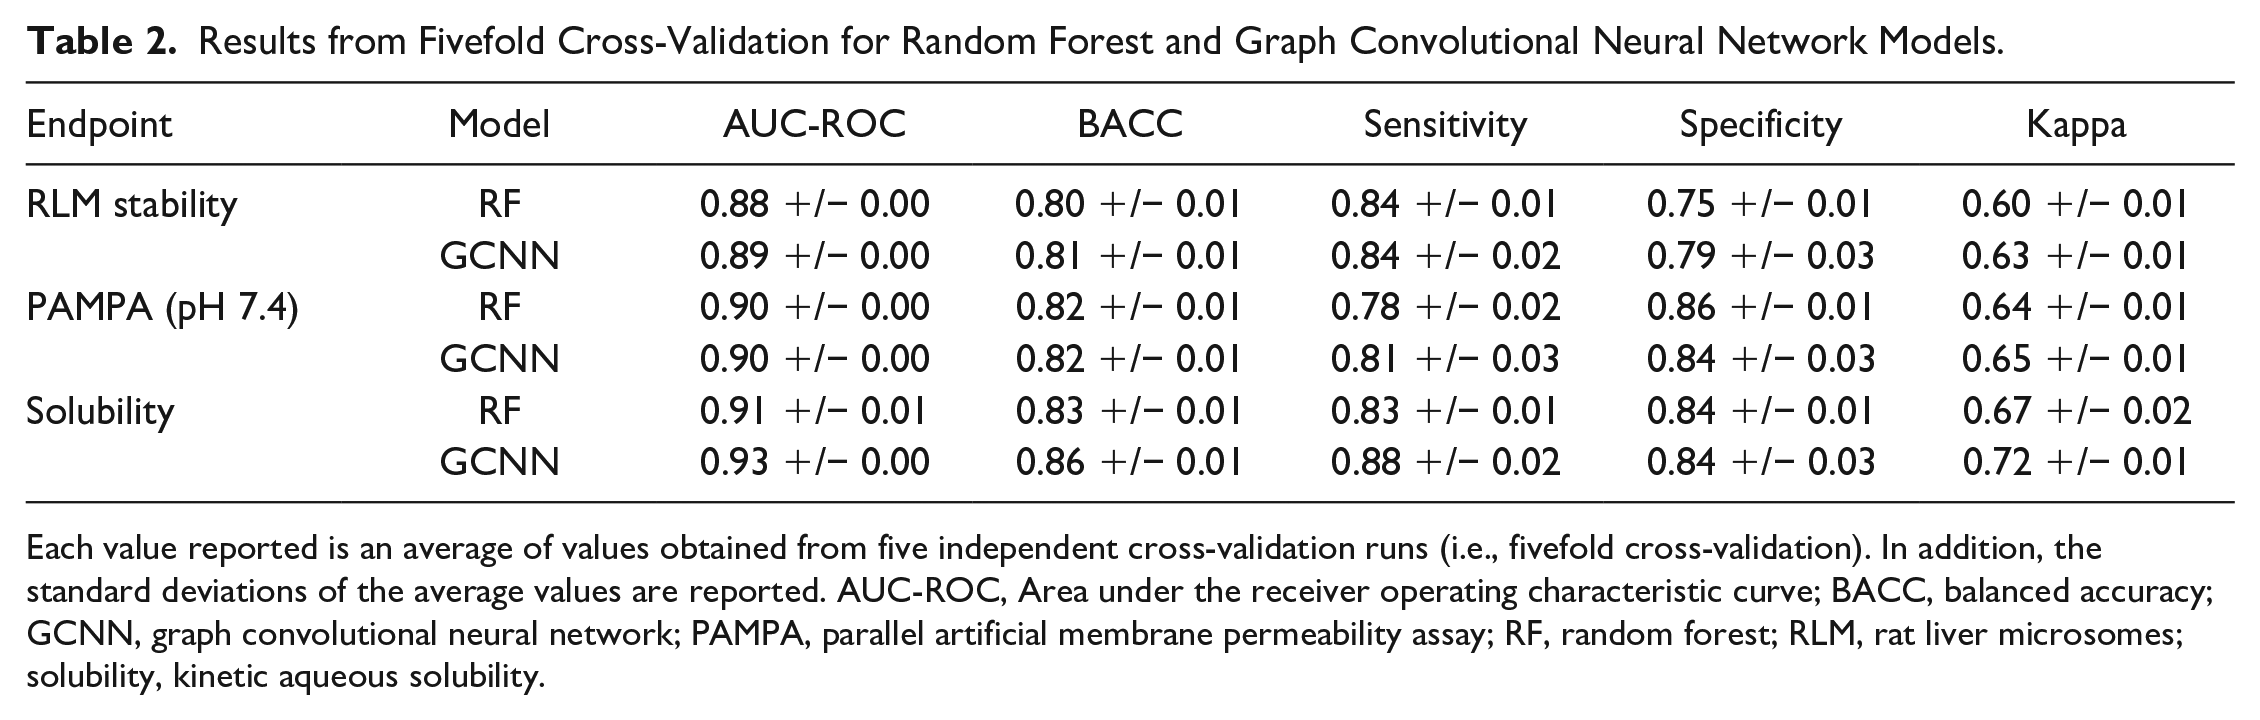
Each value reported is an average of values obtained from five independent cross-validation runs (i.e., fivefold cross-validation). In addition, the standard deviations of the average values are reported. AUC-ROC, Area under the receiver operating characteristic curve; BACC, balanced accuracy; GCNN, graph convolutional neural network; PAMPA, parallel artificial membrane permeability assay; RF, random forest; RLM, rat liver microsomes; solubility, kinetic aqueous solubility.
We also compared the performance of these newer models with our previously published ones ( Table 3 ). Although these models have been developed using different descriptors and larger datasets (especially PAMPA and solubility), the model performances are consistent. Since our previous study on RLM stability was published recently, we did not provide an explicit comparison. It must be noted that the change in the RLM dataset was minimal and the latest GCNN model provided consistent performance. In the case of PAMPA permeability, the dataset used for the previously published classification model consisted of ~2400 compounds, which is nearly sevenfold smaller than the dataset used in the current study. The older solubility dataset was nearly half the current one; however, both datasets were almost perfectly balanced. Finally, it must be noted that performances reported for the latest models are based on 5-CV, unlike previous studies in which the performances reported were based on single random partitioning into training and test datasets. Thus, the comparison must be carefully inferred, which highlights that the current models provide consistent performance over multiple random subsets of the training sets used.
Comparison of Performances of the Latest and Previous Published Prediction Models for PAMPA Permeability and Solubility.
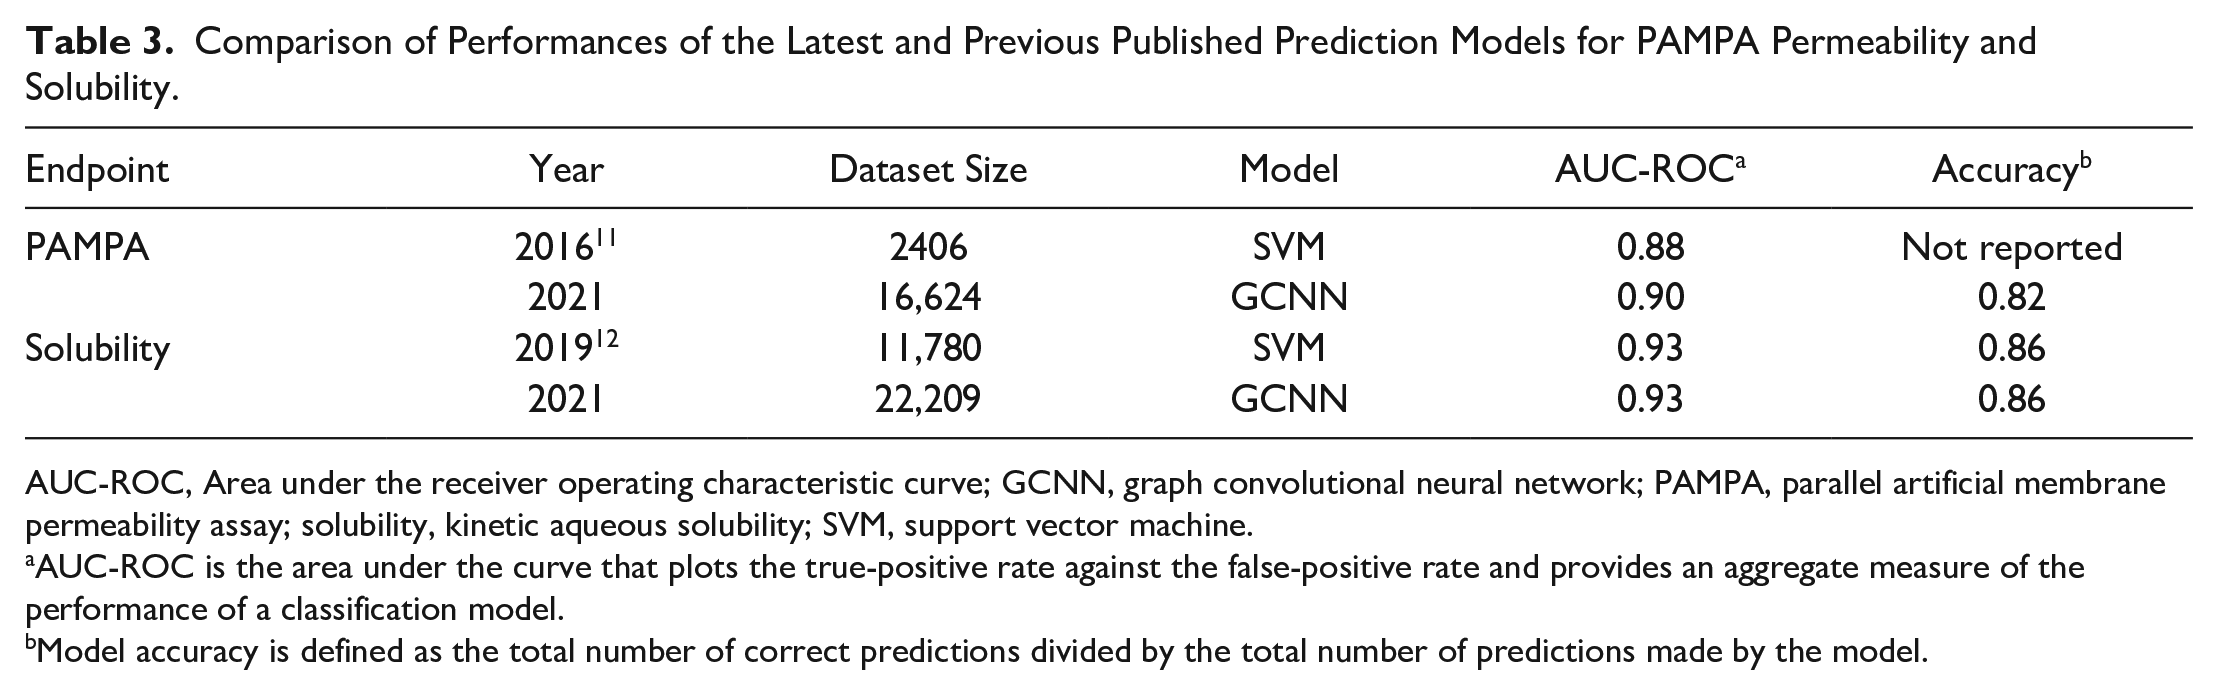
AUC-ROC, Area under the receiver operating characteristic curve; GCNN, graph convolutional neural network; PAMPA, parallel artificial membrane permeability assay; solubility, kinetic aqueous solubility; SVM, support vector machine.
AUC-ROC is the area under the curve that plots the true-positive rate against the false-positive rate and provides an aggregate measure of the performance of a classification model.
Model accuracy is defined as the total number of correct predictions divided by the total number of predictions made by the model.
Performance of RF and GCNN Models on Marketed Drug Test Sets for the Three Tier I Assay Endpoints.
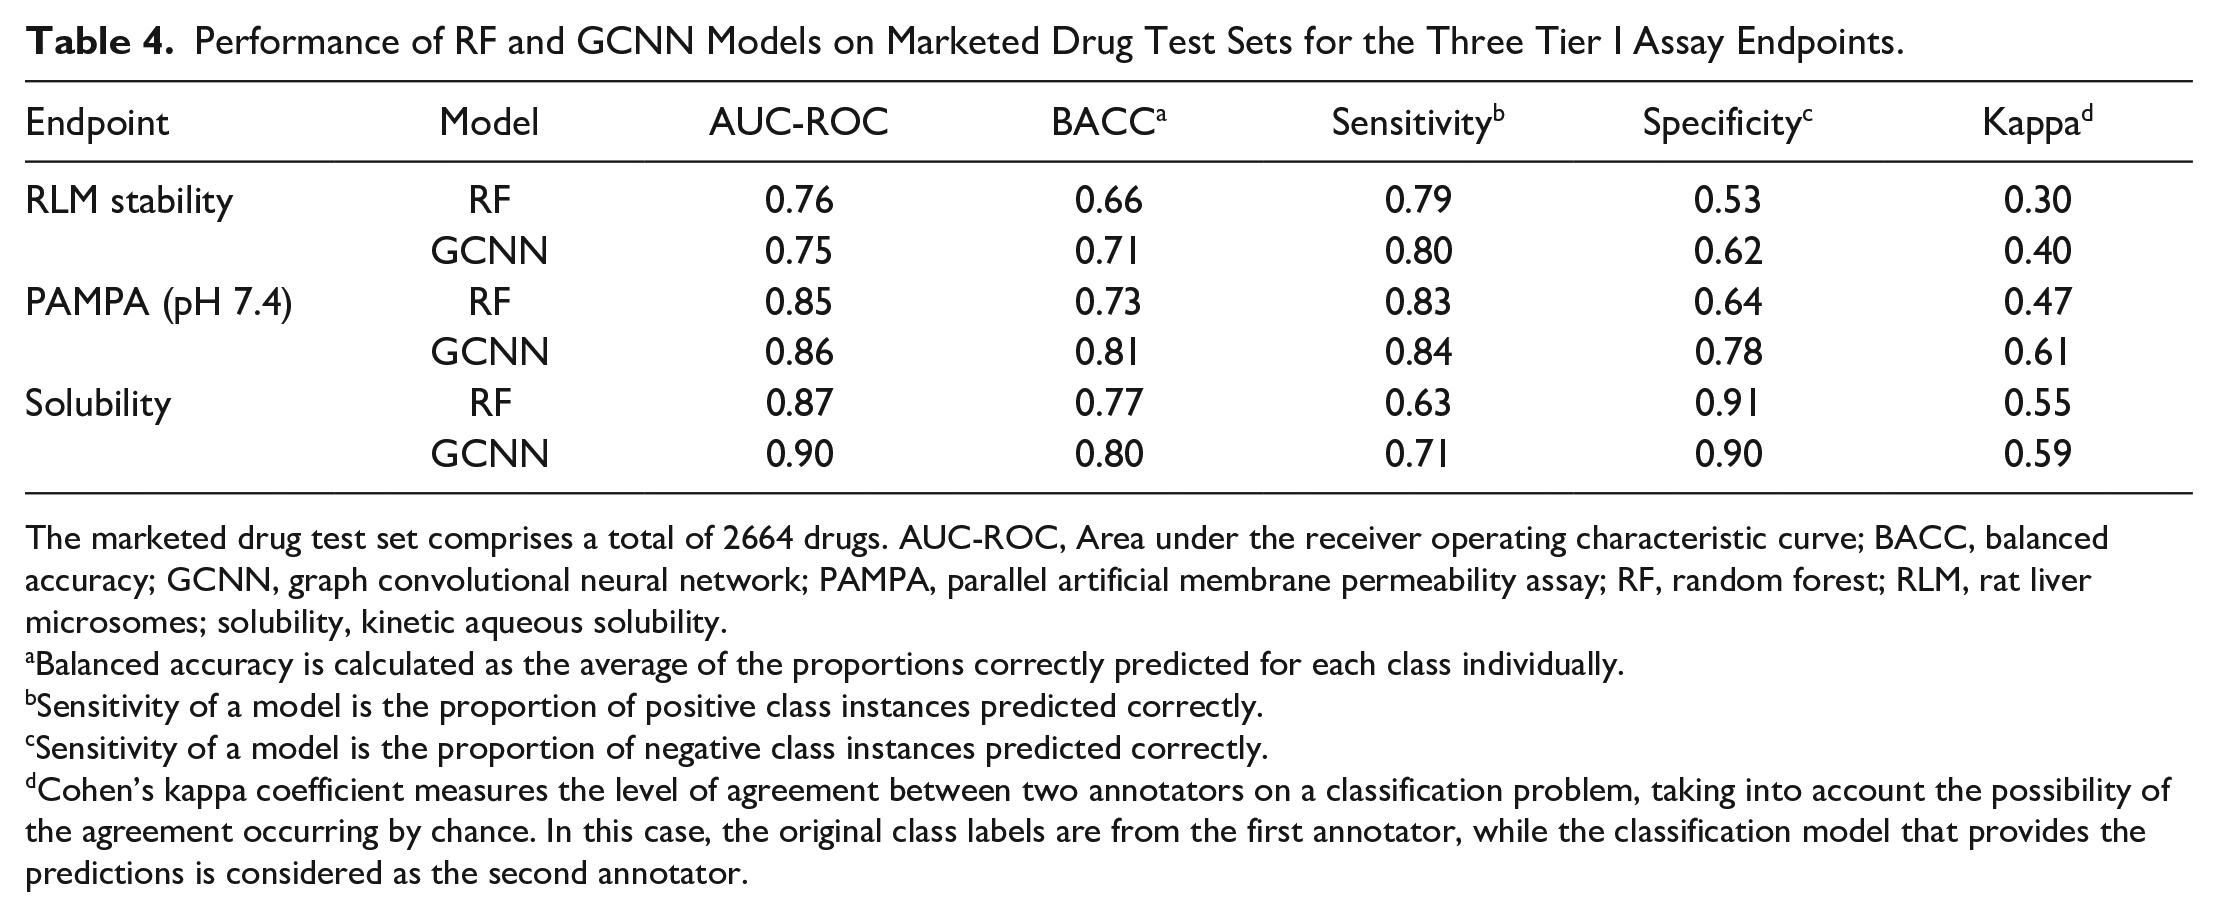
The marketed drug test set comprises a total of 2664 drugs. AUC-ROC, Area under the receiver operating characteristic curve; BACC, balanced accuracy; GCNN, graph convolutional neural network; PAMPA, parallel artificial membrane permeability assay; RF, random forest; RLM, rat liver microsomes; solubility, kinetic aqueous solubility.
Balanced accuracy is calculated as the average of the proportions correctly predicted for each class individually.
Sensitivity of a model is the proportion of positive class instances predicted correctly.
Sensitivity of a model is the proportion of negative class instances predicted correctly.
Cohen’s kappa coefficient measures the level of agreement between two annotators on a classification problem, taking into account the possibility of the agreement occurring by chance. In this case, the original class labels are from the first annotator, while the classification model that provides the predictions is considered as the second annotator.
Comparison to Models from the Literature
While ADME properties for marketed drugs are available in literature, most of these data are compiled, curated, and deposited either into public databases such as PubChem and ChEMBL or into commercial databases that may not be accessible to academic colleagues. Since scientific literature is the primary source for these data, the data are heterogeneous and subject to high variability. Liver microsomal clearance data are also available from ChEMBL, which comprises data for several drugs and drug leads. Most of these data and previously reported prediction models, however, are related to human liver microsomal stability25–29 rather than RLM stability. The importance of RLM data in drug discovery and a comparison of available RLM models in literature were presented in our previous study. 10 In short, the best RLM model 30 from literature provided a BACC of 0.81 and kappa of 0.62. Our previous and latest models provide comparable performance (BACC: 0.81; and kappa: 0.63). It must be noted, however, that although the two models reported in literature are based on large datasets (~27,000 compounds 30 and ~15,000 compounds 28 ), neither are accessible due to their proprietary nature. We have made the RLM model available through the ADME@NCATS portal (https://opendata.ncats.nih.gov/adme/) and also deposited a subset of ~2500 experimental results on PubChem (AID: 1508591).
Only a limited number of studies reported models for PAMPA permeability in literature.31–35 Most studies either use a different kind of assay to measure PAMPA permeability or use small datasets comprising a few hundred compounds. Searching by keyword “PAMPA” resulted in a total of 935 assay records and 1015 measurements on ChEMBL. For instance, Chi et al. 32 used a classical QSAR approach and hierarchical support vector regression on a dataset of ~180 compounds. Oja and Maran were among others who reported regression models using a dataset of 60–80 drugs.34,35 Verma et al., 36 however, used data from PAMPA and a modified PAMPA assay [known as the bio-mimetic artificial membrane permeability assay (BAMPA)] to compare the respective QSAR models with those generated using Caco-2 membrane permeability data. These studies used classical QSAR methods and discussed molecular descriptors and their relevance to the property of interest. Due to multiple reasons, we could not compare our models with the aforementioned studies. The updated PAMPA model (based on ~16,000 compounds) reported in this study as well as the ~2500 subset of PAMPA data we deposited on PubChem (AID: 1508612) will be an excellent resource for the drug discovery community.
Aqueous solubility is an important physicochemical property that influences pharmacokinetic properties of compounds. A number of prediction models have been made available to predict aqueous solubility that include regression, 37 machine learning,38–40 neural networks41–43 and provide excellent performance. A simple search on ChEMBL on February 2, 2021, with the keyword “solubility” resulted in 7546 assay records and a total of 9790 measurements. Perryman et al. 44 collected solubility data from ChEMBL and PubChem databases and proposed Bayesian models to predict aqueous solubility. This PubChem dataset comprised a total of 57,824 compounds, out of which 31,644 compounds (54.7%) were defined as soluble. The best AUC-ROC value (based on 5-CV) reported by this study, based on several versions of the training sets, was 0.94. The models were built using a set of eight numerical descriptors and FCFP6 fingerprints. Our solubility model provided an AUC-ROC of 0.93 and an accuracy of 0.86 using the same threshold of 10 µg/mL to identify poorly soluble compounds. While many other studies reported models for solubility, most of them either use relatively smaller and heterogeneous datasets or report regression models, which make them unable to be compared with our models. The updated solubility model (based on ~22,000 compounds) as well as a ~2500 compound subset of this dataset (PubChem AID: 1645848) have been made publicly available.
Marketed Drug Validation Results
Although the GCNN model demonstrated slightly better performance for solubility and RLM endpoints, the baseline RF model performed competitively. Therefore, both RF and GCNN models were used for evaluation on the test sets. We discovered that the GCNN model outperformed the RF model on these datasets. In the cases of RLM and PAMPA, the BACC values differed by at least 5%, and in both cases, the GCNN models showed higher specificity than RF models. For solubility, the GCNN model showed higher sensitivity than RF. Overall, the differences between the RF and GCNN models were clear when observed through Cohen’s kappa values. In the case of the RLM and PAMPA endpoints, the prediction models provided a sensitivity of at least 80%, indicating that these models are highly sensitive in identifying metabolically unstable and poorly permeable compounds. Both RF and GCNN models provided a specificity of >90% for solubility, but only GCNN provided a sensitivity of 71%, suggesting that these models can better identify high-solubility compounds than poorly soluble compounds.
Serendipitously, the subset of marketed drugs, picked as the validation set in this study, were found to be structurally diverse. The principal component analysis (PCA) plot in
Figure 4A
shows the distribution of compounds in the chemical space of all marketed drugs
14
embedded in two dimensions. The validation compounds are well spread across the space of the complete collection. Furthermore, we also looked into the distribution of marketed drugs with respect to the chemical space of the Tier I dataset. For this analysis, we omitted any marketed drugs that were present in the Tier I datasets. It can be seen in
Figure 4B
that the marketed drugs span the chemical space of Tier I compounds to a large extent in the two-dimensional embedding generated using RDKit descriptors. In
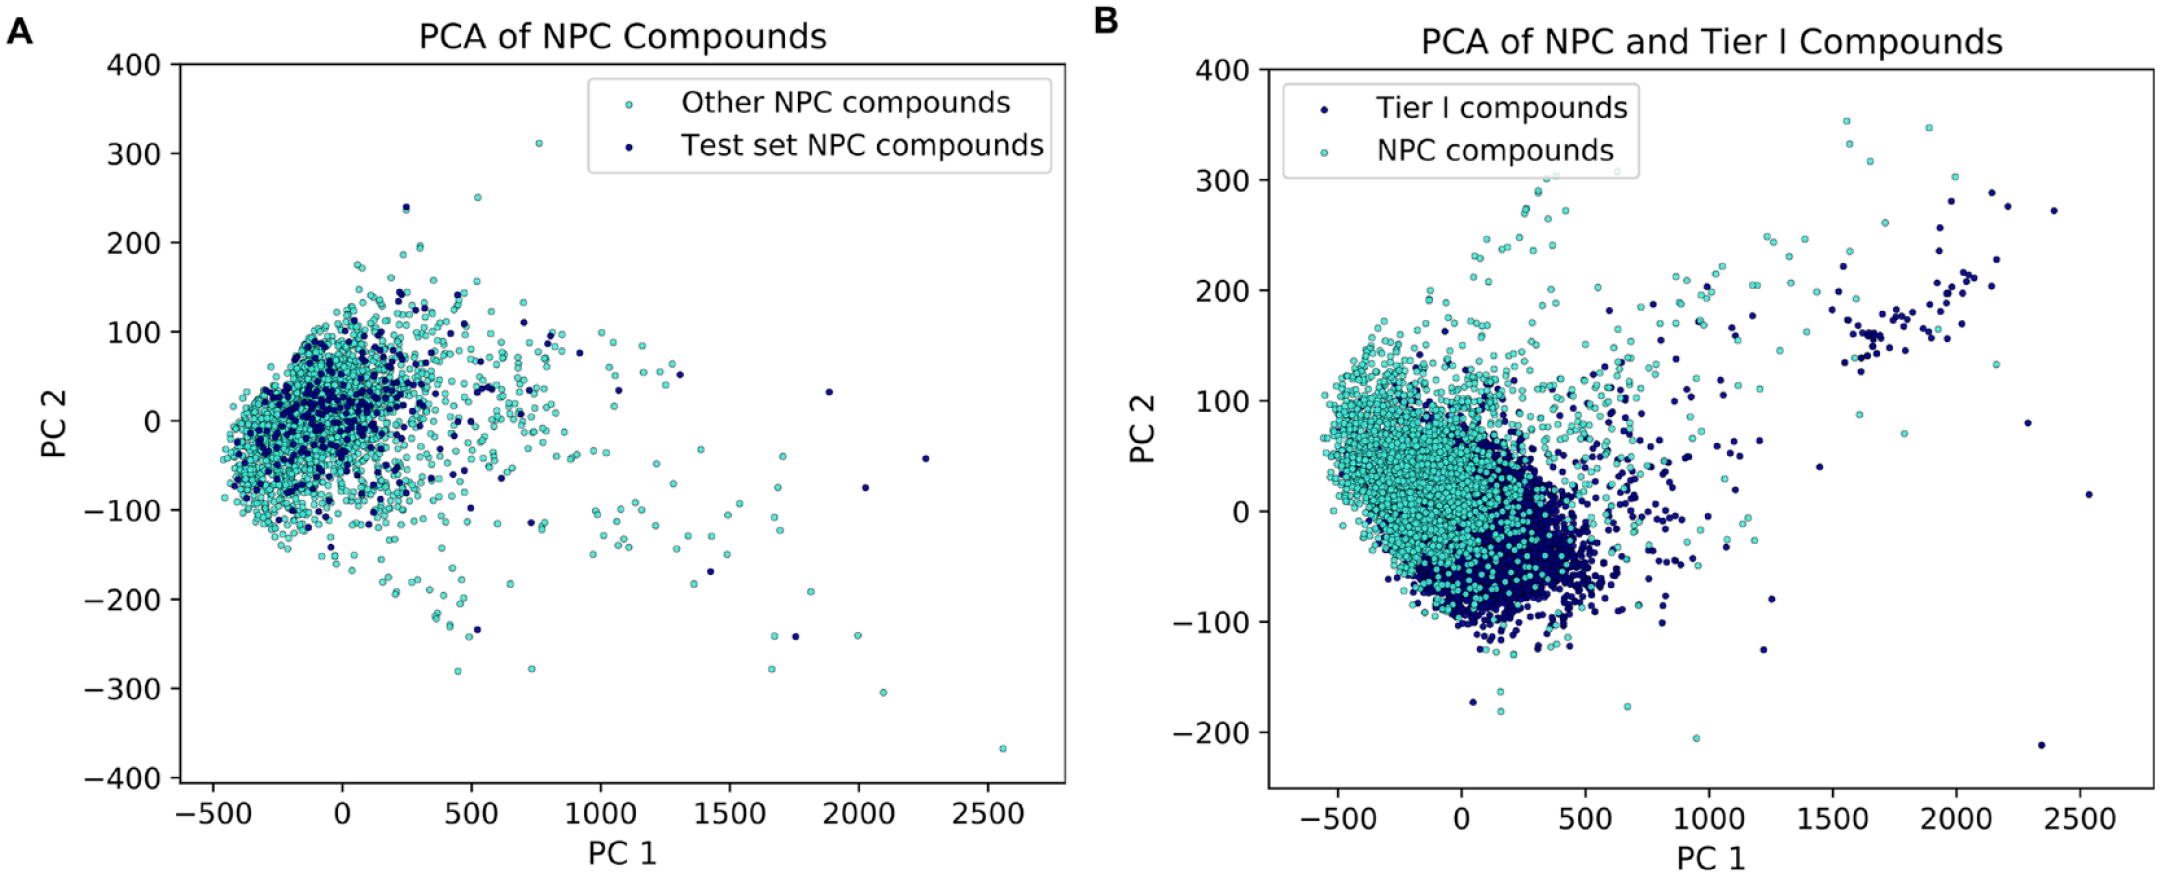
The principal component analysis (PCA) plot for National Center for Advancing Translational Sciences (NCATS) Pharmaceutical Collection (NPC) compounds and Tier I compounds generated using RDKit descriptors. (
Prediction Results for Complete NPC Dataset
Since the idea of the study is to provide a one-stop ADME resource for marketed drugs that is routinely used in drug-repurposing campaigns, we used the best models to predict RLM, PAMPA, and solubility profiles for the complete set of ~2650 NPC compounds. While nearly half of the NPC compounds were predicted to have unstable RLM profiles, 40% of the compounds were predicted to have high PAMPA permeability, and 80% of compounds were predicted to be highly soluble. The predictions are available in Supplementary Material S2.
Availability of Data and Models
In our previous work, we disseminated the RLM stability dataset and prediction models through the ADME@NCATS portal (https://opendata.ncats.nih.gov/adme/). In this study, we developed a newer version of the RLM model based on an updated dataset. Together with the newer RLM models, both PAMPA and solubility models have been made available on this portal. We also provide the prediction results for the NPC library on this portal. The website simply takes SMILES (simplified molecular-input line-entry system) as compound input and returns prediction probabilities and prediction outcomes. Currently, we provide only GCNN models on the website.
Significance of Profiling ADME Data for Repurposing
In recent times, drug repurposing has risen as a promising foil to the traditional drug development process. Drug repurposing, on average, takes 6 years and costs US$300 million, 45 which makes it significantly faster and more cost-effective compared to traditional drug development. The rate of market approval for repurposed drugs is ~3× higher than that of traditionally developed investigational new drugs. 46 This approach can be extremely beneficial, especially when dealing with an epidemic such as severe acute respiratory syndrome coronavirus 2 (SARS-CoV-2), when rapid action is imperative. To this end, scientists at NCATS assembled the NCATS Pharmaceutical Collection library, which is a comprehensive, nonredundant list of ~2650 approved and investigational drugs for HTS. Throughout the past 10 years, researchers at NCATS have screened this repurposing library >200 times as part of various collaborations. Drug leads for >25 diseases have been identified with these screens, and four of these drugs have progressed into clinical trials. 14 In addition, quantitative HTS (qHTS) data generated from screening the library are being deposited into PubChem to provide a community resource and encourage the scientific community to develop predictive models.
ADME studies are critical to the success of a project, as evidenced by the significantly reduced attrition of drugs after including ADME studies in early drug discovery. Even though drug repurposing involves the use of already approved drugs, ADME properties require thorough consideration since the intended indication is different. For instance, albendazole, a drug with low solubility and poor bioavailability, 47 may not be an ideal candidate for an indication that requires high circulating concentrations; similarly, a drug with no or low brain penetration would not work for an indication where brain is the target organ.
Several public and commercial databases provide a range of predicted molecular and ADME properties based on models developed using either publicly available or proprietary data. No single resource in the public domain, however, provides data necessary to establish the Tier I profile for ADME characterization. For example, DrugBank 48 provides predictions for aqueous solubility 49 but does not provide predictions for PAMPA permeability or RLM stability. While a few previous studies reported models based on RLM data,28,30 these were built using proprietary data that have not been made available in the public domain. Moreover, existing ADME models in the literature are based on machine learning methods such as support vector machines, Bayesian modeling, random forest, and other classical approaches. Recent developments such as deep neural networks and graph convolutional networks have not been extensively explored within the ADME domain. Thus, our models based on GCNNs, and previously reported RLM models based on deep neural networks and recurrent neural networks, indicate that we have swiftly adapted the latest technologies to develop better prediction models. Furthermore, these models directly operate on molecular graphs and eliminate the need to calculate molecular features for model development.
In summary, we used QSAR modeling to develop prediction models using our high-quality Tier I ADME datasets comprising more than 20,000 compounds and validated these predictive results for a set of marketed drugs. Validation results revealed excellent accuracy values for solubility and PAMPA (>80%) and decent accuracy for RLM (>70%). While our ultimate goal is to experimentally characterize several ADME properties for the entire NPC library and consolidate these data into a central, publicly accessible website (https://opendata.ncats.nih.gov/adme/), these predictions serve as a great starting point for researchers at NCATS as well as the greater drug discovery community.
Supplemental Material
sj-pdf-1-jbx-10.1177_24725552211017520 – Supplemental material for Validating ADME QSAR Models Using Marketed Drugs
Supplemental material, sj-pdf-1-jbx-10.1177_24725552211017520 for Validating ADME QSAR Models Using Marketed Drugs by Vishal Siramshetty, Jordan Williams, Ðắc-Trung Nguyễn, Jorge Neyra, Noel Southall, Ewy Mathé, Xin Xu and Pranav Shah in SLAS Discovery
Research Data
sj-xls-2-jbx-10.1177_24725552211017520 for Validating ADME QSAR Models Using Marketed Drugs
sj-xls-2-jbx-10.1177_24725552211017520 for Validating ADME QSAR Models Using Marketed Drugs by Vishal Siramshetty, Jordan Williams, Ðắc-Trung Nguyễn, Jorge Neyra, Noel Southall, Ewy Mathé, Xin Xu and Pranav Shah in SLAS Discovery
Footnotes
Acknowledgements
The authors thank NCATS Compound Management, especially Paul Shinn and Misha Itkin, for their support.
Supplemental material is available online with this article.
Declaration of Conflicting Interests
The authors declared no potential conflicts of interest with respect to the research, authorship, and/or publication of this article.
Funding
The authors disclosed receipt of the following financial support for the research, authorship, and/or publication of this article: This research was supported by the Intramural Research Program of the National Institutes of Health, National Center for Advancing Translational Sciences.
References
Supplementary Material
Please find the following supplemental material available below.
For Open Access articles published under a Creative Commons License, all supplemental material carries the same license as the article it is associated with.
For non-Open Access articles published, all supplemental material carries a non-exclusive license, and permission requests for re-use of supplemental material or any part of supplemental material shall be sent directly to the copyright owner as specified in the copyright notice associated with the article.