
Abstract
The ability to detect and characterize drug binding to a target protein is of high priority in drug discovery research. However, there are inherent challenges when the target of interest is an integral membrane protein (IMP). Assuming successful purification of the IMP, traditional approaches for measuring binding such as surface plasmon resonance (SPR) and fluorescence resonance energy transfer (FRET) have been proven valuable. However, the mass dependence of SPR signals may preclude the detection of binding events when the ligand has a significantly smaller mass than the target protein. In FRET-based experiments, protein labeling through modification may inadvertently alter protein dynamics. Graphene Bio-Electronic Sensing Technology (GBEST) aims to overcome these challenges. Label-free characterization takes place in a microfluidic chamber wherein a fluid lipid membrane is reconstituted directly above the GBEST sensor surface. By leveraging the high conductivity, sensitivity, and electrical properties of monolayer graphene, minute changes in electrostatic charges arising from the binding and unbinding of a ligand to a native IMP target can be detected in real time and in a mass-independent manner. Using crude membrane fractions prepared from cells overexpressing monocarboxylate transporter 1 (MCT1), we demonstrate the ability to (1) form a fluid lipid bilayer enriched with MCT1 directly on top of the GBEST sensor and (2) obtain kinetic binding data for an anti-MCT1 antibody. Further development of this novel technology will enable characterization of target engagement by both low- and high-molecular-weight drug candidates to native IMP targets in a physiologically relevant membrane environment.
Keywords
Introduction
The ability to characterize drug binding to protein targets is essential and a high priority in all drug discovery efforts. Although this can be readily accomplished for soluble proteins such as enzymes, major challenges persist when (1) the protein, such as a receptor, ion channel, or transporter, is embedded in the cell membrane (integral membrane protein [IMP]) and/or (2) the protein is structurally unstable when purified. Although IMPs represent over 40% of all drug targets, 1 the development of therapeutic molecules targeting IMPs is significantly hampered by the lack of appropriate tools to characterize the binding of drug candidates, particularly when the goal is to obtain label-free binding affinity and kinetic data.
Current label-free kinetic binding technologies such as surface plasmon resonance (SPR) and bilayer interferometry (BLI) require a purified protein to be immobilized covalently on the surface of a sensor. Most purified IMPs are unstable outside cellular membranes, so it is often necessary to introduce mutations to stabilize the protein in order to enable structural and biophysical studies.2,3 This approach is costly and can take several years of development per protein target. Examples of success with IMPs have been very limited, perhaps with the notable exception of G-protein-coupled receptors.4,5 Furthermore, when an IMP is successfully stabilized with mutations, data obtained may not be biologically relevant and therefore could introduce an increased risk to drug discovery and development programs.
We describe the early development of an emerging technology capable of measuring the label-free kinetic binding of drugs to wild-type IMPs in the context of native cell membranes. Graphene Bio-Electronic Sensing Technology (GBEST) enables real-time characterization of drug binding by measuring changes in current resulting from changes in electrostatic potential near a graphene sheet spanning two electrodes. Importantly, neither IMP purification nor covalent immobilization on the sensor is required. Instead, a continuous cell membrane containing the wild-type IMP is reconstituted above the GBEST sensor and used for direct kinetic binding characterization of unlabeled drug candidates. Given the very limited success with the purification and crystallization of solute transporters and their emerging relevance for therapeutic development, 6 we selected MCT1 as a model for this case study. Our initial findings and the potential of GBEST technology are discussed.
Materials and Methods
System Components
NE-1000 syringe pumps were from New Era Pump Systems (Farmingdale, NY). RE-6 Ag/AgCl reference gate electrodes MW-2030 were from BASi Corporation (West Lafayette, IN). Keithley Series 2600A source-meters were from Keithley Instruments/Tektronix (Beaverton OR). Real-time data acquisition was performed with LabView software (National Instruments, Austin, TX) configured to read up to four channels. We typically operated two to four flow cells in parallel, with controls and experimental samples running on separate flow cells.
Quality Control of GBEST Sensors
The fabrication process of GBEST sensors is described in the Supplemental Material, including relevant fabrication steps and protocols published elsewhere.7–10 In this section, we describe steps that were implemented to obtain a basic level of quality control. Raman spectroscopy (RM) was used extensively at both the wafer scale (upstream processing) and chip scale (downstream processing) to validate each process step and as the main method to sort sensors. RM was used to ensure that graphene sheets in the sensors were not being damaged or doped by the microfabrication process. Quality-controlled sensors had to meet a 2D/G peak ratio criteria of 1.5 or greater. Subsequently, electron mobility was added as a quality control metric. 11
In order to create a hydrophilic surface compatible with reconstitution of continuous lipid bilayers directly above the GBEST sensor surface, GBEST sensors were treated with a mild oxygen (O2) plasma for 30 s in an electron-free configuration in a G500 plasma reactor (Yield Engineering Systems, Fremont, CA). Contact angle measurements and RM were performed before and after plasma treatment to ensure that the graphene surface was not damaged.
Cell Lines and Native Cell Membrane Preparation
An Sf9 insect cell line overexpressing human MCT1 (MCT1-Sf9) and the parental Sf9 cell line were used to prepare crude cell membranes by standard methods. Briefly, cell pellets were resuspended in lysis buffer (50 mM Tris, pH 7.4, 150 mM NaCl, 1% Sigma Protease Inhibitor Cocktail) using 30 mL of lysis buffer per 1 L of cell culture. The lysed cells were passed through a microfluidizer at >10,000 psi twice and centrifuged at 15,000g for 15 min. The supernatant was then centrifuged at 180,000g for 90 min to generate crude membrane pellets. Crude membrane pellets equivalent to 1 L of cell culture were homogenized in 15 mL of 20 mM Tris, pH 7.4, 150 mM NaCl, and centrifuged at 125,000g for 30 min. The supernatant was discarded and crude membrane pellets were flash frozen and stored at −80 °C. Typical cell membrane preparations contained total protein at 10–15 mg/mL. Cell membrane preparations were prepared by Amgen, Inc. and provided to Nanotech Biomachines for experimental work.
Preparation of Lipids and Membrane Vesicles
In order to achieve reconstitution of continuous membranes on the surface of GBEST sensors, we used a combination of native cell membrane vesicles (NMVs) and small unilamellar vesicles (SUVs) prepared from commercial synthetic lipids. A complete list of lipids used is included in the Supplemental Material.
SUVs were prepared with a variation of previously published methods. 12 Briefly, lipids were mixed at the desired mole percent (Mol%) ratios in chloroform and dried under liquid nitrogen flow in a round-bottom flask before being further dried for 30 min under vacuum. The dry lipids were resuspended to 2 mg/mL in phosphate-buffered saline (PBS) buffer by vortexing. Finally, the dispersed lipids were extruded 10–20 times through a 30 nm polycarbonate membrane and stored at 4 °C for up to 2 weeks. Simple SUV compositions typically contained 0.5 Mol% PEG3K-DPPE, 0.5 Mol% TR-DHPE, and 99 Mol% POPC. Complex SUV compositions contained 36.55 Mol% POPC, 34.2 Mol% POPE, 5.7 Mol% PSM, 22.8 Mol% cholesterol, 0.5 Mol% PEG3K-DPPE, and 0.25 Mol% TR-DHPE. All synthetic lipids, extruder, and polycarbonate membranes were purchased from Avanti Polar Lipids, Inc. (Alabaster, AL).
NMVs were prepared by extrusion of crude membrane preparations as follows: 100 µL of pelleted cell membranes were resuspended in 1 mL of PBS buffer and passed five times through increasing gauged syringe needles (22G, 27¼G, and 30½G). This mixture was transferred to a 15 mL conical tube and resuspended in a total of 4 mL of PBS buffer. One-milliliter portions were then each extruded 17 times through 400 nm followed by 100 nm polycarbonate membranes. The resulting NMVs typically contained 0.1–0.3 mg/mL protein and were stored at 4 °C.
Membrane Reconstitution on GBEST Sensors
A typical membrane reconstitution protocol on the GBEST system was performed as follows: (1) The sensor signal was equilibrated under flow to achieve a stable baseline with diluted PBS (dPBS) and electrically verified using the Keithley source-meter. (2) PBS buffer was flowed for 10 min. (3) NMVs (10–30 µg/mL in PBS buffer) were flowed for 5 min before the flow was stopped for 20 min to allow NMVs to adsorb to the sensor surface. (4) Flow was resumed with SUVs at 0.6 mg/mL in PBS with 25 mM EDTA. After 5 min, the flow was stopped for 60 min to allow vesicle fusion and formation of the continuous membrane. (5) Flow was restarted with PBS for 5 min, followed by dPBS for 20 min or until a stable baseline was achieved. The flow rate in all steps was 25 µL/min, unless otherwise noted.
Running Buffer and Sample Matching
Because the GBEST sensor is highly sensitive to electrical charges, it was essential that running buffers and samples were matched for ionic strength. PBS buffer (1×) has a conductivity of 15.05 mS. dPBS was prepared by dilution of PBS to achieve a conductivity of 385 µS (2.1%). All experimental samples were prepared in dPBS, and conductivity was measured with a Jenway conductivity meter (Staffordshire, UK) equipped with a microvolume probe. If needed, samples were adjusted to 380–390 µS to match dPBS running buffer.
Fluorescence Recovery after Photobleaching
Fluorescence recovery after photobleaching (FRAP) was used to characterize the proper assembly and diffusivity of reconstituted membranes on glass slides and GBEST sensor chips. For this purpose, a custom graphene test structure (40 × 40 µm with a circular hole 15 µm in diameter) was designed. This graphene test structure was located 1 mm away from the GBEST sensors. Briefly, a ~50 µm spot was photobleached directly on the graphene test structure using high-intensity light and the recovery of fluorescence in the photobleached circular hole inside the structure was recorded as a function of time. The fluorescence recovery curve was then fitted with the diffusion equation to obtain the diffusion coefficient. 13 Instrumentation and additional protocol steps are described in the Supplemental Material.
Results and Discussion
GBEST System
We designed the GBEST instrument to operate as a microfluidic system with continuous flow delivery of reagents and samples over a graphene sensor connected electrically to a source-meter. A schematic of this setup is shown in Figure 1A . Flow rates were controlled by a syringe pump equipped with a 10 mL Hamilton syringe and running in withdraw mode. Samples and reagents were introduced through a sipper. A custom-built micromachined flow cell was used. This consisted of a circular chamber 1.5 mm in diameter within which two active GBEST sensors were sealed with a silicone gasket placed against the silicon chip ( Fig. 1B ). Sensors 2 and 3 have active graphene sensing areas of 40 × 40 µm and 40 × 80 µm, respectively ( Fig. 1C ). Only sensors 2 and 3 were electrically connected to the Keithley source-meter for binding measurements. A Ag/AgCl reference gate electrode was placed downstream from the silicon chip to complete the circuit and optimize measurements.
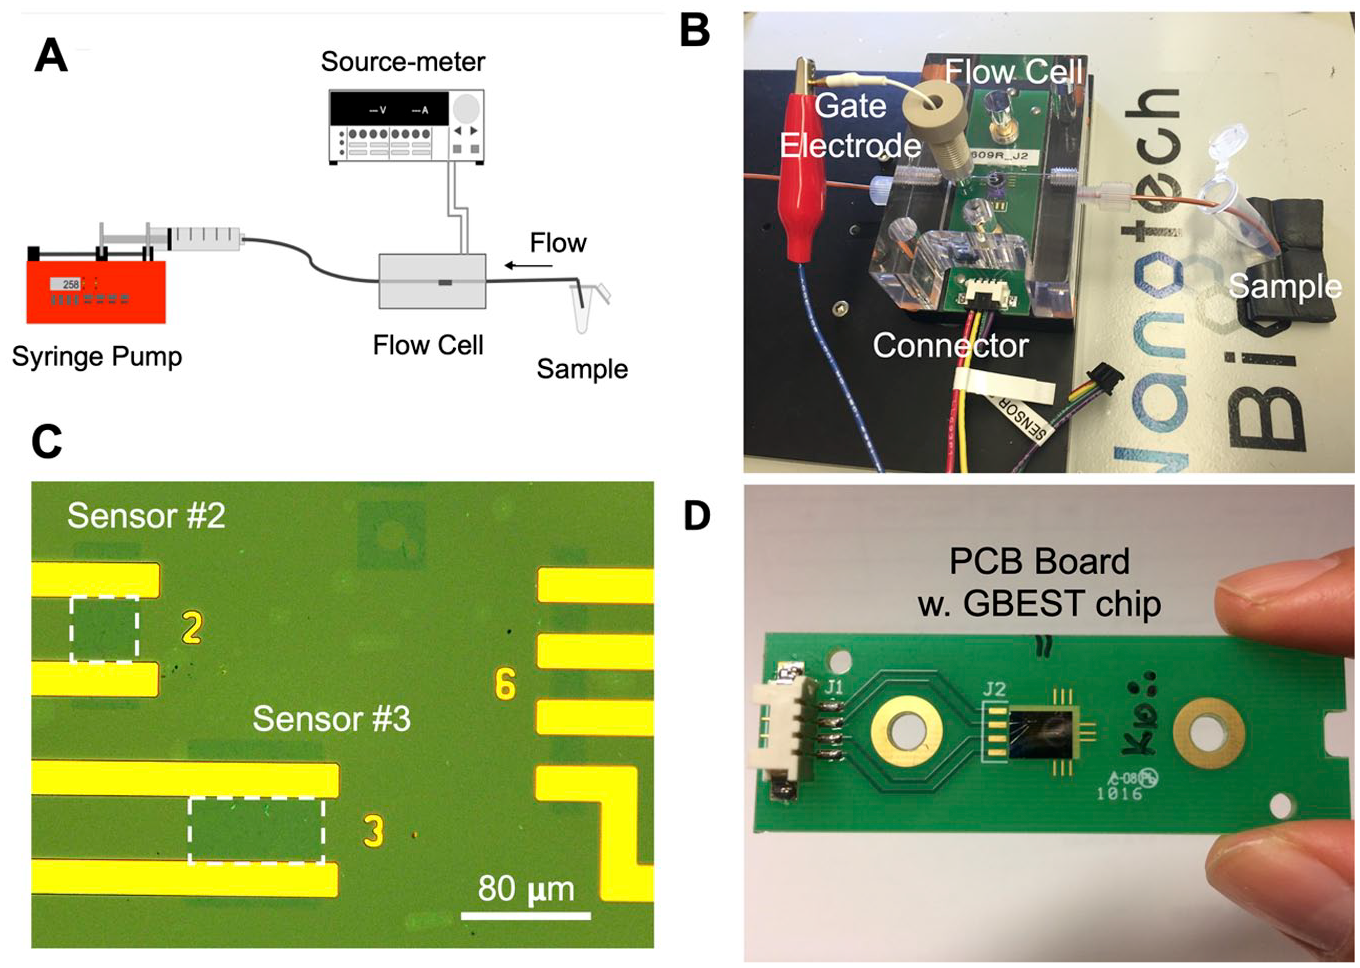
Key components of the system. (
An example of a silicon chip with graphene sensors mounted on a 3- by 1-inch printed circuit board (PCB) board is shown in Figure 1D . The source and drain electrodes for both sensors 2 and 3 were wire bonded to electrical pads on the PCB connected to a source-meter. Real-time data acquisition was performed with LabView software (National Instruments) configured to read up to four channels (flow cells). We typically operated between two and four flow cells in parallel such that control and experimental samples were running on separate flow cells.
GBEST Sensor Fabrication
The GBEST sensors were fabricated on silicon wafers. Detailed sensor fabrication methods and steps are described in the Supplemental Material. Briefly, Ti/Au electrodes were patterned on a 6-inch silicon wafer with 300 nm SiO2. A 4-inch graphene monolayer was then transferred onto the electron wafer, followed by patterning of the graphene to form individual sensors on top of the electrodes. Finally, the wafer was coated with a 3 nm layer of Si under vacuum, which converted to SiO2 upon exposure to air. The thin layer of SiO2 provides a hydrophilic surface required to make graphene sensors compatible with membrane reconstitution. However, it is critical to keep the thickness of this SiO2 layer below 4 nm to avoid interfering with graphene’s electron mobility, which is a key material property to obtain high electrostatic sensitivity. 10
Qualified wafers were cut into individual chips (8 × 6 mm) containing two active GBEST sensors each and stored in chip trays that were sealed under vacuum. When needed for experimentation, chips were treated with a mild 30 s O2 plasma cycle before being mounted on PCBs, at which point they were stored for up to 1 week before use in experiments. The O2 plasma treatment is critical to ensure a hydrophilic surface compatible with membrane reconstitution; however, it is well known that plasma-treated SiO2 surfaces are susceptible to air contaminants over time. Although we did not perform extensive chip storage optimization and half-life studies at this early stage of development, we observed better membrane reconstitution and signal-to-noise ratio (SNR) when GBEST sensors were used in binding experiments within 24 h of applying the O2 plasma treatment. This underscores the need for future optimization studies of storage conditions.
Furthermore, because it was necessary to keep the SiO2 thickness at only 3–4 nm to obtain a hydrophilic surface for membrane reconstitution while protecting the graphene surface and harnessing its high electron mobility for molecular detection, this final step of preparation necessitated significant use of atomic force microscopy (AFM).
Fabrication Facilities and Quality Control
Sensor fabrication was performed at Marvell Nanofabrication Laboratory (UC Berkeley, CA), a well-equipped academic setting with shared resources. This environment is cost-effective for the initial development of fabrication methods. However, the shared nature of resources is a challenge for attaining high reproducibility of processes since tools often exhibit variable performance and cross-contamination. Nevertheless, we established quality control tests for various steps of fabrication using AFM, RM, optical microscopy, contact angle measurements, and electron mobility measurements, among others.
Our preliminary results demonstrate that GBEST can achieve adequate reproducibility within a single wafer. However, we observed high batch-to-batch wafer variability in electrical performance, electron mobility, SNR, and the ability to support the formation of stable colloid supported lipid bilayers (cSLBs). Wafer-to-wafer consistency can be greatly improved by transferring the end-to-end process to an industrial fabrication facility, where critical reactors, equipment, and processes can be strictly controlled to eliminate the risk of cross-contamination. In addition, multiple quality control steps can be implemented to reduce variability and eliminate sources of contamination. Future development plans shall prioritize the transfer of this process to a strictly controlled commercial fabrication facility.
Sensor Signal Optimization: Electrical Drift and SNR
GBEST sensors belong to the field-effect transistor (FET) class of biosensors and are prone to electrical drift, an artifact manifested as a linear change in current as a function of time during experiments under microfluidic flow. During early stages of developing the fabrication process, we observed that improving electrical contact between the Ti/Au metal electrodes and the graphene monolayer reduced this electrical drift and significantly improved overall SNR. We improved electrical contact and linearity of electrical drift by transferring the graphene monolayer onto already patterned and cleaned electrode wafers.
Therefore, patterning the graphene monolayer became the second-to-last step of sensor fabrication. This is in contrast to the standard process used by academic and industrial labs, which involves first transferring the graphene, followed by depositing and patterning the metal electrodes. 10 Furthermore, by moving the graphene transfer step downstream in the sensor fabrication process, the delicate graphene monolayer was protected from additional damage during processing and from coming into contact with additional chemicals (e.g., photoresist). As a byproduct of this change, we observed that current-voltage (I-V) characteristics of the sensors also improved. It became routine to work with GBEST sensors showing an electrical drift of about 5 nA/min.
In addition to the optimization steps taken during sensor fabrication, SNR and electrical drift were further improved by optimizing source-to-drain voltage (Vsd) and gate voltage (Vg), which are critical settings for FET-type biosensors.
9
A description of Vsd and Vg optimization is provided in the Supplemental Material (
MCT1 Model System
Monocarboxylate transporters (MCTs) are IMPs that play important roles in cell metabolism and are being studied as oncology therapeutic targets.14,15 One such transporter, human MCT1, is a member of the solute carrier (SLC) class of membrane transport proteins that is encoded by the SLC16A1 gene. MCT1 has been demonstrated to bind both antibody and small-molecule ligands that are readily available. These factors make MCT1 an ideal model system to test GBEST technology. Below, we present the initial results for binding of the anti-MCT1 antibody 6C6 to MCT1 in membranes reconstituted on a GBEST sensor. Membranes from MCT1-Sf9 cells were used to prepare NMVs for membrane reconstitution. Membranes from the parental Sf9 cell without MCT1 expression were used as a negative control.
Reconstitution of Fluid Membranes on GBEST Sensors
To achieve our goal, it was critical to form and reconstitute a fluid membrane above the GBEST sensor surface. Furthermore, it was necessary to do this in such a way that IMPs are free to diffuse in the plane of the membrane. Methods for reconstitution of membranes using a combination of cell-derived NMVs and SUVs have been previously described.16,17 Cell-derived NMVs provide all the native components of the cell membrane, including the IMP target of interest, whereas SUVs induce vesicle fusion to form continuous lipid bilayers. Importantly, the inclusion of a small percentage of lipids containing PEG (PEG3K-DPPE) to form cSUVs leads to the formation of cSLB,16,18 whereby the PEG moieties create a cushion that separates the lipid bilayer from the sensor surface. This provides a space to accommodate the extra- and intracellular domains of IMPs and to allow the IMPs to diffuse freely in the plane of the membrane without interference from the surface of the sensor (
Membranes were reconstituted using NMVs derived from MCT1-Sf9 cells and cSUVs containing 0.5 Mol% PEG3K-DPPE and 0.5 Mol% TR-DPPE as a fluorescent trace for lipid fluidity measurements. Briefly, a typical membrane reconstitution was performed as follows: (1) NMVs were flowed and allowed to adsorb onto the surface of the GBEST sensor. (2) cSUVs were flowed to induce vesicle fusion and form a continuous cSLB membrane (see Materials and Methods section).
We used FRAP to measure the diffusivity of TR-DPPE lipids in reconstituted membranes containing MCT1.
Furthermore, to measure the diffusivity of membrane-bound MCT1 protein in the reconstituted membrane, we performed a FRAP experiment using an Alexa-647-labeled 6C6 anti-MCT1 antibody. First, we verified the specificity of the A647-6C6 antibody for MCT1 by direct fluorescence imaging after binding of the antibody. FRAP measurements demonstrated a diffusivity of 0.59 µm2/s for membrane-bound MCT1, as measured by the fluorescence of A647-6C6 (
Stability of Reconstituted Membranes under Flow
In order to optimize the stability of reconstituted membranes under flow in the GBEST system, we explored optimizing the composition of cSUVs. To measure the stability of reconstituted membranes, we performed multiple binding cycles on the GBEST system over a period of time. Subsequently, we removed the chips from the instrument and verified the integrity and fluidity of the membrane by fluorescent microscopy and FRAP.
We observed that MCT1-Sf9 membranes reconstituted with a simple cSUV lipid composition (99 Mol% POPC, 0.5 Mol% PEG3K-DPPE, 0.5 Mol% TR-DPPE) were stable under flow in the GBEST system for approximately 4 h. However, the membranes became unstable after only two binding cycles. In contrast, use of a complex cSUV lipid mixture that more closely resembles a native cell membrane (36.55 Mol% POPC, 34.2 Mol% POPE, 5.7 Mol% PSM, 22.8 Mol% cholesterol, 0.5 Mol% PEG3K-DPPE, 0.25 Mol% TR-DPPE) yielded reconstituted MCT1-Sf9 and Sf9 membranes that were stable for more than 8 h and amenable to at least 10 binding cycles. All binding experiments discussed in the following sections were performed using the complex cSUV lipid mixture to promote greater stability of the reconstituted membranes.
Real-Time Measurement of 6C6 Binding to MCT1 in a Fluid Membrane
To test the binding of 6C6 antibody to MCT1 using the GBEST system, we reconstituted membranes using NMVs derived from MCT1-Sf9 cells to allow measurement of the total binding signal and NMVs derived from parental Sf9 cells to allow measurement of the nonspecific binding signal. These membranes were characterized in separate flow cells containing GBEST chips equilibrated with dPBS buffer. dPBS-matched samples, containing 60 nM or 240 nM antibody, were applied and the electrical signal was monitored in real time on the GBEST system. When the signal reached a plateau, dPBS buffer was applied and dissociation of 6C6 was monitored. Figure 2 shows real-time traces for 6C6 binding to both MCT1-Sf9 and parental Sf9 membranes. Whereas 240 nM 6C6 binding to the MCT1-Sf9 membranes yielded a (total) signal of ~700 nA, the same 6C6 sample yielded a (nonspecific) signal of only ~300 nA with the parental Sf9 membranes. A similar result was observed with 60 nM 6C6, where the total signal was ~300 nA and the nonspecific signal was <100 nA. The nonspecific signal was expected and may be due to the antibody flowing in proximity to the sensor and/or nonspecific interactions of the antibody with the membrane. Note that the samples and buffers did not include any blocking or sacrificial protein to mitigate nonspecific interactions. This demonstrates that specific binding of 6C6 to MCT1 in a fluid reconstituted membrane can be detected readily in real time and in a label-free way using GBEST technology.
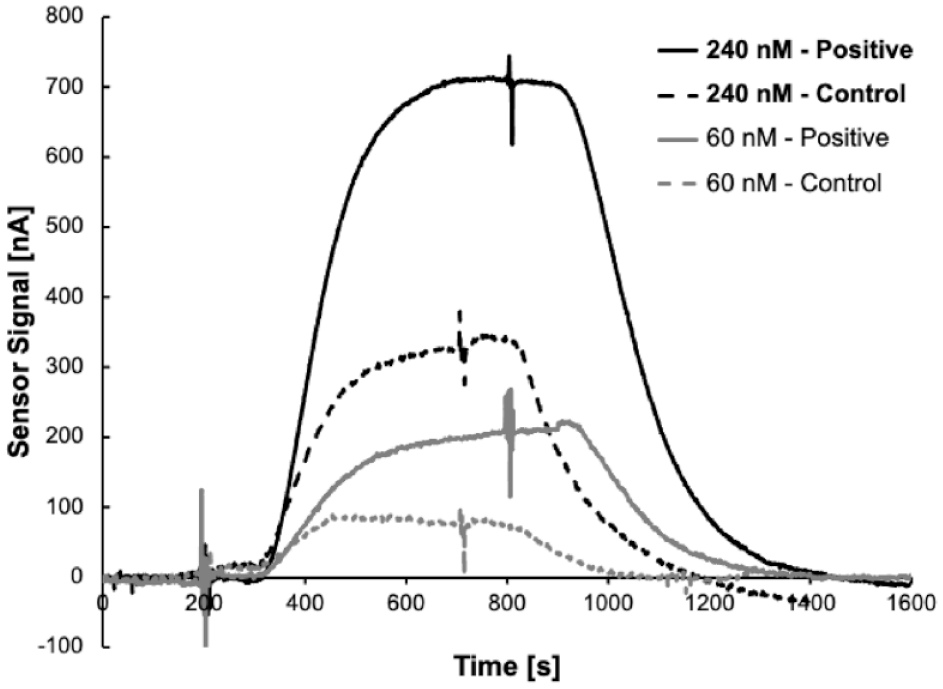
Binding of label-free antibody 6C6 to membrane-bound MCT1 (solid traces) and to parental membrane (dashed traces) at 60 nM and 240 nM.
Equilibrium Binding and KD Determination
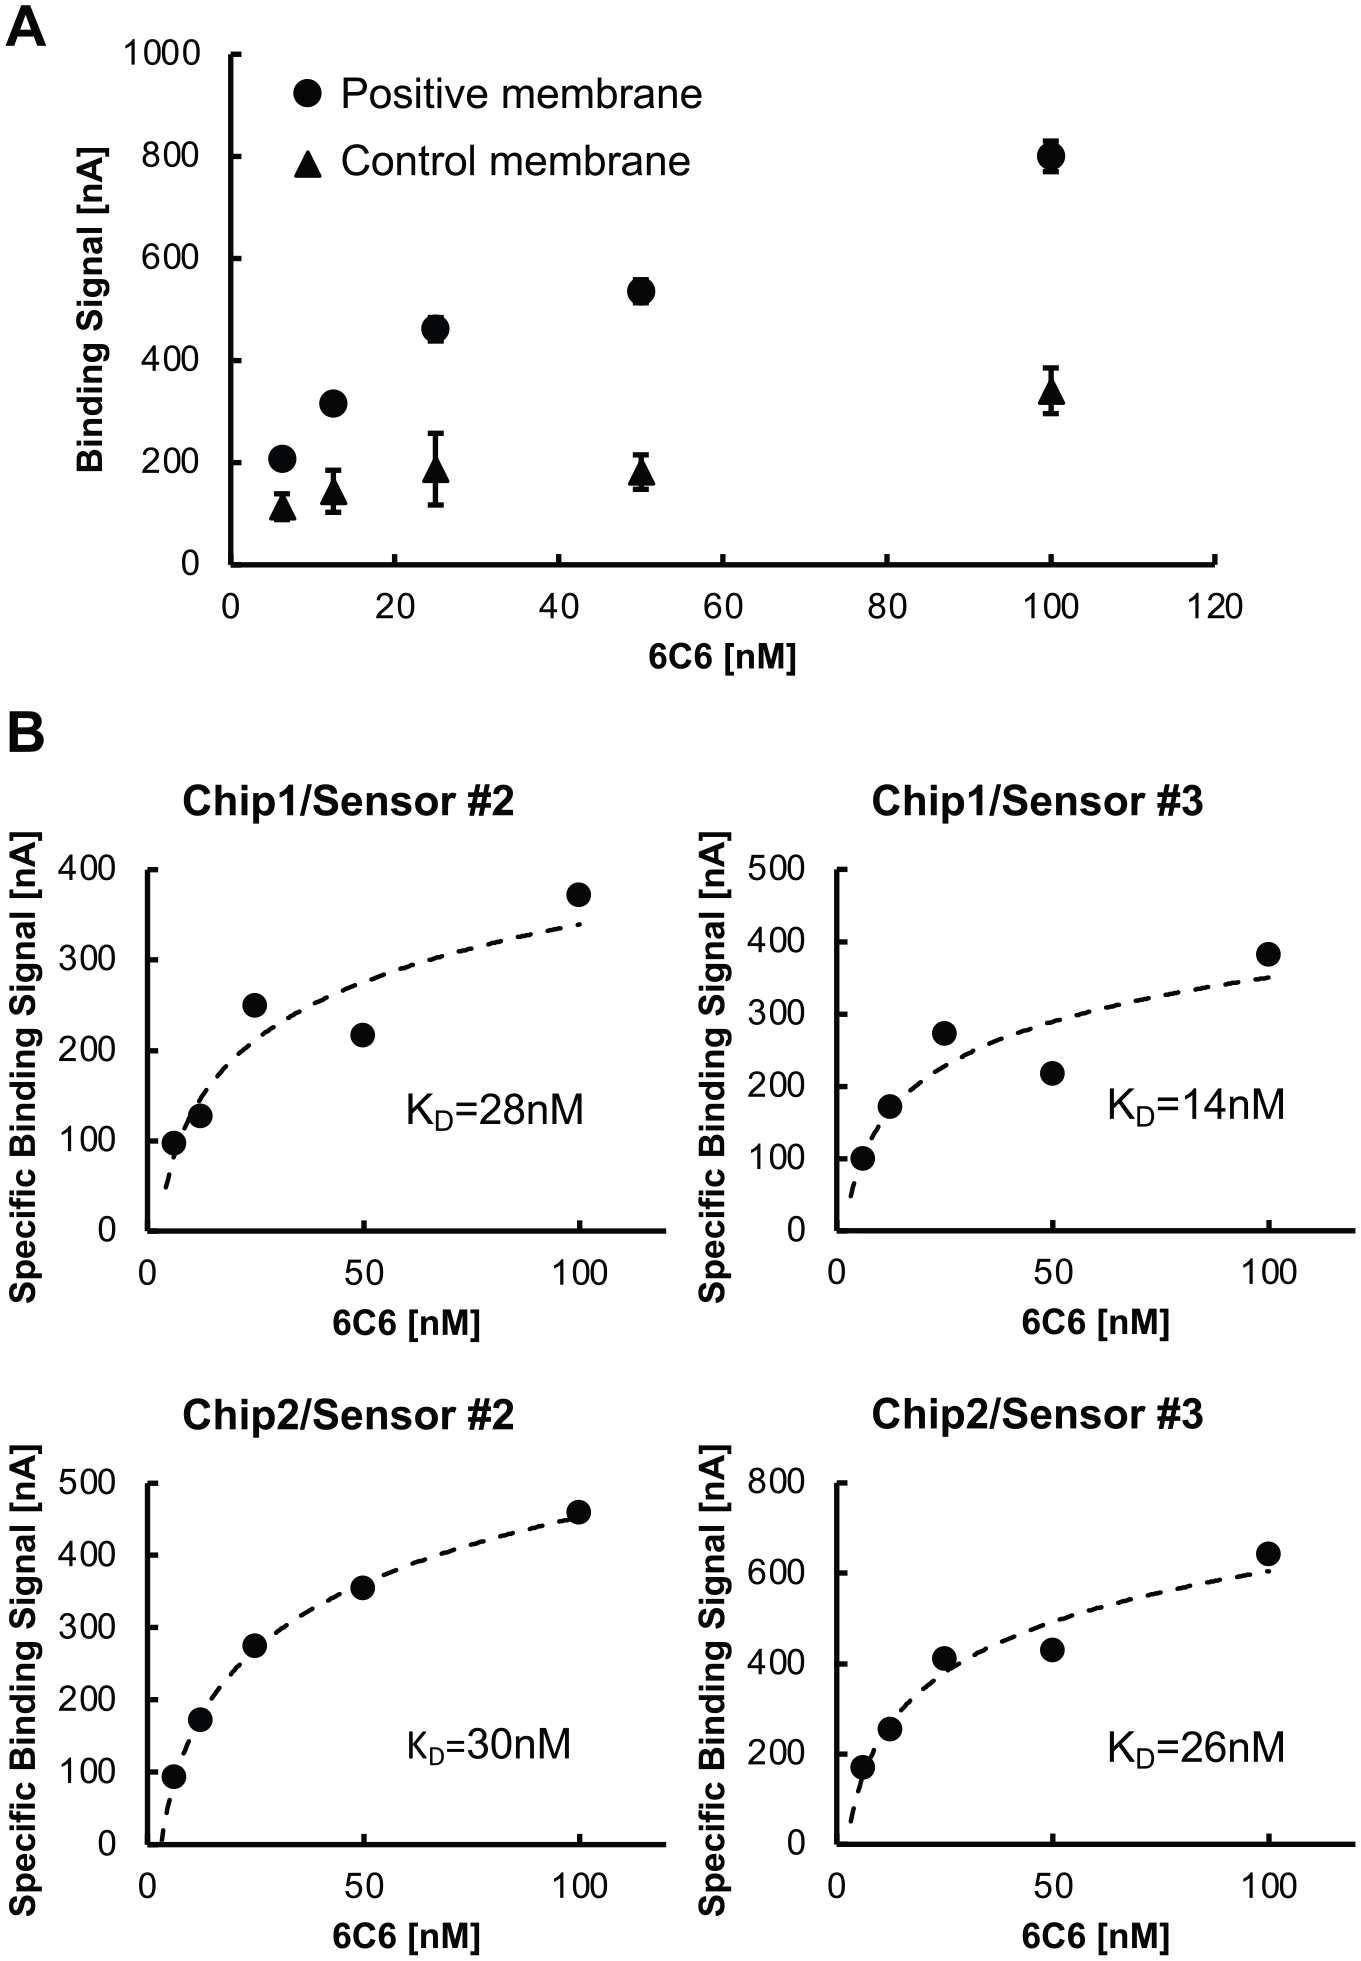
MCT1-Sf9 and parental Sf9 membranes were reconstituted on two separate GBEST chips, each with two sensors (sensors 2 and 3). Increasing concentrations of label-free 6C6 antibody were then applied at the following concentrations: 6.25, 12.5, 25, 50 and 100 nM ( Fig. 3 ). The signal upon binding of 6C6 to MCT1-Sf9 membranes ranged from 200 to 800 nA (total binding), whereas the signal upon binding to Sf9 membranes ranged from 100 to 300 nA (nonspecific binding). Figure 4A shows the total binding and nonspecific binding signals at each concentration of 6C6 antibody. The specific binding signal at each concentration of 6C6 was obtained by subtracting the nonspecific signal from the total signal ( Fig. 4B ). Specific binding signals from each of the four paired sensors were plotted and KD values were calculated from each curve, yielding an average KD of 24 ± 7 nM ( Fig. 4B ). This value is in close agreement with the KD for 6C6 binding to purified MCT1 (60 nM, determined by independent isothermal calorimetry experiments performed at Amgen; not shown and not previously published). This initial data set demonstrates that GBEST technology enables determination of relevant KD values for label-free antibody binding to an IMP of interest in the context of a fluid membrane that includes the components of the native cell membrane. Further development and optimization of the sensor fabrication process and implementation of mitigation strategies to reduce nonspecific binding will enable the acquisition of higher-quality data to determine kinetic measurements of kon and koff. Most importantly, GBEST technology could enable critical target engagement studies with IMPs that are extremely challenging to purify or that are intrinsically unstable once removed from the cell membrane environment.
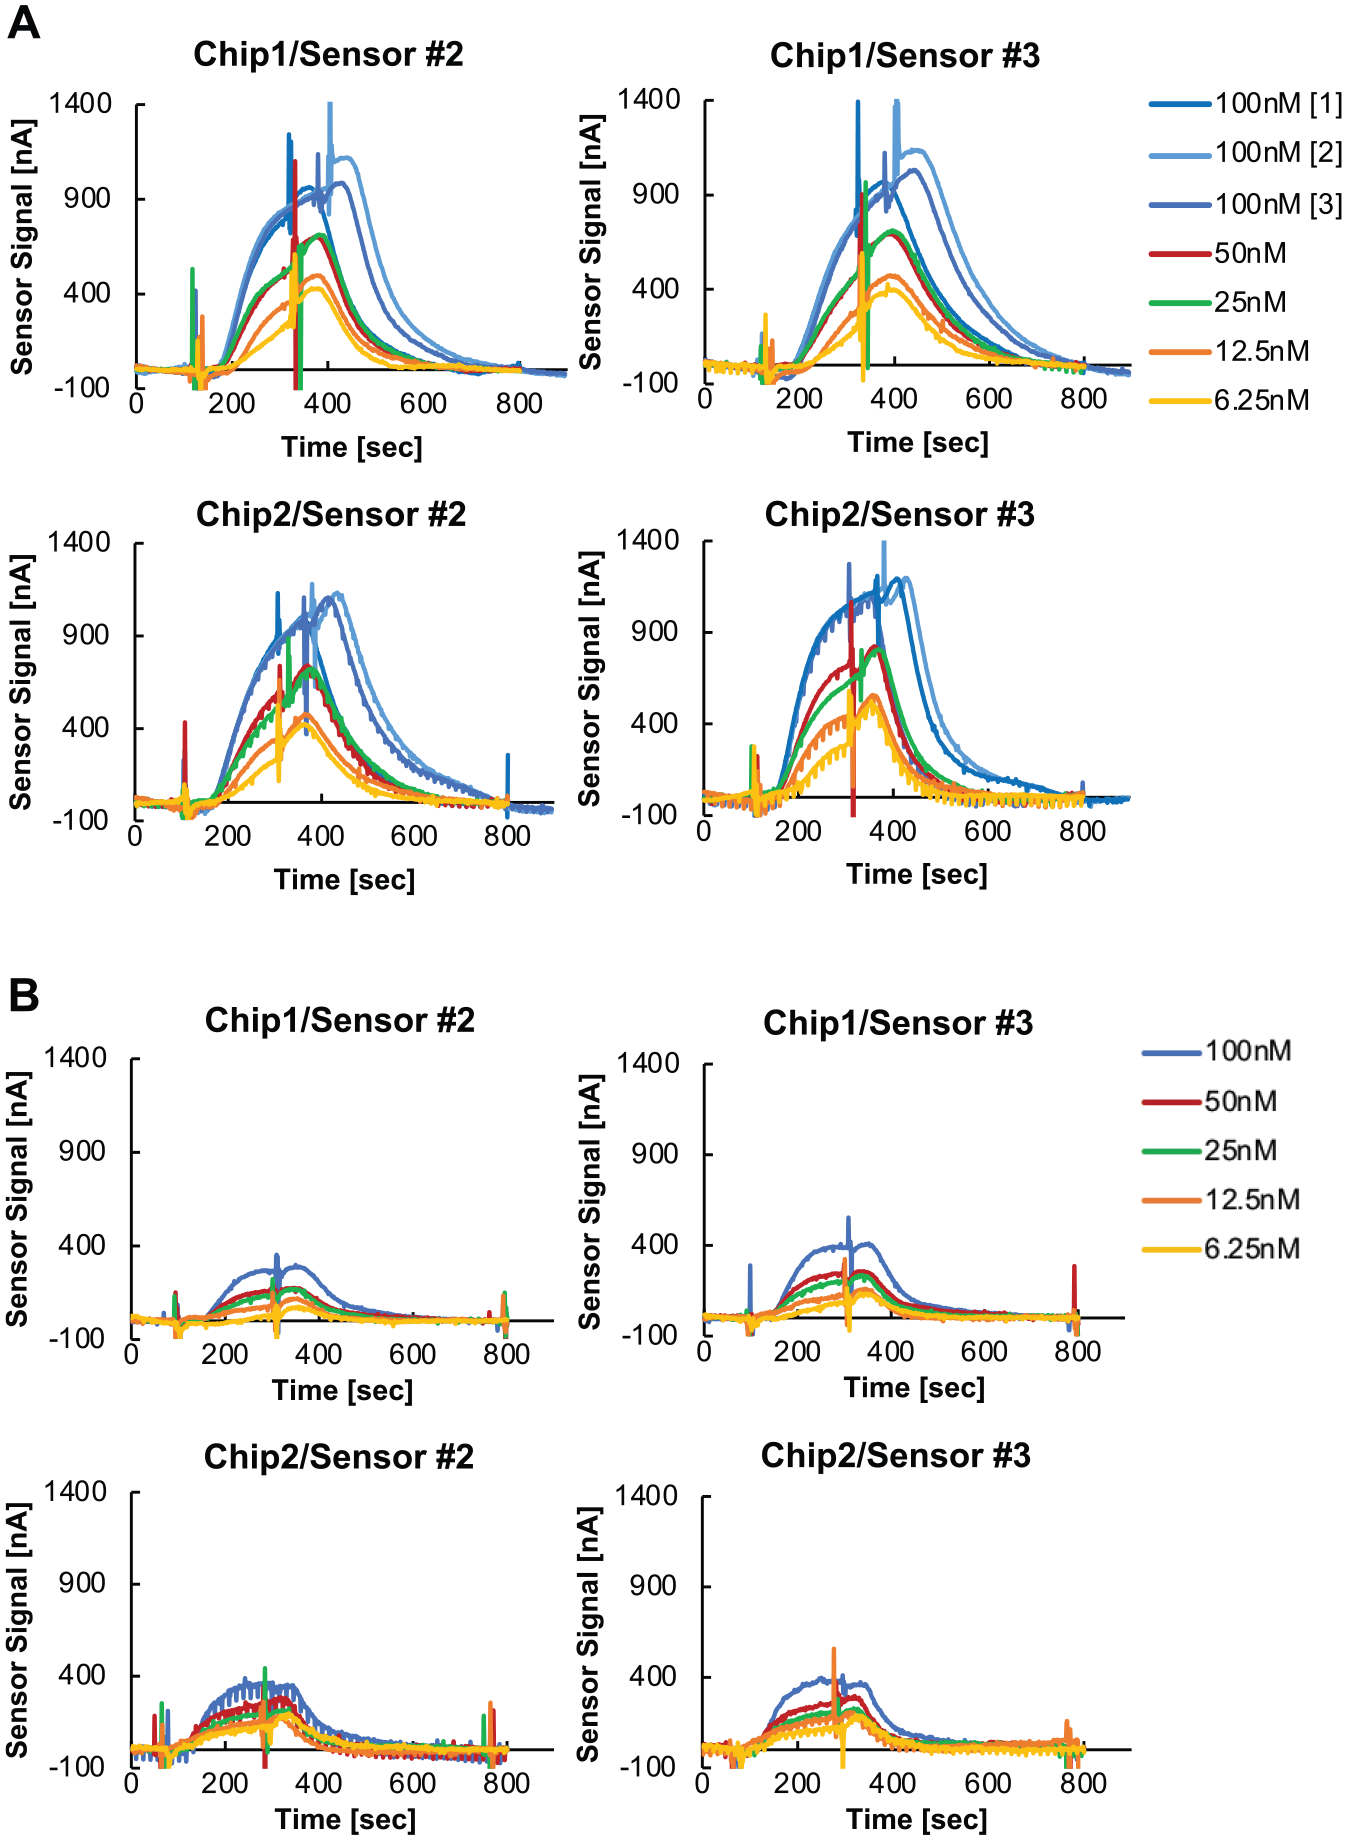
Concentration-dependent binding of 6C6 to reconstituted membranes. (
(
Notably, the graphene sensor response is mass-independent and detects minute electrostatic changes in the immediate vicinity of the sensor surface. Graphene sensors are sensitive to a change as small as 15 electron charges per square micron in a FET configuration. 19 In preliminary experiments, we measured the binding of the small-molecule MCT1 inhibitor, AR-C155585 (MW 461 Da), to MCT1; this molecule has a reported Ki of 2 nM. 20 At 0.5 nM we observed a specific binding signal of 205 nA, which is the result of subtracting the nonspecific signal (274 nA) obtained with the parental Sf9 membranes from the total signal (479 nA) obtained with the MCT1-Sf9 membranes ( Fig. 5A ). We also determined that reconstituted membranes are stable for at least 5 h in the presence of up to 1.5% DMSO, a solvent that is frequently used when preparing small-molecule samples for assays in drug discovery labs (data not shown). In order to show the effect of DMSO (at 0%, 1%, and 10% v/v in buffer), a comparative set of microscopy images of reconstituted lipid membranes, without embedded IMPs formed over the custom graphene test structure, is shown in Figure 5B . Notice that a clear phase separation of lipids (blotchiness) is induced by DMSO at 10% but not at 1%. These observations underscore how GBEST technology may overcome the limitations of mass-dependent biophysical techniques such as SPR and BLI.
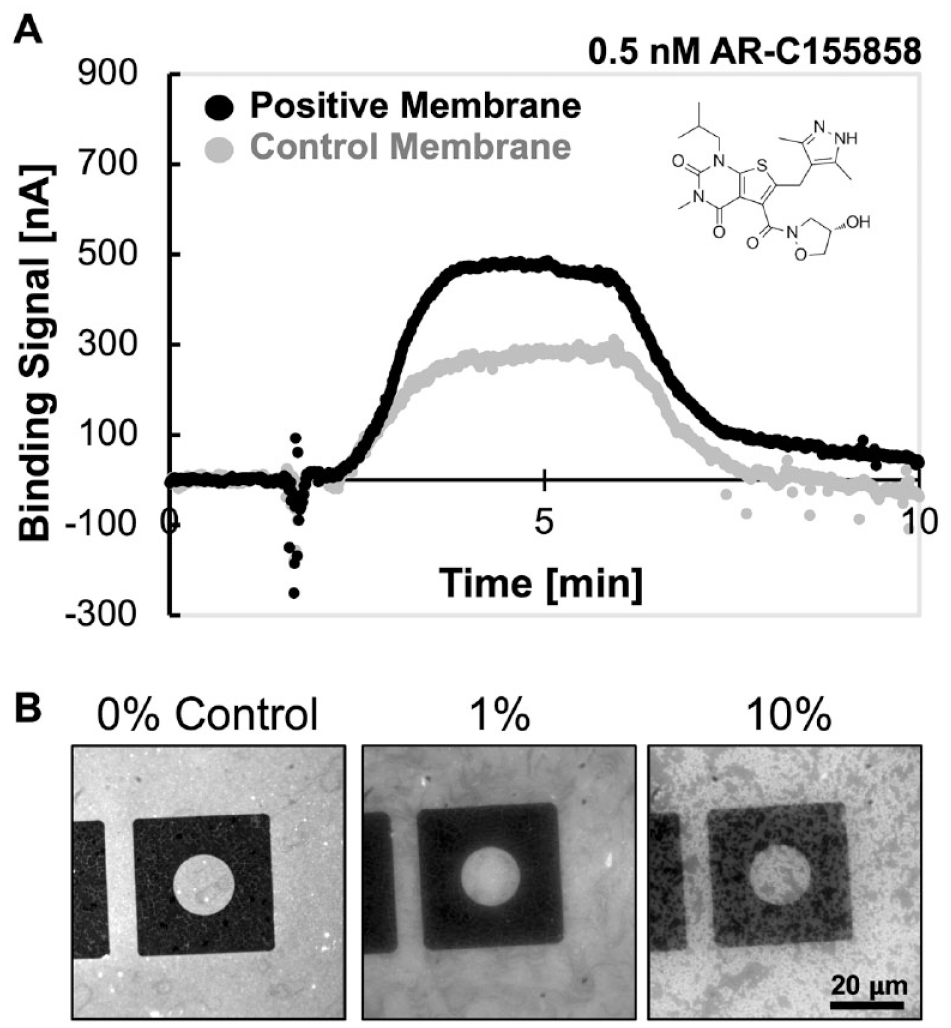
Binding of AR-C155858 (0.5 nM) to reconstituted membranes. (
Orientation of Proteins in Reconstituted Membranes
NMVs consist of a mixture of inside-out and right-side-out vesicles; thus, reconstituted membranes on GBEST sensors present the IMP target in both orientations in the bilayer. For the purposes of drug discovery, it may be desirable to select for a particular orientation of the IMP to avoid potential confounding factors. For example, it has been proposed that AR-C155858 crosses the membrane and binds to an intracellular ligand-binding pocket of MCT1. 21 Therefore, measurements of binding affinities in a reconstituted membrane may be affected by potential rate-limiting transportation rates across the membrane. A potential approach that aims to enrich for a particular orientation of IMPs of interest is preferential affinity purification of inside-out or right-side-out vesicles. 22 Alternatively, virus-like particles carrying the IMP in a desired orientation could be used instead of NMVs to reconstitute membranes on sensors.
Promise of the Technology
GBEST provides a new method to measure mass-independent and label-free target engagement in the context of a cell membrane without the need to purify and/or chemically conjugate IMPs onto sensor surfaces (as in, e.g., SPR, BLI, and other approaches). GBEST has the potential to overcome the inherent challenges of IMP purification, instability, and undesirable conformational changes, which introduce significant risks to lead discovery studies. The possibility of directly using NMVs containing an IMP of interest from any relevant cell line or tissue is an attractive proposition to drug discovery labs for target engagement studies in a highly physiologically relevant system.
Supplemental Material
sj-pdf-1-jbx-10.1177_24725552211013067 – Supplemental material for Bioelectronic Measurement of Target Engagement to a Membrane-Bound Transporter
Supplemental material, sj-pdf-1-jbx-10.1177_24725552211013067 for Bioelectronic Measurement of Target Engagement to a Membrane-Bound Transporter by William E. Martinez, Jaime E. Arenas, Leo Mok, Ngo Yin Wong, Monica M. Lozano, Wan-Chen Lin, M. Gertrude Gutierrez, Rodrigo Sierra Chavera and Joseph G. McGivern in SLAS Discovery
Footnotes
Acknowledgements
We would like to thank Dr. Paul Shaffer, former Senior Scientist at Amgen, for providing membrane preparations and antibodies, which were critical reagents for this study. We would also like to thank Dr. Philip Tagari, Vice President of Therapeutic Discovery at Amgen, for his advice and insightful feedback. Finally, we acknowledge the Molecular Foundry at Lawrence Berkeley National Lab (LBNL) and Dr. Stefano Cabrini, Director of its Nanofabrication Facility, for hosting Nanotech Biomachines, Inc. as an industrial user and facilitating access to state-of-the-art equipment between 2012 and 2015. This enabled crucial early sensor development. Additional information relevant to intellectual property can be found in U.S. Patent applications PCT/US2017/041563 and PCT/US2018/013537.
Supplemental material is available online with this article.
Declaration of Conflicting Interests
The authors declared no potential conflicts of interest with respect to the research, authorship, and/or publication of this article.
Funding
The authors disclosed receipt of the following financial support for the research, authorship, and/or publication of this article: The proof-of-principle work and results described in this article were the result of collaborative work between Amgen, Inc. and Nanotech Biomachines, Inc., which provided the funding for this experimental work.
References
Supplementary Material
Please find the following supplemental material available below.
For Open Access articles published under a Creative Commons License, all supplemental material carries the same license as the article it is associated with.
For non-Open Access articles published, all supplemental material carries a non-exclusive license, and permission requests for re-use of supplemental material or any part of supplemental material shall be sent directly to the copyright owner as specified in the copyright notice associated with the article.