
Abstract
Throughout recent decades, histone deacetylase (HDAC) inhibitors have shown encouraging potential in cancer treatment, and several pan-HDAC inhibitors have been approved for treating malignant cancers. Numerous adverse effects of pan-HDAC inhibitors have been reported, however, during preclinical and clinical evaluations. To avoid undesirable responses, an increasing number of investigations are focusing on the development of isotype-selective HDAC inhibitors. In this study, we present an effective and quantitative cellular assay using high-content analysis (HCA) to determine compounds’ inhibition of the activity of HDAC6 and Class I HDAC isoforms, by detecting the acetylation of their corresponding substrates (i.e., α-tubulin and histone H3). Several conditions that are critical for HCA assays, such as cell seeding number, fixation and permeabilization reagent, and antibody dilution, have been fully validated in this study. We used selective HDAC6 inhibitors and inhibitors targeting different HDAC isoforms to optimize and validate the capability of the HCA assay. The results indicated that the HCA assay is a robust assay for quantifying compounds’ selectivity of HDAC6 and Class I HDAC isoforms in cells. Moreover, we screened a panel of compounds for HDAC6 selectivity using this HCA assay, which provided valuable information for the structure–activity relationship (SAR). In summary, our results suggest that the HCA assay is a powerful tool for screening selective HDAC6 inhibitors.
Introduction
Protein acetylation is one of the posttranslational modifications (PTMs) that plays an important role in epigenetic regulation of chromatin structure and modulation of gene transcription. Histone deacetylases (HDACs) are a class of epigenetic enzymes that cooperate with histone acetyltransferases (HATs) to regulate gene transcription, nucleosome assembly, and DNA repair by modifying histone proteins with the acetyl groups.1,2 The human HDACs are subdivided into four classes according to their sequence homology and cellular localization: Class I (HDAC1, HDAC2, HDAC3, and HDAC8), Class IIa (HDAC4, HDAC5, HDAC7, and HDAC9), Class IIb (HDAC6 and HDAC10), Class III (sirtuins 1–7), and Class IV (HDAC11). Aberrant expressions of various HDACs have been observed in many types of cancer, and are associated with tumor progression and poor prognosis. 3 It has been shown that knockdown of these HDACs can inhibit tumor cell proliferation through inducing cell cycle arrest and apoptosis. 3 Previous research has established that HDAC inhibitors have an antiproliferation activity on cancer cell lines and tumor xenograft models.4–6 So far, several pan-HDAC inhibitors have been approved for treating malignancies, such as vorinostat (SAHA), romidepsin (FK-228), belinostat (PXD-101), and panobinostat (LBH589), and many others are under clinical trials for cancer or noncancer indications. 7
The nucleus-localized Class I HDAC isoforms are of great importance in regulating the deacetylation of histones. To date, most HDAC inhibitors have been developed to target these isoforms. 7 It has been reported, however, that genetic deletion of either HDAC1 or HDAC2 in mice is lethal at the embryonic stage, and some unacceptable side effects arising from HDAC1–3 inhibition have been observed in clinical investigation.7–9 In contrast to HDAC1–3-knockout mice, HDAC6-knockout mice are viable and fertile, and HDAC6 inhibition may have potential in therapies for autoimmunity, cancer, and many neurodegenerative conditions.10–12 Therefore, the development of selective HDAC6 inhibitors has created opportunities for more precise targeting with less toxicity.
In vitro enzymatic assays are used in most studies to evaluate the selectivity of compounds by detecting the inhibition of different HDAC isoforms. In these assays, different isoforms of HDAC proteins are incubated with indicated compounds in a buffer system for a certain period of time, and the HDAC activity is measured with specific fluorophore-conjugated substrate.13–15 Although it is a convenient and simple assay for compound screening, it cannot reflect the cellular microenvironment or the interaction between HDACs and inhibitors in vivo. Therefore, results from enzymatic assays usually require further evaluation in cell-based assays. Western blotting is the most commonly used cell-based assay. It has many disadvantages, however, including semiquantitiveness, poor reproducibility, and incompatibility with high-throughput screening (HTS). Enzyme-linked immunosorbent assay (ELISA) has also been applied to detect global acetylation of lysines or acetylated histone proteins from cell extracts. 13 In addition, mass spectrometry–based quantitative proteomic analysis identifies and quantifies histone modification. 16 All of the methods mentioned above, however, require an additional cell lysis step and can detect only the average outcome of acetylation response among the cell population, which poorly reflects the native cellular response. Cytoblot and flow cytometry are alternative fluorescence-based methods to detect acetylation modification directly in cells after treatment with HDAC inhibitors.17,18 Both methods are quantitative and can evaluate the activity of HDAC inhibitors within the cell microenvironment. The cytoblot assay assesses the activity of an HDAC inhibitor by evaluating the acetylation of histone or α-tubulin using a specific antibody. It is compatible with HTS and has been used successfully in screening of HDAC6-selective inhibitors.18,19 Cytotoxicity may interfere with the results, however, because the cytoblot assay obtains an average chemiluminescent signal from the whole well. 19 The cytoblot assay also suffers from disadvantages such as low sensitivity and low assay window. Compared to cytoblot, flow cytometry can obtain signal from individual cells, which minimizes the interference of cytotoxicity, but it is not suitable for HTS. High-content analysis (HCA) is a powerful phenotypic screening approach that combines high-throughput automated microscopy with comprehensive image analysis to quantify multiple morphological and functional cellular features. This type of profiling bears advantages from both the cytoblot and flow cytometry. More importantly, the HCA assay has relatively high reliability, reproducibility, and compatibility with HTS. Thus, it has become an essential tool in the field of drug discovery. Several studies applied the HCA platform to quantify histone trimethylation for screening EZH2 inhibitors or to monitor tubulin polymerization status after treatment with drug candidates on the cellular tubulin network.20,21 HCA can also be used in clinical evaluation, such as in companion diagnostics. For example, changes in the histone H3 acetylation level in a human neuroblastoma cell line and human brain tissue sections are quantified by HCA to evaluate the efficacy of an HDAC inhibitor. 22 HCA also has been used to study the activity and selectivity of HDAC6 inhibitors, through monitoring the effects on HDAC6 (α-tubulin acetylation) and Class I nuclear deacetylases (lysine acetylation) simultaneously. 23 It has not yet been used, however, as a screening assay for selective HDAC inhibitors. Here, we designed an HCA-based assay for screening HDAC6-selective inhibitors. By detecting acetylation of specific endogenous substrates (α-tubulin and histone H3) for HDACs, we quantitatively measured the corresponding effects of HDAC inhibitors on HDAC6 and Class I HDACs within the cell environment. We profiled 300 compounds and identified some potential HDAC6-selective inhibitors.
Materials and Methods
Antibodies and Reagents
Anti-acetyl-tubulin (ACTU; clone 6-11B-1) antibody 24 was purchased from Sigma-Aldrich (cat. no. T6793, St. Louis, MO). The following antibodies were purchased from Abcam (Cambridge, UK): acetyl-histone H3 (ACH3; acetyl-K9, K14, K18, K23, K27, cat. no. ab47915), α-tubulin (cat. no. ab52866), and horseradish peroxidase (HRP)-conjugated β-actin (cat. no. ab49900). HRP-conjugated glyceraldehyde 3-phosphate dehydrogenase (GAPDH) antibody was purchased from Proteintech (cat. no. HRP-60004, Rosemont, IL). Alexa Fluor 488 goat anti-rabbit immunoglobulin G (IgG; H+L) cross-adsorbed secondary antibody (cat. no. A-11008), Alexa Fluor 488 goat anti-mouse IgG (H+L) cross-adsorbed secondary antibody (cat. no. A-11001), and diamidine phenyl indole (DAPI) solution (cat. no. 62248) were purchased from Invitrogen (Carlsbad, CA). HRP-conjugated goat anti-rabbit (cat. no. 7074s) and goat anti-mouse (cat. no. 7074s) IgG secondary antibody used in Western blotting were purchased from Cell Signaling (Danvers, MA). The blocking reagent (cat. no. 11096176001) was purchased from Roche Molecular Biochemicals (Mannheim, Germany). Chidamide was purchased from Selleckchem (Houston, TX), and other HDAC inhibitors were synthesized in-house.
Cell Culture
HCT116 cells were purchased from the Cell Bank of Type Culture Collection of Chinese Academy of Sciences and maintained in McCoy’s 5A Medium (cat. no. 16600-082, Gibco, Carlsbad, CA) with 10% fetal bovine serum, 100 units/mL penicillin, and 100 µg/ml streptomycin.
Western Blotting
Cells were lysed in lysis buffer (cat. no. P0013G, Beyotime, Beijing, China) containing 1% sodium dodecyl sulfate (SDS), 1 mM phenylmethylsulfonyl fluoride (PMSF; cat. no. ST506, Beyotime), and protease and phosphatase inhibitors (cOmplete Cocktail Tablet and PhosSTOP Cocktail Tablet, Roche Molecular Biochemicals). After ultrasonication, the cell lysates were centrifuged at 15,000 rpm for 10 min at 4 °C, and resultant supernatants were collected as cell extracts. The protein concentration of cell extracts was determined by the bicinchoninic acid (BCA) method according to the manufacturer’s instructions (BCA protein assay kit, cat. no. PA115-02, Tiangen, Beijing, China). Cell extracts were mixed with an equal volume of 2× loading buffer (100 mM Tris-HCL pH 6.8, 4% SDS, 12% glycerol, 2% β-mercapitalethanol, and 0.02% bromophenol blue), and then heated at 100 °C for 8 min. Ten to thirty micrograms of samples were subjected on 4–12% SDS-PAGE (polyacrylamide gel electrophoresis) gels, and then transferred onto poly(vinylidene difluoride) (PVDF) membrane (cat. no. ISEQ00010, Millipore, Billerica, MA). The membrane was blocked with 5% nonfat milk in tris-buffered saline (TBS) containing 0.05% Tween 20 (TBST) buffer before incubating with primary antibody at 4 °C overnight. On the next day, the membrane was washed with TBST and then probed with HRP-conjugated goat anti-rabbit or goat anti-mouse antibody. Finally, after washing the membrane with TBST again, immune-reactive bands were visualized using the chemiluminescent substrate (cat. no. WBKLS0500, Millipore). The band densities were determined using Image Studio software (Li-Cor Biosciences, Lincoln, NE) and used to calculate the EC50s with GraphPad Prism 5 software (GraphPad, San Diego, CA).
Immunofluorescence Labeling
HCT116 cells were seeded in a black-walled, clear-bottomed 96-well plate (cat. no. 655090, Greiner Bio-One, Kremsmünster, Austria) and cultured overnight. After incubating with HDAC inhibitors, cells were fixed by different fixation and permeabilization procedures according to the target’s distinct subcellular localization. For cytosolic α-tubulin detection, cells were fixed with 4% paraformaldehyde (PFA) for 15 min at room temperature, and permeablized in 0.1% TritonX-100 for 15 min. For nucleus-residing histone H3 detection, cells were fixed and permeabilzed in ice-cold methanol for 15 min. After being blocked with 1% blocking reagent in TBS buffer, cells were incubated with anti-ACTU mouse monoclonal antibody or anti-ACH3 rabbit monoclonal antibody diluted in 1% blocking reagent at 4 °C overnight. Next, cells were washed four times with phosphate-buffered saline (PBS) containing 0.05% Tween 20 (PBST), then they were incubated with fluorescent secondary antibodies in 1% blocking reagent for 2 h at room temperature with gentle shaking. Finally, cells were washed four more times with PBST before high-content image acquisition and analysis.
High-Content Image Acquisition and Analysis
After immunofluorescence labeling, image acquisition was performed on the IN Cell Analyzer 2200 (GE Healthcare, Buckinghamshire, UK). Images of stained nuclei (DAPI) and acetyl-tubulin or acetyl-histone H3 labeled with Alexa Fluor 488 [fluorescein isothiocyanate (FITC)] were acquired using a 20 × 0.45 numerical aperture (NA) objective with two fluorescent channels. Nine fields of view were set up for each well.
The images were analyzed on the IN Cell Analyzer Workstation (version 3.7, GE Healthcare) based on the Multi-Target Analysis (MTA) module according to the instrument user’s guide and the IN Cell Analyzer Workstation Manual. We created an analysis protocol for ACTU and ACH3, respectively, due to their different staining and location. Briefly, we used the top hat method (a rapid method to identify objects that are fairly uniform in size and shape) for the nuclei segmentation with DAPI, in which the minimum area was set as 65 µm2 and the sensitivity of nuclei detection was set at 20%. For ACTU, the multiscale top hat method (a means to identify cell bodies that vary in size) was applied in cell segmentation, in which the minimum area was set as 120 µm2 with the sensitivity set at 20%. For ACH3, we used the collar method (which establishes a ring-shaped cytoplasmic sampling region by dilating outward a defined distance from the nuclear region) to segment cytoplasm by setting the radius parameter as 3 µm. The average fluorescent intensity in the whole cell (intensity N + C) was included in the analysis. The relative fold changes of fluorescent signal of compound-treated cells compared to DMSO control were used to fit the dose–response curve and calculate the EC50. The EC50 values were calculated using a three-parameter dose–response curve-fitting model, (“log(Agonist) vs. response”): Y = Bottom + (Top − Bottom) / {1 + 10^[(LogEC50 − X)]}, with GraphPad Prism 5 software.
Results
Assessment of Antibody Specificity of ACTU and ACH3
Because α-tubulin and histone H3 are the acetylation substrates of HDAC6 and Class I HDAC isoforms, HCT116 cells, in which HDAC6 and HDAC1−3 were highly expressed (
Assessment of ACTU and ACH3 by Western Blotting
Furthermore, the time course of ACTU and ACH3 and the dynamic dose response were examined by Western blotting. After treatment with 0.025 μM of panobinostat for 0.5–24 h, an increase of ACTU was observed immediately from 0.5 h onward, while ACH3 was upregulated gradually from 0.5 to 24 h (
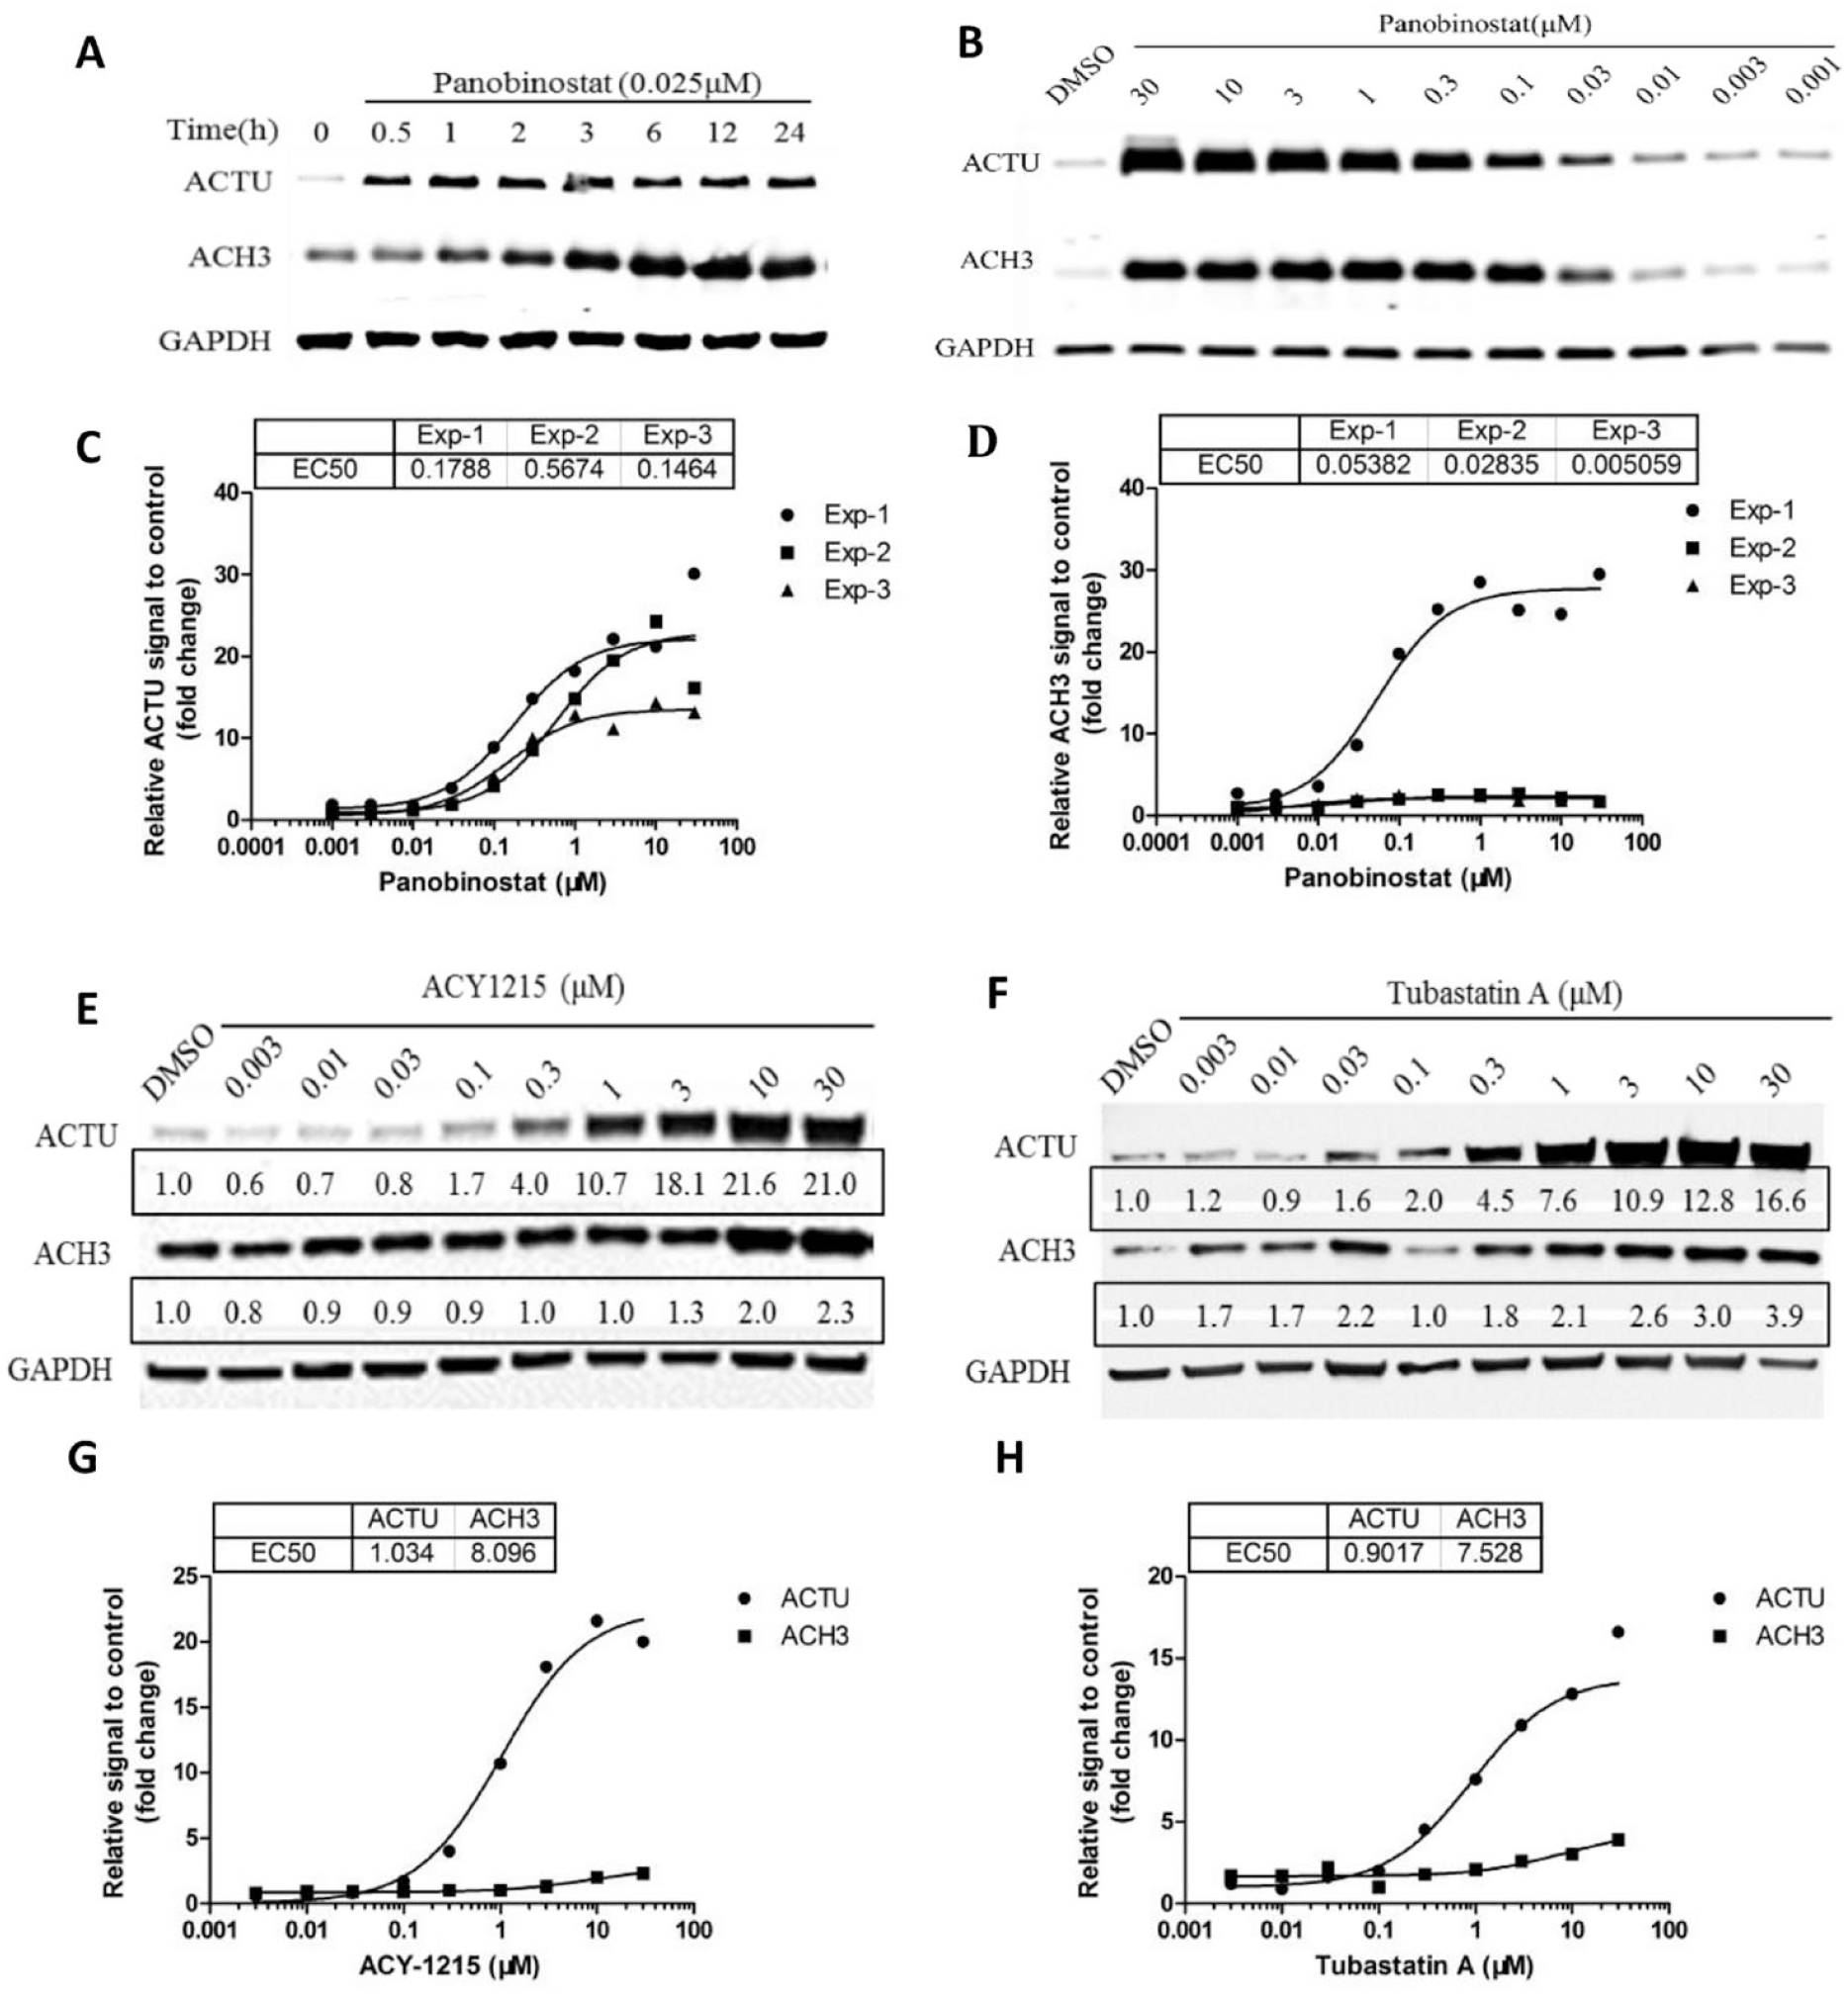
Western blotting analysis of time course and dose response of histone deacetylase (HDAC) inhibitors on acetylated α-tubulin (ACTU) and acetylated histone H3 (ACH3). (
Establishment of an HCA Assay to Evaluate ACTU and ACH3
Thus, we used HCA to establish a cell-based HTS assay to quantify ACTU and ACH3. The feasibility of fluorescence staining and quantitative analysis of ACTU and ACH3 was validated with anti-ACTU antibody and anti-ACH3 antibody, respectively. HDAC6-selective inhibitor Tubastatin A was used as a tool compound to optimize the HCA method according to development guidelines for image-based HCA. 28 Several parameters were extensively optimized for better and more reliable results, including the cell fixation and permeabilization method, plated cell number, image acquisition parameters and appropriate image analysis algorithms for ACTU and ACH3, as well as fluorescent labeling condition.
Since α-tubulin and histone H3 have different subcellular localizations, we compared two distinct fixation reagents, 4% PFA and ice-cold methanol. Better fluorescent signal and dynamic change after Tubustatin A treatment were obtained from PFA fixation for ACTU detection, while ice-cold methanol fixation was more ideal for ACH3 detection (
Cell seeding densities of HCT116 were also optimized to avoid clumping or debris. At the same time, the image acquisition and appropriate image analysis algorithms for ACTU and ACH3 were optimized. HCT116 was seeded in 96-well plates with 5000, 10,000, or 20,000 cells/well. After treatment with 1 µM and 10 µM of Tubastatin A for 6 h, cells were fixed with PFA or methanol for ACTU or ACH3 detection, respectively. DAPI was used as the nucleus marker to visualize cells precisely. Two-dimensional (2D) images were acquired with an automatic confocal imaging platform (IN Cell Analyzer 2200) using a 20×0.45 NA objective with two fluorescent channels (DAPI and FITC) to obtain images of stained nuclei and ACTU or ACH3.
We found that the exposure times for DAPI and FITC were acceptable, ranging from 0.01 s to 0.5 s, which generated data with a good signal-to-noise ratio without saturation. Specifically, the exposure time for DAPI was set to 0.01 s, and the exposure time for FITC was set to 0.02 s, with which the signals of ACTU and ACH3 increased obviously after Tubastatin A treatment compared to DMSO control (
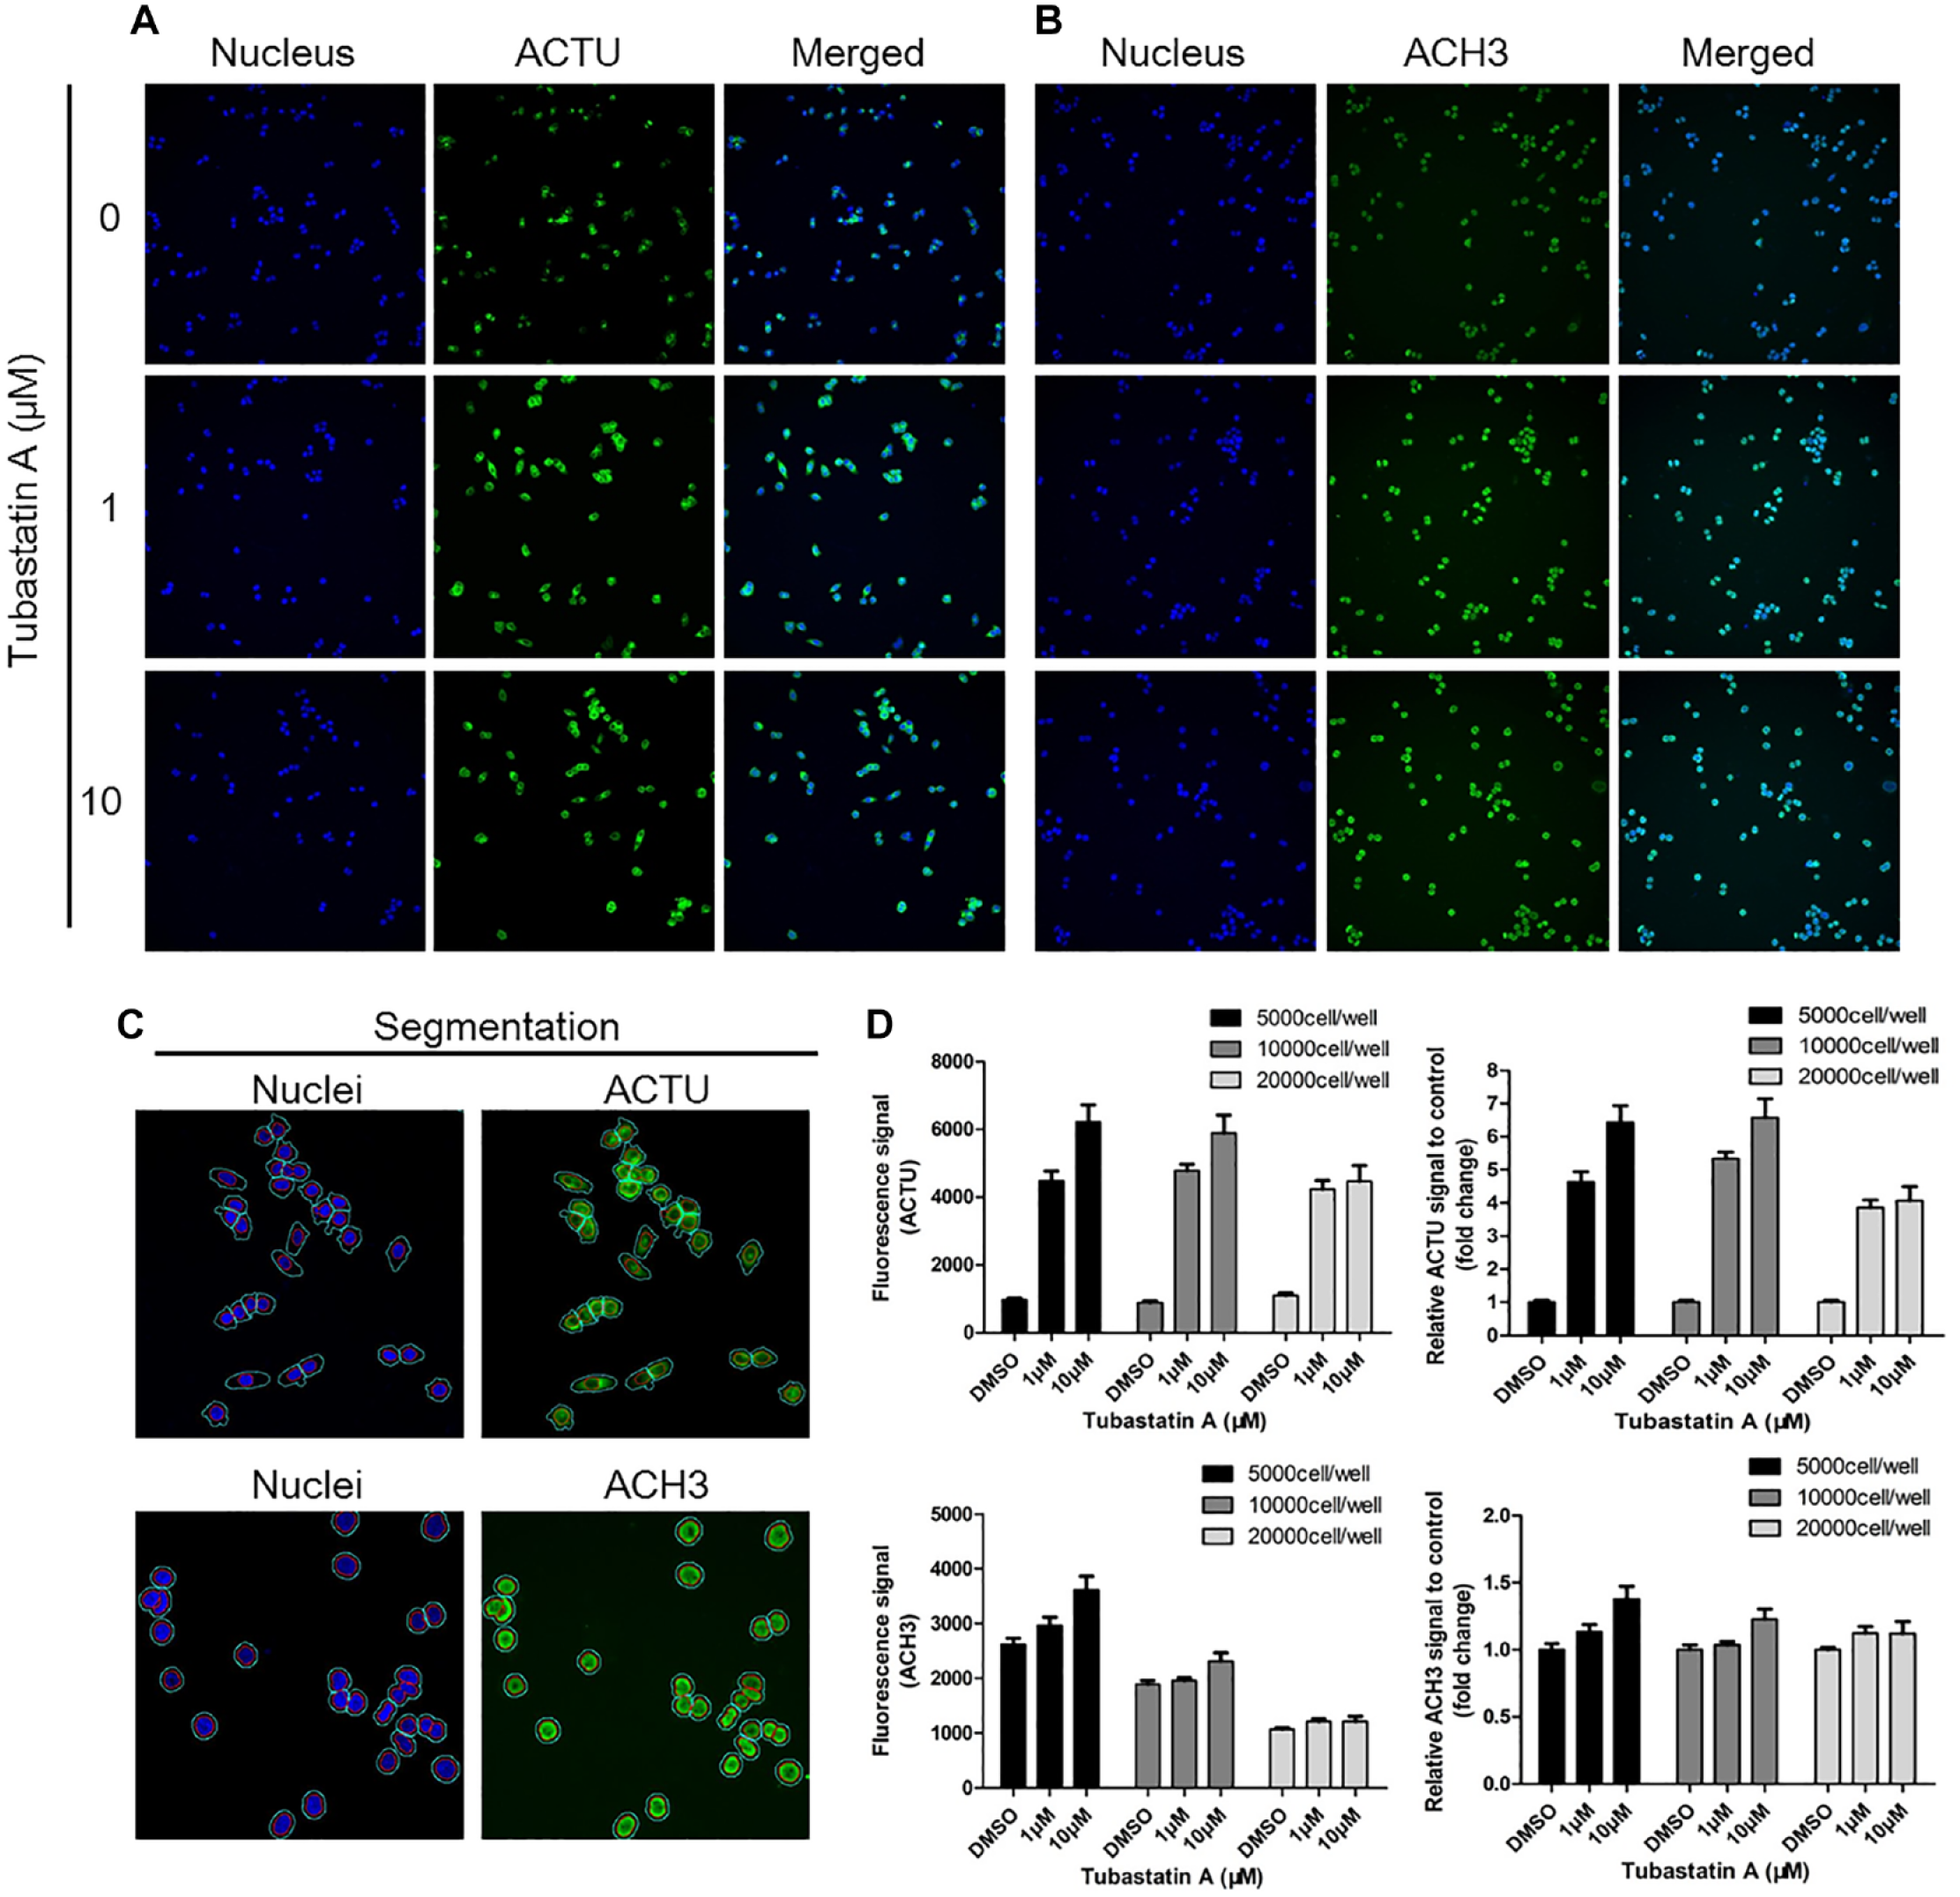
Optimization of cell seeding number, image acquisition, and image analysis algorithms for acetylated α-tubulin (ACTU) and acetylated histone H3 (ACH3) with a high-content analysis (HCA) platform. HCT116 cells were seeded in a 96-well plate with 5000, 10,000, and 20,000 cells/well and treated with 1 µM and 10 µM of Tubastatin A for 6 h. Cells were immunostained with specific antibodies for ACTU and ACH3, and incubated with fluorescence-labeled secondary antibodies. Nuclei were stained with diamidine phenyl indole (DAPI). (
We created analysis protocols for ACTU and ACH3 separately for their different staining and locations. As described in the Materials and Methods section, nuclei were first segmented with DAPI, then the cytoplasm-localized ACTU or nucleus-localized ACH3 (
Next, the dilution of anti-ACTU antibody and anti-ACH3 antibody was optimized to minimize the background fluorescence and achieve a high assay window. As shown in
Figure 3A
, no significant difference was observed from the fluorescent signal of ACTU between the two dilutions of anti-ACTU antibody (1:1000 and 1:2000). The relative fold changes of fluorescent signal after 10 µM of Tubastatin A treatment compared to DMSO control, also denoted as an assay window, were 6.74±0.50 and 6.55±0.53 with 1:1000 and 1:2000 dilutions of anti-ACTU antibody, respectively (
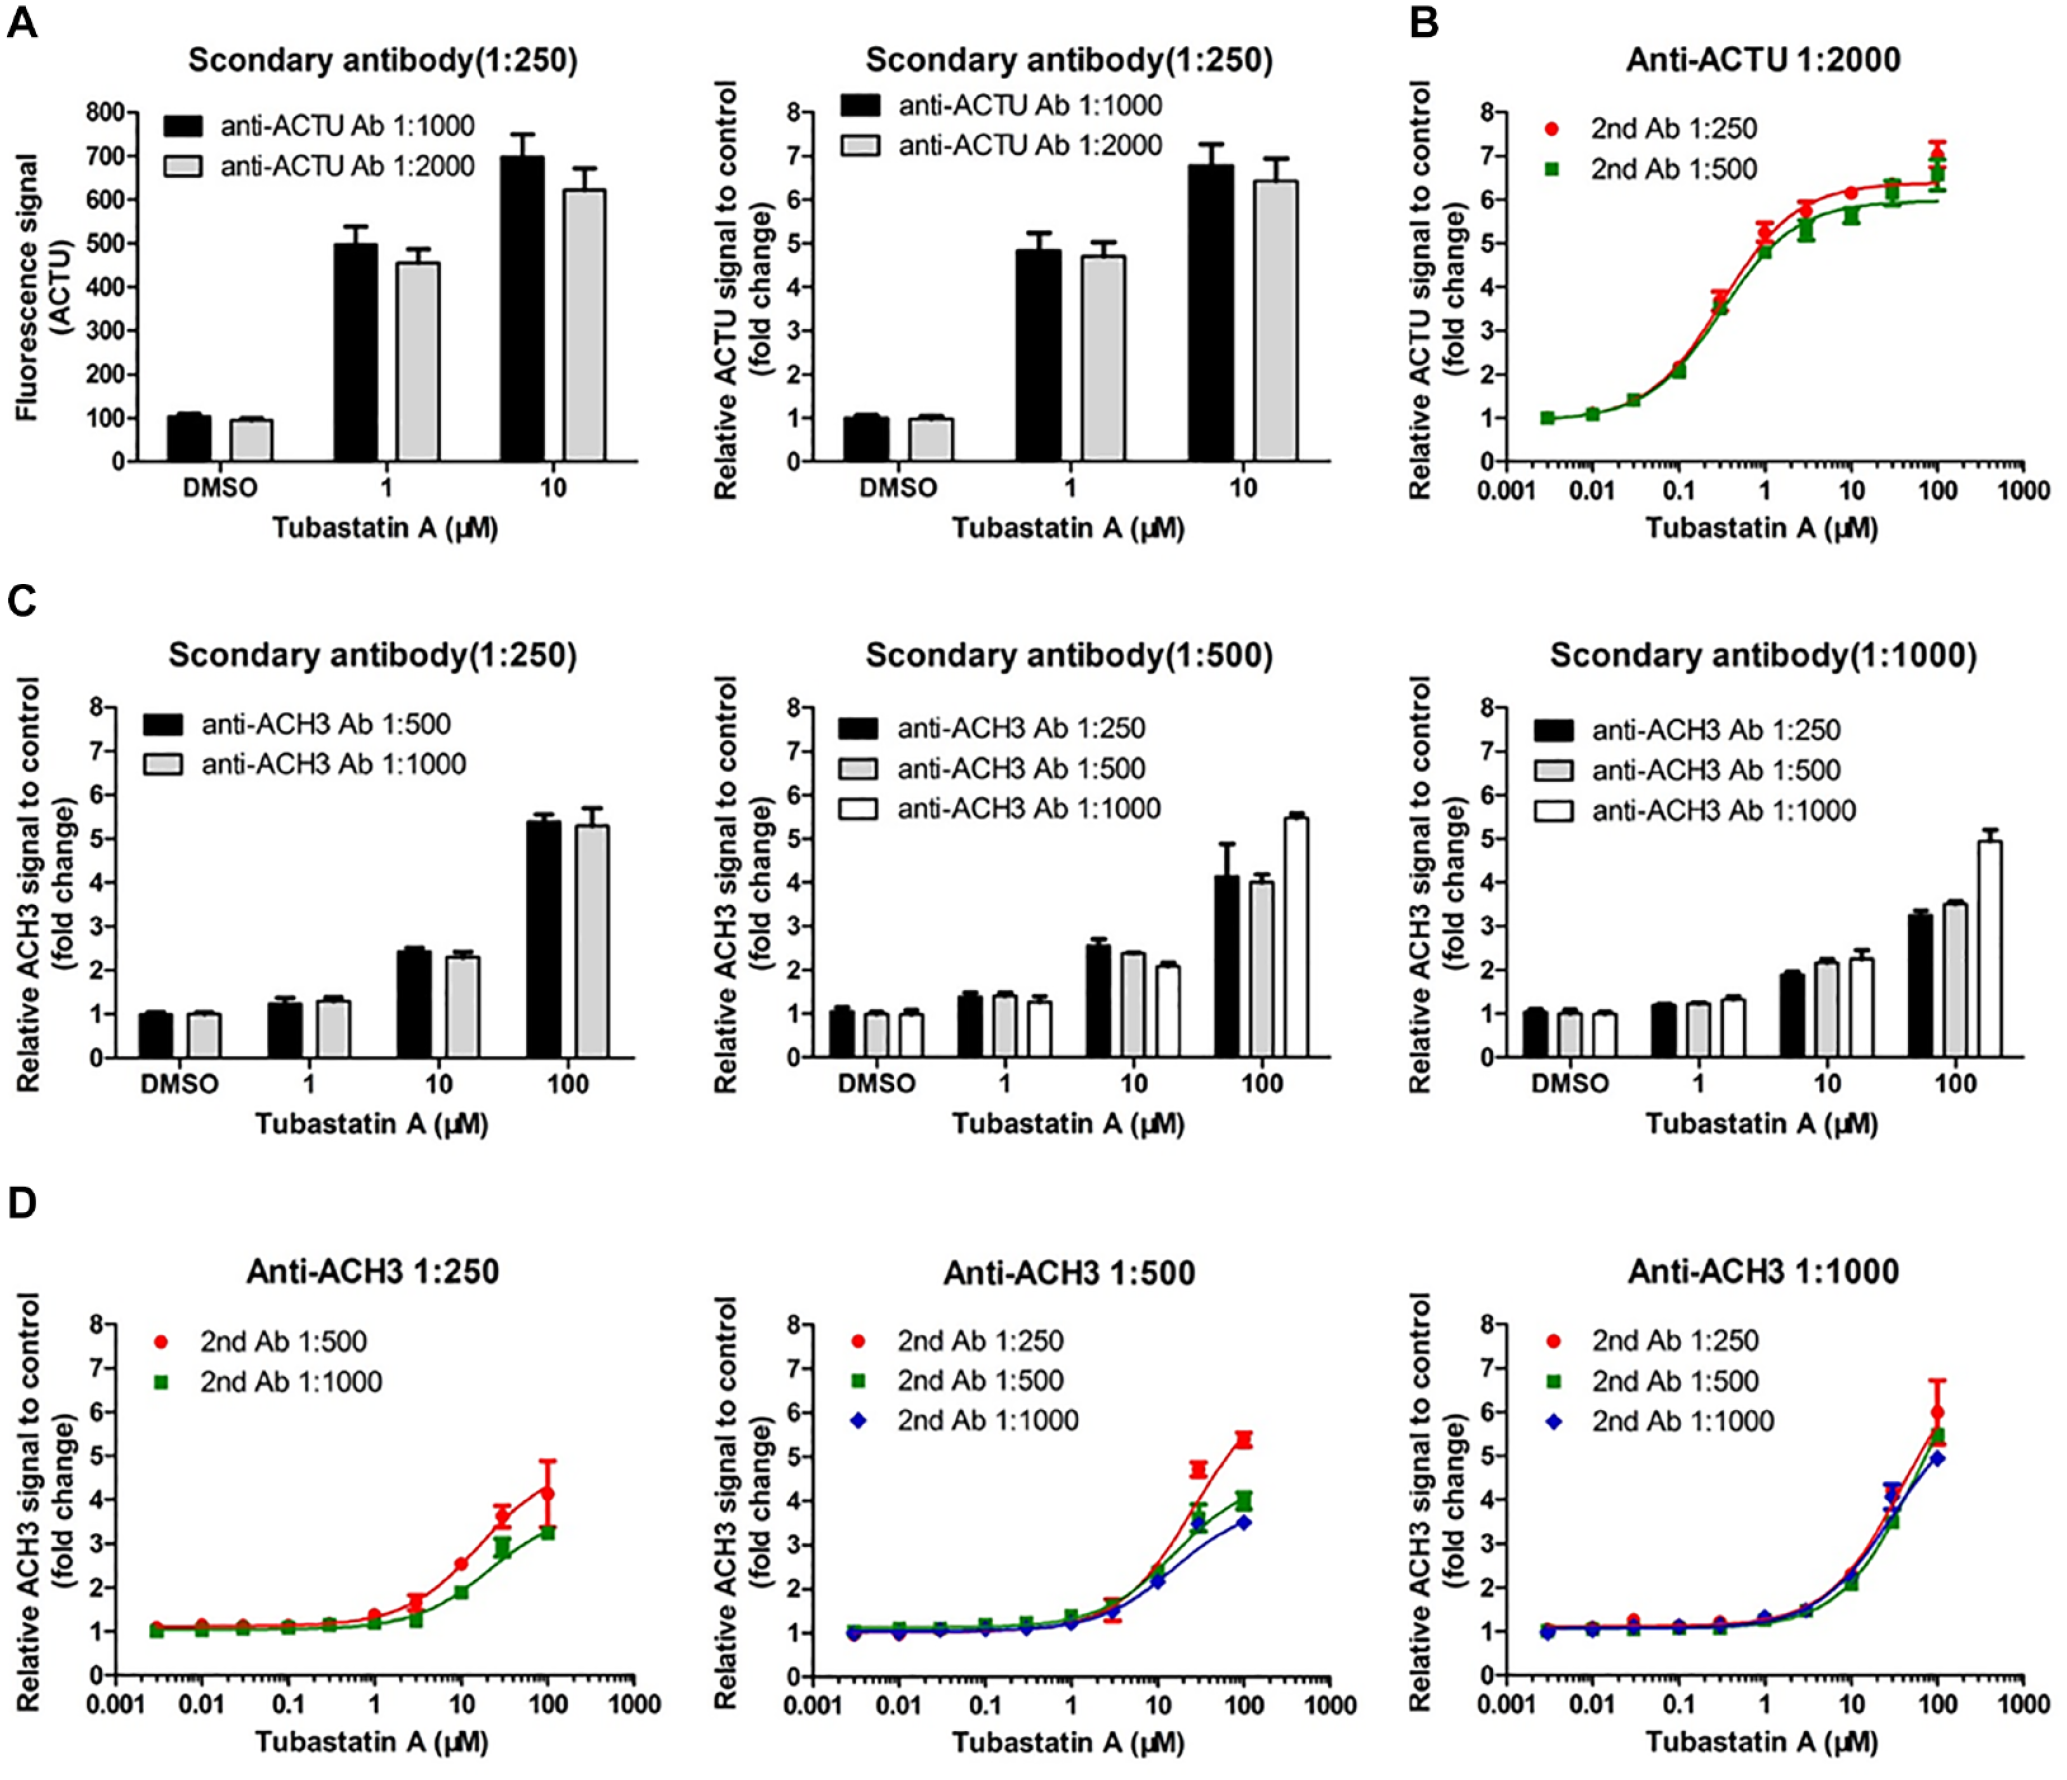
Validation of antibody dilution to minimize the background fluorescence and obtain a high assay window. (
In addition, we studied the assay window with different anti-ACH3 antibody and secondary antibody dilutions (
In summary, we have successfully established an HCA method for evaluating the acetylation of α-tubulin and histone H3. For evaluation of ACTU, cells were seeded in a 96-well plate at 5000 cells/well, treated with compounds for 6 h, fixed with 4% PFA and permeabilized with 0.1% TritonX-100, and then detected with 1:2000 dilution of anti-ACTU antibody. As for ACH3, cells were seeded in a 96-well plate at 5000 cells/well, treated with compounds for 24 h, fixed and permeabilized with ice-cold methanol, and then detected with 1:1000 dilution of anti-ACH3 antibody.
Validation of Intra- and Interexperiment Variation and Selection Index (SI)
To validate the robustness of this assay, the intra- and interexperiment variation was evaluated. The SI, which was calculated by the EC50 ratio of ACH3 to ACTU, was used to indicate the selectivity for HDAC6 over Class I HDAC isoforms. HCT116 cells were treated with indicated concentrations of Tubastatin A for 6 h and 24 h to determine the EC50 values of ACTU and ACH3 in three plates or three independent experiments. The coefficient of variation (CV) of EC50 values of ACTU and ACH3 were used to evaluate the intraexperiment or interexperiment precision. After Tubastatin A treatment in three plates of one batch of experiment, the EC50 values of ACTU ranged from 0.4949 µM to 0.5651 µM, with a CV% of 6.62% (
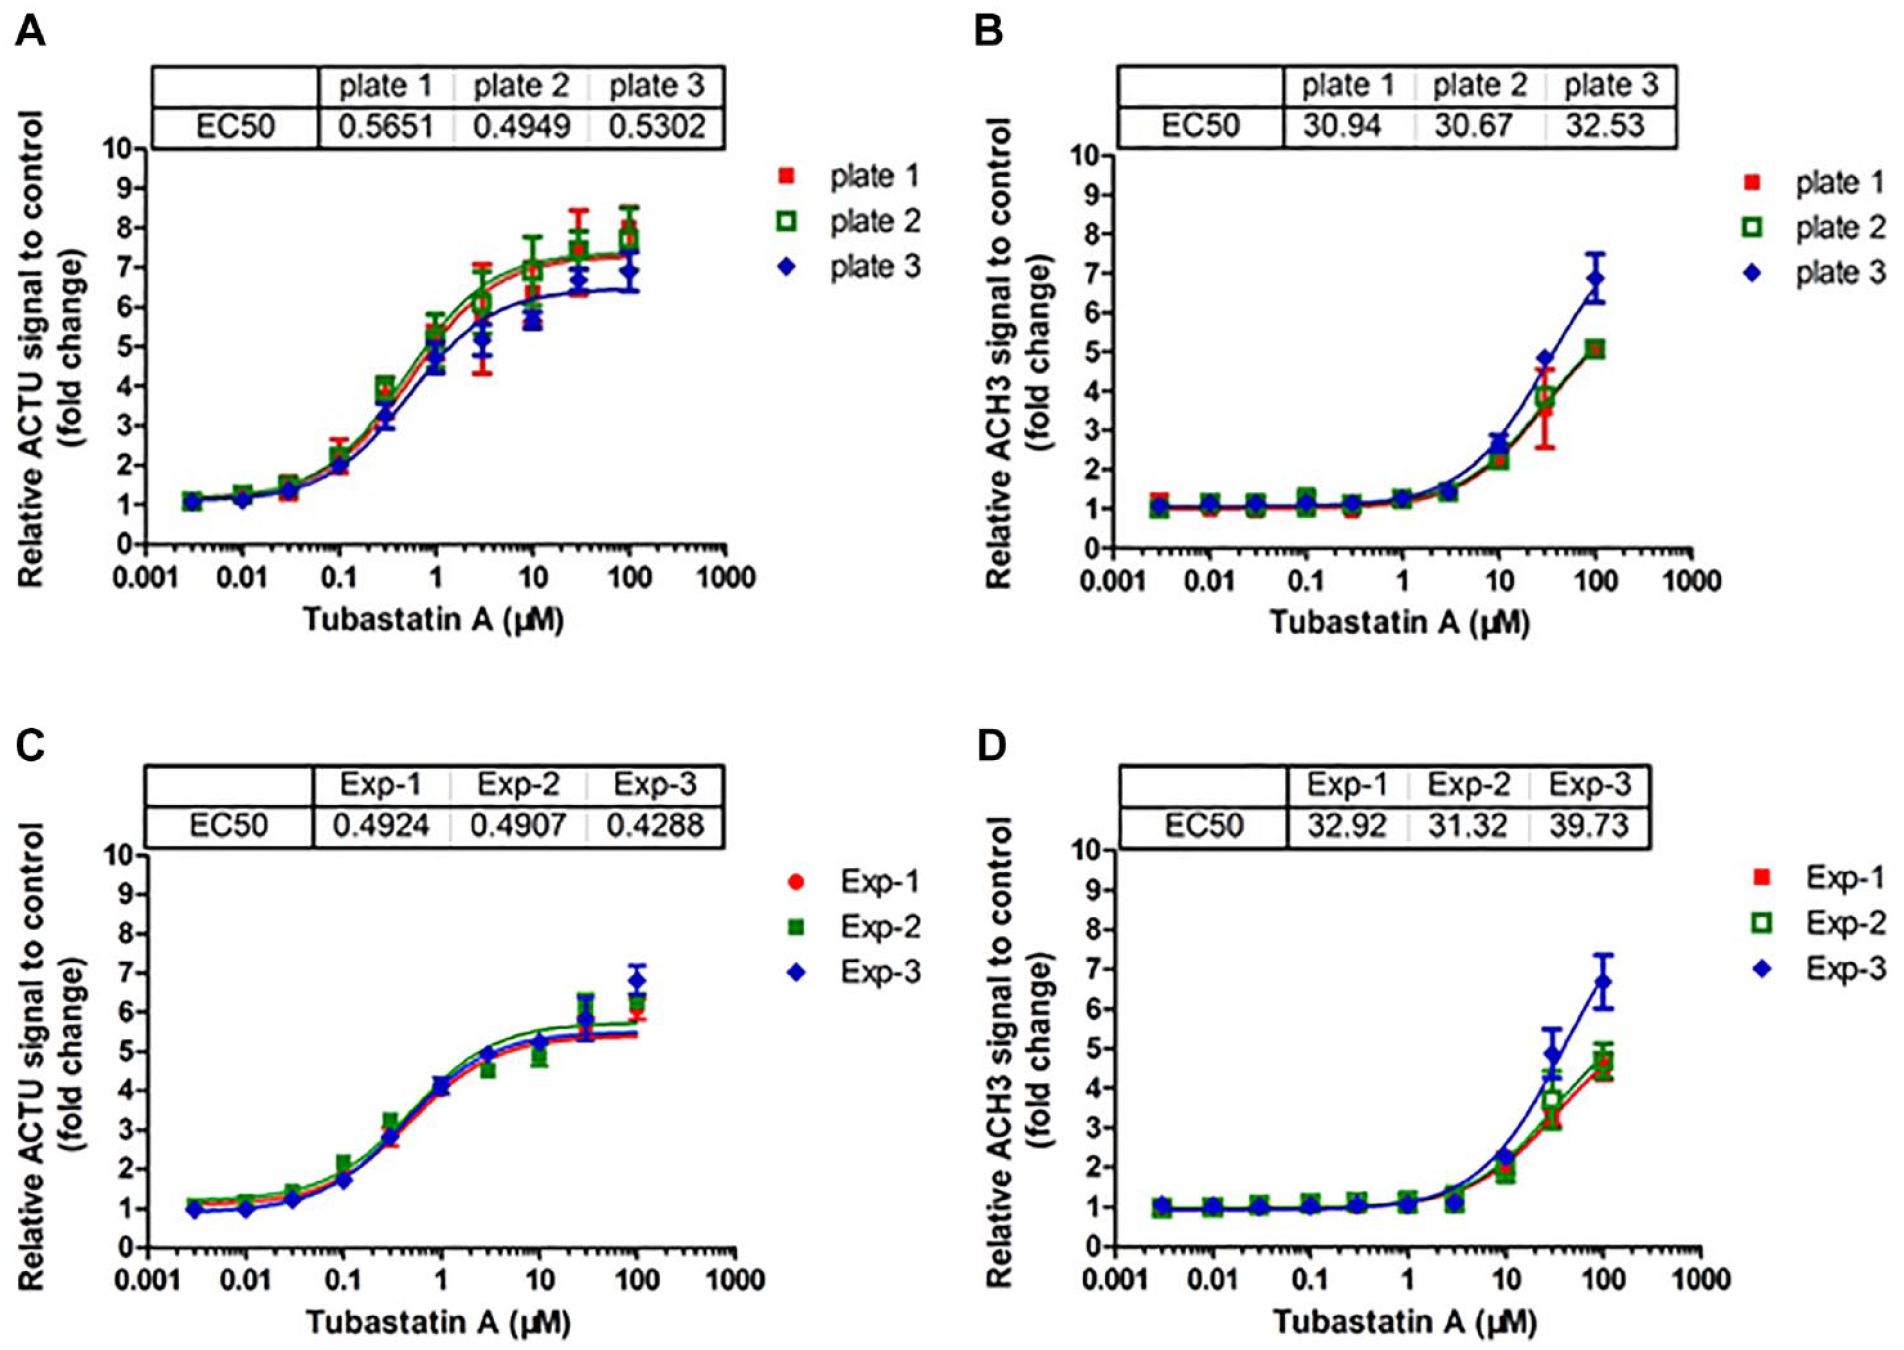
Analysis of Tubastatin A on acetylated α-tubulin (ACTU) and acetylated histone H3 (ACH3) for intra- and interexperiments. HCT116 cells were treated with 0.003–100 µM of Tubastatin A for 6 h and 24 h to analyze ACTU and ACH3, respectively, by high-content analysis (HCA) assay. The relative fold changes of ACTU and ACH3 fluorescent signals compared to the DMSO control were used to calculate the EC50 using GraphPad Prism software. (
Evaluating the Inhibitory Efficacy of HDAC Inhibitors on Different Isoforms via HCA
To further explore the specificity of the HCA assay, selective HDAC isoform inhibitors and pan-HDAC inhibitors were used as tool compounds to evaluate their inhibition of HDAC6 and Class I HDAC. Typical HDAC6-selective inhibitors (Tubastatin A, Nexturastat A,
29
ACY-1215, and ACY-241
30
) exhibited EC50s for ACTU at the sub-micromolar level (0.5819–0.7674 µM) and EC50s for ACH3 at the micromolar level (6.075–36.28 µM) (
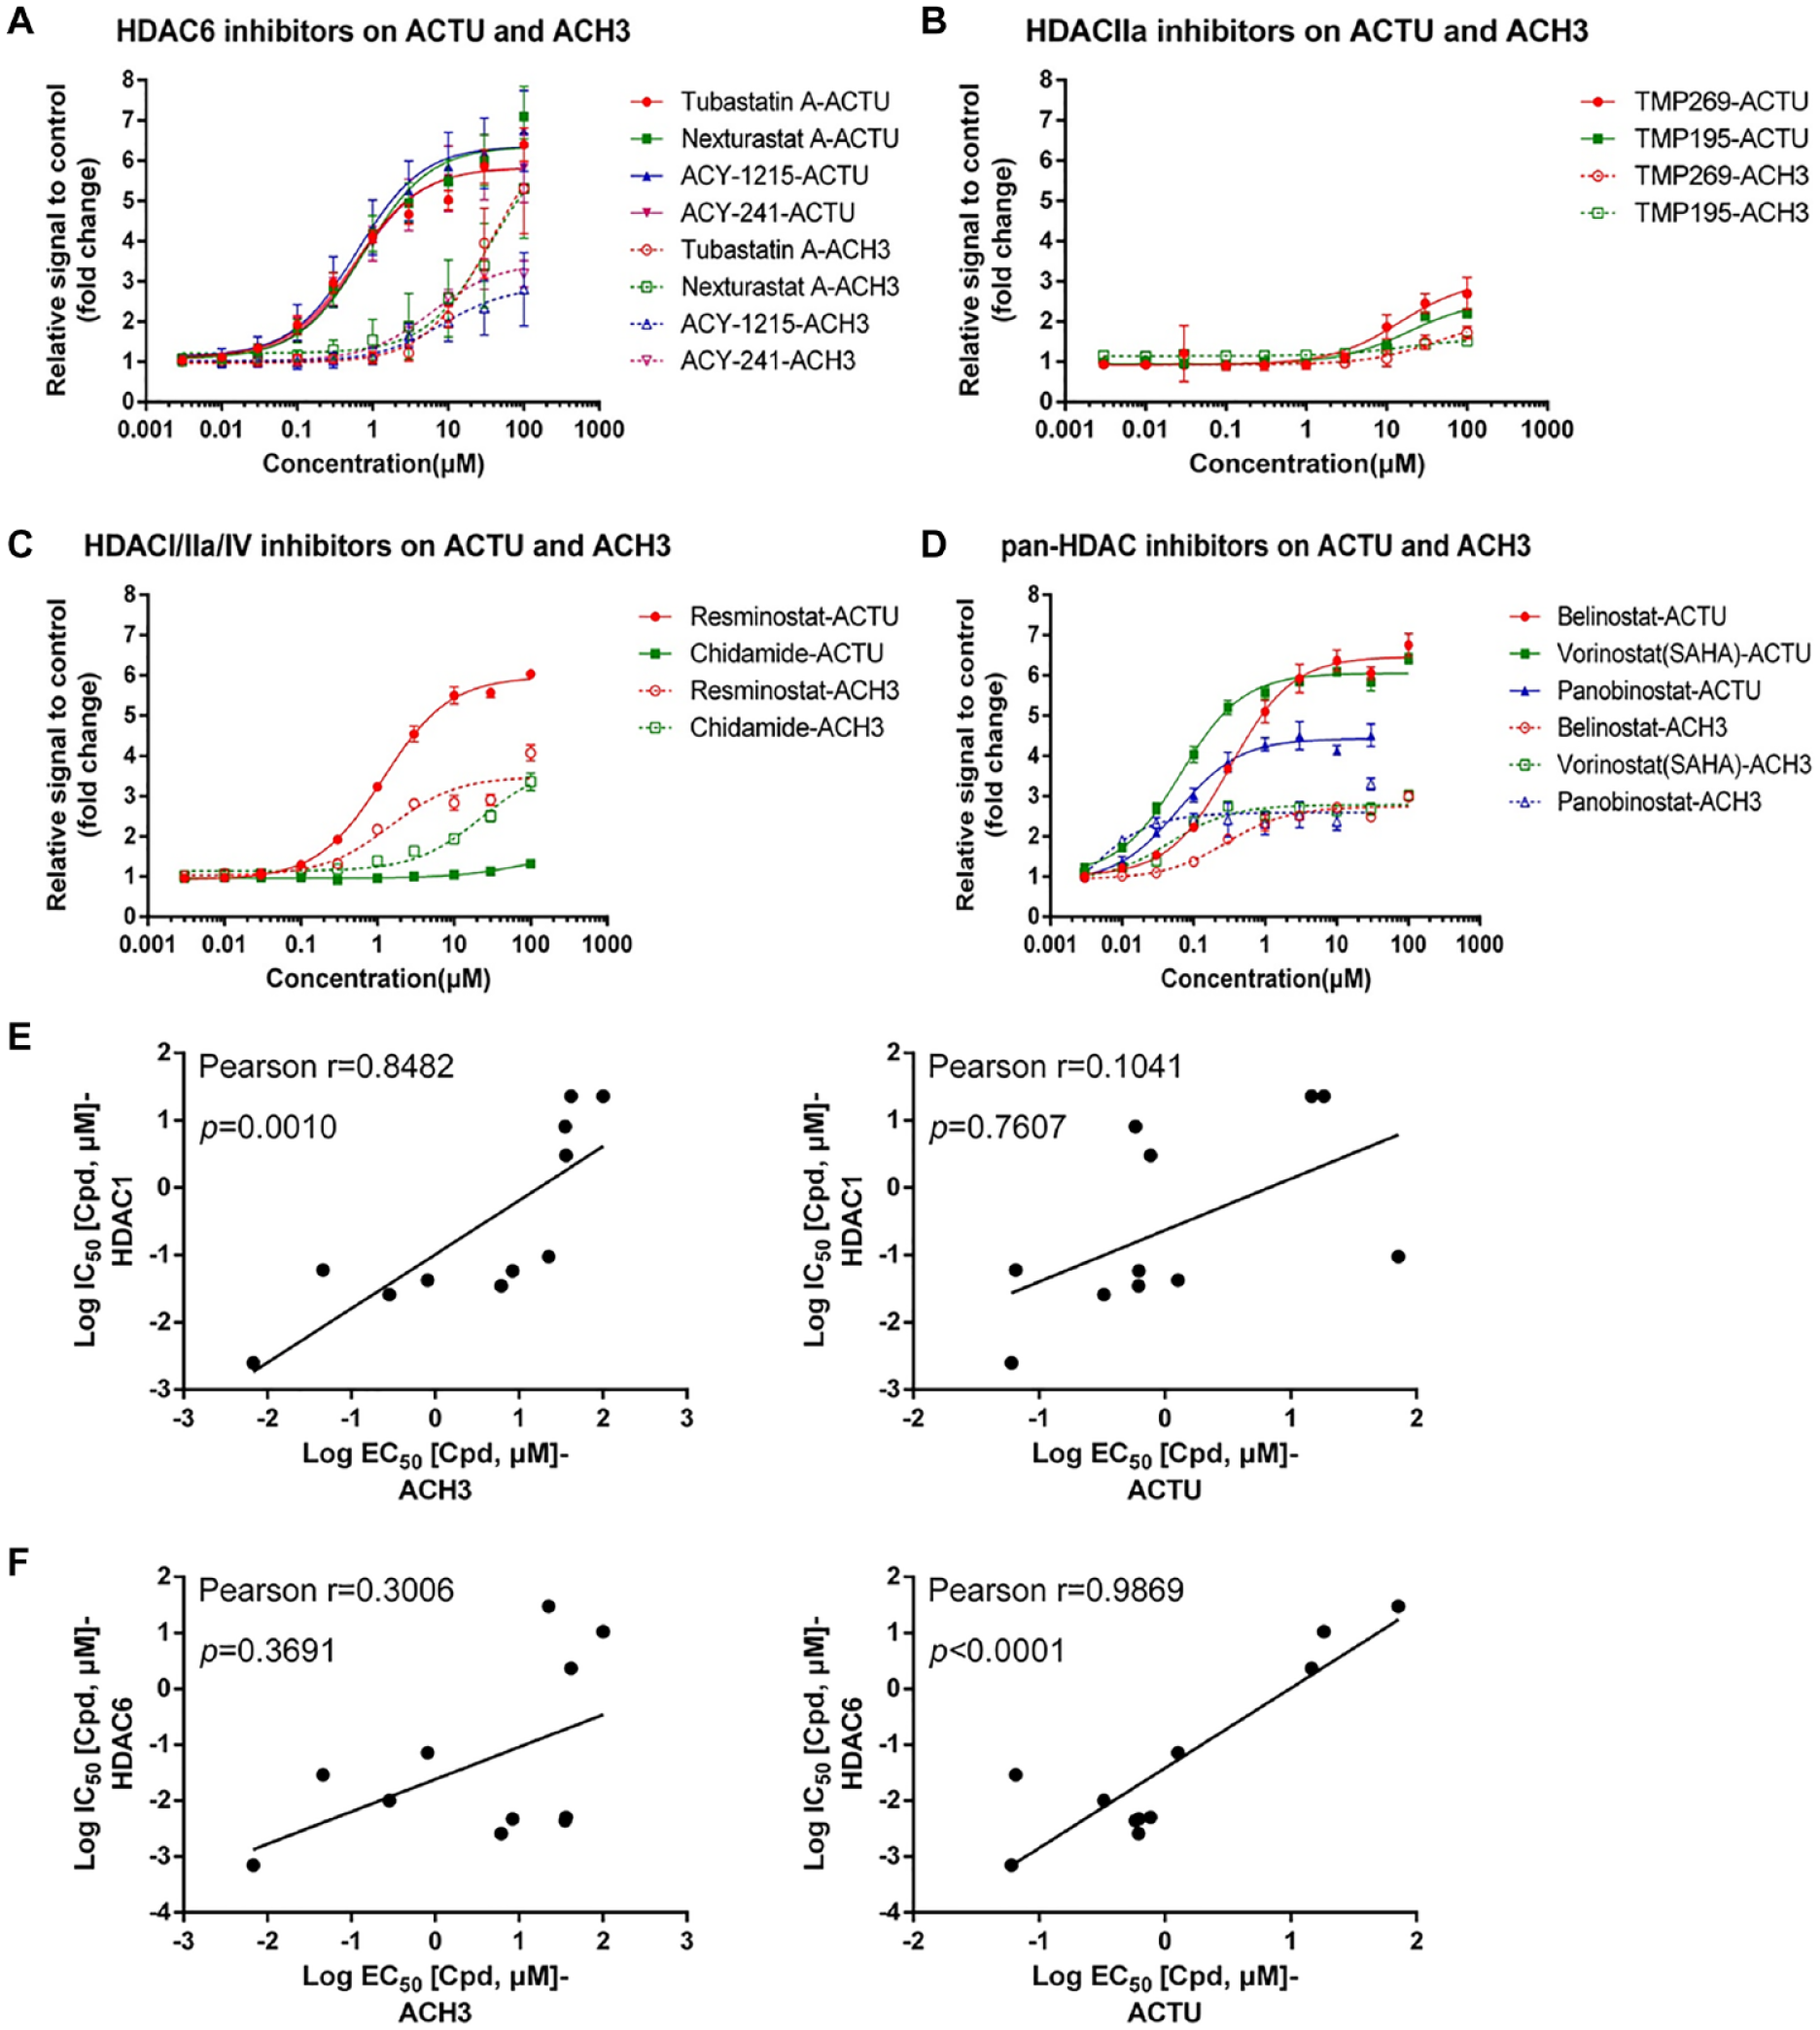
Analysis of different histone deacetylase (HDAC) inhibitors on acetylated α-tubulin (ACTU) and acetylated histone H3 (ACH3). HCT116 cells were treated with 0.003–100 µM of different HDAC inhibitors for 6 h or 24 h to determine the EC50 values of ACTU and ACH3, respectively, by high-content analysis (HCA) assay. Dose–responses curves were plotted as fold changes relative to the DMSO control. Error bars show the standard deviation from at least three replicates. Dose–response curves for ACTU and ACH3 are shown as: (
Comparison of the Differences between the EC50 Values and IC50 Vaslues.

Note: EC50 values of ACTU and ACH3 of HDAC inhibitors were calculated by HCA assay. IC50 values of HDAC inhibitors on HDAC6 and HDAC1 were compiled from indicated references. ACH3, Acetylated histone H3; ACTU, acetylated α-tubulin; HCA, high-content analysis; HDAC, histone deacetylase; IC50, half-maximum inhibitory concentration; SI, selection index.
TMP269 and TMP195 were reported as Class IIa–selective HDAC inhibitors, which have weak activities on HDAC6 and Class I HDACs.
15
We also analyzed these two inhibitors by HCA assay to evaluate their activity on ACTU and ACH3. As expected, TMP269 and TMP195 showed weak activity on ACTU and ACH3 (
Application of the HCA Assay for Screening HDAC6-Selective Inhibitors
The HCA assay was used for screening HDAC6-selective inhibitors. Compounds resynthesized from the DNA Encoded Library (DEL) were evaluated for their selectivity on HDAC6 and Class I HDAC isoforms by comparing the dose–response curve and the EC50 values of ACTU and ACH3. The selectivity for HDAC6 was compared to the reference HDAC6 inhibitors Tubastatin A and Nexturastat A. We screened nearly 300 compounds and identified several potential hit compounds. Their activity on ACTU was much higher than that of Tubastatin A and Nexturastat A, and their activity on ACH3 was similar to or lower than that of Tubastatin A and Nexturastat A, indicating that they have higher HDAC6 selectivity (
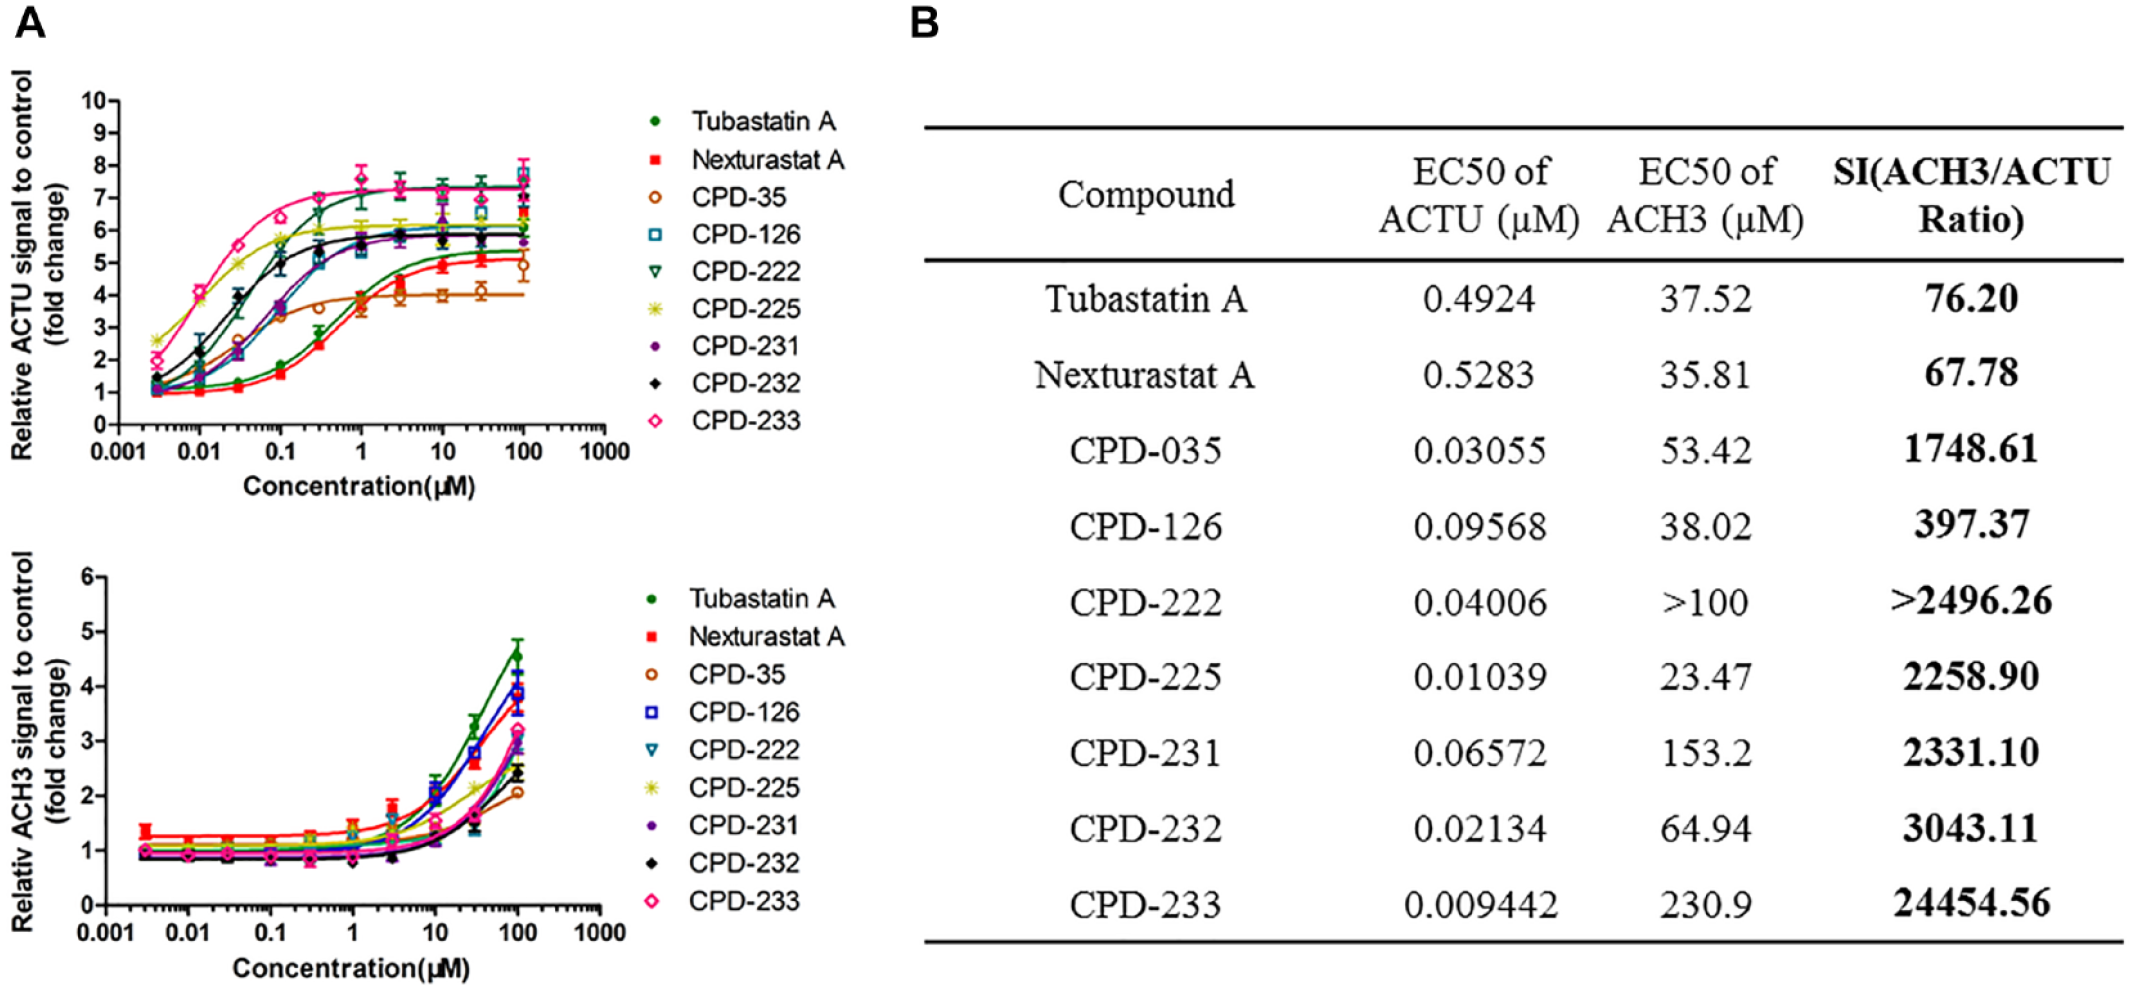
Screening of potential HDAC6-selective inhibitors with the high-content analysis (HCA) platform. HCT116 cells were treated with 0.003–100 µM of Tubastatin A and Nexturastat A, as well as potential compounds, for 6 h or 24 h, to determine the EC50 values of acetylated α-tubulin (ACTU) and acetylated histone H3 (ACH3), respectively, by HCA assay. Error bars show the standard deviation from at least three replicates. (
Discussion
We describe here an HCA assay using ACTU and ACH3 to test compounds for selectivity of HDAC6. This new screening strategy was able to predict the selectivity profile of HDAC6 inhibitors in the cell environment. Instead of fluorescence-labeled substrates generally used in biochemical assay in vitro, we detected the acetylation of endogenous natural substrates of Class I isoforms (HDAC1, 2, 3, and 8) and Class IIb HDAC6 using specific antibodies. The assay was initially validated with anti-ACTU antibody specifically recognizing the acetylation site of α-tubulin at lysine-40 (K40) and with anti-ACH3 antibody specifically recognizing the acetylation site of histone H3 at K9, K14, K18, K23, and K27. Reversible acetylation of α-tubulin at K40 is unique and conserved. 34 Although other acetylation sites of α-tubulin have been identified, many of these acetylation sites have not been confirmed in vivo, and their physiological relevance is in question. 34 In contrast, the main acetylation sites of histone H3 in most species include lysines 9, 14, 18, 23, and 27, and these acetylation sites covered the most acetylation sites of histone H3 regulated by 19 different HDAC inhibitors.2,35
After the specificity of anti-ACTU antibody and anti-ACH3 antibody has been confirmed, we also detected and quantified the dynamic changes of ACTU and ACH3 via Western blotting in HCT116 cells after treatment with pan-HDAC inhibitor panobinostat and HDAC6-selective inhibitors. Although Western blotting showed poor reproducibility, the data from Western blotting offered us some hints for how to develop and optimize the HCA assay. Several conditions that are critical for the HCA assay, such as cell seeding number, fixation, and permeabilization reagent, and antibody dilution, have been fully validated in this study. We further assessed the intra- and interexperiment variation and selection index (SI) using the reported HDAC-selective inhibitor Tubastatin A as a tool compound. The results showed that the HCA assay is a robust assay for evaluating the activity and selectivity of HDAC6 inhibitors. Moreover, four panels of HDAC inhibitors that target different isoforms were also assessed by the HCA assay. Their selectivity profiles detected from the HCA assay were consistent with previous reports.18,36 The Pearson correlation analysis confirmed that their activity on HDAC6 and HDAC1–3 was positively correlated with the acetylation of α-tubulin and histone H3, respectively. Therefore, the HCA assay should be suitable for screening not only HDAC6-selective inhibitors but also HDAC Class I–selective inhibitors. The EC50 values of ACTU and ACH3 obtained from the HCA assay were not, however, consistent with the IC50 values of HDAC6 and HDAC1 from the HDAC enzymatic assay, which may be due to the cell permeability of these inhibitors. Similar results have also been reported in the cytoblot assay, which has the same assay format as the HCA assay.
18
Cytoblot is another cell-based assay that has been successfully used in screening HDAC6-selective inhibitors previously.18,19 The major difference between cytoblot and HCA is the image scan model. Cytoblot enables plate scanning or well scanning to obtain average fluorescence or signals,
37
while HCA is more like an auto-confocal microscope system that enables multiple- or individual-cell scanning (
Since the HCA assay provided reproducible EC50 values of ACTU and ACH3, which corresponds to the inhibitory activities of HDAC inhibitors on HDAC6 and HDAC Class I isoforms, we applied the assay platform to screen active compounds and support the SAR modifications. After optimization for about 300 compounds with three different series of scaffolds, several potential HDAC6-selective compounds were identified. These compounds have a higher selective index of ACTU over ACH3 than the reference compounds Tubustatin A and ACY-1215. Based on a cellular screening model, these compounds had the desired physicochemical properties, including cellular permeability.
HCA is a powerful phenotypic screening approach that combines high-throughput automated microscopy with comprehensive image analysis to quantify multiple morphological and functional cellular features. It has been widely used in drug discovery, including screening for chemicals and toxins in lead discovery, gene function discovery [RNA inteference (RNAi) screens], understanding of the physiology of target proteins (such as G protein–coupled receptors or protein kinases) and target behaviors (such as cell motility or secretion), and screening of candidate compounds or genes that selectively act on the target.20–22,38–40 Based on HCA’s powerful phenotypic analysis ability, many HTS platforms have used HCA to screen potent molecules for drug targets, such as immunomodulatory molecules targeting nuclear factor (NF)-κB, inhibitors of glucocorticoid receptor, and selective inhibitors of histone demethylase.40–42 Even though HCA had been used to confirm the selectivity of HDAC6-selective inhibitors that screened from the HDAC enzymatic assay in a previous report, 23 it was not applied as a screening strategy to identify potent HDAC-selective inhibitors. We here reported for the first time using the HCA assay to screen HDAC6-selective inhibitors, as well as the validation and optimization details. Although multiparameter measurement can be achievable in the HCA assay, our proposed method is simplicity. We used the HCA platform only to measure the fluorescent signal in the cytoplasm or the nuclei to indicate the modification level of ACTU or ACH3, which is fast and inexpensive for drug discovery.
In conclusion, we report here an HCA assay that is useful for evaluating the activity of HDAC6 and HDAC Class I isoforms via detecting the acetylation of α-tubulin and histone H3 within the cell environment. The robustness of the HCA assay makes it suitable for screening not only HDAC6 selective inhibitors but also HDAC Class I–selective inhibitors. Importantly, the HCA assay is a cell-based assay and complements the widely used cell-free HDAC assays using artificial substrates. The HCA platform provides quantitative cellular data that can be used for SAR optimization, and it enables the development of potential candidates for further preclinical or clinical evaluation.
Supplemental Material
sj-pdf-1-jbx-10.1177_24725552211002463 – Supplemental material for Development and Validation of High-Content Analysis for Screening HDAC6-Selective Inhibitors
Supplemental material, sj-pdf-1-jbx-10.1177_24725552211002463 for Development and Validation of High-Content Analysis for Screening HDAC6-Selective Inhibitors by Yunhong Nong, Yanyan Hou, Yuting Pu, Si Li and Yan Lan in SLAS Discovery
Footnotes
Acknowledgements
The authors are grateful to Dr. Xiaoyun Meng, Dr. Chong Yuan, Dr. Jing Hu, Dr. Xiaodong Zhang, and Ying Zhao for their critical review of the manuscript, and to colleagues from the Discovery Project Unit for their contributions to the projects.
Supplemental material is available online with this article.
Declaration of Conflicting Interests
The authors declared no potential conflicts of interest with respect to the research, authorship, and/or publication of this article.
Funding
The authors received no financial support for the research, authorship, and/or publication of this article.
References
Supplementary Material
Please find the following supplemental material available below.
For Open Access articles published under a Creative Commons License, all supplemental material carries the same license as the article it is associated with.
For non-Open Access articles published, all supplemental material carries a non-exclusive license, and permission requests for re-use of supplemental material or any part of supplemental material shall be sent directly to the copyright owner as specified in the copyright notice associated with the article.