
Abstract
RNA interfering (RNAi) screening strategies offer the potential to elucidate the signaling pathways that regulate integrin and adhesion receptor-mediated changes in T lymphocyte morphology. Of crucial importance, however, is the definition of key sets of parameters that will provide accurate, quantitative, and nonredundant information to flag relevant hits in such assays. In this study, the authors have used an image-based high-content analysis (HCA) technology platform and a panel of 24 pharmacological inhibitors, at a range of concentrations, to define key sets of parameters that enables sensitive and quantitative effects on integrin (LFA-1)–mediated lymphocyte morphology to be evaluated. In particular, multiparametric analysis of lymphocyte morphology that was based on intracellular staining of both the F-actin and α-tubulin cytoskeleton resulted in improved ability to discriminate morphological behavior compared to F-actin staining alone. Morphological and fluorescence intensity/distribution profiling of pharmacologically treated lymphocytes stimulated with integrin (LFA-1) and adhesion receptors (CD44) also revealed notable differences in their sensitivity to inhibitors. The assay described here may be used in HCA strategies such as RNAi screening assays to elucidate the signaling pathways and molecules that regulate integrin/adhesion receptor-mediated T lymphocyte polarization.
Introduction
T
Important cell surface molecules that are required for the recruitment of T lymphocytes into inflamed tissues are the αLβ2 integrin receptor leukocyte function–associated antigen-1 (LFA-1) and the adhesion receptor CD44. 3,4 Stimulation of T lymphocytes through LFA-1 or CD44 (by their ligands ICAM-1 or hyaluronan, respectively, that are immobilized on endothelial cells that line blood vessel walls) induces a migratory phenotype whereby the T lymphocyte undergoes rapid changes in cytoskeletal morphology that permits the cell to convert mechanical forces into net cell locomotion. 5-7 Motile T lymphocytes, including cells stimulated through LFA-1 or CD44, move in an amoeboid-like fashion and display a polarized morphology with 2 distinct cell compartments: the leading edge and the trailing tail or uropod. 6-8 The importance of LFA-1 and CD44 in the inflammatory response has been demonstrated using knockout mice. 9-12
T lymphocyte migration is a process that is characterized by dynamic cycles of cytoskeletal assembly, reorganization, and disassembly of the actin and microtubule cytoskeletons. Relatively little is known, however, about the mechanisms that control cytoskeletal-mediated T lymphocyte polarization and migration. RNA interfering (RNAi) screening strategies offer the potential to elucidate the signaling pathways that regulate integrin and adhesion receptor-mediated changes in T lymphocyte polarization. Of crucial importance, however, is the definition of key sets of parameters that will provide accurate, quantitative, and nonredundant information to flag relevant hits in such assays. A number of image analysis strategies have been proposed for the identification of cell morphology changes in cell-based assays and screens. All share the goal of choosing the minimum subset of morphology parameters that will identify the desired assay readout with the most accuracy. Many use complex machine learning algorithms where images of normal and positive control cells are used to train an image analysis program to identify “hits” in the assay. This approach is undoubtedly a powerful one and is the appropriate choice for many clearly defined morphology assays. 13,14 However, this is a complex approach requiring specialist programs and programming expertise beyond the abilities of many cell biologists. In addition, machine learning approaches will only flag hits that the program was pretrained to identify and is thus not ideal for screens where many different events are potentially of interest. Cell morphology assays are one example where many different cell shapes can result from RNAi screens or drug treatment, and flagging all of these and grouping them in similar morphology groups can be of great value in subsequent characterization studies.
We have used an image-based high-content analysis (HCA) technology platform in combination with a panel of 24 pharmacological inhibitors, with known or suspected effects on the cytoskeleton, to define key sets of parameters that identify and quantify the morphological changes that occur when T lymphocytes are stimulated through the integrin LFA-1. We show that our multiparametric analysis results in improved ability to discriminate morphological behavior and also reveals notable differences in lymphocyte sensitivity to pharmacological inhibitors when stimulated with integrin (LFA-1) and adhesion receptors (CD44). As such, the assay described here may be used in HCA strategies such as RNAi screening assays to dissect the role of signaling molecules in integrin/adhesion receptor-mediated T lymphocyte polarization.
Materials and Methods
Reagents
The following pharmacological inhibitors were obtained from Merck Biosciences (Nottingham, UK): Go6976, rottlerin, Ro-31-8220, bisindolymaleimide, staurosporine, UCN-01, H-89, calyculin A, okadaic acid, genistein, rapamycin, SB203580, PD95089, U0126, and MG132. LY294002 was purchased from Alexis (Nottingham, UK). DMSO, wortmannin, paclitaxel, nocodazole, cytochalasin D, cyclosporine A, brefeldin A, AG490, lithium chloride, poly L-lysine, anti-α tubulin, goat antimouse IgG, goat antihuman Fc-specific IgG, and phalloidin-TRITC were obtained from Sigma (St. Louis, MO). The anti-LFA-1 antibody that recognizes the αL chain of the LFA-1 receptor (clone SPV-L7) and induces T cell polarization was obtained from Monosan (Uden, The Netherlands). Recombinant human ICAM-1-Fc fusion protein (ICAM-1) was obtained from R&D Systems (Oxford, UK). The IM7.8.1 hybridoma cell line that produces a monoclonal antibody against the CD44 receptor was obtained from the American Type Culture Collection (Manassas, VA). AlexaFluor goat antimouse 488 was obtained from Molecular Probes (Eugene, OR).
T lymphocyte culture and morphology assay
The HuT-78 human lymphoma T cell line was obtained from the American Type Culture Collection and was cultured according to the suppliers’ recommendations. We used our in vitro model of T lymphocyte migration whereby HuT-78 T lymphocytes polarize when incubated with immobilized anti-LFA-1, recombinant ICAM-1 (the natural ligand for LFA-1), or anti-CD44. 7 HuT-78 polarization assays were set up in duplicate in 96-well plates (Nunc) that were precoated with plate-bound anti-LFA-1, recombinant ICAM-1, anti-CD44, or poly L-lysine as an adhesion control. For anti-LFA-1 or anti-CD44 polarization assays, the wells were coated with 5 µg/mL of goat antimouse IgG in sterile phosphate-buffered saline (PBS) and incubated overnight at 4°C. Unbound antibody was removed and anti-LFA-1 (1/1000 dilution in sterile PBS) or anti-CD44 antibody (1/50 dilution of hybridoma solution in sterile PBS) was added to the wells. ICAM-1-stimulated HuT-78 polarization assays were set up as described above except that 5 µg/mL of goat antihuman Fc-specific IgG was first used to coat the wells, and ICAM-1 was used at a final concentration of 1 µg/mL. Poly L-lysine was used at a final concentration of 0.01% w/v. After a 2-h incubation at 37°C, unbound solution was removed, and the wells were washed gently with sterile PBS. HuT-78 T cells (at a density of 1 × 10⁵ cells/mL in complete medium) were incubated for 30 min at 37°C with the indicated concentration of pharmacological inhibitor or DMSO drug solvent control before being plated into the ligand-coated 96-well plates. ICAM-1-stimulated cells also contained 5 mM MgCl2 and 1.5 mM EGTA in the medium to induce the high-affinity form of the LFA-1 receptor, which mimics chemokine-induced LFA-1 activation. 3 Each 96-well plate contained samples containing DMSO control pretreated cells. The plates were then incubated for 3 h at 37°C to allow the cells develop a polarized morphology. The cells were subsequently fixed by gently adding an equal volume of prewarmed (37°C) 8% paraformaldehyde for 15 min at 37°C. The cells were then permeabilized with 0.3% Triton X-100 in PBS for 5 min before being blocked with 3% bovine serum albumin (BSA)/PBS for 30 min. The cells were then stained with anti-α-tubulin (1/1000 dilution) for 1 h before being washed 3 times in PBS/0.05% Tween-20. The plates were then incubated with AlexaFluor goat antimouse 488 (to detect α-tubulin), phalloidin-TRITC (F-actin stain), and Hoechst 33258 (nuclear stain) for 30 min in the dark (the above solutions were combined together before adding to the wells). After 3 washes in PBS/0.05% Tween-20, the plates were resuspended in PBS and stored at 4°C in the dark until further analysis.
Image capture, image analysis, and data processing
The 96-well plates were imaged using the InCell 1000™ Analyzer Cellular Imaging and Analysis platform (GE Healthcare, Piscataway, NJ). A total of 15 fields per well were imaged under 10× magnification, and 10 fields per well were imaged under 20× magnification using 3 separate filters to capture the nucleus (blue), α-tubulin (green), and F-actin (red), respectively. Image analysis was performed using the InCell Morphology 1 analysis software. This software detects cells for morphology analysis by nuclear dye uptake, with quantification of cellular morphologies and fluorescent intensities determined from 1 or more intracellular stains (e.g., α-tubulin or F-actin). Morphological and fluorescence intensity staining parameters were automatically recorded for every cell in the field, and these parameters were also automatically recorded numerically as average values per field and average values per well. Morphological and fluorescence intensity/distribution parameters that were recorded included 1/(form factor), cell area, cell gyration radius, cell/nuclear area, nuclear displacement, cytoplasm intensity, nuclear intensity, intensity (nucleus and cytoplasm, N + C), IxA (nucleus and cytoplasm, N + C), intensity coefficient of variation (CV), nuclear intensity CV, and cell count. The definitions of these parameters are described in Tables 1 and 2 . Background fluorescence was subtracted for fluorescence intensity measurements. The data were normalized (multiplicative) with respect to normal migration control data on each plate (e.g., DMSO control pretreated cells on anti-LFA-1, ICAM-1, or anti-CD44), and imported into the Spotfire™ software program (Tibco, Palo Alto, CA) or KNIME. The data were then represented pictorially as a heat map using a continuous coloring method. In particular, normal migration control data were colored in black, whereas pharmacological treatments that decreased or increased individual parameters with respect to normalized migration control data were automatically represented as different shades of green or red rectangles, respectively.
Description of InCell 1000™ Morphological Parameters and Quantification of HuT-78 T Lymphocyte Polarization following Anti-LFA-1 Stimulation
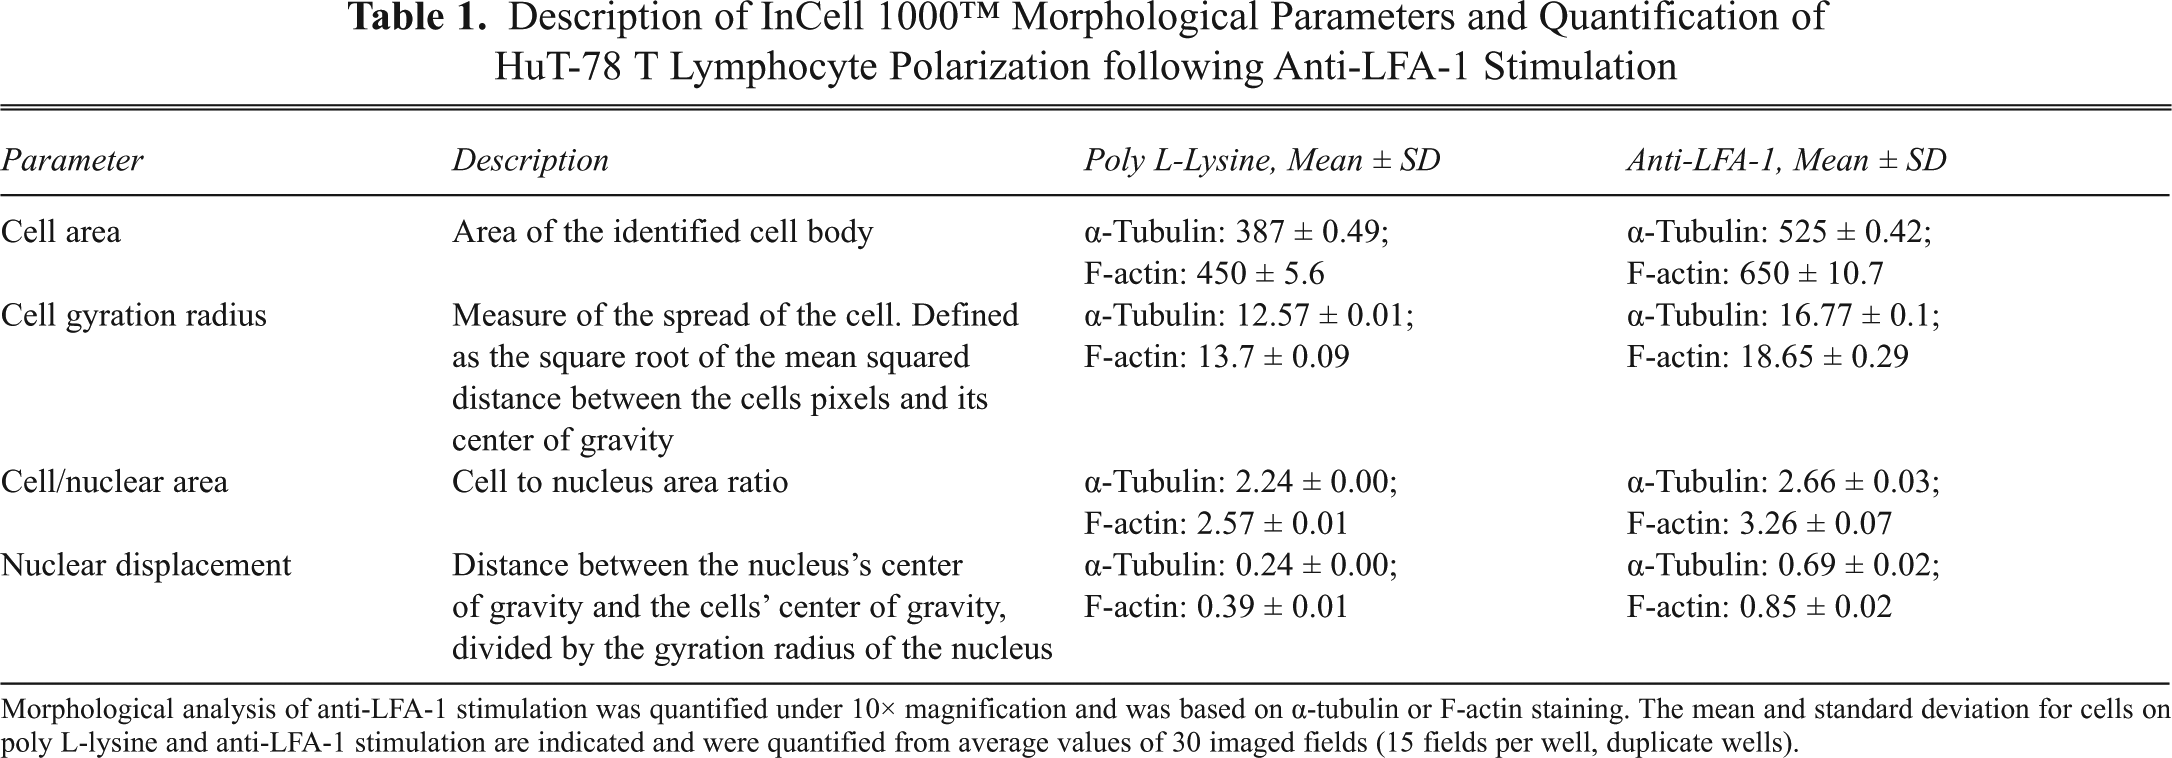
Morphological analysis of anti-LFA-1 stimulation was quantified under 10× magnification and was based on α-tubulin or F-actin staining. The mean and standard deviation for cells on poly L-lysine and anti-LFA-1 stimulation are indicated and were quantified from average values of 30 imaged fields (15 fields per well, duplicate wells).
Description of InCell 1000™ Fluorescence Intensity Parameters and Quantification of HuT-78 T Lymphocyte Fluorescence Intensity Values following Anti-LFA-1 Stimulation
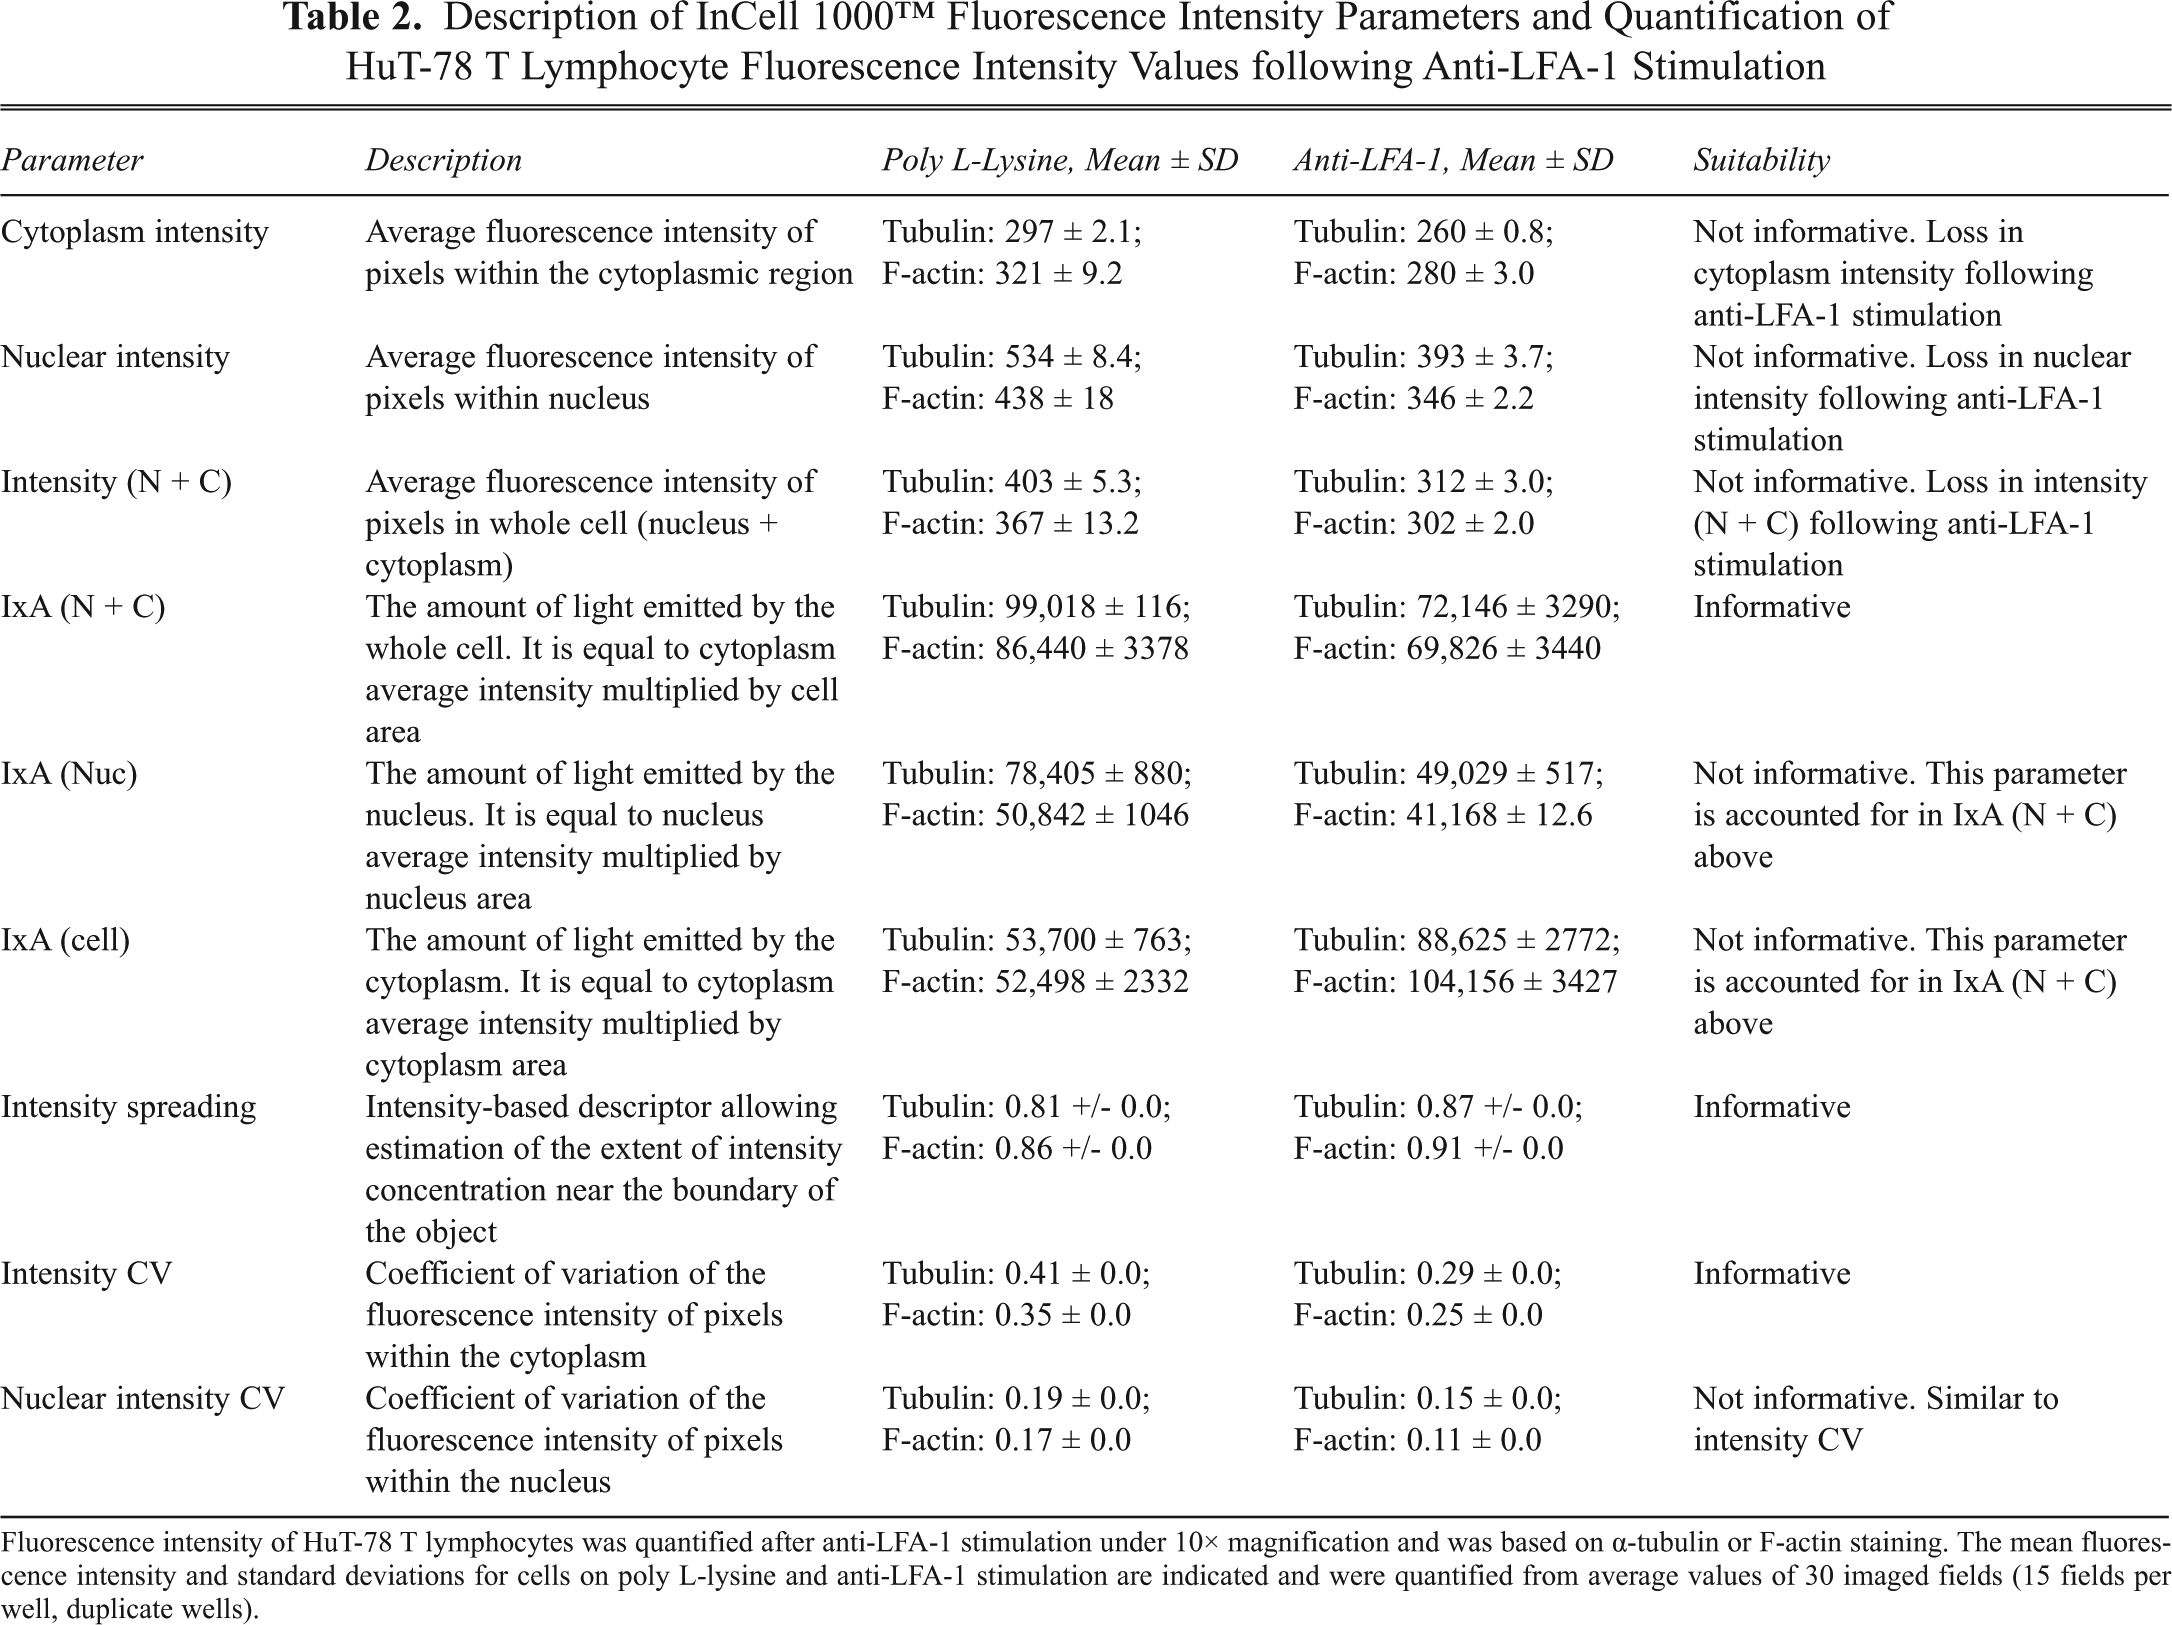
Fluorescence intensity of HuT-78 T lymphocytes was quantified after anti-LFA-1 stimulation under 10× magnification and was based on α-tubulin or F-actin staining. The mean fluorescence intensity and standard deviations for cells on poly L-lysine and anti-LFA-1 stimulation are indicated and were quantified from average values of 30 imaged fields (15 fields per well, duplicate wells).
Heat map clustering and analysis
Prior to hierarchical clustering, normalized data were further rescaled by performing a robust Z score normalization for each parameter. The Z score is a commonly used scoring metric in screens 15 and in this case also ensured that the clustering was not affected by the ranges of the different parameter values. The robust form of the Z score was used to minimize the skewing effects of outliers and used the following formula:

where x is an individual value for 1 parameter, Median is the median of all of the values for 1 parameter, and MAD is the median absolute deviation of all of the values for 1 parameter. The normal Z score expresses a sample value as the distance from the mean in multiples of the standard deviation, thus allowing a Z score cutoff to have statistical meaning. MAD is related to the standard deviation as follows (for normally distributed values): SD = 1.4826MAD, and where necessary, this modified version of MAD was used. Z score–transformed values were then clustered using an unsupervised agglomerative clustering method with an average linkage and a Euclidian distance measurement. Hierarchical clustering of the profiles was carried out using KNIME, which is a modular open-source data manipulation and visualization program (www.knime.org). The clustering step used the KNIME “new hierarchical clustering” node, and data were visualized using the “dendrogram with heat map” node version 0.3.0. The data were clustered using an unsupervised agglomerative method with clusters being defined using average linkage, and clusters were subsequently leaf ordered.
Statistical analysis
Statistical analysis was performed using the 2-tailed Student t test. Effects were deemed to be significant at p < 0.05.
Results
Multiparametric morphological analysis of LFA-1-mediated T lymphocyte polarization using an HCA platform
We used an HCA platform to analyze the morphological change that occurs following LFA-1-mediated T lymphocyte stimulation ( Fig. 1 ). Our in vitro model of T lymphocyte polarization was used whereby HuT-78 T lymphocytes polarize and adopt a migratory phenotype when incubated with immobilized anti-LFA-1 or recombinant ICAM-1 (the natural ligand for LFA-1). 7 Morphological analysis was based on fluorescent staining of the F-actin and α-tubulin cytoskeleton. We initially chose the 1/(form factor) morphology parameter to quantify LFA-1-stimulated polarization. The 1/(form factor) is a cell roundness index, with values ranging from 1 to infinity, where 1 is a perfect circle. The 1/(form factor) increases as the cells adopt a migratory phenotype and is thus a good measure of shape change. A significant increase in 1/(form factor) was observed when cells were stimulated with anti-LFA-1 compared to cells incubated on poly L-lysine when morphological analysis was based on α-tubulin staining (poly L-lysine = 1.23 ± 0.002, anti-LFA-1 = 1.78 ± 0.001, p = 0.00001). An increase in 1/(form factor) was also observed when morphological analysis was based on F-actin staining (poly L-lysine = 1.37 ± 0.007, anti-LFA-1 = 2.127 ± 0.004, p = 0.00006). A less polarized phenotype was observed ( Fig. 1 , right panels) and quantified when HuT-78 T lymphocytes were stimulated using immobilized recombinant ICAM-1 (1.38 ± 0.01 and 1.55 ± 0.009 for α-tubulin and F-actin staining, respectively; p = 0.002 for both). This less pronounced phenotype is possibly due to differences in the affinities of these ligands for the LFA-1 receptor or to the fact that these ligands bind to distinct sites on the receptor. It should be noted that the 1/(form factor) values were also slightly higher when analysis was based on F-actin staining compared to α-tubulin staining. This likely reflects the fact that the F-actin cytoskeleton is distributed more toward to the periphery of the cell and into lamellipodia, leading to a more complex shape for analysis ( Fig. 1 , white arrows).
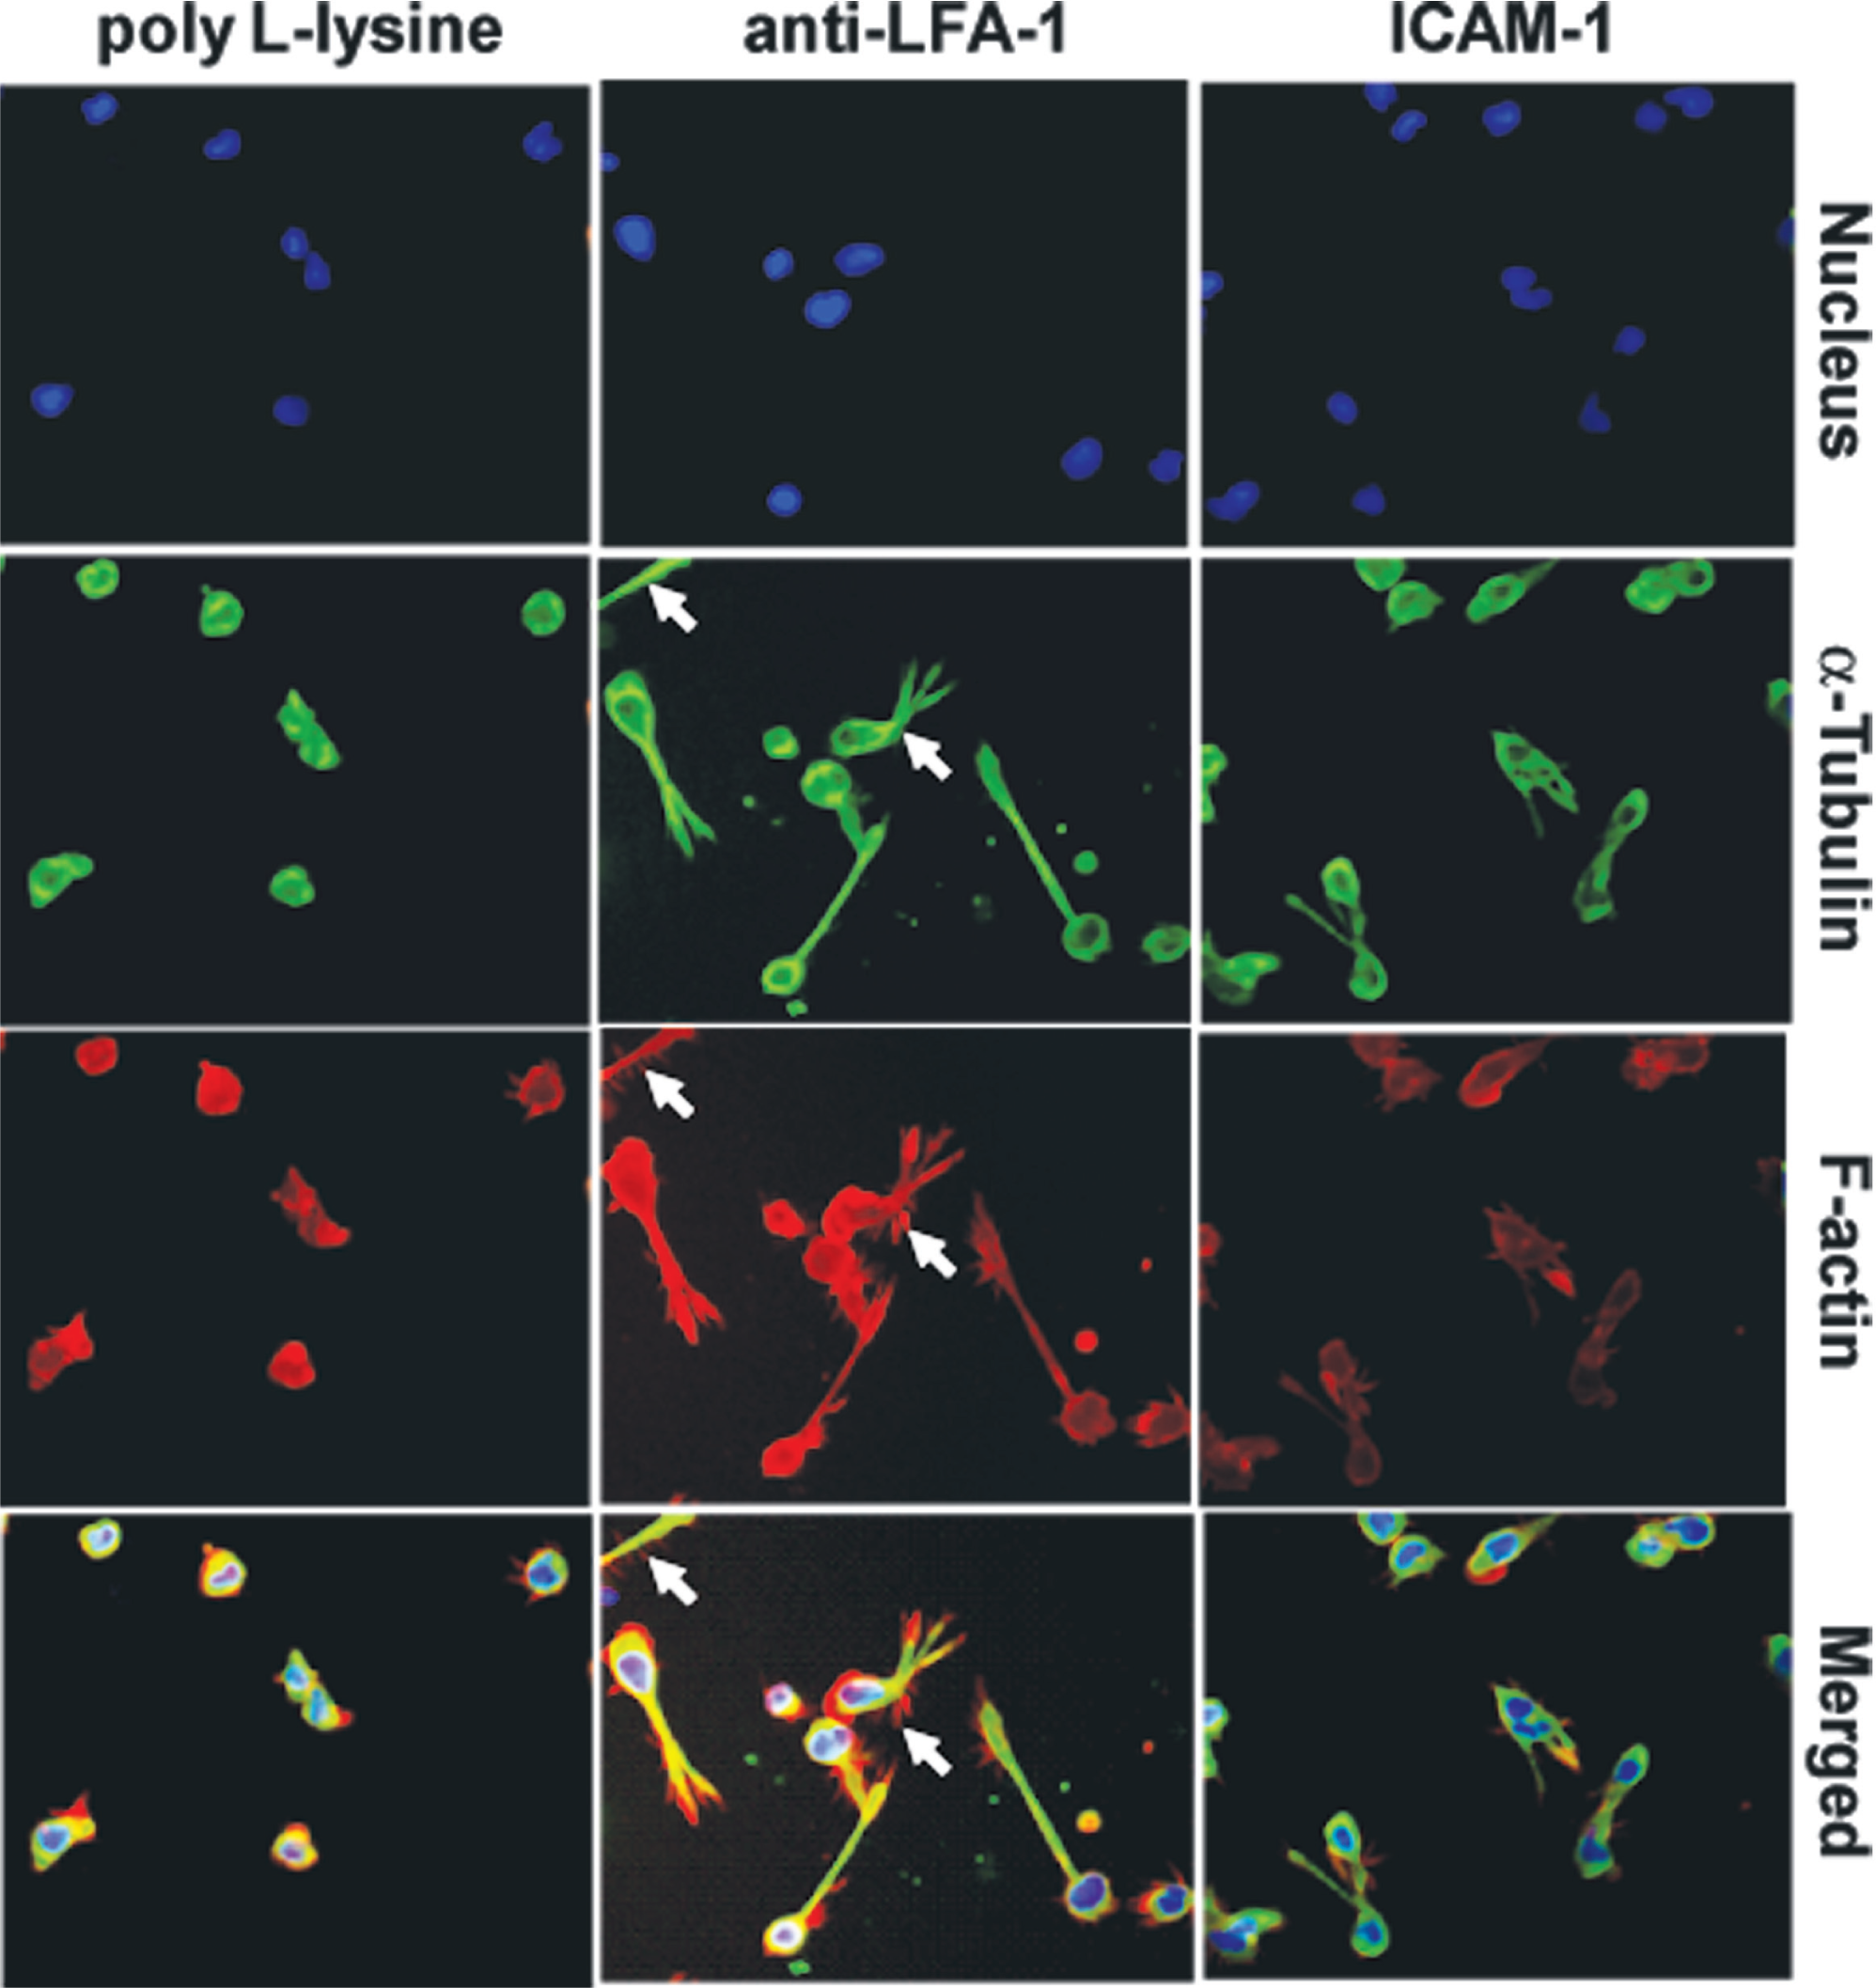
Stimulation of HuT-78 T lymphocytes through the LFA-1 receptor induces polarization and a migratory phenotype. HuT-78 T cells were incubated on poly L-lysine as a nonpolarization control or stimulated with immobilized anti-LFA-1 antibodies or recombinant ICAM-1. Migration, subsequent cell staining for F-actin/α-tubulin, and image analysis were carried out as described in the Materials and Methods. The white arrows indicate F-actin-rich lamellipodia.
To generate a range of different changes in cell morphology and cytoskeletal arrangement, we challenged the cells with a panel of 24 pharmacological inhibitors that are known or suspected to disrupt arrangement of the cytoskeleton and cell signaling. Each pharmacological inhibitor was tested at 3 different concentrations. The putative targets of these inhibitors and the concentrations at which they were used at in this study are outlined in Supplementary Table S1. The concentration range that we chose for each of these inhibitors was based on studies from the published literature. Morphological analysis was quantified using the 1/(form factor) parameter and based on F-actin staining. The effect of these pharmacological inhibitors on anti-LFA-1-mediated polarization was varied. We observed that certain compounds inhibited anti-LFA-1-mediated T lymphocyte shape change in a dose-dependent manner (e.g., Go6976, nocodazole, and calyculin A), whereas other compounds such as cytochalasin D and AG490 completely inhibited T cell shape change at all concentrations tested (Supplementary Fig. S1a, top graph). Other compounds, such as Ro-31-8220 or UCN-01, inhibited anti-LFA-1-mediated shape change, but inhibition was mainly observed at the highest concentration of pharmacological inhibitor used (Supplementary Fig. S1a, top graph). The effect of staurosporine on T cell polarization was varied—although 100 nM staurosporine caused cell rounding, 33 nM staurosporine actually enhanced anti-LFA-1-mediated shape change (Supplementary Fig. S1a, top graph). Other inhibitors such as MG132, paclitaxel, genistein, rottlerin, or okadaic acid had minimal or no effect on anti-LFA-1-mediated T lymphocyte shape changes as measured with this parameter (Supplementary Fig. S1a, top graph). Interestingly, H-89 or brefeldin A potentiated anti-LFA-1-mediated shape changes (Supplementary Fig. S1b).
We noted that the ability of certain pharmacological compounds to modulate 1/(form factor) was dependent on whether morphology was quantified using F-actin or α-tubulin intracellular staining. For example, whereas 33-nM staurosporine (median concentration) increased 1/(form factor) when F-actin staining was used for morphological analysis (Supplementary Fig. S1a, top graph), a loss in 1/(form factor) was observed when α-tubulin staining was used for morphological analysis (Supplementary Fig. S1a, lower graph). This implied that certain pharmacological inhibitors may differentially affect cytoskeletal components in T lymphocytes. To investigate these pharmacological inhibitor-induced changes in F-actin or α-tubulin-based morphologies more closely, we displayed the data for each pharmacological treatment pictorially as a heat map and used a continuous coloring method with 3 major colors ( Fig. 2 ). For the majority of pharmacological inhibitors tested, a change in 1/(form factor) was observed when analysis was based on either F-actin or α-tubulin staining (e.g., Go6976 or H89; Fig. 2 ). For certain pharmacological inhibitors such as okadaic acid or genistein, however, the highest concentrations of these compounds did not affect 1/(form factor) when analysis was based on F-actin staining; however, a 94% reduction and 50% reduction in 1/(form factor) was observed for each of these inhibitors, respectively, when analysis was based on α-tubulin staining ( Fig. 2 ). Visual analysis of the effects of okadaic acid or genistein on anti-LFA-1-mediated polarization revealed that the F-actin cytoskeleton was distributed near the cell boundary and was also observed to be highly concentrated in lamellipodia that protruded from the cells, giving a strikingly distinct F-actin-rich/α-tubulin-poor “starry” or “spiky” appearance. Quantification of cellular morphology using more than one intracellular stain therefore demonstrates increased likelihood of detecting key cell shape changes when compared to a single intracellular stain alone.
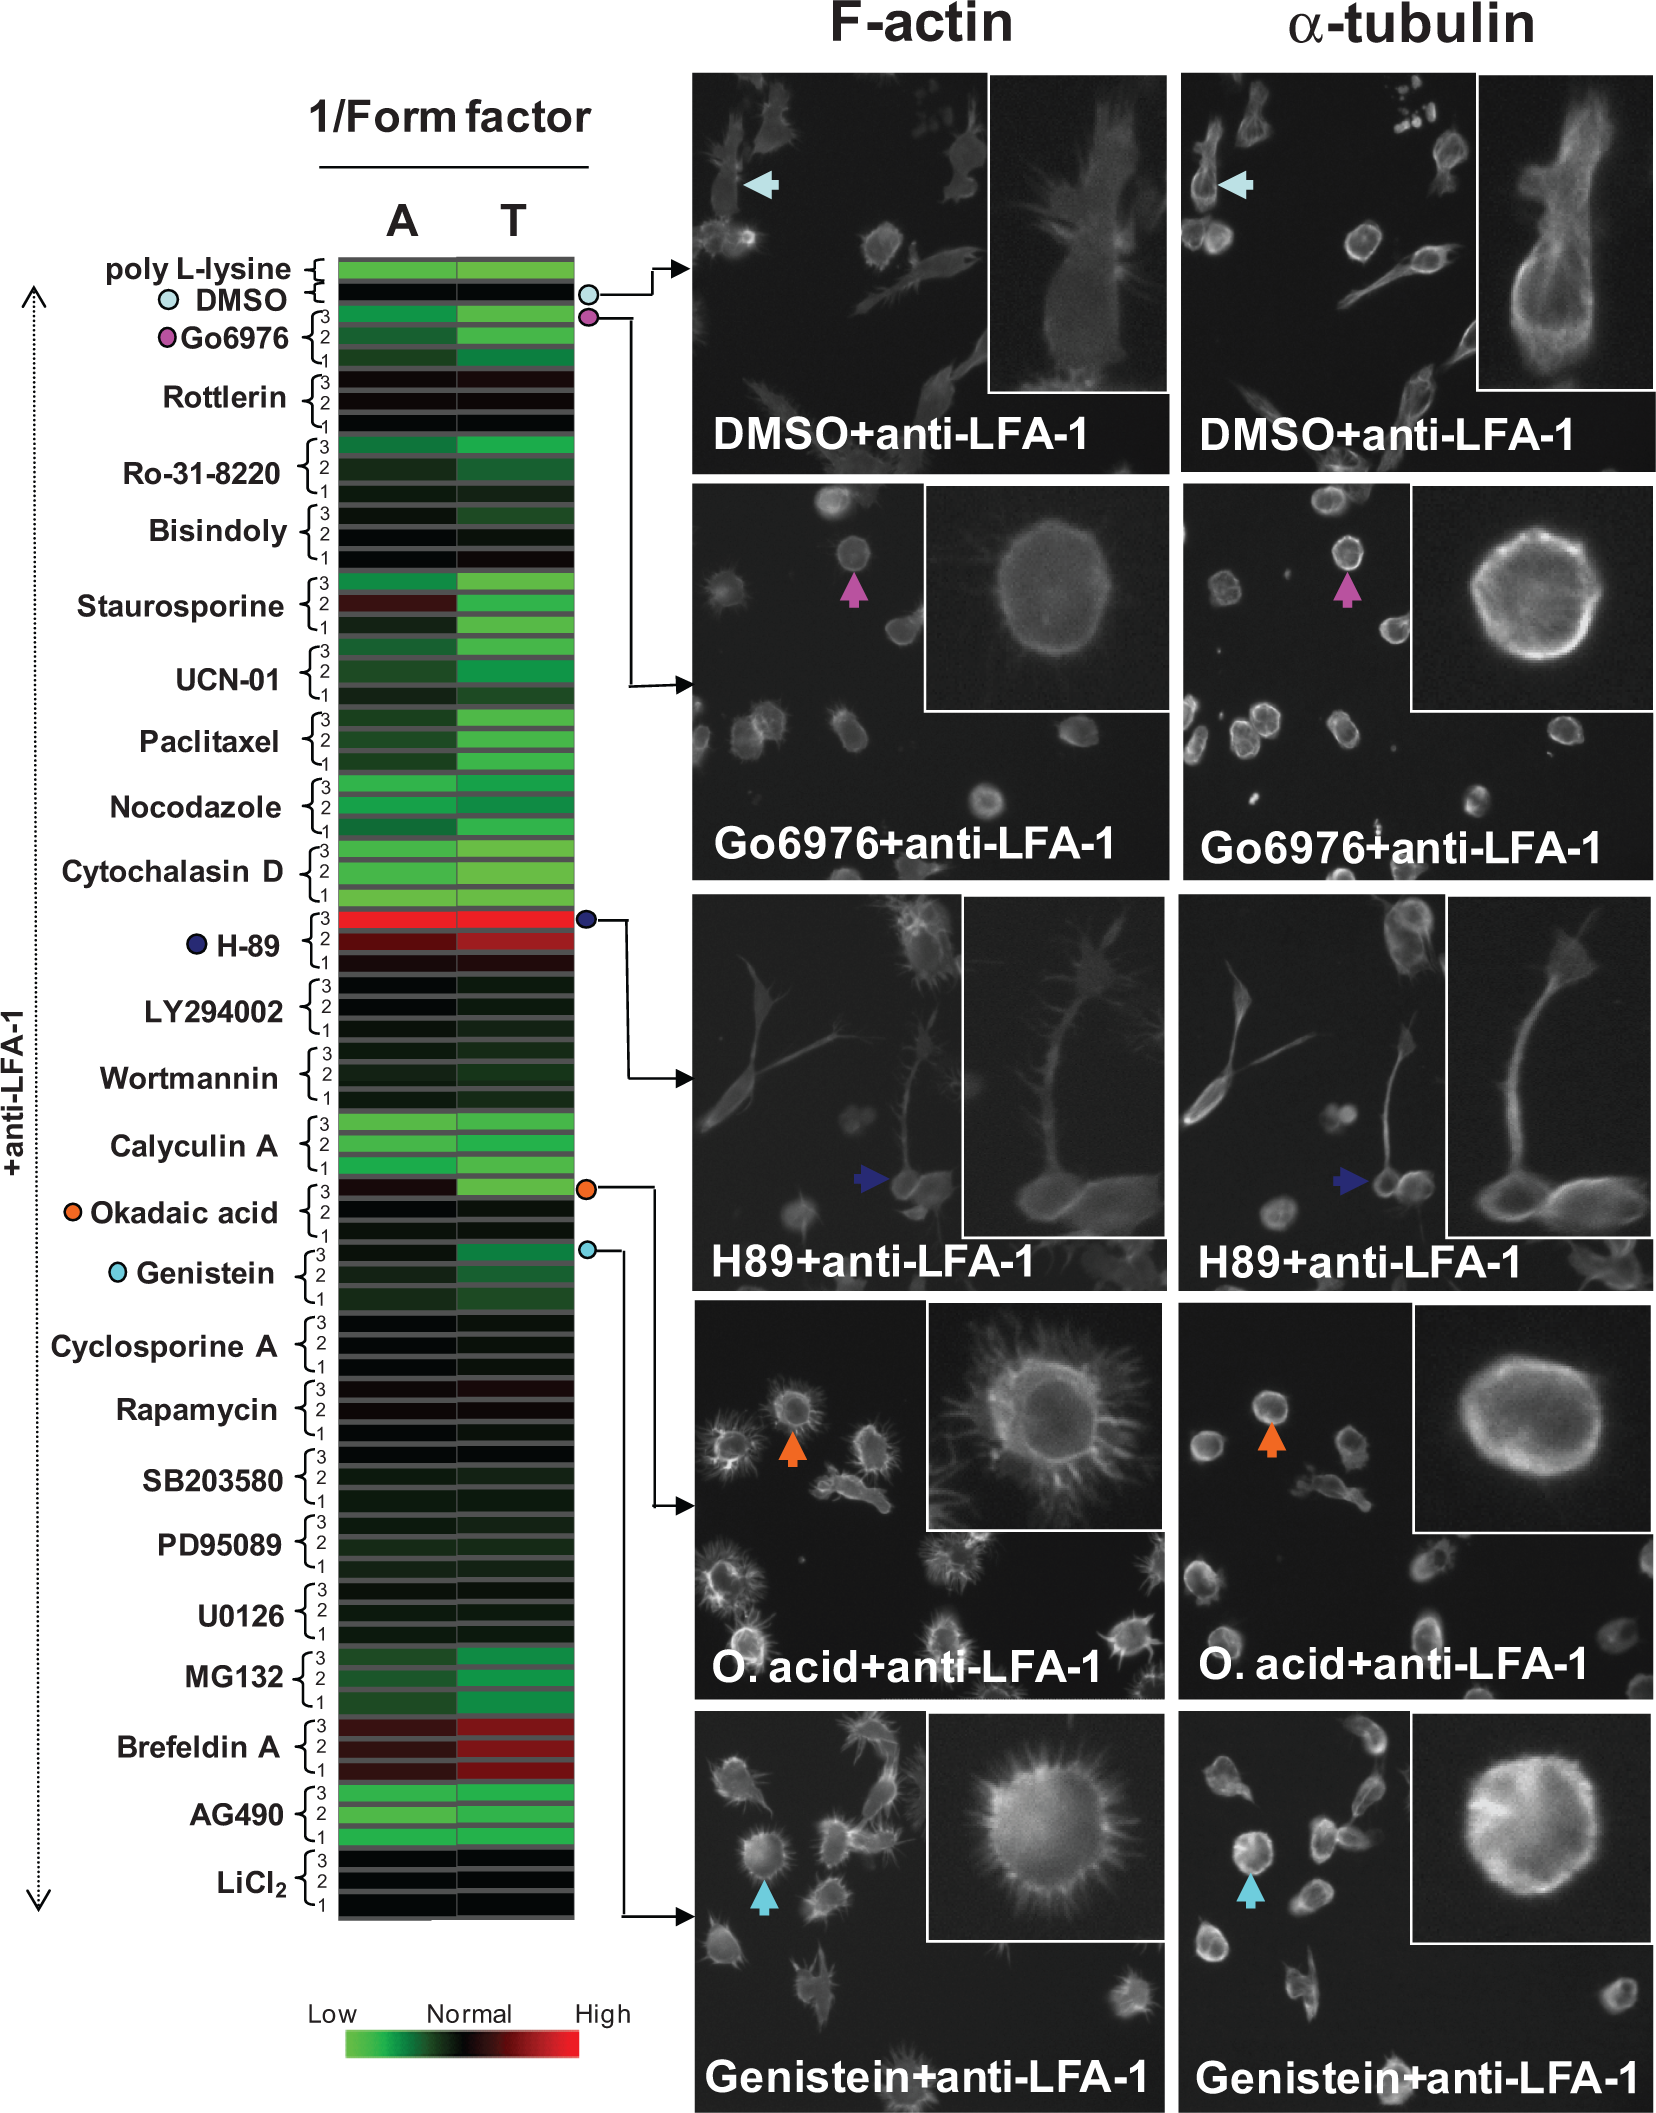
Quantification of cellular morphology using more than one intracellular stain demonstrates increased sensitivity in detecting cell shape changes. HuT-78 T lymphocytes were pretreated with the indicated pharmacological inhibitors or DMSO control for 30 min prior to stimulation with anti-LFA-1. Migration, subsequent cell staining for F-actin/α-tubulin, and image analysis were carried out as previously described. The numbers 3, 2, and 1 correspond to the highest, middle, and lowest concentration of pharmacological inhibitor used, respectively. Morphological analysis was quantified using 1/(form factor) and was based on F-actin (A) or α-tubulin (T) staining. All morphological data were normalized with respect to normal migration control data (i.e., DMSO pretreatment plus anti-LFA-1 stimulation). The normal migrating cell baseline position is represented in black. Pharmacological inhibitors that decrease a particular morphological parameter relative to normal migrating cells are represented in shades of green, whereas parameters that increase in value following pharmacological inhibition are shown in red. Examples of the effects of some pharmacological inhibitors on lymphocyte morphology are shown on the right-hand side. The arrows depict cells that are magnified in the inset images.
A number of other morphological parameters were used to quantify the effects of pharmacological inhibitors on anti- LFA-1-mediated shape and polarization of the cells. These parameters that describe cell shape included cell area, cell gyration radius, ratio of cell/nucleus area, and nuclear displacement ( Table 1 ). For example, the nuclear displacement parameter describes the position of the nucleus of the cell in relation to the cell body center. The relatively large nucleus that is typical of lymphocytes is usually positioned in the cell body center in nonpolarized cells and therefore has a low nuclear displacement value. In polarized lymphocytes, however, the nucleus is usually positioned toward the leading edge of the cell and away from the cell body center, thereby resulting in an increase in nuclear displacement. Significant increases in all 4 parameters were observed in anti-LFA-1-stimulated HuT-78 T lymphocytes compared to poly L-lysine-treated cells when morphological analysis was based on F-actin or α-tubulin staining ( Table 1 ). It was observed for many of the pharmacological inhibitors tested that cell area, cell gyration radius, cell/nuclear area, and nuclear displacement data displayed the same trend as the 1/(form factor) parameter, irrespective of whether morphological analysis was based on F-actin or α-tubulin staining (e.g., Go6976; Fig. 3 ). Using these additional morphological parameters, however, did reveal novel effects of certain pharmacological compounds on lymphocyte morphology that were undetected using the 1/(form factor) parameter, especially when morphological analysis was based on F-actin staining. For example, although the highest concentrations of okadaic acid or genistein had no affect on 1/(form factor) (based on F-actin staining), both of these compounds reduced cell area, cell gyration, and nuclear displacement to varying extents ( Fig. 3 —orange and turquoise rectangles). In addition, we determined that the nuclear displacement parameter highlighted key changes in lymphocyte morphology over and above those that were observed using 1/(form factor). For example, MG132 treatment resulted in a 29% loss in 1/(form factor) when morphological analysis was based on F-actin staining, and this corresponded with a 90% loss in nuclear displacement ( Fig. 3 —pink rectangle). Similarly, MG132 treatment resulted in a 53% loss in 1/(form factor) when morphological analysis was based on α-tubulin staining, and this corresponded with an 83% loss in nuclear displacement ( Fig. 3 —pink rectangle). Analysis of MG132-treated cells demonstrated loss of polarity but not complete cell rounding (data not shown). Multiparametric analysis of different intracellular stains therefore demonstrates increased sensitivity in identifying key cell shape changes when compared to single parametric analysis.
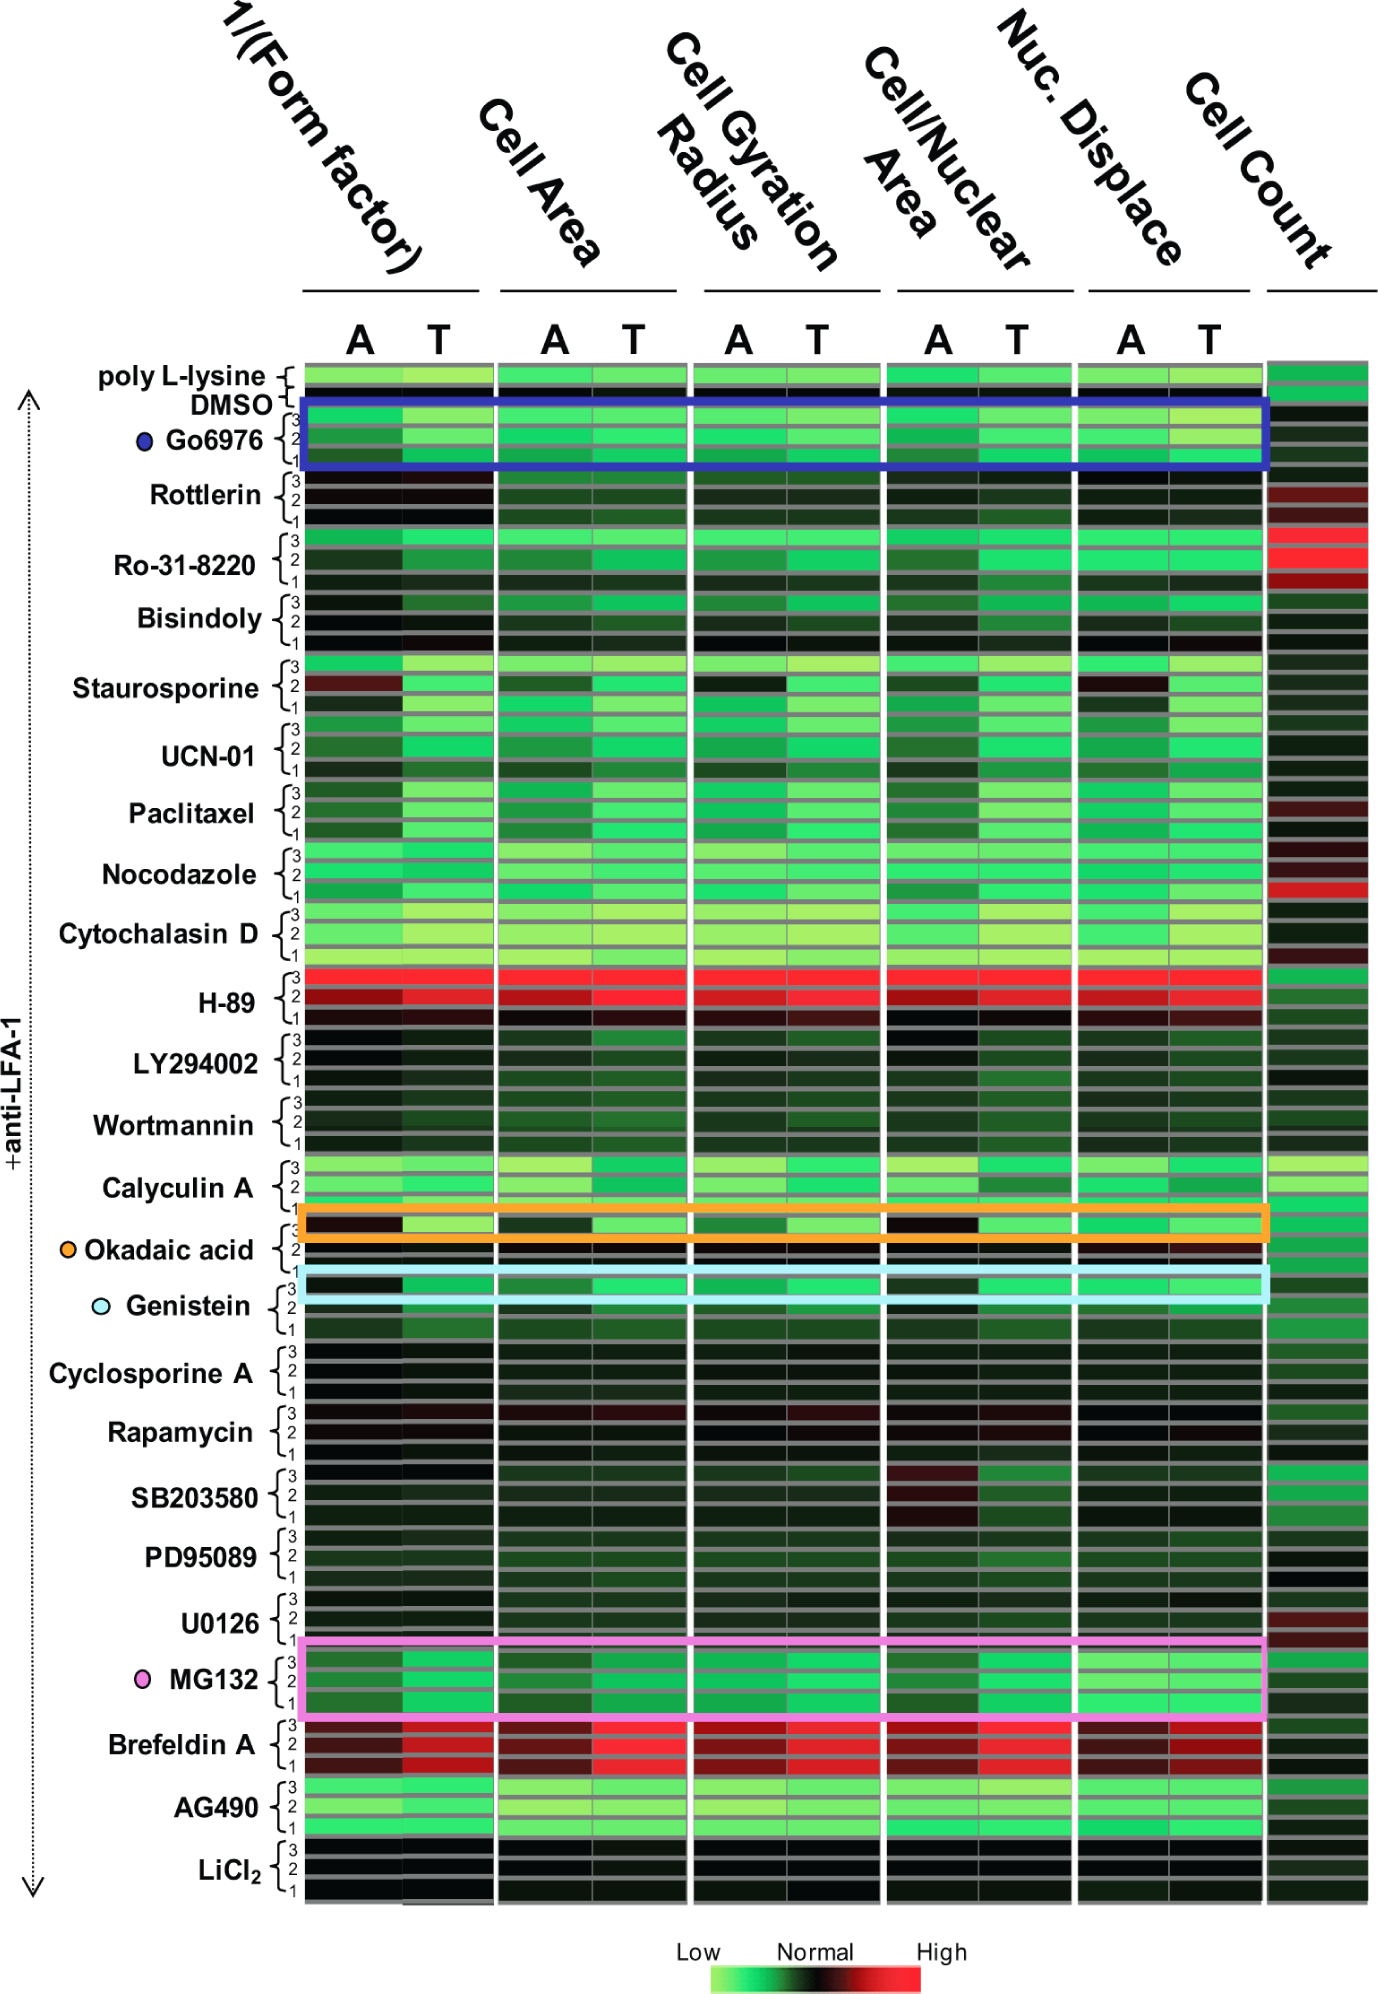
Multiparametric analysis of anti-LFA-1-mediated HuT-78 T lymphocyte polarization reveals novel effects of pharmacological inhibitors on lymphocyte morphology. HuT-78 T lymphocytes were pretreated with the indicated pharmacological inhibitors or DMSO control for 30 min prior to stimulation with anti-LFA-1. Migration, subsequent cell staining for F-actin/α-tubulin, and image analysis were carried out as previously described. The numbers 3, 2, and 1 correspond to the highest, middle, and lowest concentration of pharmacological inhibitor used, respectively. Morphological analysis was quantified using the indicated parameters and was based on F-actin (A) or α-tubulin (T) staining. All morphological data were normalized with respect to normal migration control data (i.e., DMSO pretreatment plus anti-LFA-1 stimulation). The normal migrating cell baseline position is represented in black. Pharmacological inhibitors that decrease a particular morphological parameter relative to normal migrating cells are represented in shades of green, whereas parameters that increase in value following pharmacological inhibition are shown in red. Examples of the effects of some pharmacological inhibitors on lymphocyte morphology are shown as colored rectangles.
Total cell number measurements were also included in the analysis to quantify the effect of these pharmacological inhibitors on cell adhesion ( Fig. 3 ). Treatment of HuT-78 T lymphocytes with the panel of pharmacological inhibitors affected cell adhesion to the anti-LFA-1 antibody to varying extents. In particular, it was noted that calyculin A abrogated cell adhesion to the anti-LFA-1 substrate. This pharmacological inhibitor had no effect on lymphocyte viability, however; the few remaining adherent lymphocytes and those that detached from the substrate were viable (data not shown). Combining multiple parameters in heat map form therefore shows improved sensitivity in determining key morphology changes and permits these changes (including cell adhesion measurements) to be easily inferred from the data.
Effect of pharmacological inhibitors on the fluorescence intensity and intracellular distribution of the F-actin and α-tubulin cytoskeleton in T lymphocytes
We also examined the effect of pharmacological inhibitor treatment on the fluorescence intensity and intracellular distribution of the F-actin and α-tubulin cytoskeleton in T lymphocytes stimulated with anti-LFA-1. The definitions of these parameters are defined in Table 2 . These pharmacological inhibitors allowed us to determine fluorescence intensity/distribution parameters that were most informative in our LFA-1-stimulated T lymphocyte morphology assay. For example, cytoplasm intensity, nuclear intensity, and intensity (N + C) parameters were not informative in our lymphocyte morphology assay, as we observed a decrease in both the F-actin and α-tubulin values following stimulation with anti-LFA-1 ( Table 2 ). These decreases in fluorescence intensity are probably due to the fact that cell area greatly increases as the lymphocytes polarize, resulting in a reduction in the average fluorescence intensity and thus limiting the value of these parameters in distinguishing between real changes in target protein fluorescence and apparent changes due to changes in cell area. However, the IxA (N + C) parameter takes into consideration any changes in cell area. Although we also observed a decrease in the IxA (N + C) fluorescence intensity of both F-actin and α-tubulin following anti-LFA-1 stimulation ( Table 2 ), we found that this parameter was suitable for measuring fluorescence intensity of cytoskeletal components in polarized T lymphocytes. For example, pretreating cells with cytochalasin D (an inhibitor that depolymerizes the F-actin cytoskeleton), prior to stimulation with anti-LFA-1, resulted in a loss in the fluorescence intensity of F-actin (25% reduction compared to cells treated with DMSO and anti-LFA-1; Supplementary Fig. S2). Cytochalasin D had no effect on the fluorescence intensity of α-tubulin. This result was expected as cytochalasin D should reduce F-actin content (and therefore reduce phalloidin-TRITC binding) in the cell.
Other informative parameters were intensity spreading and intensity CV ( Table 2 ). Intensity spreading is a parameter that estimates the extent of fluorescence intensity near the boundary of the cell. Intensity CV is a parameter that describes the coefficient of variation of the fluorescence intensity of pixels within the cytoplasm. For instance, an even distribution of F-actin staining would give a low intensity CV, whereas formation of speckles or discrete F-actin structures would increase the value of this measurement. As an example of the usefulness of these parameters, we observed that treating cells with Ro-31-8220 (highest concentration), nocodazole, or AG490 prior to stimulation with anti-LFA-1 resulted in a loss in intensity spreading in comparison to cells pretreated with DMSO and anti-LFA-1 (Supplementary Fig. S3 and Fig. 4 ). Furthermore, this loss in intensity spreading was more pronounced for the F-actin cytoskeleton in comparison to the α-tubulin cytoskeleton. This implied a specific loss in F-actin staining near the cell boundary. At the same time, these same pharmacological treatments prior to stimulation with anti-LFA-1 resulted in an increase in intensity CV compared to DMSO-treated cells on anti-LFA-1 (Supplementary Fig. S4 and Fig. 4 ). Again, this increase in intensity CV was more pronounced for the F-actin cytoskeleton in comparison to the α-tubulin cytoskeleton. Visual inspection of these treatments revealed that the F-actin cytoskeleton was often found to be concentrated in large spots inside the cell (Supplementary Figs. S3-S4 and Fig. 4 ). Although Ro-31-8220, nocodazole, and AG490 appeared to affect the F-actin cytoskeleton more so than the α-tubulin cytoskeleton, other compounds such as paclitaxel (a drug that stabilizes the microtubule cytoskeleton) affected intensity spreading and intensity CV in a manner that was more specific for α-tubulin (Supplementary Figs. S3-S4). Again, this example highlights the usefulness of these parameters in detecting key changes in cytoskeletal fluorescence intensity ((IxA(N + C)), localization (intensity spreading), and homogeneity of staining (intensity CV).
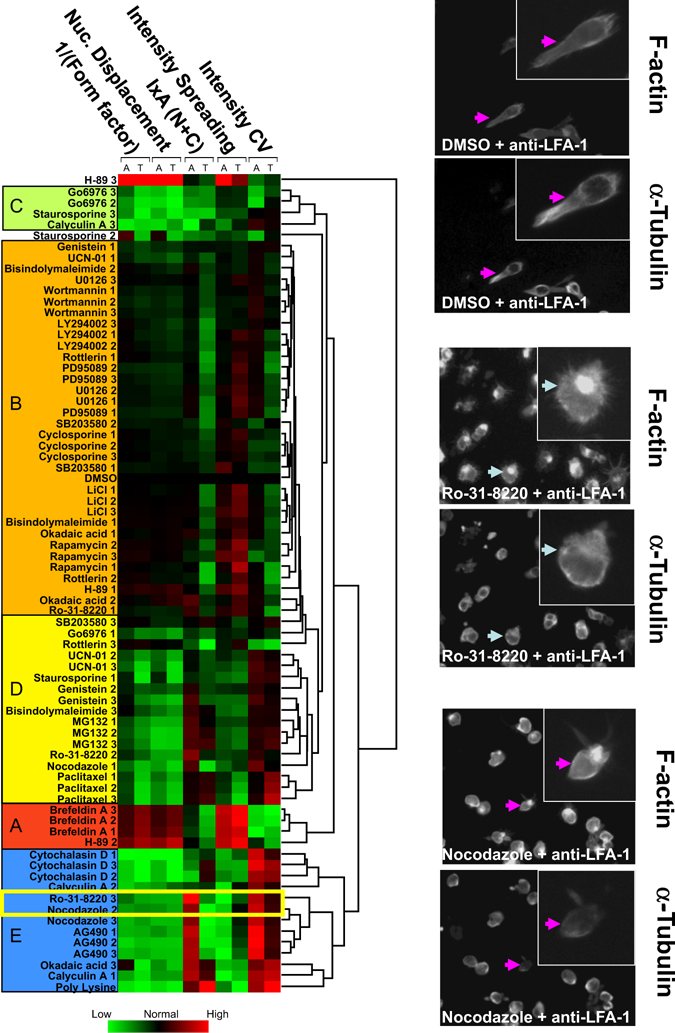
Clustering of a HuT-78 T lymphocyte morphological and fluorescence intensity distribution profile heat map following pharmacological inhibition of anti-LFA-1 stimulation reveals 5 major subgroups. HuT-78 T lymphocytes were pretreated with the indicated pharmacological inhibitors for 30 min prior to stimulation with anti-LFA-1. Migration, subsequent cell staining for F-actin/α-tubulin, and image analysis were carried out as previously described. Values for 5 morphology and fluorescence intensity/distribution parameter pairs, each comprising measurements from F-actin (A) and α-tubulin (T) staining, were normalized using a robust Z score, and a hierarchical clustering was performed as described in Materials and Methods. The numbers 3, 2, and 1 correspond to the highest, middle, and lowest concentration of pharmacological inhibitor used, respectively. The dendrogram on the right indicates the relationships between the clustered profiles. We identified 5 major subgroups (A-E) following clustering, and these are shown as colored boxes on the left-hand side of the heat map. These 5 major lymphocyte subgroups are defined in Table 3 . An example of how to read a morphological and fluorescence intensity profile is highlighted by Ro-31-8220 and nocodazole (enclosed by rectangle). Ro-31-8220 and nocodazole resulted in a loss in morphology (decreased 1/(form factor) and nuclear displacement). This was accompanied by a net increase in the fluorescence intensity of F-actin in the cell, whereas the fluorescence intensity of α-tubulin was slightly reduced. A loss in intensity spreading and increase in cell intensity coefficient of variation (CV) that was specific for F-actin (and not α-tubulin) was also detected. Images representing DMSO control, Ro-31-8220, and nocodazole pretreated cells on anti-LFA-1 are shown.
Generation of a morphological and fluorescence intensity/distribution profile of T lymphocytes stimulated with anti-LFA-1
We combined relevant morphology parameters ((1/(form factor) and nuclear displacement) and fluorescence intensity/distribution parameters (IxA (N + C), intensity spreading, and intensity CV) to generate a morphological and fluorescence intensity/distribution profile for each pharmacological treatment and concentration. These profiles were then grouped by hierarchical clustering and visualized in a heat map ( Fig. 4 and Table 3 ). The dendrogram in Figure 4 demonstrates the relationship between these clustered profiles. If the profiles are capable of describing cell shapes and cytoskeletal distribution accurately, then clustering using these parameters should group similar cell shapes together. Indeed, we observed in many cases that different concentrations of the same pharmacological inhibitor were found to cluster together (e.g., cytochalasin D–treated cells; Fig. 4 ). This indicates that the parameters chosen can accurately describe similar cell shapes and yet distinguish them from others. In addition, different types of pharmacological inhibitor were found to cluster together. As an example, nocodazole and cytochalasin D–treated T lymphocytes grouped together, whereas paclitaxel-treated T lymphocytes more closely resembled lymphocytes that were treated with MG132. We broadly identified 5 morphological and fluorescence intensity/distribution subgroups following clustering, and these are shown as colored boxes on the left-hand side of the heat map ( Fig. 4 ) and summarized in Table 3 . An example of how to read a morphological and fluorescence intensity profile is highlighted by Ro-31-8220 and nocodazole in Figure 4 .
Classification of the Major Morphological and Fluorescence Intensity Profile Subtypes in HuT-78 T Lymphocytes
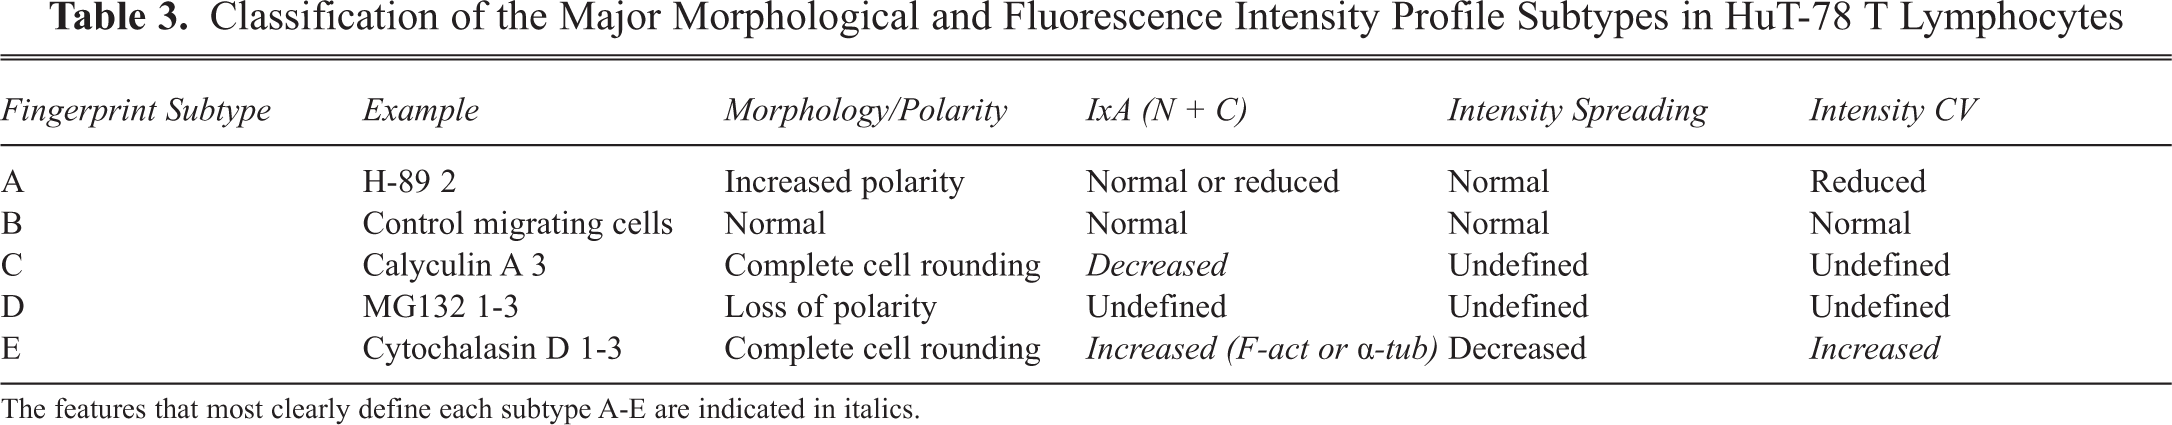
The features that most clearly define each subtype A-E are indicated in italics.
We also wished to examine how the pharmacological profile of lymphocytes triggered to polarize with anti-LFA-1 differed from cells stimulated to polarize with other ligands. To do so, we also obtained morphology and fluorescence intensity distribution profiles for lymphocytes that were challenged with the same panel of pharmacological inhibitors and then stimulated with ICAM-1 and anti-CD44. We compared these profiles with lymphocytes stimulated with anti-LFA-1 ( Fig. 5 ). We observed that the morphological and fluorescence intensity profile of lymphocytes stimulated with ICAM-1 closely resembled cells that were stimulated with anti-LFA-1; this similarity in morphology and fluorescence intensity highlighted the robustness of the assay and also validated using stimulatory antibodies to mimic the ICAM-1 signal. Interestingly, we noted both similarities and also notable differences in sensitivity to the inhibitors following stimulation with anti-LFA-1 and anti-CD44 ( Fig. 5 ). Analysis of lymphocyte morphology in particular revealed that certain pharmacological inhibitors such as nocodazole, cytochalasin D, and paclitaxel inhibited lymphocyte polarization to similar extents in cells stimulated with anti-CD44 and anti-LFA-1 ( Fig. 5 , box A). In contrast, whereas pretreating HuT-78 T cells with rottlerin did not affect anti-LFA-1-mediated shape change, these same concentrations increased anti-CD44-mediated shape change (and in particular the 1/(form factor) parameter; Fig. 5 , box B). Similarly, whereas different concentrations of Ro-31-8220 either had no effect or reduced anti-LFA-1-mediated shape change, these same concentrations induced a different morphological phenotype in T lymphocytes stimulated with anti-CD44, with increased 1/(form factor) values typically observed ( Fig. 5 , box B). This morphological and fluorescence intensity profiling assay is therefore capable of detecting key changes in lymphocyte morphology in a stimulus-specific manner and can be used to investigate the signaling pathways that are regulated downstream of integrin/adhesion receptors in lymphocytes.
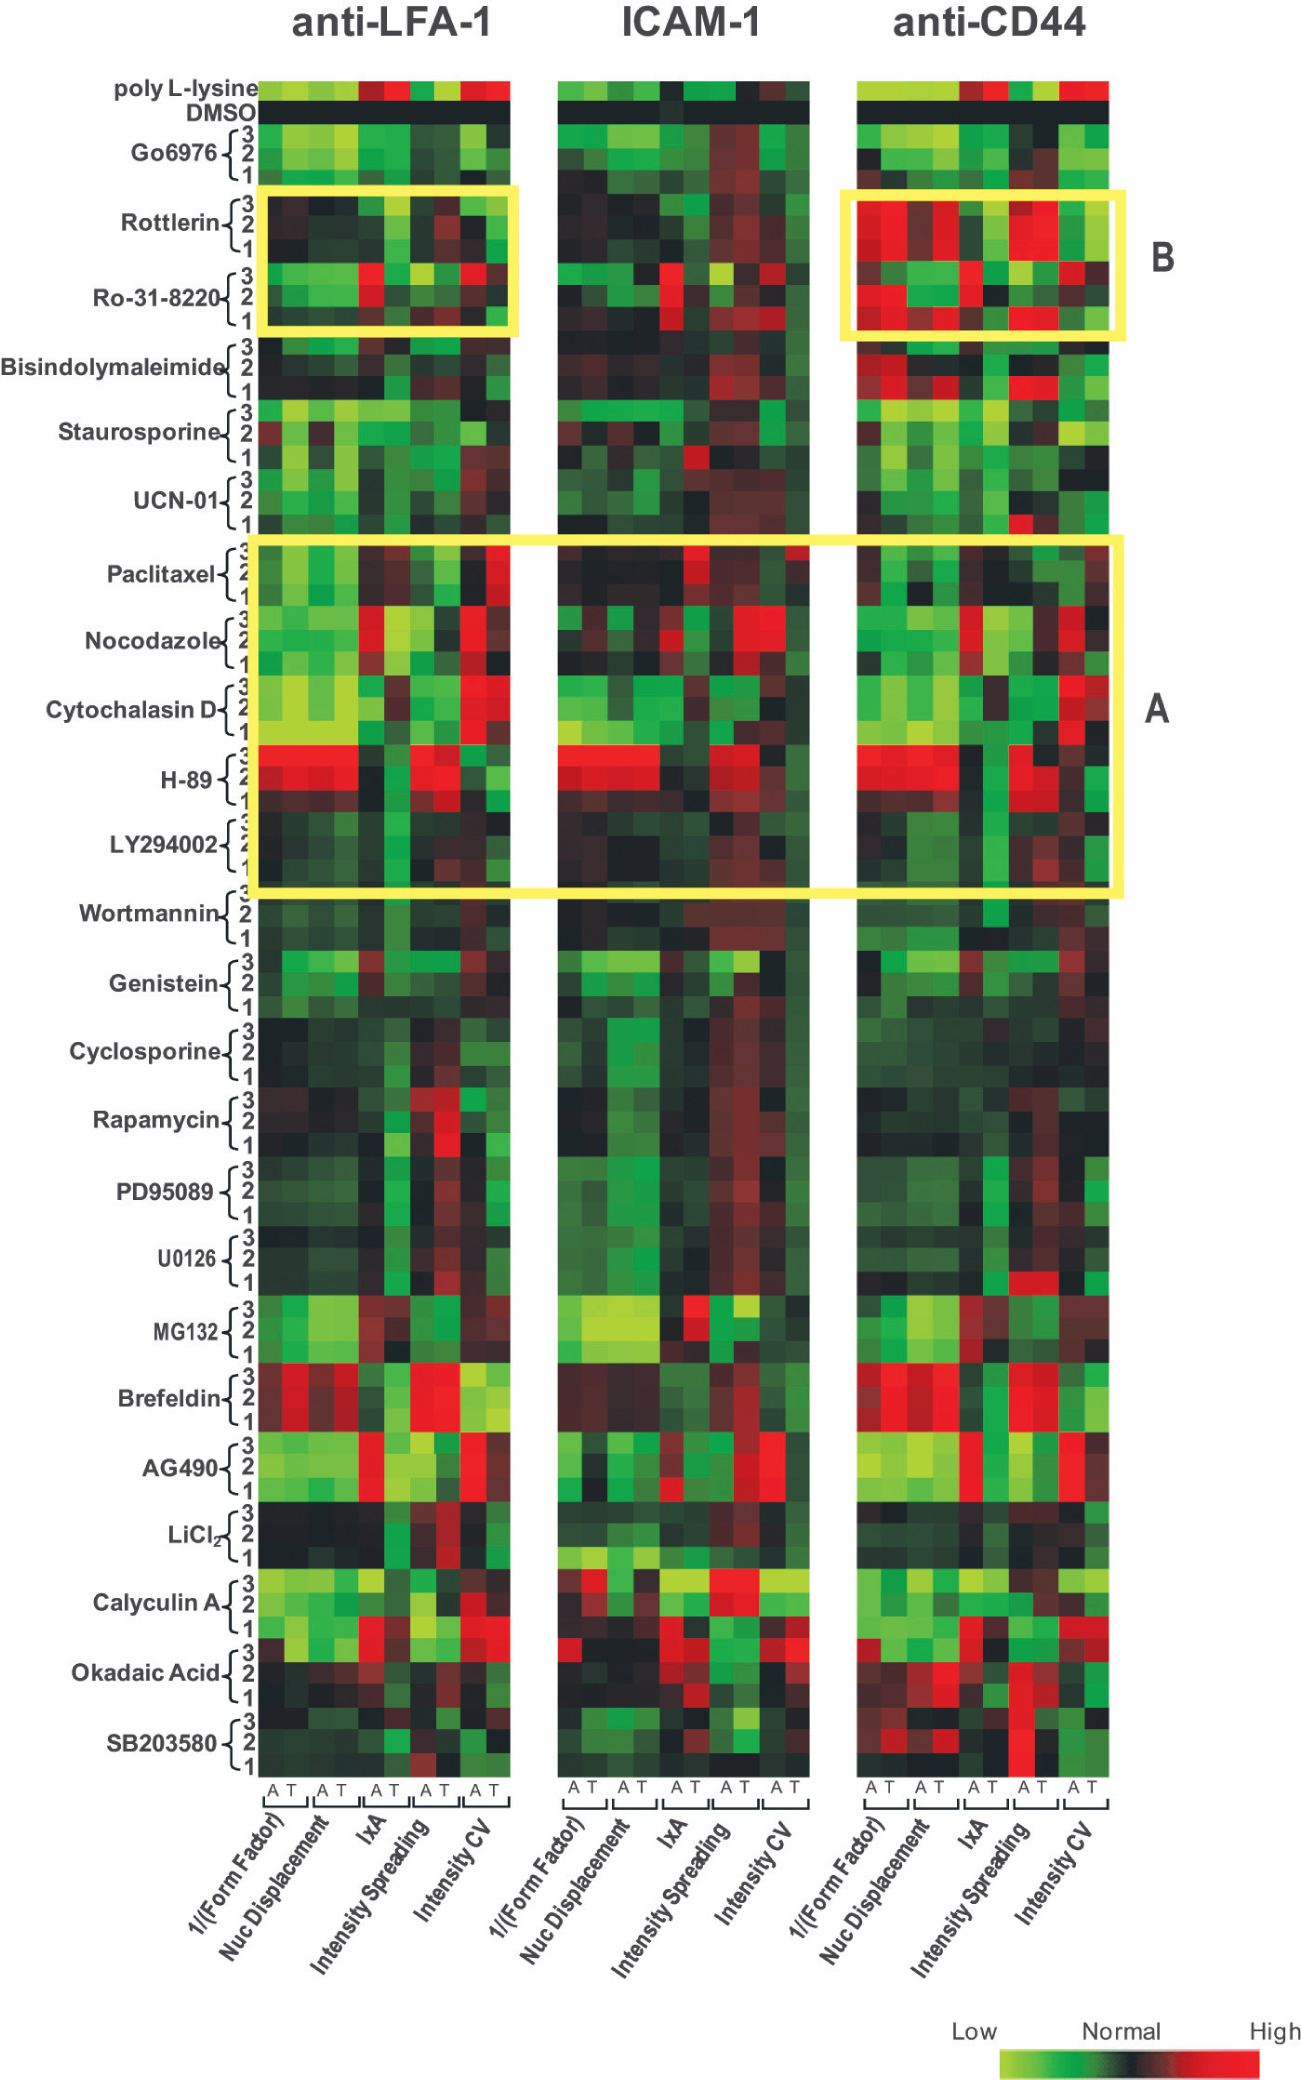
Pharmacological profiling of T lymphocytes stimulated with anti-LFA-1 and anti-CD44 reveals differences in their sensitivity to inhibitors. HuT-78 T lymphocytes were pretreated with the indicated pharmacological inhibitors for 30 min prior to stimulation with anti-LFA-1, ICAM-1, or anti-CD44. Migration, subsequent cell staining for F-actin/α-tubulin, and image analysis were carried out as previously described. Values for 5 parameter pairs, each comprising measurements from F-actin/α-tubulin staining, were normalized using a robust Z score. Heat maps were generated for each data set. F-actin and α-tubulin parameters are indicated as A and T on the heat map. Values for the DMSO control are colored black, whereas increased values are red and decreased values are green. The yellow rectangles highlight drug treatments that (A) show no change or (B) show significantly different effects between cells stimulated with anti-LFA-1 and anti-CD44, respectively.
Multiple parameters allow increased sensitivity in identifying hits and distinguishing between different cell shapes
For complex HCA screens, an ideal image analysis procedure should have 2 qualities. Primarily, it should be able to identify hits by “recognizing” wells where cells appear different from controls—namely, hit identification. In addition, it can be invaluable in follow-up studies if the image analysis procedure can discriminate between hits and group them on the basis of their appearance—namely, hit clustering. We wished to evaluate how much of an improvement all of our parameters combined together gave in comparison with the 1/(form factor) parameter alone for hit identification and hit clustering. In an HCA drug or RNAi screen, hit identification is routinely carried out by selecting all treatments that result in a score greater than a predetermined threshold such as a multiple of standard deviations (× SD) from control values. 15 A sensitive readout is invaluable to maximize the real hits identified. We compared the 1/(form factor) parameter pair with all parameters combined for the ability to identify hits at increasing significance thresholds from 2-6 × SD from the control ( Fig. 6A ). We defined a hit as any treatment that exceeded the threshold for any of the parameters examined. For instance, 19 drug treatments gave a Z score exceeding 3 × SD from the control as flagged by either of the 1/(form factor) parameter pair. This hit number decreased steadily as the threshold increased. When all of the parameters were combined, 36 hits were detected using a threshold of 3 × SD, and this decreased to 20 at the extremely stringent threshold of 6 × SD ( Fig. 6A ). Even at this threshold, the combined parameter profile is more sensitive than 1/(form factor) at 3 × SD. Thus, combination of our parameters significantly improves the sensitivity of hit detection.
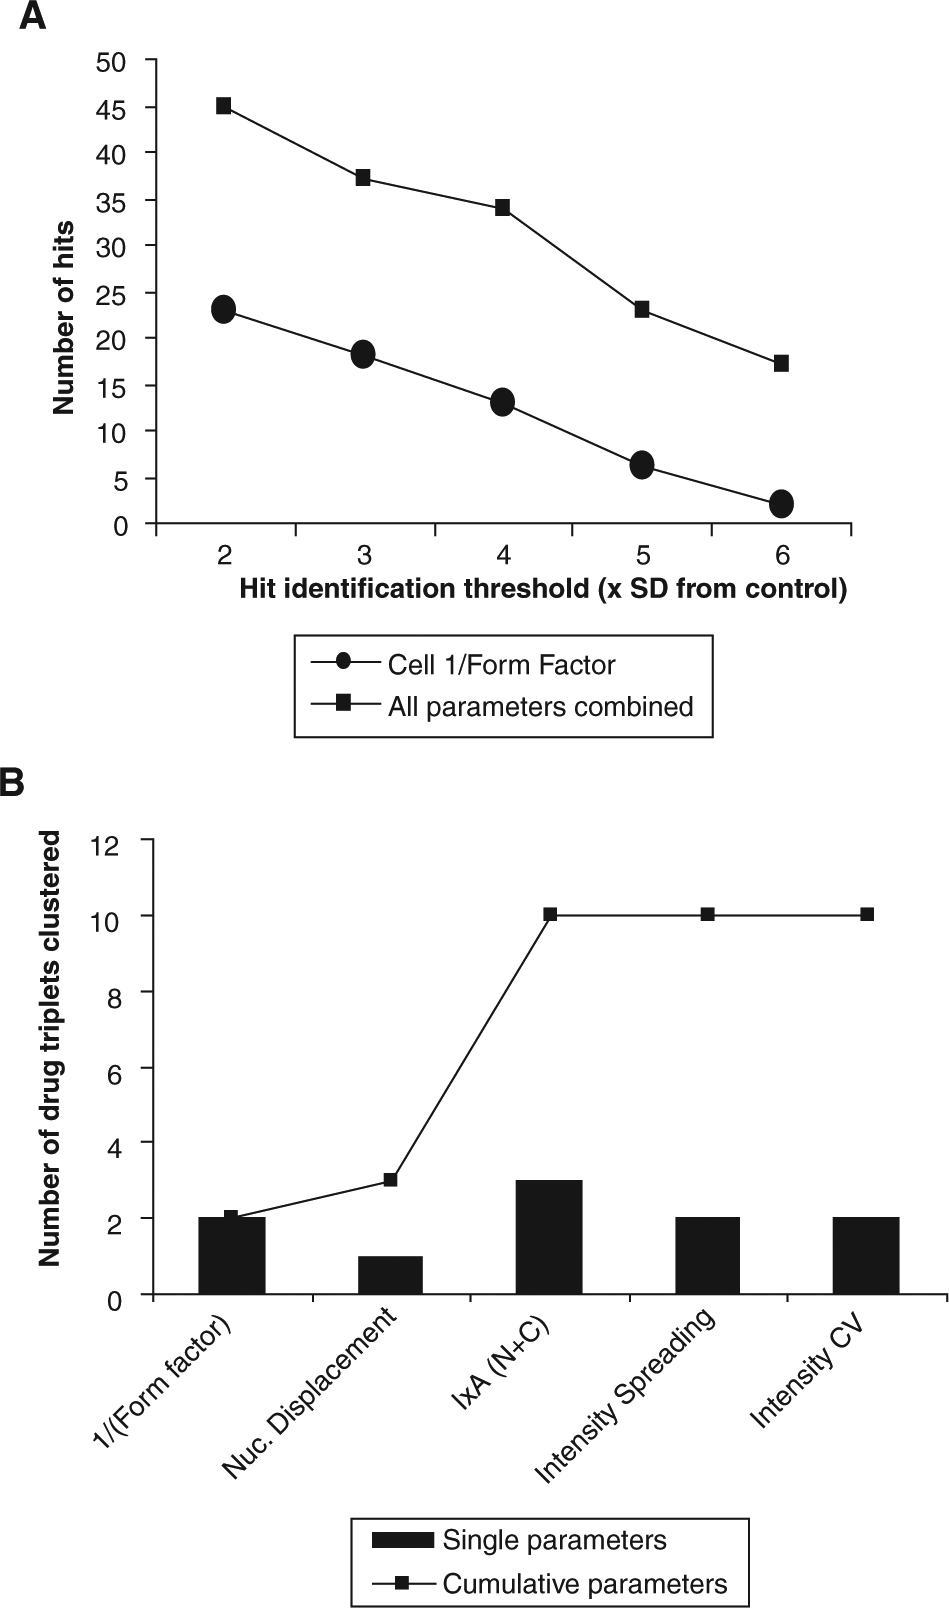
Using multiple parameters increases the sensitivity of hit identification and morphology discrimination. (
Then we examined the ability of the parameters to allow grouping of demonstrably similar cell shapes, which we propose is a measure of how well the parameter profile describes a specific cell morphology and groups similar hits together. To do this, we used the observation in Figure 4 that when all of the parameters are used in a clustering procedure, in many cases different concentrations of the same drug clustered together in contiguous “triplets.” We used the number of triplets as a measure of clustering efficacy to compare the clustering efficiency of individual parameters versus combinations of parameters ( Fig. 6B ). When any single parameter pair (using F-actin and α-tubulin staining) was used to cluster the data and the triplets counted ( Fig. 6B ), 1 to 3 drug triplets were observed, indicating that each individual parameter pair is relatively poor at distinguishing specific cell morphologies. When cumulative combinations of the parameter pairs were clustered, the discrimination power of the profile incrementally improved. For example, 1/(form factor) clustering gave 2 triplets, and this increased to 3 triplets when in combination with nuclear displacement. The further inclusion of IxA (N + C) again improved the clustering capability, with 10 drug triplets clustering together. Using a predefined multiparameter analysis procedure therefore improves both cell shape discrimination and hit identification sensitivity when compared with individual parameters.
Discussion
In this study, we used an image-based HCA technology platform and a panel of 24 pharmacological inhibitors to analyze the morphology and fluorescence intensity/distribution of the F-actin and α-tubulin cytoskeleton in T lymphocytes stimulated through LFA-1 or CD44. Use of such a panel of pharmacological inhibitors allowed us to define a key set of morphological and fluorescence intensity parameters that provided rapid, accurate, and quantitative effects of pharmacological inhibitors on cytoskeletal-mediated lymphocyte polarity to be evaluated. In particular, we determined that morphological analysis that was based on more than one cytoskeletal stain resulted in increased sensitivity in detecting key cell shape changes compared with a single cytoskeletal stain (e.g., genistein and okadaic acid–treated cells; Fig. 2 ). This demonstrates that using more than one intracellular stain results in improved ability to discriminate morphological behavior. An example of multiparametric analysis was demonstrated with the proteosomal inhibitor MG132. Although pretreatment of HuT-78 T lymphocytes with MG132 only modestly reduced 1/(form factor), inhibition of the proteasome resulted in a much larger decrease in the nuclear displacement parameter ( Fig. 3 ). It is possible that MG132 interferes with lymphocyte polarization via blocking LFA-1 receptor internalization, as it has been shown in B lymphocytes that inhibition of the proteasome blocks CXCL8-induced internalization of CXCR1/2 receptors and chemotaxis. 16 Multiparametric analysis therefore increases the sensitivity and confidence in detecting effects of different treatments on lymphocyte morphology, which may have otherwise been missed using single parametric analysis.
We also defined a key number of fluorescence intensity/distribution parameters that provided valuable information on the intracellular distribution of the F-actin and α-tubulin cytoskeleton in T lymphocytes. When combined with morphological parameters, these fluorescence intensity distribution parameters may permit dissection of cytoskeletal components that are perturbed as a consequence of inhibition of signaling pathways. As an example, pretreatment of HuT-78 T lymphocytes with Ro-31-8220 or nocodazole prior to anti-LFA-1 stimulation resulted in a loss in 1/(form factor) and nuclear displacement, indicating a loss in cellular polarity ( Fig. 4 ). The IxA (N + C) fluorescence intensity parameter demonstrated a net increase in the fluorescence intensity of F-actin in the cell, whereas the fluorescence intensity of α-tubulin was slightly reduced ( Fig. 4 ). A loss in intensity spreading and an increase in intensity CV that was specific for F-actin (and not α-tubulin) were also detected, suggesting a loss in F-actin staining adjacent to the plasma membrane and a nonhomogeneous staining pattern of F-actin in the cell, respectively ( Fig. 4 ). Visual inspection of Ro-31-8220 and nocodazole pretreated cells verified that the morphological and fluorescence intensity profile generated for this compound was of predictive value; a loss in cellular polarity was observed, and this correlated with the appearance of a bright, F-actin-rich spot in the middle of the cell ( Fig. 4 ). In contrast, the α-tubulin cytoskeleton was predominantly distributed near the plasma membrane. It is tempting to speculate therefore that these pharmacological agents modulate anti-LFA-1-mediated T lymphocyte polarization via selective perturbation of the F-actin cytoskeleton.
We clustered the morphological and fluorescence intensity profiles based on similarity and identified 5 major morphological and fluorescence intensity subtypes for cells stimulated with anti-LFA-1. Such clustering allows one to infer relationships between different treatments on the T lymphocyte polarization process. Our clustering analysis also demonstrated that the morphological and fluorescence intensity profile of lymphocytes stimulated with ICAM-1 closely resembled that of cells stimulated with anti-LFA-1 and therefore validated anti-LFA-1 stimulation as a suitable mimic of ICAM-1 stimulation.
Interestingly, our clustering analysis highlighted similarities and yet notable differences between lymphocytes in their sensitivity to pharmacological inhibitors following stimulation with anti-LFA-1 and anti-CD44, which implies that the signalling pathways that are activated downstream of these receptors are different. For example, we have previously demonstrated that T lymphocytes stimulated through the LFA-1 and CD44 receptors are both sensitive to the classical PKC inhibitor Go6976. 17,18 In contrast, we observed that other pharmacological inhibitors that did not affect anti-LFA-1-mediated polarization increased anti-CD44-mediated polarity (e.g., rottlerin), which highlights the differences in sensitivities of these pathways to pharmacological inhibition.
In general, the approach we have described here has great potential for drug or RNAi screens that involve complicated morphology readouts. To date, most large-scale screens tend to use single readouts because of the difficulty of combining them together in an easily interpretable way. We describe how the combination of a relatively small number of generic morphology and fluorescence intensity parameters and their visualization in heat maps can overcome this problem. By using a parameter profile that corresponds to easily identifiable cell or cytoskeletal morphologies, the heat maps can be quickly scanned for interesting hits. The heat maps can be colored to filter out values that do not reach a cutoff threshold, thus speeding the hit identification process. The parameters we describe allow a high level of discrimination between morphologies, and this permits hits to be grouped together on the basis of similar effects, giving valuable information on potentially common pathway targets. Finally, we demonstrate that using multiple parameters increases the sensitivity of hit selection and allows a statistically more stringent cutoff to be used, in turn potentially helping to filter out false positives.
In summary, we have defined a key number of morphological and fluorescence intensity parameters that can be used to sensitively distinguish phenotypes in the context of T lymphocyte polarisation. We show that a relatively small number of parameters can be used to provide fast, sensitive, and predictive information on diverse lymphocyte morphologies that arise following perturbation of intracellular signaling pathways. Although we have used InCell Morphology 1 software to identify parameters in the context of lymphocyte polarization, similar parameters that are accessible from open-source image analysis software will also have equal value in permitting detection of these morphologies (e.g., CellProfiler, http://www.cellprofiler.org). The identification of key parameters that we have characterized here will have important use in wider based screening strategies such as larger pharmacological libraries or whole-genome RNAi screening studies and therefore may have significant implications for understanding the mechanisms underlying cell migration in inflammatory processes.